Valuing Convenience in Public Transport in the Korean Context
|
|
|
- Arabella Hardy
- 6 years ago
- Views:
Transcription
1 OECD ITF Roundtable on Valuing convenience in public Transport Valuing Convenience in Public Transport in the Korean Context September 13, 2013 Sungwon Lee, Ph.D. Vice President The Korea Transport Institute

2 Contents Ⅰ Ⅱ Ⅲ Ⅳ Valuing Convenience: An Empirical Case Study Seoul s Transport Accomplishments in Public Transport Reforms Discussions
3 I. Valuing Convenience: A Case Study of Seoul 1. Needs for Scientific Transport Policy Intervention 2. Quantitative Policy Impact Analysis 3. Policy Implications
4 1. Needs for Scientific Transport Policy Intervention Huge social costs due to transport: - Congestion cost alone exceeds 27 trillion won annually (about 240 billion US dollars) in Korea We usually know about policy impact directions but not about effectiveness - This requires quantitative policy impacts analysis - Econometric analysis on demand elasticities
5 Materialization Plan of Creative Economy in Transport Logistics Social Costs in Transport Sector Unsafe Traffic Highest level of traffic accident death rate out of OECD (32 nations) death per 10,000 cars in 11 (OECD average death: 1.06 people) Additional social expenses due to annual increase in congestion fee Congested Road Road Traffic that Accelerates Global Warming Increase of Physically Disadvantaged People - Congestion Cost : 25.9 Trillion Won( 07) 26.9 Trillion Won( 08) 27.7 Trillion Won ( 09) Road traffic takes up 94.4% of greenhouse gas emissions in transportation - Transportation Greenhouse Gas Emission in 09년 : million tons CO 2 eq (Road Traffic: million tons) Increase in physically disadvantaged due to entering the aging society million in 11 (24.5%) Expected to increase to approximately million in 16 (25.7%) Decrease in industry competitiveness due to additional logistics expense High Logistics Cost - National Logistics Cost in 09 : Trillion Won (Annual average increase of about 1.26%)
6 2. Quantitative Policy Impact Analysis* Stated preference methodology for impact analysis of hypothetical transport policy measures - Bases for scientific transport policy intervention Econometric testing of transport policy related hypotheses - Perceived vs. real cost of transport *Source: Sungwon Lee et al. (2008)
7 Valuing Convenience Concept and definitions of convenience in public transport - Amenities - Comfort level - Time related attributes: headway, in-vehicle time As people are more and more addicted to private modes of transport, people demand more comforts in public transports Importance of valuing convenience in public transports
8 Table 1. Elasticities of Demand for Urban Transportation Demand Attributes Elasticities Short run Long run Overall Fuel consumption Fuel price Car use Fuel price Car ownership Fuel price * * Car ownership Car price * * Traffic Toll fee * * Demand for bus Bus fare Demand for subway Subway fare Demand for rail Railway fare Mass transit Fuel price * * Car ownership Transit fare * * Note: Short run means usually within a year, and long run means 5 to 10 years. Source: UK Department of Transport
9 SP Methodology and Estimation Results If variables are too numerous and too widely varied impossible to create all the possible sets of SP questionnaires Use fractional factorial plan which analyzes only main effects and guarantee the orthogonality of variables following Kocur et al.(1982) and Hensher(1994) SP design of mode choice between passenger cars and alternative modes of bus and subway Explanatory variables travel expense, travel time, and service levels
10 Table 2. SP Design of Mode Choice between the Alternative Modes Modes Basic mode (private automobile) Alternative mode (bus and subway) Explanatory variables Fuel price (per litter) # of Levels 3 Levels Level 1 Level 2 Level 3 Current level (1,200 won) Increase to 1,500 won Increase to 1,800 won In-vehicle time 3 Current level 20% higher 40% higher Monthly parking fee 3 Current level (150,000 won) 40,000 won higher fare won lower 200 won lower 80,000 won higher Current level (500~1,000won) In-vehicle time 3 40% lower 20% lower Current level Out-vehicle time Congestion (comfortable) 3 50% lower 25% lower Current level 3 No congestion Medium congestion High congestion Note: US $ 1.00 is equivalent to 1,120 Korean Won as of Aug 15, 2013
11 Utility functions Uoricar 1 Fuel 3 Ivt 5 Park U altmode 2 Fare 3 Ivt 4 Ovt 6 Crowd where altmode = bus, subway, bus + subway Surveyed on 662 car users binary choice with multiple levels of attributes 4,228 effective data sets Main purpose of using passenger cars Commuting (71.5%) Business trips (16.4%)
12 Although most variables were statistically significant, fare of mass transit was statistically insignificant car users do not consider fare level as significant since fare is significantly smaller than user expense of a car Positive car dummy prefer car to mass transit Demand elasticity of fuel price is much higher than that of fare level, as fuel expense is far more significant than fare Car users respond to bus fare changes more than subway fare changes
13 Bigger coefficient of out-vehicle time than that of in-vehicle time bigger disutility of waiting than riding Bus users are more sensitive to in-vehicle time than other modes recommend express bus or HOV lanes Estimated coefficient of parking fees is more than two times bigger than that of fuel prices perceived cost of parking is much greater than fueling and car users are very sensitive to parking fees Positive and bigger coefficient of Crowdedness of bus than that of subway very sensitive to crowded bus
14 Table 3. Estimation Results of Mode Choice Behavior of Car Users Variables car bus car bus + subway car subway coefficient t-value coefficient t-value coefficient t-value Car dummy Fuel price -1.01E E E Fare of bus or subway -2.00E E E In-vehicle time -4.21E E E Out-vehicle time -4.41E E E Parking fee -3.63E E E Crowdedness (Rho square) No. of responses 943 1,783 1,502
15 3. Policy Implications Estimate price elasticities through Sample Enumeration method obtain arc elasticity rather than point elasticity Fuel price elasticity of demand for passenger car use ~-0.171(inelastic) With 50% increase in fuel price, modal change from car to bus or subway is expected at minimum 3.9% to maximum 8.5% Dual users of bus and subway show higher price elasticity than single users more sensitive to fuel price as they are relatively longer-distance commuters
16 Table 4. Fuel Price Elasticities of Demand for Car Use and Change of Modal Share Car-bus Car-subway Carbus+subw ay Fuel Price Elasticities Modal change from car to transit modes (%) 10% price increase % % % % % % % % % % % % % %
17 II. Rationale behind Policy Reform Estimate cross price elasticity of demand for passenger car use through sample enumeration technique 0.016~0.087 (inelastic) in Table 8 Modal change from car to mass transit with 50% fare decrease 4.35% at most policy of subsidizing transit fare is not expected to reduce car use
18 Table 5. Fare Elasticities of Demand for Car Use and Change of Modal Share Car-bus Car-subway Carbus+subw ay Fare (cross price) elasticity Modal change from car to transit modes (%) 10% fare decrease % % % % % % % % % % % % % %
19 II. Rationale behind Policy Reform Test whether car users consciously perceive parking costs more than fuel costs (Button, 1993) whether the estimates of the coefficients of fuel price and parking fees are the same Asymptotic t-test Reject at 5% significance level ˆ i var ˆ i ˆ j ˆ j
20 Table 6. Results of Asymptotic t Test for Indifference between Variables Modes Asymptotic t Test Statistic Results Car-bus 4.08 Reject null Car-subway 4.22 Reject null Car-bus+subway 2.95 Reject null
21 II. Rationale behind Policy Reform Increase of monthly parking fee by US $33.00 decrease car use by 13~15% Increase of monthly parking fee by US $66.00 decrease car use by 25~30% Each current individual level of parking fee is not the same cross price elasticity of parking fee cannot be estimated
22 Table 7. Change of Modal Share due to Increasing Parking Fee +40,000 won per Month +80,000 won per month Car-bus Car-subway Carbus+subway Car-bus Car-subway Carbus+subway Modal change due to the change of parking fee Modal Change (%) Car Bus Car Subway Car Bus+subway Car Bus Car Subway Car Bus+subway
23 II. Rationale behind Policy Reform Time Elasticities, Response to Service Variable, and Policy Effects Estimate cross elasticity of in-vehicle time of transit for demand for car use using sample enumeration technique Decrease in-vehicle time of transit by 10~50% cross elasticity 0.46 ~0.57 Speed of subway improves two folds 29% of car users transfer to subway Introducing either express subway transit system or express bus will be an effective policy in reducing car use and traffic congestion in Seoul
24 Table 8. In-vehicle Time Elasticities of Demand for Car Use and Modal Share Car-bus Car-subway Car bus + subway In-vehicle (cross) time elasticity Modal change from car to transit modes (%) 10% decrease % % % % % % % % % % % % % %
25 II. Rationale behind Policy Reform Estimate cross elasticity of out-vehicle time of transit for demand of car use with sample enumeration technique smaller than that of in-vehicle time Decrease out-vehicle time of transit by 10~50% cross elasticity 0.19 ~0.38 modal change up to 19% Policy of increasing frequency of bus and subway very effective for promoting use of transit modes and reducing traffic congestion in Korea
26 Table 9. Out-vehicle Time Elasticities of Demand for Car Use and Modal Share Out-vehicle (cross) time elasticity Modal change from car to transit modes (%) 10% decrease Car-bus Carsubway Car bus + subway 20% % % % % % % % % % % % % %
27 II. Rationale behind Policy Reform Level of service in transit modes is defined as the level of crowdedness in this study Decrease congestion of transit modes by one step 18~25% of car users transfer to alternative modes improving in-vehicle congestion is very important for promoting the use of transit modes and reducing traffic congestion in Seoul
28 Table 10. Car Users Response to Service Variable of In-vehicle Congestion Change of modal share Car-bus Car-subway Car bus + subway Improving one step % from car to bus Worsening one step % from bus to car Improving one step % from car to subway Worsening one step % from subway to car Improving one step % from car to bus + subway Worsening one step % from bus + subway to car
29 II. Rationale behind Policy Reform Public Transit User Subsidy and the Policy Effectiveness If 100% public transit user subsidy is implemented, 18% of current private vehicle user will switch over to public transport If this policy is supplemented by commuter parking fee increase ($ 100/month), the modal share change is estimated at 28%.
30 II. Rationale behind Policy Reform Table 11. Car Users Response to Public Transit User Subsidy Policy Scenarios Commuting Mode Modal Share Conversion Rate to Public Transport 90% Confidence Interval Baseline Private Car 39.6 Public Transport 60.4 N.A N.A 25% Public Transport Subsidy 50% Public Transport Subsidy 75% Public Transport Subsidy 100% Public Transport Subsidy Private Car 36.8 Public Transport 63.2 Private Car 34.0 Public Transport 66.0 Private Car 31.4 Public Transport 68.6 Private Car 29.0 Public Transport ~ ~ ~ ~19.2
31 II. Rationale behind Policy Reform Summary of Policy Implications Could analyze the effects of hypothetical TDM policies in terms of modal changes utilizing elasticity estimates Ineffective policy measures Small effect of fuel price policy Fare related policy (Excluding user subsidy) Effective policy measures Parking regulation or pricing policy Express bus, express urban trains, and HOV lanes Reducing crowdedness in bus and subway through increasing frequency Public transit user subsidy
32 II. Seoul s Transport* 1. General Information 2. Changes in Seoul: Urban Sprawl 3. Changes in Seoul: Motorization 4. Changes in Seoul: Infrastructure 2. Changes in Seoul: Transport Conditions *Source: Jin Young Park, Public Bus Service Modernization (2013)
 26.6 million (49.3%) Korea GRDP 283,651 billion won (22.8%) 585,978 billion won (47.")
33 1. General Information SMA: Seoul, Incheon and Gyeonggi SMA Area Seoul km 2 (0.6%) SMA 11,818 km 2 (11.8%) Incheon Gyeonggi Seoul Population 10.0 million (20.1%) 26.6 million (49.3%) Korea GRDP 283,651 billion won (22.8%) 585,978 billion won (47.1%) * Source: e-national Indicators (2011) [Seoul Metropolitan Area in Korea] 33


34 2. Changes in Seoul : Urban Sprawl Towns Area Population House 1 st (1989~1996) km million 292 thousand 2 nd (2001~2012) km million 671 thousand [Built up Areas in SMA] 34
 veh/person (10 thousand vehicles) [Trends of Vehicle Registration] * Source: e-national")
35 3. Changes in Seoul : Motorization Seoul: 0.02 (1980) 0.11 (1990) 0.24 (2000) 0.3 (2011) veh/person (10 thousand vehicles) [Trends of Vehicle Registration] * Source: e-national Indicators (2011) 35
 3,694 Lines")
 [Railway Networks and Stations in SMA] [Bus Network")
36 4. Changes in Seoul : Infrastructure Transport Infrastructure Seoul SMA Road 8,199 km 24,070 km Bus 447 Lines (9,340 Vehicles) 3,694 Lines (26,847 Vehicles) Railway km (321 Stations) km (521 Stations) [Railway Networks and Stations in SMA] [Bus Network and Capacity in SMA] 36


37 5. Changes in Seoul : Transport Conditions Daily Trips and Mode Share Seoul Incheon Gyeonggi - Seoul intra-city trips: 20,011 thousand trips per day - SMA intra-city trtips: 49,660 thousand trips per day Incheon Gyeonggi Seoul * Source: Metropolitan Transportation Authority 37
38 III. Inferences from the Public Transport Reforms 1. Public Transport Reform in Seoul 2. Bus System Modernization 3. Outcome of the Reform


 Poor")


39 1. Public Transport Reforms Vicious Circle of Bus Service Increasing vehicles Lack of bus priority policies (bus lane & subsidies) Poor punctuality Poor reliability Slow speed Inefficient bus management system Worsen bus operating conditions stress on driver from traffic congestion unfriendly to passenger, and causing accident Limited road capacity congestion abolition of route, reduced operation, periodic increase of fare labor dispute inconvenience for citizen no other options except periodic fare raising Decrease of bus users Abolition of bus service Bankrupt of bus company 39
40 Vicious Circle of Bus Service Unstable Service by deteriorated bus company Unpunctuality, abolition of bus routes Unstable employment Continuous reduction of labor (driver s low salary) Excessive competition to increase revenue Reckless driving : accident, uncomfortable ride Routes owned by private bus company Hard to adjust routes by demands 40
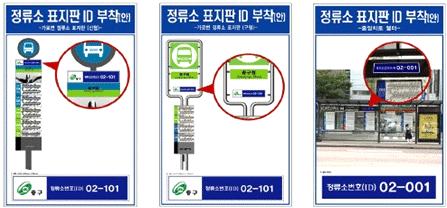
41 Bus System Modernization - Operation Scheme : New revenue system - Network : Trunk & Feeder - Fare : Distance-based free transfer fare with smart card - Information : Bus Management/Information System - Infrastructure : Exclusive bus lane, Station improvement - Fleet : CNG bus, Low-floor bus 41
42 2. Bus System Modernization Operation Scheme - Introduction of bidding main routes - Joint management of revenue - Reform of revenue structure based on operating distance Previous system New system Revenue based on number of Passengers Revenue based on Service distance (Veh-km) 42


43 2. Bus System Modernization Network : Trunk Lines Feeder Lines Circular Wide Area Regional connection between suburbs and downtown area Ensuring operation speed and punctuality Trunk lines Blue bus feeder to trunk lines and subways Meeting local traffic demand Feeder lines Green bus Local lines within the downtown area Serving for business and shopping trips Circular lines Yellow bus Express connection between satellite cities and downtown area Absorbing passenger car commuters Wide area lines Red bus 43 43

44 2. Bus System Modernization Network : Trunk & Feeder 44

45 2. Bus System Modernization Network : Trunk & Feeder 45
 up to 12 km; extra fare of 100 Korean won")

46 2. Bus System Modernization Distance based fare - Subway single trips : fare according to distance-traveled (basic fare : 1,000 Korean won (1 US Dollar) up to 12 km; extra fare of 100 Korean won for every additional 6 km) - Bus single trips : single fare of 1,000 won Free of charge for transfers - For transferring trips : accumulated distance-based fare system (basic fare up to 10km; extra fare for every additional 5 km) 46


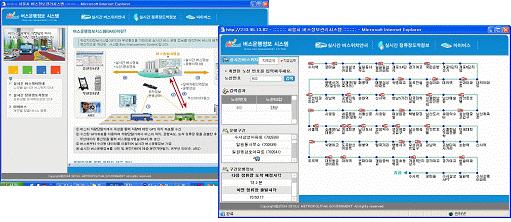
47 2. Bus System Modernization Bus Management System : Efficient management of bus services For Passenger BIT -Real-time Bus Operation Information -Route and Transfer Information -Real-time Bus Operation Info. -Bus Operation DB Bus Company ARS Mobile Internet Route and operation Info. Bus Arrival Time On-board device installed on every bus Seoul BMS Bus real-time location Info. Interval and operation Info. Bus Location Allocating Buses Notice Bus Interval Info. Bus Operation Info


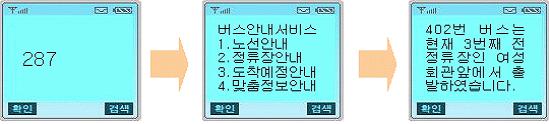


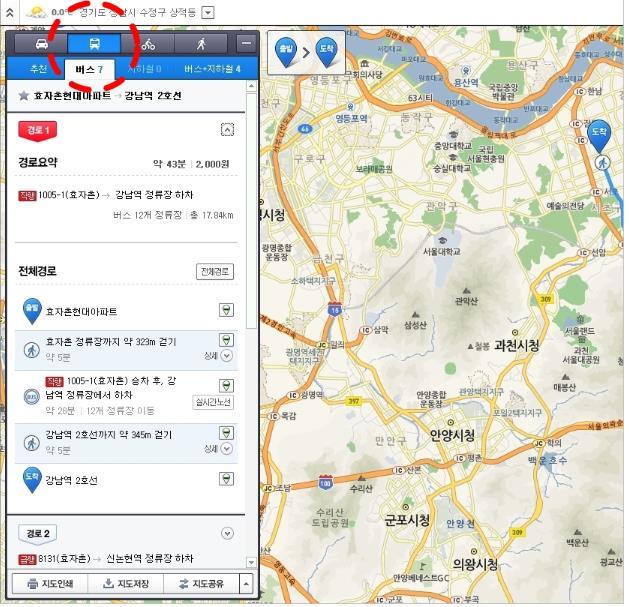
48 2. Bus System Modernization Bus Information System Bus Information Service Bus Shelter ARS No. 62 bus left last bus stop Real-time Bus Operation Information Web Mobile 48


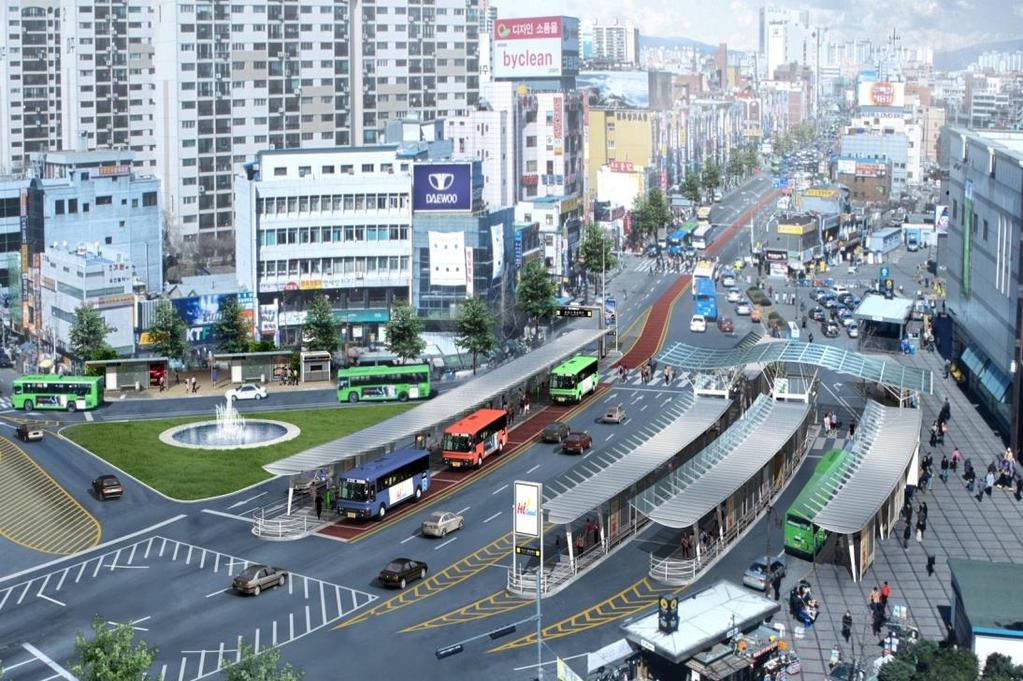
49 2. Bus System Modernization Exclusive Bus lane Provides faster and reliable travel within the service area Seoul Metropolitan Area: 13 corridors, 157km (2011) Attracts patronage from private vehicles Median exclusive bus lane Bus lane Network In Seoul 49


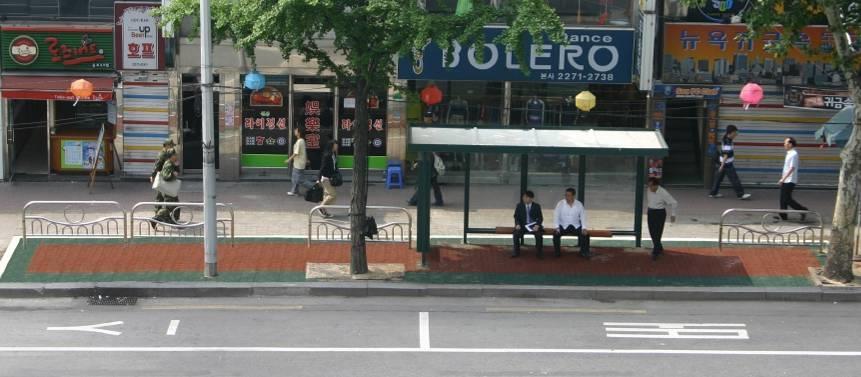

50 After Before 2. Bus System Modernization Bus Station Improvement Stops Improvement Shelter & Fence installation 50


51 2. Bus System Modernization Fleets Trunk lines Major lines Aux. Trunk lines Articulated buses, Low-floor buses, CNG buses Low-floor buses, CNG buses Feeder lines Medium-sized buses Circular lines Medium-sized buses 51
52 Number of Passengers (thousand people/day) 3. Outcome of the Reforms Increase in Public Transport Patronage 7,000 Subway Bus 6,500 6,000 5,500 5,911 6,112 6,162 6,286 6,239 6,218 6,213 6,267 6,282 6,437 5,000 5,174 4,500 4,544 4,655 4,583 4,615 4,605 4,595 4,000 3,500 4,293 4,192 4,180 4,006 3,992 14% 3, Year Subway ridership excludes free-pass holders. Source : Seoul Year Book 52
53 Degree of Satisfaction (point) Trend of Citizen s Satisfaction Degree for Transit Services Satisfaction rate for Bus Service,7.0,6.5 Year Bus Public Transit Subway ,6.0,6.00,6.00,6.19, ,5.5,5.61, ,5.0,4.5,4.76, % , Year Rating is based on a scale of 0 to10. Source : 2010 Seoul Survey 53
54 Valuing Convenience in the Korean Context Seoul s public transport reform is successful in attracting public transport s patronage Increased competitiveness of public transport Increased convenience level of public transports Reduced travel time Free transfers BIS system improvements Empirical evidences of the importance of convenience in public transport 54

55 Ⅳ. Discussions
56 Thank You.
Seoul. (Area=605, 10mill. 23.5%) Capital Region (Area=11,730, 25mill. 49.4%)
 Capital Region (Area=11,730, 25mill. 49.4%)") Seoul (Area=605, 10mill. 23.5%) Capital Region (Area=11,730, 25mill. 49.4%) . Major changes of recent decades in Korea Korea s Pathways at a glance 1950s 1960s 1970s 1980s 1990s 2000s Economic Development
Seoul (Area=605, 10mill. 23.5%) Capital Region (Area=11,730, 25mill. 49.4%) . Major changes of recent decades in Korea Korea s Pathways at a glance 1950s 1960s 1970s 1980s 1990s 2000s Economic Development
Advances in ICT and its Implications for Travel Behavior: A Case Study of Korea
 I- TED 2014 April 9-11 2014, Dallas U.S. Advances in ICT and its Implications for Travel Behavior: A Case Study of Korea Sungwon LEE, Gyeng Chul KIM, Seung Kook WU and Jieun OH Contents Ⅰ Ⅱ Ⅲ Ⅳ Introduction
Smart Green Transportation of LG CNS. Seoul Case
 Smart Green Transportation of LG CNS Seoul Case about Seoul Seoul Was about Seoul about Seoul - 1/22 Economic Growth of Korea Item 1970 2004 Differences Population 5,433,198 10,297,004 2 times Vehicles
Seoul Transportation
 Seoul Transportation September 2014 Joonho Ko, Ph.D. Director, Megacity Research Center The Seoul Institute Contents Ⅰ. Past & Now 3 Ⅱ. Vision 1 5 Ⅲ. Implementation 1 9 Ⅰ. Past & Now 1. Past & Now Seoul
Bus System Reform and Social Cohesion
 Toronto Visit 15 th June Bus System Reform and Social Cohesion by Dr. Ma, Kookjun Table of of Contents Ⅰ. Introduction Ⅱ. The Weak, and Concepts of Seoul Public Transportation System Ⅲ. Seoul Public Transportation
Transportation Policy for Reducing GHG Emissions in Korea. Junhaeng Jo
 Transportation Policy for Reducing GHG Emissions in Korea Junhaeng Jo Contents Transportation Policy for Reducing GHG Emissions in Korea CO 2 Emissions in Transportation Sector Transportation Policy Measures
Urban Transport systems in major cities in China. Sun Kechao Senior Engineer China Academy of Transportation Sciences, Beijing, China
 Urban Transport systems in major cities in China Sun Kechao Senior Engineer China Academy of Transportation Sciences, Beijing, China Part 1 Part 2 Part 3 Part 4 Introduction Urban transport policies Urban
BRT: What is it & Where Does it Fit? Sam Zimmerman
 BRT: What is it & Where Does it Fit? Sam Zimmerman 1 BRT: Bus Rapid Transit Flexible, permanently integrated, high performance system with a quality image and a strong ID Package of components appropriate
Road Map for Sustainable Transport Strategy for Colombo Metropolitan Region with Cleaner Air, through Experience
 Workshop on Air Quality and Environmentally Sustainable Transport April 28 th 2011 Don S. Jayaweera Road Map for Sustainable Transport Strategy for Colombo Metropolitan Region with Cleaner Air, through
Sustainable Urban Transport Policy : Experience of Daejeon city
 Expert Group Meeting, Kathmandu, Sep. 22, 2016 Sustainable Urban Transport Policy : Experience of Daejeon city Daehee Han / Ph.D. Senior researcher of Department Policy Division Daejeon Metropolitan City
Roundtable New Delhi, India
 Roundtable New Delhi, India Dept. of Railway Research Division for Rail Policy and Industry Research Associate Research Fellow LEE, JUN 1 Q-1 Reason of Investment for HSR? Beginning: Serious Congestion
Strategic Plan
 2005-2015 Strategic Plan SUMMARY OF THE REVISED PLAN IN 2011 A decade focused on developing mass transit in the Outaouais A updated vision of mass transit in the region The STO is embracing the future
Travel Time Savings Memorandum
 04-05-2018 TABLE OF CONTENTS 1 Background 3 Methodology 3 Inputs and Calculation 3 Assumptions 4 Light Rail Transit (LRT) Travel Times 5 Auto Travel Times 5 Bus Travel Times 6 Findings 7 Generalized Cost
Finance Operation Plan on Transportation Sector
 :: Metropolis Commissions 4 and 2 Meeting in Seoul Finance Operation Plan on Transportation Sector 0 SMG l. OverviewO view of Seoul Overview Area : 605km 2-0.6% of the national territoryg (Seoul Metropolitan
Planning for Sustainable Urban Transport Systems in India - Strengths and Weaknesses
 Planning for Sustainable Urban Transport Systems in India - Strengths and Weaknesses O.P. Agarwal Presented on 22 nd September at Kathmandu United Nations ESCAP KOTI Expert Group Meeting on Planning and
Transport Sector Performance Indicators: Sri Lanka Existing Situation
 Transport Sector Performance Indicators: Sri Lanka Existing Situation Amal S. Kumarage Professor, Department of Civil Engineering, University of Moratuwa Chairman, National Transport Commission kumarage@sltnet.lk
Parking Pricing As a TDM Strategy
 Parking Pricing As a TDM Strategy Wei-Shiuen Ng Postdoctoral Scholar Precourt Energy Efficiency Center Stanford University ACT Northern California Transportation Research Symposium April 30, 2015 Parking
Mobility on Demand, Mobility as a Service the new transport paradigm. Richard Harris, Xerox
 Mobility on Demand, Mobility as a Service the new transport paradigm Richard Harris, Xerox Xerox Transport Services 37 billion 100 million transit fare transactions processed annually and more public transport
Dr. K. Gunasekaran Associate Professor Division of Transportation Engineering Anna University Chennai
 Dr. K. Gunasekaran Associate Professor Division of Transportation Engineering Anna University Chennai INTRODUCTION Bus Transport is the most preferred Public Transport System in many Indian cities Recent
Sustainable Urban Transport Index (SUTI)
") Sustainable Urban Transport Index (SUTI) City Comparisons & Way Forward PROF. H.M SHIVANAND SWAMY, CEPT UNIVERSITY DHAKA SEPTEMBER 12, 2018 Purpose Discussion of Results from 5 Cities Reflections on the
Sustainable Urban Transport Index (SUTI) City Comparisons & Way Forward PROF. H.M SHIVANAND SWAMY, CEPT UNIVERSITY DHAKA SEPTEMBER 12, 2018 Purpose Discussion of Results from 5 Cities Reflections on the
Policy Coordination in Urban Transport Planning: Some Experience from Asia- Nepal and Japan
 Regional Expert Group Meeting on Policy Options for Sustainable Transport Development 27-29 November 2013, Incheon Policy Coordination in Urban Transport Planning: Some Experience from Asia- Nepal and
Public Transportation Problems and Solutions in the Historical Center of Quito
 TRANSPORTATION RESEARCH RECORD 1266 205 Public Transportation Problems and Solutions in the Historical Center of Quito JACOB GREENSTEIN, Lours BERGER, AND AMIRAM STRULOV Quito, the capital of Ecuador,
Two years since our book
 Bus Systems for the Future Lew Fulton International Energy Agency Paris Presentation at Environment 2005 Conference, Abu Dhabi 31 January 2005 www.iea.org Two years since our book What s been happening?
Service Quality: Higher Ridership: Very Affordable: Image:
 Over the past decade, much attention has been placed on the development of Bus Rapid Transit (BRT) systems. These systems provide rail-like service, but with buses, and are typically less expensive to
Ministry of Environment and Forests. Ministry of Communication
 Developments in EST in Bangladesh Ministry of Environment and Forests & Ministry of Communication Thailand, 23 25 August 2010 Modes of Transport in Bangladesh Roads -60% Waterways -14% Railways -12% Airways
History of Subway in Kyoto
 TO: Board Members FROM: Yasuyo Tsukamoto DATE: May 6, 2016 SUBJECT: Alternative Plan to Increasing Fares in Kyoto City I am strongly against the idea that the (KMTB) increase the subway fare. Although
Downtown Transit Connector. Making Transit Work for Rhode Island
 Downtown Transit Connector Making Transit Work for Rhode Island 3.17.17 Project Evolution Transit 2020 (Stakeholders identify need for better transit) Providence Core Connector Study (Streetcar project
Seoul Transport Reform and Information Technology for Public Transportation System
 Seoul Transport Reform and Information Technology for Public Transportation System Seoul Development Institute Korea Smart Card Co. Ltd Contents About Seoul Review on Transport Policy Measures in Seoul
PROMOTION OF EFFICIENT PUBLIC TRANSPORT IN MALAWI BY CHIMWEMWE KAUNDA
 PROMOTION OF EFFICIENT PUBLIC TRANSPORT IN MALAWI BY CHIMWEMWE KAUNDA Introduction Malawi has a population of about 17 million people out of this population 80% is in the rural areas and 20% is in urban
Toward the Realization of Sustainable Mobility
 GIES 2008 Toward the Realization of Sustainable Mobility March 13, 2008 Toyota Motor Corporation Senior Technical Executive Hiroyuki Watanabe 1 CO 2 Emission from Transportation Sector Distribution by
Energy efficiency policies for transport. John Dulac International Energy Agency Paris, 29 May 2013
 Energy efficiency policies for transport John Dulac International Energy Agency Paris, 29 May 2013 Transport scene-setting Why are transport policies needed, particularly in cities? Oil demand is driven
FENEBUS POSITION PAPER ON REDUCING CO2 EMISSIONS FROM ROAD VEHICLES
 FENEBUS POSITION PAPER ON REDUCING CO2 EMISSIONS FROM ROAD VEHICLES The Spanish Federation of Transport by Bus (Fenebús) is aware of the importance of the environmental issues in order to fully achieve
Policy Note. Vanpools in the Puget Sound Region The case for expanding vanpool programs to move the most people for the least cost.
 Policy Note Vanpools in the Puget Sound Region The case for expanding vanpool programs to move the most people for the least cost Recommendations 1. Saturate vanpool market before expanding other intercity
EUGENE-SPRINGFIELD, OREGON EAST WEST PILOT BRT LANE TRANSIT DISTRICT
 EUGENE-SPRINGFIELD, OREGON EAST WEST PILOT BRT LANE TRANSIT DISTRICT (BRIEF) Table of Contents EUGENE-SPRINGFIELD, OREGON (USA)... 1 COUNTY CONTEXT AND SYSTEM DESCRIPTION... 1 SYSTEM OVERVIEW... 1 PLANNING
Urban Mobility. Story how to build the urban mobility of Seoul. Kim, Sangbum Visiting Professor University of Seoul
 Urban Mobility Story how to build the urban mobility of Seoul Kim, Sangbum Visiting Professor University of Seoul I. Introduction 1. Civilization has closely been related to mobility of human activities
Ideas + Action for a Better City learn more at SPUR.org. tweet about this #DisruptiveTransportation
 Ideas + Action for a Better City learn more at SPUR.org tweet about this event: @SPUR_Urbanist #DisruptiveTransportation TNCs & AVs The Future Is Uncertain The Future Is Uncertain U.S. Dept of Transportation
Urban Transport Development Investment Program (RRP MON 39256) SECTOR ROAD MAP
 SECTOR ROAD MAP") Urban Transport Development Investment Program (RRP MON 39256) SECTOR ROAD MAP 1. The government s vision for urban transport in Ulaanbaatar provides the basis for the sector roadmap to be implemented
Urban Transport Development Investment Program (RRP MON 39256) SECTOR ROAD MAP 1. The government s vision for urban transport in Ulaanbaatar provides the basis for the sector roadmap to be implemented
Can Public Transportation Compete with Automated and Connected Cars?
 Can Public Transportation Compete with Automated and Connected Cars? RALPH BUEHLER, VIRGINIA TECH, ALEXANDRIA, VA Based on: Buehler, R. 2018. Can Public Transportation Compete with Automated and Connected
CHANGE IN DRIVERS PARKING PREFERENCE AFTER THE INTRODUCTION OF STRENGTHENED PARKING REGULATIONS
 CHANGE IN DRIVERS PARKING PREFERENCE AFTER THE INTRODUCTION OF STRENGTHENED PARKING REGULATIONS Kazuyuki TAKADA, Tokyo Denki University, takada@g.dendai.ac.jp Norio TAJIMA, Tokyo Denki University, 09rmk19@dendai.ac.jp
The City of Toronto s Transportation Strategy July 2007
 The City of Toronto s Transportation Strategy July 2007 Presentation Outline Transportation Statistics Transportation Building Blocks Toronto s Official Plan Transportation and City Building Vision Projects
The Century of Cities
 The Century of Cities 80% of the world economic output is concentrated in cities. Until 2025, the share of urban population will increase from 50% to 60%. Economic growth and urban sprawl mean more and
BENCHMARKING URBAN TRANSPORT-A STRATEGY TO FULFIL COMMUTER ASPIRATION
 BENCHMARKING URBAN TRANSPORT-A STRATEGY TO FULFIL COMMUTER ASPIRATION Rahul Tiwari Senior City Transport Officer Directorate, Urban Administration and Development Bhopal & PhD Scholar (+91) 98930 44012
TORONTO TRANSIT COMMISSION REPORT NO.
 Revised: March/13 TORONTO TRANSIT COMMISSION REPORT NO. MEETING DATE: March 26, 2014 SUBJECT: COMMUNITY BUS SERVICES ACTION ITEM RECOMMENDATION It is recommended that the Board not approve any routing
Mobility of Gurugram & NCR-
 Mobility of Gurugram & NCR- Vision for Efficient Transport Systems By Sujata Savant Additional General Manger Urbanization and Mobility Urbanization & Mobility Magnitude 31% Indians live in urban areas
Sustainable Transport and Restraining CO 2 emissions in Latin America- good news from a forgotten continent
 Biennial Conference on Transportation and Energy Policy Sustainable Transport and Restraining CO 2 emissions in Latin America- good news from a forgotten continent Adriana Lobo Centro de Transporte de
UCLA Lake Arrowhead Conference. October 18, 2010
 BART Click to Capacity edit Master Overview title style for UCLA Lake Arrowhead Conference October 18, 2010 0 BART Basics 360,000 daily riders 104 miles 43 stations 1.3 billion annual passenger miles 1
UCLA Lake Arrowhead Conference. October 18, 2010
 BART Click to Capacity edit Master Overview title style for UCLA Lake Arrowhead Conference October 18, 2010 0 BART Basics 360,000 daily riders 104 miles 43 stations 1.3 billion annual passenger miles 1
Transit Fares for Multi-modal Transportation Systems
 Transit Fares for Multi-modal Transportation Systems Dr. Jeffrey M. Casello Associate Professor School of Planning Department of Civil and Environmental Engineering University of Waterloo Transport Futures
SERVICE DESIGN GUIDELINES
 VTA TRANSIT SUSTAINABILITY POLICY: APPENDIX A SERVICE DESIGN GUIDELINES Adopted February 2007 COMMUNITYBUS LOCALBUS EXPRESSBUS BUSRAPIDTRANSIT LIGHTRAILTRANSIT STATIONAREAS S A N T A C L A R A Valley Transportation
PUBLIC TRANSPORT IMPROVEMENT, PLANNING AND OPERATIONS.
 PUBLIC TRANSPORT IMPROVEMENT, PLANNING AND OPERATIONS. Email: mohamed.kuganda@udagroup.co.tz Mobile: +255754 810570 Presentation by: Eng. Mohamed Kuganda Chief Operations Officer UDART Plc - TANZANIA PRESENTATION
GROWTH WEEK SESSION JUNE 01 JUNE A PRESENTATION BY KHAWAJA HAIDER LATIF CEO, LAHORE TRANSPORT COMPANY GOVERNMENT OF PUNJAB, PAKISTAN
 GROWTH WEEK SESSION JUNE 01 JUNE 03 2016 A PRESENTATION BY KHAWAJA HAIDER LATIF CEO, LAHORE TRANSPORT COMPANY GOVERNMENT OF PUNJAB, PAKISTAN PAKISTAN POPULATION & GROWTH RATE SELECTED DEMOGRAPHIC INDICATOR
2 VALUE PROPOSITION VALUE PROPOSITION DEVELOPMENT
 2 VALUE PROPOSITION The purpose of the Value Proposition is to define a number of metrics or interesting facts that clearly demonstrate the value of the existing Xpress system to external audiences including
EXPERIENCE IN A COMPANY-WIDE LONG DISTANCE CARPOOL PROGRAM IN SOUTH KOREA
 EXPERIENCE IN A COMPANY-WIDE LONG DISTANCE CARPOOL PROGRAM IN SOUTH KOREA JB s Social Club Presented at TRB 94th Annual Meeting on Jan 12, 2015 Louis Berger Kyeongsu Kim Land & Housing Institute (LHI)
UCLA Lake Arrowhead Conference. October 18, 2010
 BART Click to Capacity edit Master Overview title style for UCLA Lake Arrowhead Conference October 18, 2010 0 BART Basics 360,000 daily riders 104 miles 43 stations 1.3 billion annual passenger miles 1
Decarbonization of the Transport Sector and Urban Form
 Decarbonization of the Transport Sector and Urban Form Sustainable Transportation System and Carbon Emission Peak, Hangzhou Pilot Sustainable Transportation System and Carbon Emission Peak Project - Hangzhou
Management Strategy and Cases of Chinese Urban Mobility. Gong Liyuan Jinan Transport Research Center
 Management Strategy and Cases of Chinese Urban Mobility Gong Liyuan Jinan Transport Research Center April, 2014 Contents Ⅰ Background Ⅱ China is seeking for solutions to the problems Ⅲ Cases of urban traffic
Policy Options to Decarbonise Urban Passenger Transport
 Policy Options to Decarbonise Urban Passenger Transport Results of expert opinion survey Guineng Chen, ITF/OECD 19 April 2018 2 INTRODUCTION The expert survey is part of the ITF Decarbonising Transport
Building smart transport in Moscow
 Building smart transport in Moscow Moscow addressed its road and public transit congestion problems and developed one of the world s smartest and most-used public transportation systems. Here s how. Maksim
Aging of the light vehicle fleet May 2011
 Aging of the light vehicle fleet May 211 1 The Scope At an average age of 12.7 years in 21, New Zealand has one of the oldest light vehicle fleets in the developed world. This report looks at some of the
Sustainability SFMTA Path to Platinum
 Sustainability SFMTA Path to Platinum Ed Reiskin San Francisco Municipal Transportation Agency, Director of Transportation San Francisco, CA Timothy Papandreou Deputy Director Strategic Planning & Policy
Cycling to work. Towards a safer, more efficient and sustainable commuting. Madrid, 20 September confederación sindical de comisiones obreras
 Kingdom of the Netherlands Cycling to work Towards a safer, more efficient and sustainable commuting Manel Ferri Mobility dept. Trade Union Confederation CCOO Madrid, 20 September 2012 Current state of
TORONTO TRANSIT COMMISSION REPORT NO.
 Revised: March/13 TORONTO TRANSIT COMMISSION REPORT NO. MEETING DATE: SUBJECT: August 19, 2014 OPPORTUNITIES TO IMPROVE TRANSIT SERVICE IN TORONTO ACTION ITEM RECOMMENDATIONS It is recommended that the
FACTSHEET on Bus Rapid Transit System
 FACTSHEET on Bus Rapid Transit System 2017 This paper was prepared by: SOLUTIONS project This project was funded by the Seventh Framework Programme (FP7) of the European Commission www.uemi.net Layout/Design:
Doubling the Market Share of Public Transport Worldwide by 2025: A Smart Future for Cities
 Doubling the Market Share of Public Transport Worldwide by 2025: A Smart Future for Cities Dawn CHUI International Association of Public Transport (UITP) Contents 1. What would happen in 2025 if current
Stakeholders Advisory Working Groups (SAWGs) Traffic and Transit SAWG Meeting #7
 Traffic and Transit SAWG Meeting #7") Presentation Tappan Zee Bridge/I-287 Corridor Environmental Review December 4, 2008 Slide 1 Title Slide Slide 2 This presentation discusses the contents of the Transit Mode Selection Report. Slide 3 The
Presentation Tappan Zee Bridge/I-287 Corridor Environmental Review December 4, 2008 Slide 1 Title Slide Slide 2 This presentation discusses the contents of the Transit Mode Selection Report. Slide 3 The
Transit in Bay Area Blueprint
 Rail~Volution 2010 Click to edit Master title style Transit in Bay Area Blueprint October 21, 2010 0 Bottom Line State-of-Good Repair essential for reliable transit service large funding shortfalls BART
MOBILITY AND THE SHARED ECONOMY
 MOBILITY AND THE SHARED ECONOMY IT S THE END OF MOBILITY AS WE KNOW IT SHOULD WE FEEL FINE?» Sharing economy grows rapidly and disrupts classical mobility, but with ambiguous and uncertain effects» Automated
Kaohsiung City Government Kaohsiung: Heading towards an Eco-Mobility City
 Kaohsiung City Government 2013 Kaohsiung: Heading towards an Eco-Mobility City Outlines 1. About Kaohsiung 2. Goal 3. Strategies 2 3 1. About Kaohsiung 1.1 Basic Taiwan Area: 36,193 km 2 Population: 23.3
Transport systems integration into urban development planning processes
 Transport systems integration into urban development planning processes Phd. Vytautas Palevičius 2014-03-28 Klaipėda Šiauliai Panevėžys Kaunas Vilnius At the beginning of year 2013, Lithuania was populated
RIETI BBL Seminar Handout
 Research Institute of Economy, Trade and Industry (RIETI) RIETI BBL Seminar Handout Autonomous Vehicles, Infrastructure Policy, and Economic Growth September 25, 2018 Speaker: Clifford Winston https://www.rieti.go.jp/jp/index.html
TABLE OF CONTENTS. Table of contents. Page ABSTRACT ACKNOWLEDGEMENTS TABLE OF TABLES TABLE OF FIGURES
 Table of contents TABLE OF CONTENTS Page ABSTRACT ACKNOWLEDGEMENTS TABLE OF CONTENTS TABLE OF TABLES TABLE OF FIGURES INTRODUCTION I.1. Motivations I.2. Objectives I.3. Contents and structure I.4. Contributions
UTA Transportation Equity Study and Staff Analysis. Board Workshop January 6, 2018
 UTA Transportation Equity Study and Staff Analysis Board Workshop January 6, 2018 1 Executive Summary UTA ranks DART 6 th out of top 20 Transit Agencies in the country for ridership. UTA Study confirms
STRATEGIC PRIORITIES AND POLICY COMMITTEE MAY 5, 2016
 STRATEGIC PRIORITIES AND POLICY COMMITTEE MAY 5, 2016 Shift Rapid Transit Initiative Largest infrastructure project in the city s history. Rapid Transit initiative will transform London s public transit
Denver Car Share Program 2017 Program Summary
 Denver Car Share Program 2017 Program Summary Prepared for: Prepared by: Project Manager: Malinda Reese, PE Apex Design Reference No. P170271, Task Order #3 January 2018 Table of Contents 1. Introduction...
Factors affecting the development of electric vehiclebased car-sharing schemes
 Factors affecting the development of electric vehiclebased car-sharing schemes Richard Mounce and John Nelson Centre for Transport Research, University of Aberdeen, UK E-mail: r.mounce@abdn.ac.uk ; j.d.nelson@abdn.ac.uk
PEACHTREE CORRIDOR PARTNERSHIP. Current Status & Next Steps
 PEACHTREE CORRIDOR PARTNERSHIP Current Status & Next Steps PEACHTREE CORRIDOR PARTNERSHIP Why Peachtree? Why Now? I. THE CONTEXT High Level View of Phasing Discussion Potential Ridership Segment 3 Ease
Preferred citation style
 Preferred citation style Axhausen, K.W. (2017) How to organise a 100% autonomous transport system?, presentation at the University of Newcastle, Newcastle upon Tyne, May 2017 How to organise a 100% autonomous
The role of rail in a transport system to limit the impact of global warming
 The role of rail in a transport system to limit the impact of global warming 26 November 213 Gerard Drew, Beyond Zero Emissions Tilo Schumann, German Aerospace Centre (DLR) Overview CONTEXT Character of
BMW GROUP DIALOGUE. HANGZHOU 2017 TAKE AWAYS.
 BMW GROUP DIALOGUE. HANGZHOU 2017 TAKE AWAYS. BMW GROUP DIALOGUE. CONTENT. A B C Executive Summary: Top Stakeholder Expert Perceptions & Recommendations from Hangzhou Background: Mobility in Hangzhou 2017,
PHILADELPHIA SUBURBAN RAIL SUMMARY (COMMUTER RAIL, REGIONAL RAIL)
") PHILADELPHIA SUBURBAN RAIL SUMMARY (COMMUTER RAIL, REGIONAL RAIL) October 2003 The Philadelphia commuter rail service area consists of 5.1 million people, spread over 1,800 square miles at an average population
PHILADELPHIA SUBURBAN RAIL SUMMARY (COMMUTER RAIL, REGIONAL RAIL) October 2003 The Philadelphia commuter rail service area consists of 5.1 million people, spread over 1,800 square miles at an average population
Funding Scenario Descriptions & Performance
 Funding Scenario Descriptions & Performance These scenarios were developed based on direction set by the Task Force at previous meetings. They represent approaches for funding to further Task Force discussion
Back ground Founded in 1887, and has expanded rapidly Altitude about 2500 meters above MSL Now among the ten largest cities in Sub Saharan Africa
 Back ground Founded in 1887, and has expanded rapidly Altitude about 2500 meters above MSL Now among the ten largest cities in Sub Saharan Africa Annual growth rate is 3.8% By 2020 population growth would
The Strategies and Revelation of Free Buses in Chengdu
 The Strategies and Revelation of Free Buses in Chengdu Chen,She ChengduAcademyofSocial Sciences,Sichuan,China November6,2014 The Introduction of Chengdu Buses Chengdu, located in the central area of Sichuan
We Want Your Input! Review the design alternatives and tell us what s important to you in the design of these areas of the approved BRT Network:
 We Want Your Input! Review the design alternatives and tell us what s important to you in the design of these areas of the approved BRT Network: Richmond North of Oxford Street Richmond Row Dundas Street
Predicted response of Prague residents to regulation measures
 Predicted response of Prague residents to regulation measures Markéta Braun Kohlová, Vojtěch Máca Charles University, Environment Centre marketa.braun.kohlova@czp.cuni.cz; vojtech.maca@czp.cuni.cz June
Michigan/Grand River Avenue Transportation Study TECHNICAL MEMORANDUM #18 PROJECTED CARBON DIOXIDE (CO 2 ) EMISSIONS
 EMISSIONS") TECHNICAL MEMORANDUM #18 PROJECTED CARBON DIOXIDE (CO 2 ) EMISSIONS Michigan / Grand River Avenue TECHNICAL MEMORANDUM #18 From: URS Consultant Team To: CATA Project Staff and Technical Committee Topic:
TECHNICAL MEMORANDUM #18 PROJECTED CARBON DIOXIDE (CO 2 ) EMISSIONS Michigan / Grand River Avenue TECHNICAL MEMORANDUM #18 From: URS Consultant Team To: CATA Project Staff and Technical Committee Topic:
Sales and Use Transportation Tax Implementation Plan
 Sales and Use Transportation Tax Implementation Plan Transportation is more than just a way of getting from here to there. Reliable, safe transportation is necessary for commerce, economic development,
Whither the Dashing Commuter?
 Whither the Dashing Commuter? The MTA in a Changing Region William Wheeler Director of Special Project Development and Planning Travel in the New York Region has changed from the days of the 9 to 5 commute
Three ULTra Case Studies examples of the performance of the system in three different environments
 Three ULTra Case Studies examples of the performance of the system in three different environments airport application: London Heathrow : linking business and staff car parks through the access tunnel
Light rail, Is New Zealand Ready for Light Rail? What is Needed in Terms of Patronage, Density and Urban Form.
 Light rail, Is New Zealand Ready for Light Rail? What is Needed in Terms of Patronage, Density and Urban Form. THE PROBLEM LIGHT RAIL THE SOLUTION? INTRODUCTION Light rail transit (LRT) provides the opportunity
Appendix G: Rapid Transit Technology Backgrounder July 2017
 Appendix G: Rapid Transit Technology Backgrounder This appendix provides additional details regarding Bus Rapid Transit and Light Rail Transit technologies, with examples from other systems, including:
ACCESS MODE CHOICE MODEL FOR INTERCITY PASSENGER TRAVEL. Prof. CSRK Prasad Head, Transportation Division NIT Warangal
 ACCESS MODE CHOICE MODEL FOR INTERCITY PASSENGER TRAVEL Prof. CSRK Prasad Head, Transportation Division NIT Warangal OUTLINE Urbanisation / Intercity Passenger Travel Significance of Intercity Terminal
I-26 Fixed Guideway Alternatives Analysis
 I-26 Fixed Guideway Alternatives Analysis Public Meetings: North Charleston, January 25, 2016 Charleston: January 26, 2016 Summerville: January 28, 2016 Agenda I. Project Update II. III. IV. Screen Two
Efficient & Sustainable City Bus Systems
 Efficient & Sustainable City Bus Systems ESCBS Knowledge Exchange & Mid-Term Review Workshop Nupur Gupta, Sr. Transport Specialist The World Bank 4 September 2017 Presentation Structure India s Urbanization
Energy Efficiency Transport Sector
 Energy Efficiency Transport Sector Danida Fellowship Course 2015 Xianli Zhu Copenhagen Centre on Energy Efficiency (C2E2) UNEP DTU Partnership 18 August 2015 Outline Status & trends of energy use in the
Calgary Transit and the Calgary Transportation Plan Chris Jordan, M.Sc., P.Eng. Coordinator, Strategic Transit Planning, Calgary Transit
 Calgary Transit and the Calgary Transportation Plan Chris Jordan, M.Sc., P.Eng. Coordinator, Strategic Transit Planning, Calgary Transit 1. Plan It Calgary the new Municipal Development Plan and Calgary
Path to achieving a good transport system:
 Path to achieving a good transport system: Lessons learnt from Bogota to Delhi Geetam Tiwari Transportation Research and Injury prevention Programme Indian Institute of Technology Delhi FUTURE URBAN TRANSPORT
A REVIEW OF HIGH-SPEED RAIL PLAN IN JAVA ISLAND: A COMPARISON WITH EXISTING MODES OF TRANSPORT
 Civil Engineering Forum Volume XXII/3 - September 2013 A REVIEW OF HIGH-SPEED RAIL PLAN IN JAVA ISLAND: A COMPARISON WITH EXISTING MODES OF TRANSPORT Eko Hartono Transport System and Engineering, Universitas
Preferred citation style
 Preferred citation style Axhausen, K.W. (2017) Towards an AV Future: Key Issues, presentation at Future Urban Mobility Symposium 2017, Singapore, July 2017.. Towards an AV Future: Key Issues KW Axhausen
SA TAXI IMPACT DELIVERING A SOCIAL & COMMERCIAL BENEFIT R18.6 BILLION LOANS ORIGINATED CREATING R2.9 BILLION LOANS ORIGINATED CREATING
 SA TAXI IMPACT DELIVERING A SOCIAL & COMMERCIAL BENEFIT SME EMPOWERMENT & ECONOMIC TRANSFORMATION SA Taxi facilitates asset ownership by black owned SMEs BLACK OWNED SMEs 100% R2.9 BILLION LOANS ORIGINATED