Appendix A: Detailed Stop by Stop CAT Ridership (UNLV Stops) Appendix B: Public Outreach Materials... 34
|
|
|
- Myra Young
- 6 years ago
- Views:
Transcription
1
2 TABLE OF CONTENTS Purpose and Need... 1 Introduction... 1 Background... 1 Purpose of the Current Study... 3 Proposed Project (Proposed Action)... 3 Purpose of the Proposed Action... 3 Need for the Proposed Action... 4 Current Conditions - Public Transportation Service to UNLV... 4 Current Conditions - Campus Travel Patterns... 5 Current Conditions - Surrounding Roadway Network... 5 Current Conditions - Campus Circulation... 9 Relationship to Other Plans and Projects... 9 Development and Evaluation of Alternatives Step 1: Identification of All Potential Sites Step 2: Opportunities and Constraints Screening Step 3: Public Outreach Meeting Step 4: Evaluation Criteria Screening Step 5: Circulation and Operations Analysis Transit Center Design Specifications Transit Center Layouts Selection of the Locally Preferred Alternative (LPA) Conceptual Site Plan Public Outreach Meeting Implementation Plan RTC UNLV Interlocal Agreement Campus Improvements Needed for Rapid Transit Service Capital Cost Estimate Appendix A: Detailed Stop by Stop CAT Ridership (UNLV Stops) Appendix B: Public Outreach Materials Appendix C: Evaluation Criteria Summary, Scoring and Results Appendix D: Traffic and Circulation Analysis Appendix E: Capital Cost Estimates Page ii
3 TABLE OF FIGURES Figure 1: Study Area... 2 Figure 2: RTC Boardings On... 6 Figure 3: RTC Alightings Off... 7 Figure 4: UNLV Home Zip Code Distribution... 8 Figure 5: RFG Future Vision Figure 6: All Sites Figure 7: 5 Sites Figure 8: UNLV Outreach Site Preference Figure 9: Evaluation Criteria Results - Site Selection Figure 10: Site Plan A Figure 11: Site Plan B Figure 12: Conceptual Front View (looking south) Figure 13: Conceptual Isometric View (looking southeast) Figure 14: Conceptual Station Level View (looking west) Figure 15:UNLV Public Meeting Figure 16: BRT Map Figure 17: Transit Only Mall (Denver, CO) Figure 18: Existing Tarkanian Way Roadway (looking northbound from Thomas and Mack) Page iii
4 Purpose and Need Introduction The University of Nevada, Las Vegas (UNLV) is located on a 350-acre campus just east of the Las Vegas Strip. Over 30,000 students, faculty and staff attend or work at the campus in over 220 academic undergraduate and graduate programs. The campus and surrounding areas have experienced exponential growth in recent years and enrollment numbers continually outpace projections. The original 13,000 square feet of building space on campus in 1957 has grown to over four million square feet today and future projections have that doubling to eight million square feet. The campus is surrounded on all four sides by principal arterial streets; therefore, expansion to meet future growth must occur through vertical development. On-campus student housing is extremely limited, and most students commute to classes. Parking on campus is limited, and most students park on a large surface lot near the extreme southwest side of the campus. UNLV is continuing to construct large high-rise parking structures to meet future demand; however, many students would choose to ride public transportation to/from campus if the service was more frequent and served interior destinations within the campus itself. Background The Regional Transportation Commission of Southern Nevada (RTC) is the Metropolitan Planning Organization (MPO) for the Las Vegas Urbanized Area. Also, RTC is the public mass transportation provider within Clark County, Nevada. Currently, RTC provides a number of different transit services throughout its service area, including the MAX Bus Rapid Transit (BRT) system, the DEUCE circulator bus, and the conventional bus network known as Citizens Area Transit (CAT). The RTC regional long range plan, transit development plan and several corridor-specific plans call for expansion of the successful MAX BRT service operating along North Las Vegas Boulevard. Corridors where rapid transit services are planned or under development include: Sahara Boulevard, Las Vegas Boulevard (south), Flamingo Boulevard, and Maryland Parkway. The latter will serve the UNLV campus and may terminate there, depending on access to McCarran International Airport. RTC is also investigating the possibility of rapid transit service on Harmon to serve the large City Center development on the Strip. Conceivably, this service on Harmon could be routed through the UNLV campus, provide east-west rapid transit service and connect to other north-south rapid transit lines, particularly the Maryland Parkway service. RTC has identified the UNLV campus as an area in need of improved transit service and connectivity for students, faculty, staff and visitors. Existing CAT bus routes circumnavigate the campus along the peripheral arterial roads and provide multiple stop locations adjacent to the campus; however, no service or stop locations exist within campus. Due to the rather large size of the campus, this external placement of transit stops results in walk distances averaging approximately one half mile or greater to many campus destinations. Page 1
5 BOCK ST WILBUR ST GYM DR BRUSSELS ST S MARYLAND PKWY E FLAMINGO RD SWENSON ST COTTAGE GROVE AV PARADISE RD E HARMON AV E UNIVERSITY AV E TROPICANA AV Study area boundary UNLV campus STUDY AREA MAP FIGURE 1
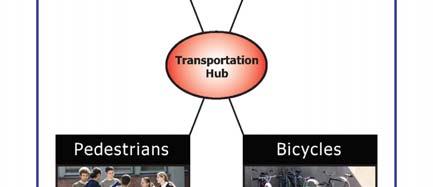
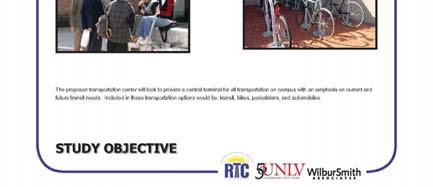
6 UNLV supports RTC s desire to improve transit accessibility and connectivity to campus and additional efforts to improve the sustainability of travel to, from and within campus. Providing increased transit mobility and accessibility to interior campus destinations will increase the attractiveness of transit for student trips. These improvements could potentially lead to a shift in travel behavior and help balance the transportation mode choice to, from and within campus. Creating a central location for all modes to come together and interface is a key component of this strategy and which is currently not provided on campus. If an RTC rapid transit service were connected to the campus, it could also serve trips to and from the Thomas and Mack Center and Cox Pavilion during special events. Typically, these events draw large crowds and could be served very efficiently by rapid transit, thus increasing overall system ridership and alleviating automobile congestion Purpose of the Current Study In recognition of the advantages of improving public transportation service to the UNLV campus and providing a terminal for interconnection of various services, RTC and UNLV commissioned this feasibility study in October The purpose of this study was to complete a transit terminal feasibility study, alternative site selection analysis, and basic conceptual layout planning for a transportation center within property owned by the University of Nevada, Las Vegas. Proposed Project (Proposed Action) Continued growth in demand for student and faculty trips to/from the UNLV campus from all areas of the Las Vegas Valley will support the investment in rapid public transportation services into and through the campus. These services will be most effective if they connect with other RTC regional services and the UNLV Campus Shuttle at a single location on-campus. The proposed action is the construction of a multi-modal transportation center at an optimum location on the UNLV campus and completion or improvement of campus roadways to allow operation of rapid transit vehicles through the campus. The site selected for the multi-modal transportation center must allow ease of walk access to important destinations on-campus and permit connectivity of north-south and east-west RTC rapid transit routes. The multi-modal transportation center and roadway improvements must be planned and designed to accommodate future RTC rapid transit vehicles, including articulated busses. Due to the constricted nature of most campus roadways, special emphasis must be given to ensure efficient and safe bus movements through the campus and at intersections. The route selected should serve key campus destinations including the Thomas and Mack Center, Cox Pavilion, and UNLV facilities within easy walking distance from University Avenue. The multi-modal facility must meet both Federal Transit Administration and RTC standards. Purpose of the Proposed Action The Proposed action offers a number of benefits to the UNLV and the regional transportation system. Among these are the following; The proposed action will improve mobility in the vicinity of the UNLV campus and the adjacent and nearby arterials roadways by providing an alternative to automobile trips, thereby reducing demand and congestion and improving the overall level of service. Construction of a multimodal transportation center at UNLV permits the connectivity of rapid public transportation routes at this location and increases mobility for transit patrons. Page 3
7 Providing rapid transit service directly onto the UNLV campus will greatly increase the transit mode share for campus trips. Increased transit use for student and faculty trips will decrease the demand for additional parking as the campus population grows, thereby saving both space and capital funds for other purposes. The proposed rapid transit service can provide an important alternative to automobile travel for special events held on campus, thereby reducing automobile congestion. Need for the Proposed Action The need for the proposed action is based on projected growth in the number of students that will commute to the UNLV campus in the future and the opportunity to serve the campus with rapid transit service planned in arterial corridors adjacent to the campus. CURRENT CONDITIONS - PUBLIC TRANSPORTATION SERVICE TO UNLV Currently, CAT provides four fixed routes that serve UNLV: Route 201 (Tropicana Avenue); Route 202 (Flamingo Road); Route 108 (Swenson Street and Paradise Road); and Route 109 (Maryland Parkway). These four CAT routes provide a relatively high level of east-west and north-south transit service to campus. Nearly all four routes serving UNLV provide 24-hour service and average headways range between 15 and 20 minutes. Table 1 below shows these service characteristics. Table 1: RTC CAT Routes Serving UNLV CAT Route Direction Span of Service Average Frequency Average Weekday Ridership Weekday UNLV Stops Estimated UNLV % of Total Line Ridership 108 North/South 22 hours 20 minutes 4, % 109 North/South 24 hours 15 minutes 14,356 3, % 201 East/West 24 hours 20 minutes 10,200 1, % 202 East/West 24 hours 15 minutes 12,163 2, % A total of 40 bus stops are provided from the four CAT routes to UNLV. A ridership analysis of these stops shows that approximately 8,300 passengers use the four fixed route services at these stop locations. This activity equates to approximately 20% of each line s total ridership. Nearly half of all this transit activity occurs at the stops located at the intersections of Maryland Parkway and Flamingo Road and Maryland Parkway and Tropicana Avenue. These intersections represent the gateway points for westbound service on the 201 and 202 routes, and northbound and southbound service on the 109. These stops also facilitate heavy transfer activity from the north-south routes to/from the east-west routes that may not necessarily be UNLV riders. Figure 2 and 3 show boardings and alightings by stop location at the UNLV stops. Page 4
8 The highest single boarding locations for the UNLV stops occurred at Maryland Parkway and Flamingo Road on route 202 s westbound service and Maryland Parkway and Tropicana Avenue on the northbound 109 service. Nearly 2,000 daily boarding occurred at these two locations from these two routes, 23% of all boarding activity for UNLV stops. The top alighting activity locations were also located at these two stops for the corresponding services operating in the opposite direction. These findings show a strong ridership market west of campus along the route 202 (Flamingo Road) corridor and north of campus on the 109 (Maryland Parkway) corridor. Appendix A shows detailed ridership for the UNLV stops. CURRENT CONDITIONS - CAMPUS TRAVEL PATTERNS While an increase in campus population will contribute to the institutional success of the University, challenges have developed in planning for this growth. One of these challenges is accommodating the future travel demands to, from and within campus for students, faculty, staff, and visitors. The predominant growth pattern that has occurred within many areas of Clark County is urban sprawl. This has resulted in a high percentage of auto use and increased trip lengths and travel times for student and faculty homecampus trips. Inadequate transit service that requires multiple transfers and travel times comparable to the automobile discourages a greater transit mode share. Planning that focuses on accommodating future auto access to the University may be unsustainable given the scarcity of land for campus development and future roadway congestion. Another factor supporting auto use is the low percentage of students living on campus and the high dispersion of students living off campus. Over 90% of UNLV students do not live on campus, resulting in its designation as a commuter campus. Figure 4 shows the home location of students living off campus by zip code. This figure shows the dispersed nature of UNLV students and the overall commute distances that support auto use. This student body settlement pattern, coupled with the surrounding sprawl development, has resulted in a high daily drive-in population to the campus. CURRENT CONDITIONS - SURROUNDING ROADWAY NETWORK The surrounding roadway network is currently designed to support high amounts of auto travel to campus. The campus is bordered by four major arterials; Flamingo Drive to the north, Tropicana Avenue to the south, Maryland Parkway to the east and the Harmon - Swenson one-way couplet to the west. These major arterials provide plentiful motorized access to campus for the surrounding neighborhoods and regional communities. Page 5
9 BOCK ST WILBUR ST S MARYLAND PKWY E FLAMINGO RD ( 202 SWENSON ST COTTAGE GROVE AV PARADISE RD ( 108 E HARMON AV GYM DR ( 109 E ( 108 E UNIVERSITY AV BRUSSELS ST ( 201 E TROPICANA AV LEGEND Bus Stop Location Bus Routes Bus Ridership Boardings º RTC CAT BUS RIDERSHIP BOARDINGS FIGURE 2
10 BOCK ST WILBUR ST GYM DR S MARYLAND PKWY E FLAMINGO RD ( 202 SWENSON ST COTTAGE GROVE AV PARADISE RD ( 108 E HARMON AV E ( 109 E UNIVERSITY AV ( 108 BRUSSELS ST ( 201 E TROPICANA AV LEGEND Bus Stop Location Bus Routes Bus Ridership Alightings º RTC CAT BUS RIDERSHIP ALIGHTINGS FIGURE 3
11 UV % 0.59% 2.1% 0.1% 0.85% « % 1.59% 1.38% 2.52% 1.03% % 2.95% 1.1% 1.33% « % 1.15% 1.07% 1.72% 0.47% 0.83% 0.4% 0.35% 0.86% 1.81% 0.85% UV % 3.75% 3.55% 0.93% 0.84% 1.92% 0.91% 0.64% 0.56% 2.79% 1.27% 1.39% 0.01% % 1.84% UNLV 1.5% 5.34% % 3.75% 0.94% 0.03% UV % 2.57% 6.28% 2.35% % 2.3% 2.03% 1.32% 0.14% 1.53% % 4.13% 0.64% 0.01% LEGEND Bus Routes 15-Mile Radius Number of Commuting Students (Per Zip Code) , % Percent of Commuting Students (Per Zip Code) º 0.06% STUDENT COMMUTERS TO UNLV CAMPUS FIGURE 4
12 CURRENT CONDITIONS - CAMPUS CIRCULATION While auto and bus access to campus may be plentiful, access within campus is primarily restricted to nonmotorized modes. Cross campus circulation in any direction for motorized modes is not possible with the current roadway network. Harmon Avenue provides the most penetration to the central campus terminating at the I metered parking lot behind the Lied Library. Other access roads from motorist on campus include University Road and Brussels Street in the southeast portion of campus and Tarkanian Way and Thomas and Mack Drive in the southwest corner of campus near the Thomas and Mack area. The majority of parking lots and structures are located on the periphery of campus, requiring motorists to switch to pedestrians once parked and on campus. This arrangement coupled with the limited internal access for motorists creates a pedestrian- and bicycle-oriented environment within campus. An interconnected series of pathways and bikeways allows a high level of circulation within the limits of the surrounding arterials roads. UNLV also provides a free campus shuttle for all student, faculty, staff, and visitors called The Ride. A total of five handicapped accessible cut-a-way vehicles are available, each with a total seated capacity of 22 passengers. One route operates in the southwest quadrant of campus, linking together a number of large parking lots including the Thomas and Mack Center lots and free lots and the Lied Library located at the central portion of campus. A total of 15 stops are available along the route that weaves approximately two and half miles through campus. The limited street network found internally on campus restricts accessibility to the academic areas of campus but does use Harmon Avenue to access the central area of campus near the library. Service on The Ride is provided year-round, but on a limited schedule during semester breaks. It operates on 8-10 minutes frequencies during the hours of 7:00 AM 10:30 PM Monday through Thursday and 7:00 AM 5:30 PM on Friday. Saturday and Sunday service is not provided and the shuttle is not in operation when school is out of session. In 2007, the shuttle carried 133,856 passengers, a 66% increase over On average this ridership equates to between riders per day. Since the service is still relatively new, the full ridership potential of the service may not be reached for a few more years. Relationship to Other Plans and Projects While the multi-modal facility should be designed to meet current needs, the ability to serve future travel needs is even more important. Considerations for future plans and projects by both RTC and UNLV are a critical step toward identifying a preferred placement of a future multi-modal hub. The ever-changing transportation and land use characteristics on and around campus makes these considerations especially important. To accommodate future regional transportation needs, RTC has identified a series of improvements to the regional transit network. The backbone of this future service is the designation of a Regional Fixed Guideway (RFG) that will connect the communities of Henderson, Las Vegas and North Las Vegas with the Las Vegas Resort Corridor. The system will consist of rubber tire transit vehicles integrated with the following elements to create a rapid transit system: Level platform boarding Page 9
13 High capacity vehicles with multi-door access Dedicated running way Off-board fare collection Specially designed and branded stations and platforms. The proposed alignment of the RFG is shown in Figure 5. This future line haul transit network will be supplemented with a series of Bus Rapid Transit (BRT) routes that will feed into the system at critical nodes. Among these BRT routes proposed for future consideration are the Flamingo (east-west) and Maryland Parkway (north-south) routes, both of which run adjacent to UNLV. Harmon Ave, another east-west corridor just south of Flamingo, has also been considered by RTC staff which would directly link Westside neighborhoods, the City Center 1 project, the Las Vegas Strip, UNLV, and neighborhoods to the east. As earlier stated, UNLV is expected to nearly double its on-campus building square footage while not increasing in total land area. In order to accomplish this, UNLV must develop more vertically in a true urban style, and develop all available, underutilized or vacant land.. As the University intensifies its development on-campus, adjacent properties along the border arterials are also expected to densify and take on a more urban form. This development is likely to involve mixed-uses including residential, commercial, and expanded retail. Three future UNLV projects that will likely interface in some way with the future multi-modal terminal are: The Maryland Parkway Midtown Project Tropicana Parking Structure University Road Extension The Midtown Project located along Maryland Parkway is anticipated to significantly change the eastern gateway to the campus and a large stretch of the streetscape between Flamingo and Tropicana. The development east of Maryland Parkway will include primarily mixed-used facilities incorporating commercial and residential units. The streetscape will be transformed to be more pedestrian friendly and encourage transit use. Options are currently being explored for dedicated transit lanes along this stretch of Maryland Parkway. The Tropicana Parking Structure is in its initial stages of design and construction. Phase 1 of the structure will occupy the northern portion of the Red Lot and include nearly 1,000 spaces on five levels. This project is expected to be in operation by the end of Phase 2 of the structure will be located on the southern portion of the Red Lot and be equal in size. A direct connection is expected to be included that would link these facilities and allow circulation between the two structures. UNLV has protected right-of-way for a future extension of University Road that would connect to Tarkanian Way and the surface parking lots just south of the Thomas and Mack Center. This new roadway would be the only interior road that would traverse through campus. Although not fully defined, passage along this new roadway would likely be limited to transit and service/emergency vehicles only. 1 The City Center project will include 4,800 hotel rooms, 2,650 residential units and approximately 500,000 square feet of retail, dining and entertainment space. Page 10
 RTC FUTURE VISION: TRANSIT SYSTEM MAP")
14 Source: RTC Transportation Improvement Program Fiscal Year (page 70) RTC FUTURE VISION: TRANSIT SYSTEM MAP FIGURE 5
15 Development and Evaluation of Alternatives The process used to identify and screen potential transit hub locations included five steps and resulted in the following outcomes: Step 1: Identification of All Potential Sites (Total Sites = 13) Step 2: Opportunities and Constraints Screening (Total Sites = 5) Step 3: Public Outreach #1 (Total Sites = 5) Step 4: Evaluation Criteria Screening (Total Sites = 3) Step 5: Circulation and Operations Analysis (Total Sites = 1) These steps were carried out together with the Technical Working Group (TWG) which consisted of representatives from RTC, UNLV, Clark County and the consulting team. This group met formally every month along with special meetings as deemed necessary by the project team. This process began in November 2007 and concluded in November 2008 with selection of a Locally Preferred Alternative (LPA). Below is a brief summary of the actions taken at each TWG meeting. 12/14/17 Kick-off meeting to formalize study scope and identify role of TWG 02/01/08 Development of Alternatives 03/19/08 Outreach #1 Results (public scoping session) and Screening of Alternatives 04/17/08 Initial conceptual site plans for screened alternatives 05/21/08 Refined site plans for screened alternatives and selection of TWG preferred site 11/06/08 Final concept for LPA The time spent between May of 2008 and November of 2008 was spent meeting with various parties from UNLV and RTC to receive the needed support for the TWG s preferred site. Full support of this selection by all parties resulted in the identification of the LPA and the development of an interlocal agreement. Step 1: Identification of All Potential Sites The first meeting of the TWG presented the existing conditions results summarizing the current transit service and relevant planning activities in and around campus. The group was then asked to identify all potential locations for the transit hub facility on a blank aerial map of the campus. A total of 13 sites were identified and grouped into seven sites based on their location within campus. These sites are shown in Figure 6. Step 2: Opportunities and Constraints Screening The 13 sites were then analyzed to determine major opportunities and constraints associated with placing a transit facility on that location. This process was completed at the second the TWG meeting with input from all representatives. Factors considered in this process included distance from the center of campus, access to existing transit services and availability of land. Site alternatives were filtered and repackaged down to five options which are shown in Figure 7. Page 12
16 MARYLAND PKWY FLAMINGO RD Hotel (Teaching) 5A Saltman Student Housing 5 SWENSON ST Eng. 4B Midtown TOD 4 4A 6 7 Student Union 3A 3 Greenspan Urban PARADISE RD 3B 2 1A New Garage 1 TROPICANA AV UNLV wants to move signal INITIAL SITE ALTERNATIVES FIGURE 6

17 Swenson St. Maryland Pkwy. Flamingo Rd. Alternative Location 4 Lied Library Alternative Location 5 Paradise Rd. Alternative Location 3 Thomas & Mack Center Alternative Location 2 Alternative Location 1 Tropicana Ave. LEGEND RTC BUS ROUTES Campus Shuttle RTC Bus Stops Transit Facility Alternative Locations PROPOSED RTC ROUTES Flamingo BRT (proposed) Harmon BRT (proposed) Maryland Parkway BRT (proposed) SITE ALTERNATIVES FIGURE 7
18 Step 3: Public Outreach Meeting 1 The five site alternatives identified in Step 2 where then taken to the public for input and comment. This public outreach process served three primary functions. First, it asked campus users where they reside and how they commute to campus. Second, it allowed users of the campus to identify the features they would like to see in a future transit facility. Third, it allowed input on a desired location of the facility. One page questionnaires, along with five poster boards, were used to obtain this input. These materials are shown in Appendix B. To receive this input from the UNLV population the project team, including representatives from RTC, UNLV and the consultants, held a two day event at the UNLV Student Union. The event was publicized on the RTC website, in the UNLV student paper and through flyers distributed around the campus. Five poster boards were created to give participants background information on the study and nature of a transit facility. A questionnaire was also developed to obtain valuable input from the participants. In total, over 50 respondents shared their thoughts and concerns with the consulting team. Each participant spent between minutes with the team member, providing a great deal of useful information to be carried into the next step. Question 10 on the survey asked students to select the most appropriate location of a future transit facility from the five sites identified in Step 2 and shown in Figure 7. The results from this question are shown in Figure 8 and indicate Sites 1, 2 and 5 as favorable and 3 and 4 as unfavorable. The complete survey results can be found in Appendix B. Figure 8: UNLV Outreach Site Preference # of Responses Site # Page 15
19 Step 4: Evaluation Criteria Screening The five site alternatives along with the results from the Student Survey where taken to the third TWG meeting. This meeting asked the group to screen and select the top three sites based on a series of evaluation criteria. These criteria were developed to support the future planning efforts of the RTC and UNLV, while observing the overall feasibility of implementation of the project. Twenty-one different criteria were assigned to four general categories including: Connectivity Integration with Surroundings Implementation Sustainability (Community and Campus) Operational Considerations Appendix C provides a description of each of the 21 criteria. This meeting was an interactive session and allowed the TWG to assign scores and weighting to each of the criteria. The results of the scoring and weighting of each site is shown in Appendix C. Figure 9 shows results of this process and show Sites 1 and 2 as the top ranking sites. Figure 9: Evaluation Criteria Results - Site Selection Score SITE 1 SITE 2 SITE 3 SITE 4 SITE 5 Discussion at this meeting also identified Site 5 as infeasible due to development constraints and recent proposals for future transit operations along Maryland Parkway that would significantly constrain the development of a facility on this site. In addition, Site 1 was expanded to the east to include the areas surrounding the roadway between the Student Services Building and the Student Recreation Center. The final two sites, sites 1 and 2, were then carried forward to the next step of analysis. Step 5: Circulation and Operations Analysis Three concepts for each site were taken into step five and assessed to determine the transportation circulation impacts and the transit operation impacts on the site alternatives. This analysis took into account the operations of transit, personal automobiles, campus/commercial vehicles, bikes and pedestrians. This analysis was primarily qualitative, examining locations where these modes were in conflict with each other and how accessible each of the sites would be for existing and future transit operations. A detailed traffic study was performed on the preferred alternative and is described in the section to follow Page 16
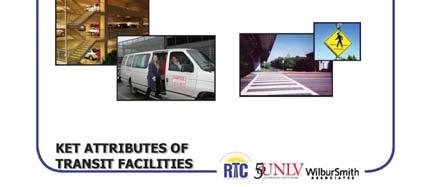
20 TRANSIT CENTER DESIGN SPECIFICATIONS Preliminary design requirements were identified for existing, 2015, and 2030 operating conditions during this step of the Alternatives Analysis process. Table 2 shows the number of peak hour buses using the facility under the existing (2008), 2015, and 2030 conditions. Based on five minute headways for UNLV shuttles and 5-10 minute headways on RTC services, the facility should accommodate up to 12 and 26 buses per hour, respectively. Table 2: Anticipated Transit Center Service (Near term and Future) Peak Direction Buses Off Peak Direction Buses Service Type 7 AM - 10:30 PM 10:30 PM - 7 AM Operator Route Name UNLV "Ride" Through Headway (minutes) Subtotal UNLV RTC Harmon Express Through Headway RTC Maryland Pkwy Express Terminating Headway RTC "Zoom" Through Headway Subtotal RTC Based on the 2030 estimates for peak hour buses and arrival/departure patterns of these vehicles, the facility design should support six berths. Table 3 shows the assumptions made to arrive at the future requirement of six berths. Page 17
21 Table 3: Bus Berth Estimates 2008 Service Type Inbound / Outbound Max Buses Dwell Time / Bus (min) Buses / Berth / Hr Inbound Berths Outbound Berths UNLV Through Harmon Through Zoom Through Maryland Pkwy Terminating Total Service Type Inbound / Outbound Max Buses Dwell Time / Bus (min) Buses / Berth / Hr Inbound Berths Outbound Berths UNLV Through Harmon Through Zoom Through Maryland Pkwy Terminating Total Total Berths Total Berths 2030 Service Type Inbound / Outbound Max Buses Dwell Time / Bus (min) Buses / Berth / Hr Inbound Berths Outbound Berths UNLV Through Harmon Through Zoom Through Maryland Pkwy Terminating Total Conservative estimates were used for the type of fleet using the facility. All RTC berths were designed to accommodate 60 articulated vehicles and all UNLV berths were designed to accommodate 40 vehicles. Based on the flexibility of the design, a parallel curb design was selected for the facility. Independent arrival/departure of vehicles was also included. Space to layover vehicles was not a requirement of the design but was added where available. TRANSIT CENTER LAYOUTS Step four took the final two sites alternatives forward to the layout phase to gage the interaction of transit and the future roadway network. This step in the assessment process took into account right of way constraints, existing and future traffic control and circulation, bike and pedestrian access and connectivity with the rest of campus including future structures. Total Berths Page 18
22 Design schemes for both of the sites went through an iterative process before final concepts were agreed upon for each location. The first phase on concepts looked at how a transit facility would interface with the existing and future roadways and facilities on campus. Designs were explored that had the facility integrated with future UNLV facilities and those that were independent of future facilities. This resulted in seven concepts on the two sites as shown in Appendix D. These seven concepts were discussed at the fourth TWG meeting and opportunities and constraints were identified for each. The most critical concerns with the initial concepts were as follows: Shared use of the facility with the future parking structure on both sites would force the need for a two hour separation without sprinklers or a one hour separation with sprinklers. A transit facility on site 1 should allow for either a western or northern entry to the future garage. Recent development of a surface lot would not allow a bus bay on the north side of University (site 2) Based on the TWG comments, the seven concepts were then reworked into five alternatives. Two concepts were developed for Site 1 with one showing a western entry to the new parking structure and the other showing a northern entry. Alternative roadway configurations were designed for Site 1 which took into account the existing network and future UNLV planning projects. Two concepts were also developed for site 2 which showed two entry alternatives to a future parking structure directly south of a multi-modal facility. One concept was developed for Site 1D. These five final alternatives are included in Appendix E. Page 19
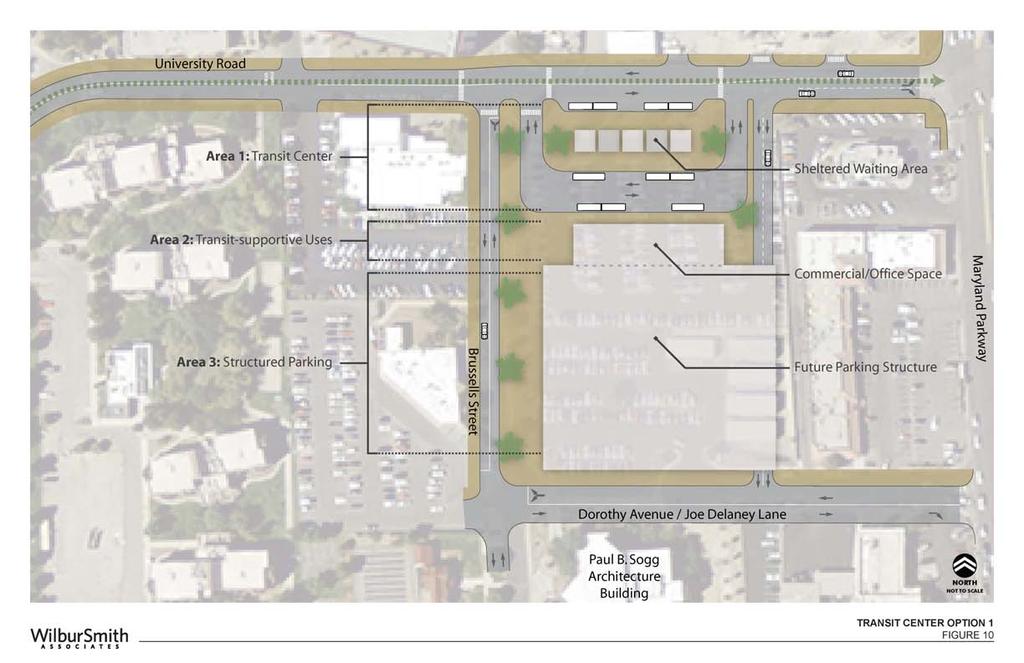
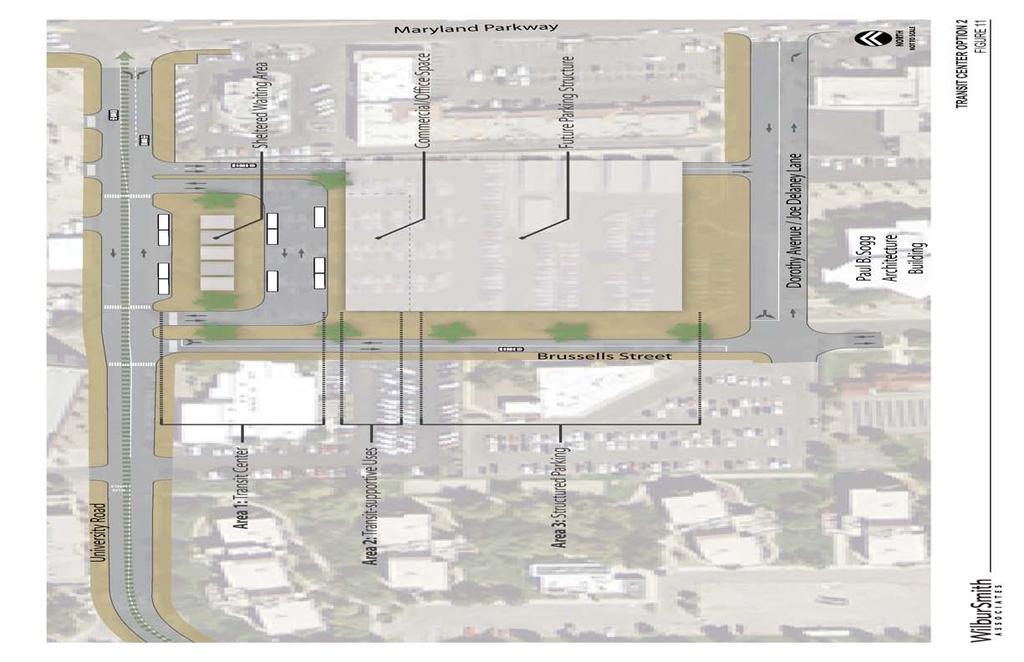
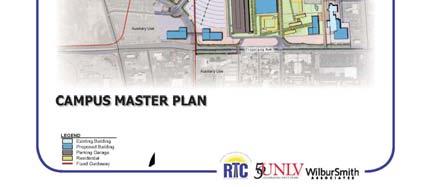
23 Selection of the Locally Preferred Alternative (LPA) The alternatives analysis task identified five transit facility concepts on two different sites within the UNLV campus. These concepts for Sites 1 and 2 were presented at the 5th meeting of the TWG along with advantages and disadvantages of each. Concepts for Site 1 were eliminated due to the concurrent planning efforts of a parking facility on that footprint and the complexities and limitations that design provided to a dedicated transportation facility. The decision to include a bus pullout adjacent to the new parking structure at Site 1but use Site 2 as a dedicated transportation hub gave this location the preferred site status. This selection was discussed and shared with upper RTC management and the Vice President and President of UNLV at follow-up meetings and agreement was reached by all parties. In the end, Site 2 was selected based on a number of factors. Site 2: Rated high in transit connectivity and had the least impact on rerouting of existing RTC and UNLV transit services. The site allows the most convenient transfer location for east/west (future Harmon service) and north/south (existing 109 and future 109 express) RTC services. The site s location on the eastern edge of campus makes it a natural turnaround location for UNLV campus shuttle vehicles. Rated highest in conformity with adjacent development and conformity with the existing surroundings. The site does not contain any existing facilities or near-term plans for facilities. Has maximum shared-used potential with future UNLV facilities and parking structures. The existing parking use can easily be transferred to a structure facility integrated in a future phase of development. Rated best in terms of bike and pedestrian connectivity. The site is less than a quarter mile to the heart of campus and no more than a half mile from all main campus facilities Has an available footprint to accommodate all future needs of the transportation facility. The site allows adequate space to accommodate all future transit and transportation service and potential layovers for transit vehicles. Conceptual Site Plan A conceptual site plan was then developed for Site 2 to better understand the feasibility of design and operations at the location and to identify any potential impacts such as traffic circulation that this location may present. Using the transit center design specifications identified in the previous section, a twodimensional site plan and three-dimensional concept sketch was developed. The site plan developed as part of the multi-modal transportation hub project includes three parts: The transit facility including bus loading/unloading areas and passenger wait areas Interior transit facility to include transit-supportive uses A future parking structure for approximately 1,000 vehicles. The transit facility would be controlled by RTC and used by both RTC and UNLV services. The interior space would also be controlled by RTC with shared occupancy by UNLV. The future parking structure would be a separate UNLV project likely completed as a future phase when funds become available. Figures 10 and 11 show the conceptual site plan with various options for the structure parking and interior transit space on the south portion of the site. This transit facility plan shows the island transit center design Page 20
24 with a parallel curb along University Drive and another parallel curb loading zone to the south with available interior space. This interior space shown adjacent to the south curb loading area could be flexible in its use but would likely contain transit-supportive uses operated by either UNLV or RTC. Preliminary thoughts for uses of this space include: Office space for UNLV transportation services and campus security Bike station including covered storage for bicycles, maintenance or self repair area, and/or locker and showering facilities. Commercial/retail uses such as coffee shop, juice bar, convenience store or newsstand Interior internet hot-spots with wireless connections and computer workstations to allow waiting passengers to check and browse the internet Current UNLV master planning activities envision a future parking structure on this site. This was originally planned for the northwest corner of Maryland Parkway and University Dr (north of Site 2) in the 2004 UNLV Campus Master Plan but was relocated later following the development of the Greenspun Building on this site. Structured parking is viewed as a complimentary use for a transportation facility but would be constructed as its own project. However, the conceptual design of the transportation facility was done in such a way as to accommodate this future structure and circulation to and from the facility. Figures 10 and 11 provide two options for integrating the transit facility, the interior transit-supportive space and the structured parking facility on the same site. Figure 10 shows the interior space detached from the structure but adjacent while Figure 11 shows a completed integrated design. International building code does require a two hour separation of these uses if no sprinklers are provided in the parking structure or a one hour separation with sprinklers which will need to considered when selection of a final concept is done 2. It is assumed that either concept would allow the interior transit space to be built along with the transit facility in one phase of development and a second phase to be complete at a future time which would include the parking structure. Figures show three dimensional views of the conceptual layouts. These images do not necessarily accurately depict architectural styles and landscaping concepts but do show relative size and scale of the facility in the context of the existing surroundings IBC, Sections 302, 406 and 508. Page 21
25
26
 Figure 13: Conceptual Isometric")

27 Figure 12: Conceptual Front View (looking south) Figure 13: Conceptual Isometric View (looking southeast) Figure 14: Conceptual Station Level View (looking west) Page 24

28 Public Outreach Meeting 2 The conceptual site plans were presented at an open house session held on December 4 th, 2008 in the Student Union on the UNLV campus. Representatives from RTC, UNLV and the consulting team where on hand to discuss the site plans and answer questions that were raised by the general public. In total over 30 participants spent time reviewing the poster boards and interacting with the project team on the concepts. Feedback obtained at this session was mostly positive and support was received for the conceptual plan but also for increased transit service to the campus. Figure 15 UNLV Public Meeting 2 Anticipated programming associated with the project was also discussed with participants including future operations, future vehicle specifications and fare medium. Strong support was received for an integrated transit pass to the student ID which would allow the ID to function as a flash pass. The class pass program which would allow free transit rides through fees collected during registration was also strongly supported. Operational improvements including improved frequency and more reliable service was mentioned by participants as a real need within the existing service. The articulated MAX vehicle shown on the display materials was also widely accepted as an attractive vehicle for the service. Page 25
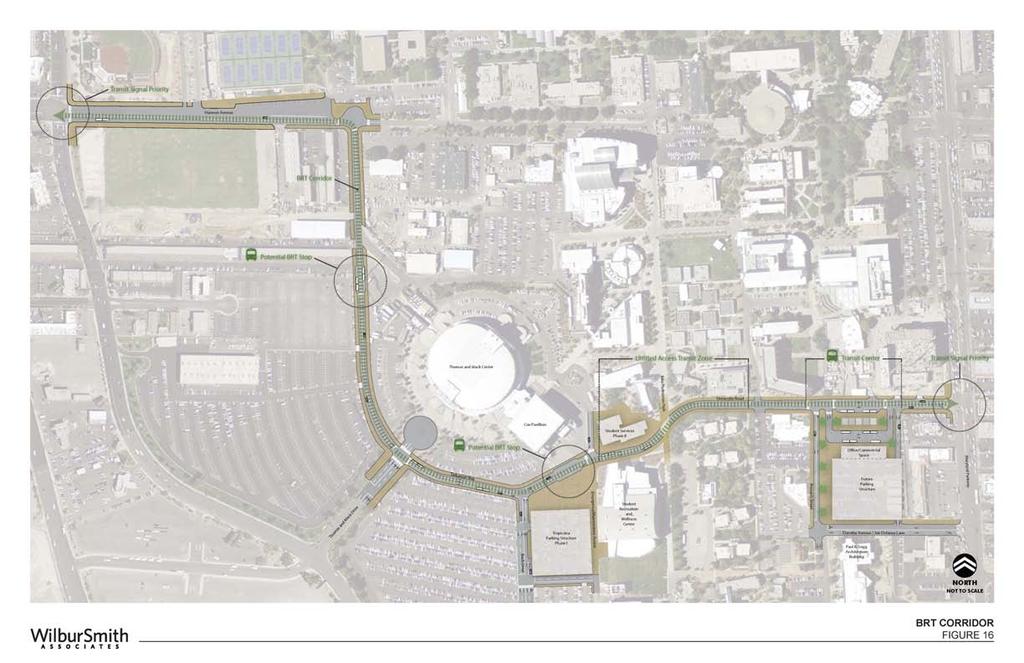
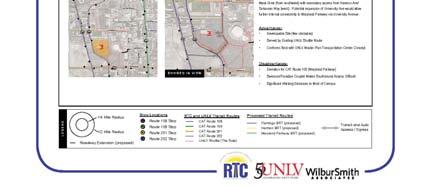
29 Implementation Plan Following identification of the locally preferred alternative, the following steps were taken to identify steps leading toward implementation of the facility and rapid transit service to the UNLV campus. RTC UNLV Interlocal Agreement During the period June-September 2008, a series of meetings was held between senior management of RTC and UNLV to validate the selection of the preferred route for RTC rapid transit service through the campus and the selection of Site 2 as the preferred location for the multimodal facility. These meetings culminated in general agreement on the cooperative steps necessary and in a formal interlocal agreement between RTC and UNLV to cooperate in developing the rapid transit service and the multimodal center. Campus Improvements Needed for Rapid Transit Service To allow RTC service to operate a rapid transit service on campus, a number of improvements are needed independent of the multi-modal hub. Figure 16 shows the proposed alignment of a rapid transit service that would operate on campus and identification of the on-campus improvements. These improvements include: The extension of University Road through campus Establishment of bus stops on campus Roadway improvements along Tarkanian (between Harmon and Thomas and Mack). In addition, a number of other measures would be desirable to implement but are not absolutely critical to the operations of the service. These include: Traffic signalization improvements at Swanson and Harmon and Maryland Parkway and University Establishment of a class pass program between UNLV and RTC Add real-time bus tracking technology to UNLV transit services Improve bike access to and around campus. UNIVERSITY AVENUE EXTENSION The existing University Road on campus terminates just east of the Student Services Complex and does not provide through-campus access. The proposed rapid transit corridor would need to traverse campus from east to west. University Road is the likely connector and right of way has been preserved by the university to allow this extension to occur. Since this extension would traverse through a heavy pedestrian and bike activity area on campus, it is proposed to limit access along this extension to only transit and university service vehicles. This would allow the area to retain its friendly environment for non-motorized travel. UNLV should consider special paving treatments to retain the welcoming environment for pedestrians and cyclists. The new roadway should have more of a mall feel than a roadway environment. The 16 th Street Mall in Denver is a good example of how high volume, low speed transit can co-exist with pedestrians and cyclists. Page 26
30


31 Figure 17: Transit Only Mall (Denver, CO) ESTABLISH BUS STOPS ON CAMPUS In addition to the multi-modal transit hub, UNLV will likely need one or two additional bus stops on campus to allow students easy access to all UNLV destinations. Figure 16 shows two appropriate locations for bus stop placements which include one just north of the new Tropicana Parking Structure and one just west of Thomas and Mack along Tarkanian Way. These stops should be designed consistent with RTC s bus design guidelines and accommodate articulated buses. ROADWAY IMPROVEMENTS ALONG TARKANIAN Tarkanian Way between Harmon and Thomas and Mack is designed as a drive lane through a parking lot. It is recommended that improvements occur to this section to improve the safety of pedestrians and transit operations. The first improvement includes removal of the existing speed humps which conflict with transit operations. The existing speed humps act to control speed through this corridor and their removal will need to be offset with additional traffic calming. It is recommended that the roadway through this section be redesigned to reduce the width of the drive lanes and incorporate curb and gutter and a landscaped median. This treatment could be completed without major impacts to the existing parking due to the significant right of way on the exiting roadway. Page 28

32 Figure 18: Existing Tarkanian Way Roadway (looking northbound from Thomas and Mack) TRAFFIC SIGNALIZATION IMPROVEMENTS Transit operations entering and exiting campus will do so at two signalized intersections. These intersections handle high volumes of traffic resulting in significant delay and wait times for traffic. To assist the transit operations entering and existing campus, traffic signal priority (TSP) should be added to these signalized locations. TSP would allow the transit vehicle to extend or activate an early green phase when approaching a given intersection, thus reducing delays due to signalization. ESTABLISH A CLASS PASS PROGRAM UNLV and RTC should explore an arrangement that would allow all students and staff to pay a small fee to receive free transit passes on all RTC services. Similar programs across the county which are often termed class pass programs typically add a small fee to all student registration fees which spreads out the cost of providing service to the larger student body population. The free transit pass adds incentive to ride RTC services and makes the travel option less expensive than the driving alternative. ADD REAL-TIME BUS TRACKING TECHNOLOGY TO UNLV SERVICES Typical transit riders in campus settings such as UNLV are well educated riders with a high level of access to technology. Providing real-time bus tracking will allow riders to accurately predict arrival and departure of RTC services on the UNLV campus. This information should be displayed both at the stops using dynamic display boards and available online. Online services would be available for students to access transit arrival information via a handheld device or on a personal computer. IMPROVE BIKE ACCESS TO AND AROUND CAMPUS The future multi-modal transit hub will likely include space for bicycle storage and amenities for cyclists such as a repair facility and showering facilities. To encourage use of this mode to campus, improvements should be made to the existing bicycle network on and off campus. Currently, bike lanes are only provided on roadways to campus from the south and the east. Those accessing campus from the north and west are forced to battle high volume roadways that are dangerous for cyclist. Page 29
33 On-campus use of bicycles should also be encouraged and a plan should be complete for accommodating this mode on campus. This plan should include additional and improved storage facilities such as bike lockers. All RTC buses serving UNLV should also be equipped with the maximum number of bicycle racks. Capital Cost Estimate RTC has indicated a desire to apply Section 5307 formula funds to complete the project. Accordingly, and to facilitate the budgeting process, the consultant team prepared a planning level cost estimate to complete the necessary roadway improvements for safe and efficient rapid transit service and to complete the shareduse multimodal facility structure. The construction costs estimates were based on common quantities in roadway projects including the quantities that commonly carry the majority of the cost associated with roadway construction such as pavement. Other items that are not major costs, or can not be estimated without further design, are handled on a contingency. Unit costs are based on research of past construction projects and then applied to the quantities. Once the major construction has been addressed the contingency is added along with nonconstruction such as design (plans), environmental and administrative costs. The sum of these costs with the actual construction cost becomes the preliminary construction cost estimate. This estimate does not allocate the costs identified to either RTC or UNLV; rather, it is a summation of typical costs for comparable facilities based on current year (2008) materials and labor. This cost estimate is sufficient for capital programming at approximately a 75% level of confidence based on current year dollars. It should be updated for current labor and material costs based on a more complete design and year of expenditure (YOE) dollars in the future. The total capital cost estimate for both the Multi-Modal Transit Hub and the necessary roadway improvements on campus is estimated to be $6.8 million. A breakdown of these costs by quantity is included as Appendix E. MULTI-MODAL HUB The multi-modal facility costs include the cost to construct the off-street bus loading area, passenger waiting area and interior transit center space. The transit center includes approximately 6,336 sq. feet of interior space to be used for transit-related uses. The estimated cost of this facility including all roadway improvements for the off-street facility is estimated to be approximately $4.3 million. ROADWAY IMPROVEMENTS The roadway improvements for the UNLV RTC Center are made up of upgrades to the existing roadway system and some new roadway construction. The cost estimate was divided into four areas: Area 1: Harmon Ave and Tarkanian Way - Tarkanian Way and Thomas and Mack Drive Area 2: Thomas and Mack and Tarkanian Way including the intersection to the new student Center Area 3: Tarkanian Way from the new student center to existing University Road Area 4: University Road improvements up to Maryland Parkway Area 5: Brussels between University Road and Joe Delaney Drive There were no anticipated roadway improvements necessary between Harmon and Swenson and Harmon and Tarkanian Way. Page 30
34 Area 1 improvements were an upgrade curb and gutter section with sidewalk to separate it from the parking lots. Area 2 has the same improvements as Area 1. Area 3 has some of the same improvements seen in areas 1 and 2 but also include the new roadway construction to make the connection to existing University Road. Area 4 is a mill, overlay and restriping of existing University road. Area 5 includes roadway construction to add a travel lane along Brussels. The estimated cost of all on-campus roadway improvements associated with the project is estimated to be approximately $2.5 million. Page 31
35 Appendix A: Detailed Stop by Stop CAT Ridership (UNLV Stops) 108 Route Stop Location Ons Offs Total Swenson & Tropicana NB SB Swenson & Naples Swenson & Harmon Swenson & Embassy Suites Swenson & Schwartz Swenson & Flamingo Total NB Paradise & Flamingo Paradise & Hard Rock Paradise & Harmon Paradise & Naples Paradise & Tropicana Total SB Total ,688 0 Route Stop Location Ons Offs Total Maryland & Tropicana ,137 Maryland & University NB Maryland & Harmon Maryland & Rochelle Maryland & Flamingo ,380 Total NB 2, , SB Maryland & Flamingo (nearside) Maryland & Flamingo (farside) Maryland & Cottage Grove Maryland & Harmon Maryland & University Maryland & Tropicana Total SB 788 2,299 3,087 Total 109 3,117 3,186 6,303 Page 32
36 Route Stop Location Ons Offs Total Tropicana & Paradise Tropicana & Swenson Tropicana & Wilbur Tropicana & Maryland ,063 Total EB ,454 EB WB Tropicana & Maryland ,223 Tropicana & Thomas & Mack Tropicana & Swenson Tropicana & Paradise Total WB ,583 Total 201 1,479 1,558 3,037 Route Stop Location Ons Offs Total Flamingo & Paradise Flamingo & Palo Verde Flamingo & Swenson Flamingo & Claymont Flamingo & Maryland ,355 EB WB Total EB 1,173 1,572 2,745 Flamingo & Maryland 1, ,396 Flamingo & Cambridge Flamingo & Swenson Flamingo & Palo Verde Flamingo & Paradise Total WB 1,631 1,147 2,778 Total 202 2,804 2,719 5,523 Page 33
37 Appendix B: Public Outreach Materials Survey (front and back) Page 34

38 Display Board #1 Page 35

39 Display Board #2 Page 36

40 Display Board #3 Page 37
41 Display Board #4 Page 38

42 Display Board #5 Page 39

43 Survey Results: Q1: Please enter your home zip code. Page 40
44 Q2: How many trips do you make to campus each week? Weekly Trips 20 Responses Number of Trips Q3: Considering your trip to campus today, please check the mode you used: Mode Split 16% 4% Drove Alone Carpooled 8% Transit Walked 72% Page 41
45 Q6: What was your primary reason for choosing the mode of travel selected in Question 3? Drove Alone I need to trip chain during the day (drop off kids, go to work off campus, etc.) Convenience/Speed Carpooled Save money and gas Ease I live with other students Transit Don t own car Gas prices Traffic conditions Walked Can t drive (disabled) Live on campus Q8: Have you ever taken the bus to campus? If yes, which routes? Bus Use To Campus Past Bus Use 73% 27% Have Used Have Not Used Route Number Q9: If you currently do not take transit to campus, are there ways to improve tor enhance service where you would consider using it regularly? If so, please list. More direct routes currently too many transfers Faster, more reliable service More information on routes More internal bus circulation reduce walking distance to final destinations on campus Introduce light rail Page 42
46 Q10: Based on the campus maps your use of campus, which site selection seems the most appropriate for a multimodal transit facility? S ite Location Preference Q11: Please indicate certain amenities or features that you would like to see incorporated into a multi-modal transit facility that would improve you commute to and around campus. Real-time next bus information Seating Ticketing Machines Food (donuts/coffee, snack vending machines Adequate lighting, blue light security phone Secure bike storage Bike library system Wi-Fi / computer work stations Climate control Taxi stand Page 43
47 Appendix C: Evaluation Criteria Summary, Scoring and Results CONNECTIVITY Transit Connectivity (RTC/UNLV): Transit Connectivity refers to the ability of the facility to allow transit passengers to easily transfer between transit operations including any of the RTC routes and the UNLV campus shuttle. Ultimately, the facility s location should allow a seamless transfer between these transit services. Pedestrian Access: The facility should be located within an easy walk of most major trip generators on campus. Typical walking distances range from ¼ mile to ½ a mile depending upon the user and external environment conditions. Bike Access: Bikes are a key part to a multi-modal network and their consideration is important to the design of the facility. Its location should be accessible for bicyclists who choose to store their bikes in a possible locker facility or allow those who bring bikes onboard the transit vehicle to access other areas of campus. Distances typically considered comfortable for biking are higher than average walking distances. Park and Ride Potential: A true multi-modal facility would accommodate the potential to have parking adjacent to the transit, bike, and walk modes designed for at the facility. An integrated design could strengthen the utilization of the facility and reduce overall construction costs. Connectivity with Monorail (potential future extension): The existing Las Vegas monorail system currently terminates at the MGM Hotel and Casino on Las Vegas Boulevard and Tropicana Avenue at the southern edge of the strip. Future expansion plans for the system show it continuing south and connecting to the McCarran Airport, with a potential station at or near the UNLV campus. Opportunities to have connectivity to the monorail are dependent upon the project s implementation and the selected alignment. INTEGRATION WITH SURROUNDINGS Conformity with Existing Surroundings: The existing surroundings of the selected site needs to conform with and support the proposed use of the multi-modal facility and result in minimal land use conflicts. This includes noise, traffic control, air quality, and any other disruptions that may be attributed to the proposed facility. Conformity with UNLV Master Plan: The UNLV Master Plan calls for significant change and development in the years to come and the placement of this facility should be an integral part of this plan. Conformity with Adjacent Development: As UNLV continues to expand, development surrounding the campus will also experience change. Site selection should conform with any development that is proposed adjacent to the campus. Patron Safety: The placement of the facility should ensure adequate patron safety, especially during offpeak hours on campus. While many design qualities of the facility can improve the safety qualities, the location itself plays a significant part in the perceived safety for potential users. Page 44
48 IMPLEMENTATION Time Required to Implement: Different site alternatives could result in different development schedules. Any empty/underutilized location may allow a facility to be constructed in a shorter duration than a site with an existing use present. Integration of the facility into other development plans and projects may also result in a lengthier development schedule or a phased construction. Environmental Permitting: The selected site should be able to pass environmental clearance to allow the construction of the facility in a timely manner. Physical Size of Footprint: The selected site should allow adequate room for the required components of the facility. The facility will need to be able to accommodate both the RTC fleet and UNLV campus shuttles at the facility. While detailed estimates for the total number of bays are not finalized, the footprint should be able to accommodate multiple vehicles without impacting circulation. Cost: The associate cost of the facility (dependent upon its location) is based on the improvements to the site and the removal of existing facilities. In general, an empty site would be less costly to build than a site with an existing facility in place. Shared-Use Potential: Based on the future projections of the campus Master Plan, a multi-modal site selection that is within a walkable distance to the internal campus area should maximize the use of the land in which it occupies. A vertical design that would allow other transit-supportive uses to occupy the same facility or one directly adjacent would be desirable for the University and users of the facility. SUSTAINABILITY (COMMUNITY AND CAMPUS) Supports Transit Ridership by UNLV Students/Staff: The selected site should be located in a manner that supports an increase in transit ridership. This can be achieved in a number of different ways including bringing passengers closer to their trip origins/destinations, improving efficiency of transfers, improving overall comfort of the transit riding experience and improving mobility options throughout campus. Supports Bike/Pedestrian Activity by Students/Staff: Walking and riding bikes are feasible mobility options in campus and high-density environments. These modes are also among the most sustainable options of transportation. Enhancing the experience of bikers and pedestrians and promoting use of these transportation options should be considered in the selection of the facility s placement. Safety of these users is also a significant factor in its placement. The ability for the facility s location to minimize conflict between vehicles and pedestrians/cyclists should be assessed during the planning stages. Promotes Non-Motorized Access to UNLV by Non-Students/Staff: The UNLV campus is used not only by students and staff but also by the greater Las Vegas community. The Thomas and Mack center hosts a number of large events that bring outsiders to the campus primarily during the weekend or off-peak campus hours. The proposed location of the facility should take the transportation needs of this population and other non-unlv students/staff into consideration. OPERATIONAL CONSIDERATIONS Ease of Access and Egress for Transit: The location of the facility should accommodate a relatively high volume of transit vehicles to easily navigate from the surrounding arterials to the facility. Turning radii for all transit vehicles, including articulated and double-decker vehicles should be considered. Impacts on Traffic Network: The preferred site location should minimize conflict with the traffic network by providing adequate space for off-street bus bays. Additional signalization that is required to accommodate Page 45
49 new transit or auto movements to the facility also could potentially reduce the performance of the traffic network. Rerouting of Existing RTC Transit Operations: There are currently four routes that serve the UNLV campus (108, 109, 201, 202) and three possible future BRT routes are proposed to run along Flamingo, Harmon and Maryland Parkway. Minimizing deviation of the existing routes proposed to serve the facility should be considered. Rerouting of Existing UNLV Transit Operations: Currently, UNLV campus shuttles operate primarily in the southwest corner of campus and serve the larger parking areas. Expansion of campus transit service is restricted by the limited internal roadway network on campus. Facility placement may impact the operations of this service which should be considered during the site evaluation stages. Page 46
50 Appendix D: Traffic and Circulation Analysis The UNLV Multi-Modal Hub project is anticipated to have relatively minor environmental impacts. Due to the nature of the project, traffic and circulation will be affected under project conditions, and thus a traffic and circulation study was completed to determine if any significant impacts would occur as a result. Study Area The study area defined for the traffic and circulation analysis included five study intersections located in the vicinity of the proposed project. Figure D1 shows the locations of these intersections. STUDY INTERSECTIONS The following provides a brief description of the study intersections. 1. Harmon Avenue/Swenson Street intersection is a four-way signalized intersection. The eastbound approach along Harmon Avenue has a left turn lane, with a storage length of about 100 feet, and two through lanes. The westbound approach has a through lane and a shared through-right lane. Along Swenson Street, the northbound approach is one-way and has three left turn lanes, one through lane, and one shared through-right lane. The southbound approach has a left turn lane and two right turn lanes. 2. Harmon Avenue/Tarkanian Way intersection is a three-way unsignalized intersection. The northbound approach along Tarkanian Way is stop-controlled and has a shared left and right turn lane. Along Harmon Avenue, the westbound approach has a shared through-left lane. Te eastbound approach is stop-controlled and has a shared through-right lane. 3. Tarkanian Way/Thomas and Mack Drive intersection is a four-way unsignalized intersection. The east- and westbound approaches along Tarkanian Way are stop-controlled and each has one shared left-through-right lane. Along Thomas and Mack Drive, the northbound approach has a shared throughleft lane and a right turn lane, while the southbound approach has a shared left-through-right lane. 4. Tarkanian Way/Back Drive intersection is a three-way unsignalized intersection. The northbound approach along Parking Lot Road is stop-controlled and has a left turn and a right turn lane. Along Tarkanian Way, the eastbound approach has a through-right lane, and the westbound approach has a through-left lane. 5. University Road/Maryland Parkway intersection is a three-way signalized intersection. The eastbound approach along University Road has a left turn and a right turn lane. Along Maryland Parkway, the northbound approach has one left turn lane and three through lanes, while the southbound approach has two through lanes and one shared through-right lane. Page 47
51 TARKANIAN WAY WAY BOCK ST WILBUR ST GYM DR S MARYLAND PKWY E FLAMINGO RD SWENSON ST COTTAGE GROVE AV PARADISE RD 1 2 E HARMON AV 3 4 E UNIVERSITY AV BRUSSELS ST 5 E TROPICANA AV 1 2 Signalized intersection Unsignalized intersection Study area boundary UNLV campus STUDY AREA MAP FIGURE D1
52 ADJACENT STREET SYSTEM The vicinity of the proposed project site includes a few major arterials and several campus access roads. Brief descriptions of these roadways are provided below. Harmon Avenue is an east-west arterial that runs through the western half of campus and terminates in central campus. It has two travel lanes in each direction and a two-way left turn lane median, and is approximately 80 feet wide. The current posted speed limit is 35 mph east of campus, and 25 mph within campus. Maryland Parkway is a north-south arterial that runs along the eastern edge of campus. Within the study area, it has three travel lanes in each direction, with left-turn pockets at most intersections, and a two-way left turn lane median. It is approximately 100 feet wide, and the current posted speed limit is 30 mph. Swenson Street is a north-south arterial that runs along the western edge of campus. North of Harmon Avenue, the road has two lanes in each direction, with a two-way left turn median. South of Harmon Avenue, the road becomes one-way in the northbound direction, ranging from four to five travel lanes. The road is approximately 80 feet wide, and the current posted speed limit is 35 mph. University Road is an east-west campus roadway that runs west from Maryland Parkway and terminates within campus. West of Parking Lot Road, it has one travel lane in each direction, and no median, and on the other side the eastbound direction widens to two lanes. Tarkanian Way is a north-south campus roadway that connects from Harmon Avenue and runs south into the main campus parking lot, where it curves into an east-west direction. It has one travel lane in each direction, and no median. Thomas and Mack Drive is a campus roadway that runs in the northeast-southwest direction through the main campus parking lot, and intersects with Swenson Street, where it curves into an east-west direction, ending at Paradise Road. North of Swenson Street, the roadway has two lanes in each direction, with a twoway left turn median, and on the other side, it has one lane in each direction with no median. Bach Drive is a campus roadway that runs through the main campus parking lot, continuing from Tarkanian Way, running south and then curving east to connect with East Tropicana Avenue. It has two travel lanes in each direction, and no median. Methodology The existing and future transportation network was analyzed using the VISSIM micro simulation application. This computer-based modeling tool allows a comprehensive multi-modal network to be modeled to determine if any impacts result when changes are made to the existing network or if future volumes are reached. The decision to select the VISSIM application was done due to the multi-modal characteristics of the project and the network. Campus settings traditionally have high volumes of transit, pedestrian and bike volumes which can be overshadowed by analysis applications that focus on traffic operations. VISSIM was selected as the appropriate tool for this analysis due to its enhanced ability to model detailed user behavior and priority settings within the transportation network. The three-dimensional animation options also provide a better understanding for policy makers and the general public on how future transportation will function. Page 49
53 Existing traffic volumes and roadway geometry inputs to the VISSIM network were collected on site during November and December of Vehicles counts as well as pedestrian counts were completed for the five study intersections. Future 2030 volumes were taken from the 2006 Maryland Parkway UNLV Community Realignment Plan which used the RTC Regional Planning Model to estimate future traffic conditions. In calculating the 2030 volumes from 2005 counts, the regional model assumed a 3.31% growth for the first ten years, 2.31% growth for the subsequent 10 years, and 1.31% growth for the final five years. This uniform growth is due to future development assumptions in the area and largely based on the Mid- Town UNLV project which will likely have a significant effect on the traffic patterns in the area. Since the Maryland Parkway-UNLV Community Realignment Plan study did not include 2030 traffic volumes for on-campus intersections, assumptions were made using the entry/exit volumes generated at the gateway intersections (Swenson/Harmon and University/Maryland Parkway). Using UNLV s master plan, estimates were made for future on-campus parking generators and entry/exit volumes were appropriately distributed to these locations. Additional traffic on the network after this traffic was distributed was assigned to the internal network based on the existing distributions of traffic on campus. This methodology assumes that traffic circulating on campus will not grow at the same rates of traffic external to campus but turning movements at the gateway locations will be consistent with the regional forecasts. Traffic operations of the study intersections were evaluated using Level of Service (LOS) calculations. LOS is a qualitative description of the performance of an intersection based on the average delay per vehicle. Intersection levels of service range from LOS A, which indicates free flow or excellent conditions with short delays, to LOS F, which indicates congested or overloaded conditions with extremely long delays. SIGNALIZED INTERSECTIONS Level of Service for signalized intersections was calculated using the Highway Capacity Manual 2000 (HCM 2000) methodology. The LOS is based on the average delay (in seconds per vehicle) for the various movements within the intersection, which was determined using the VISSIM software. A combined weighted average delay and LOS are presented for each of the signalized intersections. The average delay for signalized intersections is correlated to the level of service designations as shown in Table D1. Page 50
54 Table D1: Level of Service Criteria Signalized Intersections Level of Service A B C D E F Description of Operations Average Delay (1) Operations with very low delay occurring with favorable progression and/or short cycle length. Operations with low delay occurring with good progression and/or short cycle lengths. Operations with average delays resulting from fair progression and/or longer cycle lengths. Individual cycle failures begin to appear. Operations with longer delays due to a combination of unfavorable progression, long cycle lengths, or high V/C ratios. Many vehicles stop and individual cycle failures are noticeable. Operations with high delay values indicating poor progression, long cycle lengths, and high V/C ratios. Individual cycle failures are frequent occurrences. This is considered to be the limit of acceptable delay. Operation with delays unacceptable to most drivers occurring due to over saturation, poor progression, or very long cycle lengths. Source: Highway Capacity Manual, Transportation Research Board, 2000 (1) Delay presented in seconds per vehicle UNSIGNALIZED INTERSECTIONS The LOS rating for unsignalized intersections, as specified using the Highway Capacity Manual 2000 methodology, is based on the weighted average control delay expressed in seconds per vehicles as illustrated in Table D2. Table D2: Level of Service Criteria Unsignalized Intersections Level of Service Description of Operations Average Delay (1) A No Delay for stop-controlled approaches B Operations with minor delays C Operations with moderate delays D Operations with some delays E Operations with high delays, and long queues F Operations with extreme congestion, with very high delays and long queues 50.1 unacceptable to most drivers. Source: Highway Capacity Manual, Transportation Research Board, 2000 (1) Delay presented in seconds per vehicle Existing Traffic Conditions Existing traffic conditions were evaluated for the morning (7:00AM to 9:00AM) and evening peak hour (4:00PM to 6:00PM) using the VISSIM software. It should be noted that existing peak hour traffic volumes at the key intersections were developed from intersection turning movement counts conducted in November and December Traffic movements were counted and recorded in 15 minute intervals during the peak periods. These counts were then analyzed to determine the peak hour traffic volumes. Page 51
55 A total of five (5) intersections were analyzed under existing conditions, of which two (2) are signalized, two (2) are Side-Street Stop-Controlled, and one (1) is Two-Way Stop-Controlled. The existing lane configurations and peak hour turning movement volumes were used to calculate the levels of service for the five study intersections under existing peak hour conditions. These lane geometries and turning movements are shown in Figure D2 and Figure D3. The results of the existing LOS analysis for the AM and PM peak periods are presented in Table D3. Under existing conditions, all five study intersections operate at LOS D or better during both the AM and PM peak period. Table D3: Intersection Operations Existing Conditions AM PM # Intersection Control (1) Delay (sec) LOS Delay (sec) LOS 1 Harmon Avenue/Swenson Street Signal 41.4 D 53.2 D 2 Harmon Avenue/Tarkanian Way SSSC 5.8 A 10.4 B 3 Tarkanian Way/Thomas and Mack Drive TWSC 2.8 A 6.6 A 4 Tarkanian Way /Bach Drive SSSC 4.6 A 3.9 A 5 University Road/Maryland Parkway Signal 17.2 B 17.7 B Source: Wilbur Smith Associates, 2009 (1) AWSC: All-Way Stop-Control TWSC: Two-Way Stop-Control SSSC: Side-Street Stop-Control Bold indicates intersection operates under unacceptable conditions Page 52
56 TARKANIAN WAY WAY BOCK ST GYM DR WILBUR ST S MARYLAND PKWY 1. Harmon Ave/Swenson St 2. Harmon Ave/Tarkanian Wy Legend UNLV Campus 1 Signalized Intersection 2 Unsignalized Intersection Harmon Ave Harmon Ave AM (PM) Peak Hour Traffic Volume Traffic Signal Turn Lane Stop Sign 3. Thomas & Mack Dr/Tarkanian Wy 4. Tarkanian Wy/Bach Dr 5. University Rd/Maryland Pkwy Thomas & Mack Dr Tarkanian Wy University Rd E FLAMINGO RD SWENSON ST COTTAGE GROVE AV PARADISE RD 1 2 E HARMON AV 3 4 E UNIVERSITY AV BRUSSELS ST 5 E TROPICANA AV NORTH NOT TO SCALE EXISTING ROADWAY CONFIGURATIONS FIGURE D2
57 TARKANIAN WAY WAY BOCK ST GYM DR WILBUR ST S MARYLAND PKWY 1. Harmon Ave/Swenson St 2. Harmon Ave/Tarkanian Wy Legend UNLV Campus Harmon Ave 291(429) 184(152) 104(276) 188(113) 1145(851) 638(673) 487(229) 37(125) 98(403) Harmon Ave 210(209) 158(177) 62(135) 42(33) 57(217) 12(42) 1 2 AM (PM) Signalized Intersection Unsignalized Intersection Peak Hour Traffic Volume Traffic Signal Turn Lane Stop Sign 3. Thomas & Mack Dr/Tarkanian Wy 4. Tarkanian Wy/Bach Dr 5. University Rd/Maryland Pkwy 12(75) 62(167) 0(0) 1(6) 2(6) 3(3) 15(29) 29(92) 192(181) 950(1616) Thomas & Mack Dr 143(66) 7(12) 266(98) 5(55) 44(75) 2(3) Tarkanian Wy 44(14) 35(181) 86(87) 56(57) University Rd 40(98) 23(94) 189(158) 1384(1355) E FLAMINGO RD SWENSON ST COTTAGE GROVE AV PARADISE RD 1 2 E HARMON AV 3 4 E UNIVERSITY AV BRUSSELS ST 5 E TROPICANA AV NORTH NOT TO SCALE EXISTING CONDITIONS PEAK HOUR VOLUMES FIGURE D3
58 EXISTING PLUS PROJECT CONDITIONS Traffic conditions were evaluated under existing plus project conditions to identify potential impacts to traffic operations as a result of the project. Significant impacts resulting from the proposed project are identified by comparing traffic operations under the existing plus project scenario to existing conditions. However, the proposed project includes some changes to the roadway network, which are summarized below. A number of changes were made to the existing network which resulted from the implementation of the project. These modifications are shown in Figure 16 and include: The construction of the multi-modal transit facility. This proposed facility is shown in Figures and includes two entry/exit driveways along University Road between Maryland Parkway and Brussels to access the transit area and one new driveway to access the parking area to the south of the transit facility. It is also assumed that the project will remove nearly half of the existing parking on Lot U, thus reducing peak hour volumes proportionally due to the reduced supply. A reconfiguration of Brussels from a one-way southbound roadway to a two-way roadway with one northbound and one southbound lane. The extension of University Road to the west to connect to the existing Red Lot. The roadway extension would traverse between the Student Services Building and the Student Recreation Center. The introduction of the project will add transit service through campus which will result in a slight increase in traffic on campus from the new RTC transit services. The Harmon rapid service would add four (4) new eastbound and westbound movements at all study intersections. The Maryland Parkway and Zoom service would add another 10 turning movements at the University and Maryland Parkway intersection. These new volumes are shown in Figure D4. Page 55
59 TARKANIAN WAY WAY BOCK ST GYM DR WILBUR ST S MARYLAND PKWY 1. Harmon Ave/Swenson St 2. Harmon Ave/Tarkanian Wy Legend UNLV Campus Harmon Ave 291(429) 184(152) 104(276) 192(117) 1145(851) 638(673) 487(229) 37(125) 102(407) Harmon Ave 210(209) 162(181) 66(139) 42(33) 57(217) 12(42) 1 2 AM (PM) Signalized Intersection Unsignalized Intersection Peak Hour Traffic Volume Traffic Signal Turn Lane Stop Sign 3. Thomas & Mack Dr/Tarkanian Wy 4. Tarkanian Wy/Bach Dr 5. University Rd/Maryland Pkwy 12(75) 66(171) 0(0) 1(6) 2(6) 3(3) 19(33) 29(92) 127(120) 950(1616) Thomas & Mack Dr 143(66) 7(12) 266(98) 5(55) 48(79) 2(3) Tarkanian Wy 48(18) 35(221) 86(87) 56(7) University Rd 54(112) 23(94) 130(102) 1384(1355) E FLAMINGO RD SWENSON ST COTTAGE GROVE AV PARADISE RD 1 2 E HARMON AV 3 4 E UNIVERSITY AV BRUSSELS ST 5 E TROPICANA AV NORTH NOT TO SCALE EXISTING PLUS PROJECT CONDITIONS PEAK HOUR VOLUMES FIGURE D4
60 The existing plus project lane configurations and peak hour turning movement volumes were used to calculate the levels of service for the five (5) study intersections under existing peak hour conditions. Traffic volumes were determined by adding proposed BRT traffic volumes during the peak hour along the corridor at the study intersections. The results of the LOS analysis for existing plus project conditions during the AM and PM peak periods are presented in Table D4. Table D4: Intersection Operations Existing plus Project Conditions AM PM # Intersection Control (1) Delay (sec) LOS Delay (sec) LOS 1 Harmon Avenue/Swenson Street Signal 42.2 D 60.1 E 2 Harmon Avenue/Tarkanian Way SSSC 6.0 A 11.4 B 3 Tarkanian Way/Thomas and Mack Drive TWSC 3.1 A 7.7 A 4 Tarkanian Way /Bach Drive SSSC 5.5 A 3.6 A 5 University Road/Maryland Parkway Signal 15.6 B 17.9 B Source: Wilbur Smith Associates, 2009 (1) AWSC: All-Way Stop-Control TWSC: Two-Way Stop-Control SSSC: Side-Street Stop-Control Bold indicates intersection operates under unacceptable conditions Compared to the existing conditions, the plus project shows only one significant impact on operations. This impact is at Harmon and Swenson during the PM conditions where the LOS drops from D to E. This drop in LOS is coupled with a change in vehicle delay from 53.2 seconds in the existing condition to 60.1 seconds in the plus project condition. All other intersections showed a relatively minor change with the introduction of the project. University Road and Maryland Parkway showed an improved in average delay. This change was due to the reduced traffic volumes due to a reduction in parking supply at Lot U from the implementation of the project. Under the plus project conditions eastbound BRT service is estimated to take 5.5 minutes to traverse campus (Swenson Maryland Parkway) while westbound is estimated to take 6.0 minutes. These estimates include two stops on campus and all delay related to traffic control and pedestrian/vehicular congestion. These relatively slow travel times reflect the pedestrian/bike oriented areas of campus where the transit service would operate and should be considered in the planning of any new Harmon service. Table D5: Arterial Operations Existing plus Project Conditions Intersection Travel Time (min) AM Speed (mph) Travel Time (min) PM Speed (mph) Harmon/Tarkanian/University (eastbound) Harmon/Tarkanian/University (westbound) Page 57
61 2030 CONDITIONS The 2030 condition includes three new parking garages on campus with storage capacity of approximately 2,000 vehicles. These include the Tropicana Garage (Phase 1 and 2), a new garage north of Harmon between Swenson and Tarkanian, and a new garage south of University Road between Maryland Parkway and Brussels. Some level of preliminary or conceptual design work has been completed on the later two garage listed above. Using the Maryland Parkway-UNLV Community Realignment Plan findings and the preliminary or conceptual planning work done on the parking structures, the following network configuration changes were added in the 2030 scenario: Maryland Parkway loses a through travel lane in the northbound and southbound direction; Tarkanian and Bach switch the stop control from the northbound and eastbound movements to the westbound movement. A travel lane is removed from the northbound direction and added to the southbound movement; An off-street transit stop is added along Tarkanian, just north of the Tropicana Parking Garage; and Joe Delaney Lane is extended west to Brussels. The 2030 intersection geometries are shown in Figure D5. The 2030 traffic conditions modeled includes a number of future growth assumptions and development projects on campus. As described in the methodology section, future traffic volumes at the gateway intersections to campus were taken from the Maryland Parkway-UNLV Community Realignment Plan which used the RTC Regional Planning Model to estimate future traffic activity. This model accounts for all future land use changes including the Mid-Town UNLV project and future campus enrollment targets. Internal traffic was then distributed based future parking garage locations and the on existing traffic movements. Figure D6 shows the 2030 peak hour volumes. The 2030 lane configurations and peak hour turning movement volumes were used to calculate the levels of service for the five (5) study intersections under 2030 peak hour conditions. The results of the LOS analysis for 2030 conditions during the AM and PM peak periods are presented in Table D6. Page 58
62 Table D6: Intersection Operations 2030 Conditions AM PM # Intersection Control (1) Delay (sec) LOS Delay (sec) LOS 1 Harmon Avenue/Swenson Street Signal 74.5 E 95.6 F 2 Harmon Avenue/Tarkanian Way SSSC 6.1 A 13.1 B 3 Tarkanian Way/Thomas and Mack Drive TWSC 3.5 A 9.5 A 4 Tarkanian Way /Bach Drive SSSC 7.9 A 8.1 A 5 University Road/Maryland Parkway Signal 16 B 19.5 B Source: Wilbur Smith Associates, 2009 (1) AWSC: All-Way Stop-Control TWSC: Two-Way Stop-Control SSSC: Side-Street Stop-Control Bold indicates intersection operates under unacceptable conditions The results show relatively good intersection performance on campus but LOS E and F at Harmon Avenue and Swenson Street. This is reflective of the poor operating conditions in the existing scenario at this intersection. Page 59
63 TARKANIAN WAY WAY BOCK ST GYM DR WILBUR ST S MARYLAND PKWY 1. Harmon Ave/Swenson St 2. Harmon Ave/Tarkanian Wy Legend UNLV Campus 1 Signalized Intersection 2 Unsignalized Intersection Harmon Ave Harmon Ave AM (PM) Peak Hour Traffic Volume Traffic Signal Turn Lane Stop Sign 3. Thomas & Mack Dr/Tarkanian Wy 4. Tarkanian Wy/Bach Dr 5. University Rd/Maryland Pkwy Thomas & Mack Dr Tarkanian Wy University Rd E FLAMINGO RD SWENSON ST COTTAGE GROVE AV PARADISE RD 1 2 E HARMON AV 3 4 E UNIVERSITY AV BRUSSELS ST 5 E TROPICANA AV NORTH NOT TO SCALE 2030 ROADWAY CONFIGURATIONS FIGURE D5
64 TARKANIAN WAY WAY BOCK ST GYM DR WILBUR ST S MARYLAND PKWY 1. Harmon Ave/Swenson St 2. Harmon Ave/Tarkanian Wy Legend UNLV Campus Harmon Ave 524(772) 331(274) 187(496) 334(199) 2061(1528) 1148(1210) 877(413) 57(225) 145(721) Harmon Ave 253(263) 275(218) 50(253) 42(33) 103(217) 12(42) 1 2 AM (PM) Signalized Intersection Unsignalized Intersection Peak Hour Traffic Volume Traffic Signal Turn Lane Stop Sign 3. Thomas & Mack Dr/Tarkanian Wy 4. Tarkanian Wy/Bach Dr 5. University Rd/Maryland Pkwy 12(97) 171(155) 0(0) 1(6) 2(6) 3(3) 15(29) 29(92) 121(166) 979(1568) Thomas & Mack Dr 143(66) 7(12) 427(98) 5(137) 32(183) 2(7) Tarkanian Wy 40(10) 461(254) 86(302) 56(7) University Rd 31(85) 24(91) 134(153) 1426(1312) E FLAMINGO RD SWENSON ST COTTAGE GROVE AV PARADISE RD 1 2 E HARMON AV 3 4 E UNIVERSITY AV BRUSSELS ST 5 E TROPICANA AV NORTH NOT TO SCALE 2030 CONDITIONS PEAK HOUR VOLUMES FIGURE D6
65 2030 Plus Project Conditions The 2030 plus project lane configurations and peak hour turning movement volumes were used to calculate the levels of service for the five (5) study intersections under 2030 plus project peak hour conditions. The results of the LOS analysis for 2030 plus project conditions during the AM and PM peak periods are presented in Table D7. Table D7: Intersection Operations 2030 plus Project Conditions AM PM # Intersection Control (1) Delay (sec) LOS Delay (sec) LOS 1 Harmon Avenue/Swenson Street Signal 76.2 E 96.5 F 2 Harmon Avenue/Tarkanian Way SSSC 6.4 A 13.6 B 3 Tarkanian Way/Thomas and Mack Drive TWSC 3.9 A 10.4 B 4 Tarkanian Way /Bach Drive SSSC 8.9 A 8.8 A 5 University Road/Maryland Parkway Signal 16.4 B 19.6 B Source: Wilbur Smith Associates, 2009 (1) AWSC: All-Way Stop-Control TWSC: Two-Way Stop-Control SSSC: Side-Street Stop-Control Bold indicates intersection operates under unacceptable conditions The addition of the project traffic in the 2030 plus project scenario has very little impact on future traffic operations. While delay per vehicle did slightly increase at all intersection, only one case resulted in drop in LOS. This occurred at the intersection of Tarkanian Way and Thomas and Mack where the LOS went from A to B. Table D8 shows the estimated 2030 travel times through campus with the project. The results show very little change over the existing plus project in both travel time and speed. This small change is due to little auto growth on campus and the restrictions on auto access using University Ave. through campus. Table D8: Arterial Operations 2030 plus Project Conditions Intersection Travel Time (min) AM Speed (mph) Travel Time (min) PM Speed (mph) Harmon/Tarkanian/University (eastbound) Harmon/Tarkanian/University (westbound) Page 62
66 TARKANIAN WAY WAY BOCK ST GYM DR WILBUR ST S MARYLAND PKWY 1. Harmon Ave/Swenson St 2. Harmon Ave/Tarkanian Wy Legend UNLV Campus Harmon Ave 524(772) 331(274) 187(496) 338(203) 2061(1528) 1148(1210) 877(413) 57(225) 149(725) Harmon Ave 253(263) 279(222) 54(257) 42(33) 103(217) 12(42) 1 2 AM (PM) Signalized Intersection Unsignalized Intersection Peak Hour Traffic Volume Traffic Signal Turn Lane Stop Sign 3. Thomas & Mack Dr/Tarkanian Wy 4. Tarkanian Wy/Bach Dr 5. University Rd/Maryland Pkwy 12(97) 175(159) 0(0) 1(6) 2(6) 3(3) 19(33) 29(92) 131(176) 979(1568) Thomas & Mack Dr 143(66) 7(12) 427(98) 5(137) 36(187) 2(7) Tarkanian Wy 44(14) 461(254) 86(302) 56(7) University Rd 45(99) 24(91) 134(153) 1426(1312) E FLAMINGO RD SWENSON ST COTTAGE GROVE AV PARADISE RD 1 2 E HARMON AV 3 4 E UNIVERSITY AV BRUSSELS ST 5 E TROPICANA AV NORTH NOT TO SCALE 2030 PLUS PROJECT CONDITIONS PEAK HOUR VOLUMES FIGURE D7
67 Appendix E: Capital Cost Estimates Table E1: Estimated Multi-Modal Transit Hub Costs Item Description Units Quantity Cost Capital Improvements Remove Curb and Gutter LF 550 $2,750 Remove Concrete Sidewalk SF 1,100 $2,200 Remove Concrete Pavement SY 5,250 $78,750 Landscaping LS 1 $150,000 AC Surface Course TON 258 $19,882 AC Binder TON 368 $26,920 Hot Laid Asphalt Aggregate TON 442 $36,513 Graded Aggregate Base Course SY 2,944 $47,106 Liquid Asphalt Binder TON 54 $18,711 Curb and Gutter LF 1,425 $64,125 Earthwork CY 2,944 $26,497 Asphalt Removal SY 988 $6,422 Transit Building (6,336 Sq. Ft.) LS 1 $1,679,783 Canopy EA 4 $248,000 Bench EA 12 $12,000 Trash/Recycling Receptacles EA 6 $9,000 LCD Display Monitors EA 6 $4,800 Security Cameras EA 2 $10,000 Monument Sign EA 1 $25,000 Stop Flag Signs EA 8 $4, Watt Light Assembly EA 4 $8,000 SUBTOTAL Capital Costs $ 2,630,459 Contingencies (30%) $ 789,138 TOTAL CAPITAL COSTS $ 3,419,597 Support Costs Planning/Pre-Design (5%) $ 170,980 Final Design (8%) $ 273,568 Environmental Clearances & Mitigation (5%) $ 170,980 Construction Admin. (10%) $ 341,960 SUBTOTAL Support Costs $ 957,487 GRAND TOTAL (Rounded to the nearest $1,000) $ 4,377,000 Page 64
68 Table E2: Estimated UNLV Roadway Improvement Costs Area 1 Area 2 Area 3 Area 4 Area 5 Total Item Description Units Quantity Cost Quantity Cost Quantity Cost Quantity Cost Quantity Cost Quantity Cost Capital Improvements AC Surface Course TON 404 $31, $26, $15, $32, $8,489 1,375 $114,627 AC Binder TON 38 $2, $2, $15, $2, $6, $30,145 Hot Laid Asphalt Aggregate TON 46 $3, $3, $21, $3, $8, $40,887 Graded Aggregate Base Course SY 306 $4, $4,779 1,710 $27, $4, $11,307 2,590 $52,748 Liquid Asphalt Binder TON 25 $8, $7, $11, $8, $5, $41,927 Curb and Gutter LF 2,910 $130,950 1,686 $75,870 1,235 $55, $15, $32,670 6,176 $310,590 Sidewalk (4" thick) SF 14,249 $99,743 8,185 $57,295 5,530 $38,710 1,628 $11, $2,100 29,592 $209,244 Earthwork CY 102 $5, $14, $28, $28, $11,778 1,541 $88,820 Asphalt Removal SY 306 $1, $2,199 1,710 $11,114 1,069 $6, ,423 $22,252 Milling SY 4,310 $20,255 4,586 $21, $2, $2, $2,585 10,121 $50,153 Roadway Striping LF 3,189 $11,162 3,937 $39,370 1,026 $3,591 2,480 $8, $1,645 10,632 $64,448 Concrete Removal SY $ $1, $2,276 Remove Curb and Gutter LF $6, $19, $25,500 Concrete Median SY $1, $6,473 - $0 187 $8,218 Landscaping LS 1 $25,000 1 $25,000 1 $25,000 1 $25,000 - $25,000 4 $125,000 Drainage MI 0.27 $27, $17, $12, $20, $9,000 1 $85,000 Erosion Control LS 1 $6,750 1 $4,250 1 $3,000 1 $5,000 1 $2,250 4 $21,250 Signage LS 1 $8,000 1 $15,000 1 $3,000 1 $10,000 1 $5,000 4 $41,000 Signal Modification LS $10, $10,000 Traffic Control LS 1 $38,727 1 $31,952 1 $27,503 1 $19,923 1 $15,304 4 $133,409 SUBTOTAL Capital Costs $425,998 $351,474 $302,531 $229,152 $168,340 $1,477,494 Contingencies (30%) $127,799 $105,442 $90,759 $68,745 $50,502 $443,248 TOTAL CAPITAL COSTS $553,797 $456,916 $393,290 $297,897 $218,842 $1,920,742 Support Costs Planning/Pre-Design (5%) $27,690 $22,846 $19,664 $14,895 $10,942 $96,037 Final Design (8%) $44,304 $36,553 $31,463 $23,832 $17,507 $153,659 Environmental Clearances & Mitigation (5%) $27,690 $22,846 $19,664 $14,895 $10,942 $96,037 Construction Admin. (10%) $55,380 $45,692 $39,329 $29,790 $21,884 $192,074 SUBTOTAL Support Costs $155,063 $127,936 $110,121 $83,411 $61,276 $537,808 GRAND TOTAL (Rounded to the nearest $1,000) $709,000 $585,000 $503,000 $381,000 $280,000 $2,459,000 Area 1 - Harmon Avenue Swenson to Thomas and Mack Drive Area 2 - Thomas and Mack and Harmon Avenue Intersection to Student Services Phase III Area 3 - Student Services Phase III to Existing University Road Tie Area 4 - Existing University Road Tie to Maryland Parkway Area 5 - Brussells Street Improvements Page 65
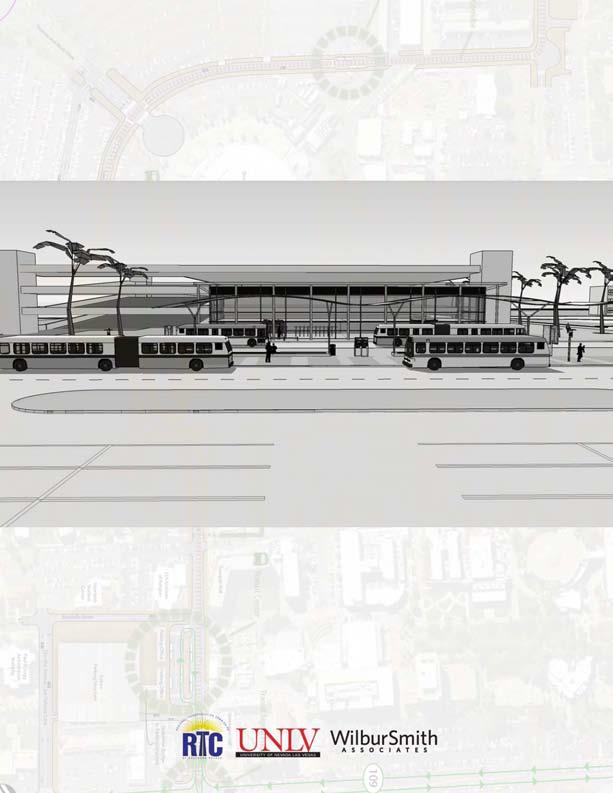
69
Service Quality: Higher Ridership: Very Affordable: Image:
 Over the past decade, much attention has been placed on the development of Bus Rapid Transit (BRT) systems. These systems provide rail-like service, but with buses, and are typically less expensive to
6/6/2018. June 7, Item #1 CITIZENS PARTICIPATION
 June 7, 2018 Item #1 CITIZENS PARTICIPATION 1 Item #2 APPROVAL OF MINUTES Item #3 TRAC GOALS, FRAMEWORK & AGENDA REVIEW 2 COMMITTEE GOALS Learn about Southern Nevada s mobility challenges, new developments
US 29 Bus Rapid Transit Planning Board Briefing. February 16, 2017
 US 29 Bus Rapid Transit Planning Board Briefing February 16, 2017 Project Goals Improve the quality of transit service Improve mobility opportunities and choices Enhance quality of life Support master
9. Downtown Transit Plan
 CORRADINO 9. Downtown Transit Plan KAT Transit Development Plan As part of the planning process for the TDP, an examination of downtown transit operations was conducted. The Downtown Transit Plan 1 is
Pedestrians, Cars, Buses and Trains? Considerations for Rapid Transit Service at Western University
 Pedestrians, Cars, Buses and Trains? Considerations for Rapid Transit Service at Western University Shift: The City of London s Rapid Transit Proposal Shift: The City of London s Rapid Transit Proposal
EUGENE-SPRINGFIELD, OREGON EAST WEST PILOT BRT LANE TRANSIT DISTRICT
 EUGENE-SPRINGFIELD, OREGON EAST WEST PILOT BRT LANE TRANSIT DISTRICT (BRIEF) Table of Contents EUGENE-SPRINGFIELD, OREGON (USA)... 1 COUNTY CONTEXT AND SYSTEM DESCRIPTION... 1 SYSTEM OVERVIEW... 1 PLANNING
2.0 Development Driveways. Movin Out June 2017
 Movin Out June 2017 1.0 Introduction The proposed Movin Out development is a mixed use development in the northeast quadrant of the intersection of West Broadway and Fayette Avenue in the City of Madison.
Bi-County Transitway/ Bethesda Station Access Demand Analysis
 Bi-County Transitway/ Bethesda Station Access Demand Analysis Prepared for: Washington Metropolitan Area Transit Authority Office of Planning and Project Development May 2005 Prepared by: in conjunction
5. OPPORTUNITIES AND NEXT STEPS
 5. OPPORTUNITIES AND NEXT STEPS When the METRO Green Line LRT begins operating in mid-2014, a strong emphasis will be placed on providing frequent connecting bus service with Green Line trains. Bus hours
FREQUENTLY ASKED QUESTIONS
 FREQUENTLY ASKED QUESTIONS 2018 What is the More MARTA Atlanta program? The More MARTA Atlanta program is a collaborative partnership between MARTA and the City of Atlanta to develop and implement a program
Waco Rapid Transit Corridor (RTC) Feasibility Study
 Feasibility Study") Waco Rapid Transit Corridor (RTC) Feasibility Study Chris Evilia, Director of Waco Metropolitan Planning Organization Allen Hunter, General Manager Waco Transit System Jimi Mitchell, Project Manager AECOM
Waco Rapid Transit Corridor (RTC) Feasibility Study Chris Evilia, Director of Waco Metropolitan Planning Organization Allen Hunter, General Manager Waco Transit System Jimi Mitchell, Project Manager AECOM
BROWARD BOULEVARD CORRIDOR TRANSIT STUDY
 BROWARD BOULEVARD CORRIDOR TRANSIT STUDY FM # 42802411201 EXECUTIVE SUMMARY July 2012 GOBROWARD Broward Boulevard Corridor Transit Study FM # 42802411201 Executive Summary Prepared For: Ms. Khalilah Ffrench,
Executive Summary. Treasure Valley High Capacity Transit Study Priority Corridor Phase 1 Alternatives Analysis October 13, 2009.
 Treasure Valley High Capacity Transit Study Priority Corridor Phase 1 Alternatives Analysis October 13, 2009 Background As the Treasure Valley continues to grow, high-quality transportation connections
Preliminary Definition of Alternatives. 3.0 Preliminary Definition of Alternatives
 3.0 What preliminary alternatives are being evaluated? The alternatives for the East San Fernando Valley Transit Corridor project that were considered for screening include the No Build Alternative, Transportation
10/4/2016. October 6, Item #1 CITIZENS PARTICIPATION
 October 6, 2016 Item #1 CITIZENS PARTICIPATION 1 Item #2 APPROVAL OF MINUTES Item #3 WELCOME 2 Item #4 TRAC ROADWAY RECOMMENDATIONS UPDATE Item #4 Completed Jurisdiction Presentations Boulder City August
Public Meeting. March 21, 2013 Mimosa Elementary School
 Public Meeting March 21, 2013 Mimosa Elementary School Today s Meeting Purpose 2 Where We Are The Process What We ve Heard and Findings Transit Technologies Station Types Break-out Session Where We Are
King County Metro. Columbia Street Transit Priority Improvements Alternative Analysis. Downtown Southend Transit Study. May 2014.
 King County Metro Columbia Street Transit Priority Improvements Alternative Analysis Downtown Southend Transit Study May 2014 Parametrix Table of Contents Introduction... 1 Methodology... 1 Study Area...
Traffic Management Plan and Queuing Analysis Lakehill Preparatory School Z Hillside Drive, Dallas, TX October 27, 2015
 Traffic Management Plan and Queuing Analysis Lakehill Preparatory School Z145-235 2720 Hillside Drive, Dallas, TX October 27, 2015 Introduction: The Lakehill Preparatory School is located on the northeast
METRO Orange Line BRT American Boulevard Station Options
 METRO Orange Line BRT American Boulevard Station Options Bloomington City Council Work Session November 18, 2013 Christina Morrison BRT/Small Starts Project Office Coordinating Planning and Design AMERICAN
FasTracks News. RTD s Eagle P3 Transit Project Nears Halfway Mark to Opening Day EP3 will add three commuter rail lines to metro area in 2016
 July 29, 2013 Welcome to Inside RTD FasTracks a monthly e- update to keep you informed about the progress of the Regional Transportation District's FasTracks program. FasTracks News RTD s Eagle P3 Transit
CEDAR AVENUE TRANSITWAY Implementation Plan Update
 CEDAR AVENUE TRANSITWAY Implementation Plan Update EECUTIVE SUMMARY DECEMBER 2015 Executive Summary In 2013, the Twin Cities metropolitan area s first bus rapid transit (BRT) line, the METRO Red Line,
Madison BRT Transit Corridor Study Proposed BRT Operations Plans
 Madison BRT Transit Corridor Study Proposed BRT Operations Plans This paper presents a description of the proposed BRT operations plan for use in the Madison BRT Transit Corridor Study. The objective is
Public Meeting. City of Chicago Department of Transportation & Department of Housing and Economic Development
 Public Meeting City of Chicago Department of Transportation & Department of Housing and Economic Development Funded by Regional Transportation Authority September 12, 2011 In partnership with Presentation
TRANSPORTATION REVIEW
 TRANSPORTATION REVIEW - PROPOSED MIX OF LAND USES IS CONSISTENT WITH THE CITY S UNDER THE GRANVILLE BRIDGE POLICIES THAT AIM TO MEET NEIGHBOURING RESIDENTS SHOPPING NEEDS AND REDUCE RELIANCE ON AUTOMOBILE
STH 60 Northern Reliever Route Feasibility Study Report
 #233087 v3 STH 60 Northern Reliever Route Feasibility Study Report Washington County Public Works Committee Meeting September 28, 2016 1 STH 60 Northern Reliever Route Feasibility Study Hartford Area Development
ANDERSON PROPERTY SITE ANALYSIS
 ANDERSON PROPERTY SITE ANALYSIS Introduction The Montgomery County Department of Transportation (MCDOT) initiated a feasibility study in the fall of 2012 to evaluate the need for transit service expansion
Troost Corridor Transit Study
 Troost Corridor Transit Study May 23, 2007 Kansas City Area Transportation Authority Agenda Welcome Troost Corridor Planning Study Public participation What is MAX? Survey of Troost Riders Proposed Transit
Table 8-1: Service Frequencies for All Short-List Alternatives by Day of Week and Time of Day Frequency Day of Week Time of Day Time Period
 8. Operating Plans The following Section presents the operating plans for the Short-List Alternatives. The modern streetcar operating plans are presented for Alternatives 2 and 3, followed by bus rapid
Table of Contents INTRODUCTION... 3 PROJECT STUDY AREA Figure 1 Vicinity Map Study Area... 4 EXISTING CONDITIONS... 5 TRAFFIC OPERATIONS...
 Crosshaven Drive Corridor Study City of Vestavia Hills, Alabama Table of Contents INTRODUCTION... 3 PROJECT STUDY AREA... 3 Figure 1 Vicinity Map Study Area... 4 EXISTING CONDITIONS... 5 TRAFFIC OPERATIONS...
IMPROVEMENT CONCEPTS
 IMPROVEMENT CONCEPTS for the South Novato Transit Hub Study Prepared by: January 11, 2010 DKS Associates With Wilbur Smith Associates IMPROVEMENT CONCEPTS Chapter 1: Introduction 1. INTRODUCTION The strategic
TORONTO TRANSIT COMMISSION REPORT NO.
 Form Revised: February 2005 TORONTO TRANSIT COMMISSION REPORT NO. MEETING DATE: October 24, 2012 SUBJECT: DOWNTOWN RAPID TRANSIT EXPANSION STUDY (DRTES) PHASE 1 STRATEGIC PLAN ACTION ITEM RECOMMENDATIONS
Mississauga Bus Rapid Transit Preliminary Design Project
 Mississauga Bus Rapid Transit Preliminary Design Project PUBLIC INFORMATION CENTRE OCTOBER 2008 WELCOME The Mississauga Bus Rapid Transit (BRT) Project Thank you for attending this Public Information Centre.
CORE AREA SPECIFIC PLAN
 only four (A, B, D, and F) extend past Eighth Street to the north, and only Richards Boulevard leaves the Core Area to the south. This street pattern, compounded by the fact that Richards Boulevard is
Downtown Transit Connector. Making Transit Work for Rhode Island
 Downtown Transit Connector Making Transit Work for Rhode Island 3.17.17 Project Evolution Transit 2020 (Stakeholders identify need for better transit) Providence Core Connector Study (Streetcar project
Click to edit Master title style
 Nelson/Nygaard Consulting Associates SERVICE IMPROVEMENT STRATEGIES September 22, 2015 1 PROJECT OVERVIEW & WORK TO DATE 1. Extensive stakeholder involvement Throughout 2. System and market assessment
What We Heard Report - Metro Line NW LRT
 What We Heard Report - Metro Line NW LRT by Metro Line NW LRT Project Team LRT Projects City of Edmonton April 11, 2018 Project / Initiative Background Name Date Location Metro Line Northwest Light Rail
TRAFFIC PARKING ANALYSIS
 TRAFFIC PARKING ANALYSIS NAPA FLEA MARKET COUNTY OF NAPA Prepared for: Tom Harding Napa-Vallejo Flea Market 33 Kelly Road American Canyon, CA 9453 Prepared by: 166 Olympic Boulevard, Suite 21 Walnut Creek,
Address Land Use Approximate GSF
 M E M O R A N D U M To: Kara Brewton, From: Nelson\Nygaard Date: March 26, 2014 Subject: Brookline Place Shared Parking Analysis- Final Memo This memorandum presents a comparative analysis of expected
The Engineering Department recommends Council receive this report for information.
 CORPORATE REPORT NO: R161 COUNCIL DATE: July 23, 2018 REGULAR COUNCIL TO: Mayor & Council DATE: July 19, 2018 FROM: General Manager, Engineering FILE: 8740-01 SUBJECT: Surrey Long-Range Rapid Transit Vision
Traffic Engineering Study
 Traffic Engineering Study Bellaire Boulevard Prepared For: International Management District Technical Services, Inc. Texas Registered Engineering Firm F-3580 November 2009 Executive Summary has been requested
CTfastrak Expansion. Stakeholder Meeting #4 Manchester Town Hall June 3, 2016
 CTfastrak Expansion Stakeholder Meeting #4 Manchester Town Hall June 3, 2016 Today s Agenda Phase I Update 2016 Service Plan Implementation Schedule & Cost Update Phase II Services Timeline Market Analysis
Executive Summary October 2013
 Executive Summary October 2013 Table of Contents Introduction... 1 Rider Transit and Regional Connectivity... 1 Plan Overview... 2 Network Overview... 2 Outreach... 3 Rider Performance... 4 Findings...
Develop ground transportation improvements to make the Airport a multi-modal regional
 Project Overview TRANSPORTATION IMPROVEMENTS WHAT ARE THE PROJECT GOALS? Transportation transportation hub. Develop ground transportation improvements to make the Airport a multi-modal regional Land Use
QUALITY OF LIFE EXECUTIVE SUMMARY REPORT I O N S TAT I O N
 QUALITY OF LIFE EXECUTIVE SUMMARY REPORT UN I O N S TAT I O N T R AV E L by TR A I N Published September 2017 2015 PROGRESS MAP This document reports FasTracks progress through 2015 BACKGROUND RTD The
STRATEGIC PRIORITIES AND POLICY COMMITTEE MAY 5, 2016
 STRATEGIC PRIORITIES AND POLICY COMMITTEE MAY 5, 2016 Shift Rapid Transit Initiative Largest infrastructure project in the city s history. Rapid Transit initiative will transform London s public transit
4.0 TIER 2 ALTERNATIVES
 4.0 TIER 2 ALTERNATIVES The Tier 2 Alternatives represent the highest performing Tier 1 Alternatives. The purpose of the Tier 2 Screening was to identify the LPA utilizing a more robust list of evaluation
CITY OF LONDON STRATEGIC MULTI-YEAR BUDGET ADDITIONAL INVESTMENTS BUSINESS CASE # 6
 2016 2019 CITY OF LONDON STRATEGIC MULTI-YEAR BUDGET ADDITIONAL INVESTMENTS BUSINESS CASE # 6 STRATEGIC AREA OF FOCUS: SUB-PRIORITY: STRATEGY: INITIATIVE: INITIATIVE LEAD(S): BUILDING A SUSTAINABLE CITY
MOTION NO. M Preferred Alternative for the Puyallup Station Access Improvement Project
 MOTION NO. M2014 64 Preferred Alternative for the Puyallup Station Access Improvement Project MEETING: DATE: TYPE OF ACTION: STAFF CONTACT: Capital Committee Board PROPOSED ACTION 8/14/14 8/28/14 Recommendation
6/11/2018. June 7, Item #1 CITIZENS PARTICIPATION
 June 7, 2018 Item #1 CITIZENS PARTICIPATION 1 Item #2 APPROVAL OF MINUTES Item #3 TRAC GOALS, FRAMEWORK & AGENDA REVIEW 2 COMMITTEE GOALS Learn about Southern Nevada s mobility challenges, new developments
Northeast Corridor Alternatives Analysis. Public Involvement Round 2 Input on Alternatives for Further Study
 Northeast Corridor Alternatives Analysis Public Involvement Round 2 Input on Alternatives for Further Study Feb. 7-9, 2012 Agenda Review project background Progress summary Recommended alternatives for
THE CORNERSTONE APARTMENTS TRAFFIC IMPACT STUDY R&M PROJECT NO
 THE CORNERSTONE APARTMENTS SITUATED AT N/E/C OF STAUDERMAN AVENUE AND FOREST AVENUE VILLAGE OF LYNBROOK NASSAU COUNTY, NEW YORK TRAFFIC IMPACT STUDY R&M PROJECT NO. 2018-089 September 2018 50 Elm Street,
Pace Bus Depot Location Analysis
 Pace Bus Depot Location Analysis Key Notes 1. Options refer to conceptual sketches prepared by Kimley Horn. 2. The depot is assumed to accommodate Pace routes as they currently exist: 17 routes on the
TECHNICAL MEMORANDUM. Part A: Introduction
 TECHNICAL MEMORANDUM To: David J. Decker Decker Properties, Inc. 5950 Seminole Centre Ct. Suite 200 Madison, Wisconsin 53711 608-663-1218 Fax: 608-663-1226 www.klengineering.com From: Mike Scarmon, P.E.,
Green Line LRT: Beltline Segment Update April 19, 2017
 Green Line LRT: Beltline Segment Update April 19, 2017 Quick Facts On April 11, 2017, City Council approved Administration s recommendation for the Green Line to be underground in the Beltline from 2 Street
Location Concept Plan Amendment Recommendation Approved 2011 Concept Plan
 Valley Line West LRT Concept Plan Recommended Amendments Lewis Farms LRT Terminus Site Location Concept Plan Amendment Recommendation Approved 2011 Concept Plan Lewis Farms LRT terminus site, 87 Avenue/West
Tempe Streetcar. March 2, 2016
 Tempe Streetcar March 2, 2016 Tempe Profile 40 sq. miles, highest density in state University Town, center of region Imposed growth boundaries (density increase) Mixed use growth/intensifying land use
Needs and Community Characteristics
 Needs and Community Characteristics Anticipate Population and Job Growth in the City Strongest density of population and jobs in Ann Arbor are within the Study Area Population expected to grow 8.4% by
TBARTA USF to Wesley Chapel Express Bus Service Operating Plan. Draft 3/25/2014
 TBARTA USF to Wesley Chapel Express Bus Service Operating Plan Draft 3/25/2014 March 2014 Table of Contents 1.0 Introduction... 1 2.0 Study Area... 1 3.0 Existing Available Service... 3 4.0 Proposed Service...
Construction Realty Co.
 MEMORANDUM TO: FROM : Jeff Pickus Construction Realty Co. Luay R. Aboona, PE Principal 9575 West Higgins Road, Suite 400 Rosemont, Illinois 60018 p: 847-518-9990 f: 847-518-9987 DATE: May 22, 2014 SUBJECT:
TIMBERVINE TRANSPORTATION IMPACT STUDY FORT COLLINS, COLORADO JANUARY Prepared for:
 TIMBERVINE TRANSPORTATION IMPACT STUDY FORT COLLINS, COLORADO JANUARY 2014 Prepared for: Hartford Companies 1218 W. Ash Street Suite A Windsor, Co 80550 Prepared by: DELICH ASSOCIATES 2272 Glen Haven Drive
2/1/2018. February 1, Item #1 CITIZENS PARTICIPATION
 February 1, 2018 Item #1 CITIZENS PARTICIPATION 1 Item #2 APPROVAL OF MINUTES Item #3 TRAC GOALS, FRAMEWORK & AGENDA REVIEW 2 COMMITTEE GOALS Learn about Southern Nevada s mobility challenges, new developments
APPENDIX VMT Evaluation
 APPENDIX 2.7-2 VMT Evaluation MEMORANDUM To: From: Mr. Jonathan Frankel New Urban West, Incorporated Chris Mendiara LLG, Engineers Date: May 19, 2017 LLG Ref: 3-16-2614 Subject: Villages VMT Evaluation
2 EXISTING ROUTE STRUCTURE AND SERVICE LEVELS
 2 EXISTING ROUTE STRUCTURE AND SERVICE LEVELS In the Study Area, as in most of the Metro Transit network, there are two distinct route structures. The base service structure operates all day and the peak
WAKE TRANSIT PLAN Summer 2018
 WAKE TRANSIT PLAN Summer 2018 Planning for growth WAKE COUNTY s population already exceeds ONE MILLION and grows by more than 60 people a day. That s 23,000 people a year or basically another Morrisville.
This letter summarizes our observations, anticipated traffic changes, and conclusions.
 Mr. David Jorschumb Project Manager Boulder Valley School District Re: Review of proposed school access improvements at the Foothills Elementary School in Boulder Dear Mr. Jorschumb, At your request, the
FINAL. Sound Transit Long-Range Plan Update. Issue Paper S.1: Tacoma Link Integration with Central Link. Prepared for: Sound Transit
 Sound Transit Long-Range Plan Update Issue Paper S.1: Tacoma Link Integration with Central Link Prepared for: Sound Transit Prepared by: Quade & Douglas, Inc. FINAL March 2005 Foreword This issue paper
Proposed Program of Interrelated Projects
 DALLAS AREA RAPID TRANSIT Proposed Program of Interrelated Projects Federal Transit Administration Capital Investment Program Summer 204 INTRODUCTION The current federal transportation bill, Moving Ahead
Traffic Impact Analysis West Street Garden Plots Improvements and DuPage River Park Garden Plots Development Naperville, Illinois
 Traffic Impact Analysis West Street Garden Plots Improvements and DuPage River Park Garden Plots Development Naperville, Illinois Submitted by April 9, 2009 Introduction Kenig, Lindgren, O Hara, Aboona,
Appendix C. Parking Strategies
 Appendix C. Parking Strategies Bremerton Parking Study Introduction & Project Scope Community concerns regarding parking impacts in Downtown Bremerton and the surrounding residential areas have existed
PEACHTREE CORRIDOR PARTNERSHIP. Current Status & Next Steps
 PEACHTREE CORRIDOR PARTNERSHIP Current Status & Next Steps PEACHTREE CORRIDOR PARTNERSHIP Why Peachtree? Why Now? I. THE CONTEXT High Level View of Phasing Discussion Potential Ridership Segment 3 Ease
TRAIN, BUS & TRANSIT
 TRAIN, BUS & TRANSIT Input Metra 1 Metra does not want to add parking because of space; maxed out on number of cars per train. Developments on Rt. 59 will affect. 2 Should do studies regarding what the
Parking Management Element
 Parking Management Element The State Transportation Planning Rule, adopted in 1991, requires that the Metropolitan Planning Organization (MPO) area implement, through its member jurisdictions, a parking
San Rafael Civic Center Station Area Plan May 2012 DRAFT FOR PUBLIC REVIEW
 CHAPTER 4. PARKING Parking has been identified as a key concern among neighbors and employers in the area, both in terms of increased demand from potential new development and from SMART passengers that
We Want Your Input! Review the design alternatives and tell us what s important to you in the design of these areas of the approved BRT Network:
 We Want Your Input! Review the design alternatives and tell us what s important to you in the design of these areas of the approved BRT Network: Richmond North of Oxford Street Richmond Row Dundas Street
Capital Metro Downtown Multimodal Station
 Capital Metro Downtown Multimodal Station Stakeholder Briefing December 11, 2015 Agenda 1 2 3 4 5 Project Summary Downtown Station Concept Evaluation 4 th Street Traffic Analysis 5 th Street Traffic Analysis
Denver Car Share Program 2017 Program Summary
 Denver Car Share Program 2017 Program Summary Prepared for: Prepared by: Project Manager: Malinda Reese, PE Apex Design Reference No. P170271, Task Order #3 January 2018 Table of Contents 1. Introduction...
A Transit Plan for the Future. Draft Network Plan
 A Transit Plan for the Future Draft Network Plan Project Overview and Status Completed Market Analysis and Service Evaluation. Developed Plan Framework and Guiding Principles. Developed a draft Five Year
Otay Ranch Station 2020 MOBILITY SERVICES MAP REGIONAL MOBILITY HUB IMPLEMENTATION STRATEGY
 MAGDALENA REGIONAL MOBILITY HUB IMPLEMENTATION STRATEGY Otay Ranch Station Mobility hubs are transportation centers located in smart growth areas served by high frequency transit service. They provide
NAVY YARD BALLPARK STATION ACCESS IMPROVEMENTS STUDY. Final Report. Washington Metropolitan Area Transit Authority
 NAVY YARD BALLPARK STATION ACCESS IMPROVEMENTS STUDY Final Report Washington Metropolitan Area Transit Authority Office of Real Estate and Station Planning April 2016 [This page intentionally left blank]
TORONTO TRANSIT COMMISSION REPORT NO.
 Revised: March/13 TORONTO TRANSIT COMMISSION REPORT NO. MEETING DATE: March 26, 2014 SUBJECT: COMMUNITY BUS SERVICES ACTION ITEM RECOMMENDATION It is recommended that the Board not approve any routing
Maryland Gets to Work
 I-695/Leeds Avenue Interchange Reconstruction Baltimore County Reconstruction of the I-695/Leeds Avenue interchange including replacing the I-695 Inner Loop bridges over Benson Avenue, Amtrak s Northeast
Green Line LRT: Beltline Recommendation Frequently Asked Questions
 Green Line LRT: Beltline Recommendation Frequently Asked Questions June 2017 Quick Facts Administration has evaluated several alignment options that would connect the Green Line in the Beltline to Victoria
TABLE OF CONTENTS EXECUTIVE SUMMARY...1 INTRODUCTION...3 PROJECTED FUTURE GROWTH...3 ROADWAY IMPROVEMENT PROJECTS...4 POTENTIAL FUNDING SOURCES...
 Transportation Impact Fee Study September 2014 TABLE OF CONTENTS EXECUTIVE SUMMARY...1 INTRODUCTION...3 PROJECTED FUTURE GROWTH...3 ROADWAY IMPROVEMENT PROJECTS......4 POTENTIAL FUNDING SOURCES...7 PROPOSED
TRAVEL DEMAND FORECASTS
 Jiangxi Ji an Sustainable Urban Transport Project (RRP PRC 45022) TRAVEL DEMAND FORECASTS A. Introduction 1. The purpose of the travel demand forecasts is to assess the impact of the project components
Background Information about the Metrobus 29 Lines Study
 Background Information about the Metrobus 29 Lines Study Questions Overview of Existing Service Q. Why is the study being conducted? A. The 29 Lines provide an important connection between Annandale and
City of Marina. Regional Roundabout Study Utilizing Caltrans Intersection Control Evaluation Section 4: Transportation Agency for Monterey County
 Regional Roundabout Study Utilizing Caltrans Intersection Control Evaluation Section 4: City of Marina Study Intersections: RESERVATION ROAD AT BEACH ROAD RESERVATION ROAD AT DEFOREST ROAD CARDOZA AVENUE
Restoration of Historic Streetcar Services in Downtown Los Angeles
 Restoration of Historic Streetcar Services in Downtown Los Angeles Early Scoping Meeting for Alternatives Analysis (AA) May 17, 2011 Introduction Key players Local lead agency: Metro Federal lead agency:
THE WAY WE MOVE LRT FOR EVERYONE
 THE WAY WE MOVE LRT FOR EVERYONE 2 LRT for Everyone LRT FOR EVERYONE Light rail is about more than transit; it s about transforming Edmonton. As the city grows, so do its transportation needs. LRT is an
SERVICE DESIGN GUIDELINES
 VTA TRANSIT SUSTAINABILITY POLICY: APPENDIX A SERVICE DESIGN GUIDELINES Adopted February 2007 COMMUNITYBUS LOCALBUS EXPRESSBUS BUSRAPIDTRANSIT LIGHTRAILTRANSIT STATIONAREAS S A N T A C L A R A Valley Transportation
BARRHAVEN FELLOWSHIP CRC 3058 JOCKVALE ROAD OTTAWA, ONTARIO TRANSPORTATION BRIEF. Prepared for:
 BARRHAVEN FELLOWSHIP CRC 3058 JOCKVALE ROAD OTTAWA, ONTARIO TRANSPORTATION BRIEF Prepared for: Barrhaven Fellowship CRC 3058 Jockvale Road Ottawa, ON K2J 2W7 December 7, 2016 116-649 Report_1.doc D. J.
Alternatives Analysis Findings Report
 6.0 This chapter presents estimates of the potential capital, operations and maintenance costs associated with the alternatives carried forward for detailed evaluation. The methodology used to develop
Green Line Long-Term Investments
 Enhancements Short-term improvements to keep Austin moving. Investments Long-term projects to support our future. Mobility Hubs MetroRapid MetroRail MetroExpress Connectors Circulators Project Connect
Town of Londonderry, New Hampshire NH Route 28 Western Segment Traffic Impact Fee Methodology
 Town of Londonderry, New Hampshire NH Route 28 Western Segment Traffic Impact Fee Methodology Prepared by the Londonderry Community Development Department Planning & Economic Development Division Based
Regional Transportation Commission, Washoe County Lee Gibson, Executive Director Roger Hanson, Senior Planner
 Regional Transportation Commission, Washoe County Lee Gibson, Executive Director Roger Hanson, Senior Planner Presentation Outline Transit System Facts Economic Challenges in the Truckee Meadows RTC Transit
Chapter 4 : THEME 2. Transportation
 Chapter 4 : THEME 2 Strengthen connections to keep the Central Area easy to reach and get around 55 Figure 4.2.1 Promote region-wide transit investments. Metra commuter rail provides service to the east,
appendix 4: Parking Management Study, Phase II
 appendix 4: Parking Management Study, Phase II A4-1 A4-2 Eastlake Parking Management Study Final Phase 2 Report Future Parking Demand & Supply January 6, 2017 Submitted by Denver Corp Center III 7900 E.
I-26 Fixed Guideway Alternatives Analysis
 I-26 Fixed Guideway Alternatives Analysis Public Meetings: North Charleston, January 25, 2016 Charleston: January 26, 2016 Summerville: January 28, 2016 Agenda I. Project Update II. III. IV. Screen Two
Midtown Corridor Alternatives Analysis. Policy Advisory Committee Meeting February 12, 2014
 Midtown Corridor Alternatives Analysis Policy Advisory Committee Meeting February 12, 2014 Today s Agenda Introductions Outreach efforts and survey results Other updates since last meeting Evaluation results
Energy Technical Memorandum
 Southeast Extension Project Lincoln Station to RidgeGate Parkway Prepared for: Federal Transit Administration Prepared by: Denver Regional Transportation District May 2014 Table of Contents Page No. Chapter
Draft Results and Recommendations
 Waco Rapid Transit Corridor (RTC) Feasibility Study Draft Results and Recommendations Chris Evilia, Director of Waco Metropolitan Planning Organization Allen Hunter, General Manager Waco Transit System