FINAL TECHNICAL MEMORANDUM
|
|
|
- Stella Floyd
- 6 years ago
- Views:
Transcription
 Prepared by: AECOM USA, Inc.")
1 Metro Amherst-Buffalo Corridor TIER 3 SCREENING RESULTS FINAL TECHNICAL MEMORANDUM Prepared for: Niagara Frontier Transportation Authority (NFTA) Prepared by: AECOM USA, Inc. In Association with Wendel December 2016
2 Table of Contents 1. INTRODUCTION Overall Screening Approach REGULATORY SETTING CONCEPTUAL ALTERNATIVES & PLANNING FRAMEWORK Feedback Received on Tier 2 Alternatives Refinement of Alternatives Alternate Alignments Minimum Operable Segment (MOS) Feasibility of BRT Center Running Alignment Definition of Tier 3 Alternatives Planning Framework DETAILED TIER 3 RATING & CRITERIA METHODOLOGY Engineering/Right of Way Needs Criteria: Estimated Right-of-way Needs Criteria: Capital Cost Criteria: Operating and Maintenance Cost Criteria: Comparative Revenue Criteria: Percent of Mixed Traffic Operations Criteria: Percent of Signalized Intersections to Total Intersections Ridership/Markets Served Criteria: Ridership Criteria: Transit Dependent Ridership Criteria: UB Ridership Criteria: Park and Ride Ridership Criteria: VMT Change Criteria: Station Area Population and Employment Criteria: Commercial Areas Served System Connectivity Criteria: Access to Activity Centers Criteria: Access to Parks and Recreational Resources Criteria: Interface with Other Transit Services Criteria: Interface with Other Transit Services Criteria: Travel Time Between UB Key Destinations Criteria: Travel Time Savings...51 December 2016 Page i
3 4.4 Support for Transit-Oriented Development (TOD) Criteria: Consistency with Local and Regional Plans and Strategies Criteria: Existence of Transit Supportive Zoning to Station Areas Community and Environmental Impact Assessment Criteria: Impacts to Water Resources Criteria: Impacts to Parks Criteria: Property Impacts TIER 3 SCREENING RESULTS & DECISION METHODOLOGY Tier 3 Screening Results Selection of Locally Preferred Alternative...60 List of Figures Figure 1 Alternatives Analysis Process...2 Figure 2 Study Area...5 Figure 3 Articulated Bus Geometric Operating Characteristics...13 Figure 4 LRT Surface Cross Section...15 Figure 5 BRT Center Running Cross Section...16 Figure 6 Niagara Falls Boulevard LRT 1 Map...19 Figure 7 Millersport Highway LRT 1 Map...20 Figure 8 Niagara Falls Boulevard BRT 1 and Preferred Bus Map...21 Figure 9 Millersport Highway BRT 1 and Preferred Bus Map...22 Figure 10 Enhanced Bus Map...23 Figure Population Density LRT Alternatives...38 Figure Population Density BRT/Preferred Bus Alternatives...39 Figure Employment Density LRT Alternatives...40 Figure Employment Density BRT/Preferred Bus Alternatives...41 Figure 15 Commercial Area LRT Alternatives...43 Figure 16 Commercial Area BRT/Preferred Bus Alternatives...44 December 2016 Page ii
4 List of Tables Table 1 Tier 3 Alternatives...9 Table 2 MOS Capital Costs...10 Table 3 Projected 2035 MOS Ridership...10 Table 4 LRT Design Criteria...12 Table 5 BRT Design Criteria...13 Table 6 Tier 3 Screening Criteria...25 Table 7 Private Land Area Scale...26 Table 8 Private Land Area Affected...27 Table 9 Capital Cost Estimate Scale...28 Table 10 Capital Cost Estimate...28 Table 11 O&M Cost Estimate Scale...29 Table 12 O&M Cost Estimate...29 Table 13 Comparative Revenue Scale...30 Table 14 Comparative Revenue Estimate...30 Table 15 Percent Mixed Traffic Operations Scale...30 Table 16 Percent Mixed Traffic Operations...31 Table 17 Percent Signalized Intersections to Total Intersections Scale...31 Table 18 Percent Signalized Intersections to Total Intersections...31 Table 19 Projected Ridership Summary...32 Table 20 Projected Daily Boardings Scale...33 Table 21 Projected Daily Boardings...33 Table 22 Boardings From Zero Car Households Scale...33 Table 23 Forecasted 2035 Average Daily Project Boardings From Zero Car Households..34 Table 24 Projected UB Boardings Scale...34 Table 25 Projected UB Boardings, Table 26 Park and Ride Boardings Scale...35 Table 27 Projected Park-and-Ride Boardings, Table 28 VMT Change Scale...35 Table 29 VMT Change, Table 30 Station Area Population and Employment Scale...36 Table 31 Population Served...36 Table 32 Employment Served...37 Table 33 Commercial/Retail Areas Served Scale...42 Table 34 Commercial/Retail Areas Served...42 Table 35 Activity Centers...45 Table 36 Activity Centers Scale...46 Table 37 Number of Activity Centers Served...46 Table 38 Parks and Recreation Areas...47 December 2016 Page iii
5 Table 39 Parks and Recreation Areas Scale...47 Table 40 Number of Existing Parks and Recreational Resources Served...48 Table 41 Transfer Scale...48 Table 42 Minimum Number of Transfers...48 Table 43 Number of Bus Connections Scale...49 Table 44 Number of Bus Connections...49 Table 45 Travel Time Scale (UB South UB North)...50 Table 46 Travel Time Between UB Campuses (UB South UB North)...50 Table 47 Travel Time Scale (Allen Medical UB North)...50 Table 48 Travel Time Between UB Campuses (Allen Medical UB North)...51 Table 49 Travel Time Scale (Utica Station and CrossPoint)...51 Table 50 Travel Time Between Utica Station and CrossPoint...51 Table 51 Travel Time Savings (Minutes)...52 Table 52 Consistency with Regional Plans...53 Table 53 Growth Locations Scale...53 Table 54 Growth Locations...54 Table 55 Transit Supportive Zoning Scale...55 Table 56 Number of Station Areas with Transit Supportive Zoning...55 Table 57 Water Resources Scale...56 Table 58 Impacts to Water Resources...56 Table 59 Parks Scale...57 Table 60 Impacts to Parks, Recreation Areas and Open Space...57 Table 61 Affected Properties Scale...57 Table 62 Number of Properties Affected...58 Table 63 Scored Results of the Tier 3 Evaluation Matrix...59 December 2016 Page iv
6 1. INTRODUCTION The Niagara Frontier Transportation Authority (NFTA) in coordination with the Federal Transit Administration (FTA) initiated the preparation of an Alternatives Analysis (AA) to evaluate alternative transit alignments that will connect the existing Metro Rail University Station to key destinations in Amherst to improve transit connections between downtown Buffalo and Amherst. The project is intended to provide faster, more reliable transit service, improve transit connections between major destinations in the Amherst Buffalo Corridor, better serve existing transit riders, accommodate new transit patrons, and encourage economic development. This Tier 3 Screening Results Working Draft Technical Memorandum describes the third of three levels (or tiers) of alternatives screening and evaluation undertaken by NFTA in the AA process for the project. This memorandum includes a statement of the framework under which NFTA is undertaking this Alternatives Analysis, describes each alternative and the planning framework for the evaluation, summarizes the screening methodology, presents the results of the screening and evaluation, describes the input received upon sharing the results with the committees and the public, and presents the results of the third screening for use by NFTA in recommending a Locally Preferred Alternative (LPA). 1.1 Overall Screening Approach The alternatives development and evaluation process for the AA project consists of three distinct tiers of screening and evaluation. In each step, alternatives are examined and compared for their performance in terms of specific and progressively more detailed criteria along with increasingly more specific definition of alternatives. This process initially examines a large number of alternatives with the goal of reducing this long list of alternatives through screening and evaluation to only those that are reasonable (i.e., practical or feasible). In accordance with the Council on Environmental Quality s (CEQ) Regulations for Implementing the National Environmental Policy Act (NEPA), this process enables FTA and NFTA to screen the full range of alternatives and arrive at a subset of reasonable alternatives to undergo detailed study in the AA. Even though this AA study is not being performed within NEPA, it is the intent of the NFTA and FTA to link this planning process with NEPA as well as the related New York State Environmental Quality Review (SEQR) so that the full range of alternatives is analyzed. The intent is that at the end of Tier 3, an LPA can be identified and the NEPA phase of FTA s Project Development process initiated. Briefly, the three tiers of screening and evaluation process consist of: Tier 1: Preliminary Screening of the Long List of Alternatives Preliminary Alternatives Tier 1 is completed and was documented in the Tier 1 Technical Memorandum (May 2014). Tier 2: Initial Screening of the Preliminary Alternatives Final Build Alternatives Tier 2 is completed and was documented in the Tier 2 Technical Memorandum (May 2015). December 2016 Page 1

7 Tier 3: Final Screening and Evaluation of the Final Build Alternatives LPA the Tier 3 analysis is documented in this technical memorandum. NFTA s 2013 Screening Methodology Technical Memorandum for the Metro Amherst-Buffalo Corridor Project outlines in detail the entire screening methodology process for the AA and Figure 1 depicts the screening process within the overall Alternatives Analysis study. Figure 1 Alternatives Analysis Process 2. REGULATORY SETTING The Tier 1, 2 and 3 screenings are elements of the AA study and were undertaken in accordance with the CEQ Regulations for Implementing NEPA (40 Code of Federal Regulations ), with federal requirements related to the environmental review (23 CFR Part 771 et seq.), and the requirements for project development and for New Starts funding (FTA Capital Investment Grant Program, 49 USC 5309). As applicable to the Tier 1, 2 and 3 screenings, the following FTA rules and policy guidance were applied: Final Rules regarding the evaluating and rating major transit capital investments (January 9, 2013); New and Small Starts Policy Guidance (August, 2013); and Final Rules regarding environmental impact and related procedures (February 7, 2013). FTA released Proposed Interim Policy Guidance for their Capital Investment Grant Program in April 2015 and Final Interim Policy Guidance was recently released in August NFTA is conducting the alternatives screening and the AA to evaluate alternatives in terms of their transportation and environmental benefits and effects, and to aid in its decision- making on the course of action to take. In these activities, NFTA is complying with the Public Law and its guidance for developing transportation projects using federal funds entitled, Moving December 2016 Page 2
8 Ahead for Progress in the 21 st Century Act (MAP-21). In order to qualify for funding under the FTA New Starts program, 49 USC 5309 requires that projects be based upon the results of an environmental review. As stated early, the environmental review process (NEPA/SEQR) will commence once NFTA identifies an LPA. Under streamlining guidance, NFTA intends to link this AA study with the study that will occur under NEPA for environmental review and evaluation of the LPA. In addition, as a transportation infrastructure project for which NFTA may seek to use federal funds, the project will eventually be subject to other federal environmental review regulations during NEPA as defined by Section 4(f) and 6(f) of the Department of Transportation Act of 1966, Section 106 of the National Historic Preservation Act of 1966, the Clean Water Act and the Clean Air Act of 1970, along with other applicable federal, state and local regulations. 3. CONCEPTUAL ALTERNATIVES & PLANNING FRAMEWORK NFTA s alternatives development and evaluation process is grounded in the project purpose and need and its goals. The overall goal of the project is to improve transit access between key activity centers in Buffalo with those in Amherst by extending the benefits of high quality transit into Amherst. It represents a way to serve a strong transit market, provide high quality transit services to existing and emerging activity centers, attract additional transit riders, provide a more efficient ride for existing transit riders between Amherst and Buffalo, help to bolster economic development, and link existing communities. The study area is depicted on the map in Figure 2. The purpose of the proposed project is to provide a fast, reliable, safe, and convenient transit ride in the Amherst-Buffalo Corridor linking established and emerging activity centers along the existing Metro Rail Line in the City of Buffalo with existing and emerging activity centers in the Town of Amherst. The project will better serve existing rail and bus riders, attract new transit patrons, improve connections to/from Buffalo and Amherst, and support redevelopment and other economic development opportunities. Importantly, it will serve to improve livability by increasing mobility and accessibility in communities throughout the project corridor. The project will: Serve increased travel demand generated by new development in downtown Buffalo and in Amherst. Provide high-quality transit service to and from key activity centers in the Amherst- Buffalo Corridor by providing a time-efficient transit option connecting and serving key destinations in the corridor (University at Buffalo (UB) campuses, Buffalo Niagara Medical Campus (BNMC), the Buffalo central business district (CBD), business parks, the Buffalo waterfront, among others). Better serve transit-dependent population segments and improve opportunities for participation of the workforce in the overall regional economy. Improve the system operating efficiency of the transit network. Support local and regional land use planning and transit-oriented design. Provide social benefits from transit investment that supports an array of economic and affordable housing development. December 2016 Page 3
9 Help meet the sustainability goals and measures as contained in state, regional, and local plans (One Region Forward-The Regional Plan for Sustainable Development, Buffalo Niagara the Metropolitan Transportation Plan of the Greater Buffalo- Niagara Regional Transportation Council, Erie and Niagara Counties Framework for Regional Growth, the University at Buffalo 2020 Plan, the Western New York Regional Economic Development Council s (WNYREDC) Economic Development Strategic Plan, the City of Buffalo Comprehensive Plan, and the Town of Amherst Comprehensive Plan, among others). Help relieve parking constraints and capacity issues on the Buffalo Niagara Medical Campus and surrounding downtown area to minimize traffic and parking-related impacts on neighborhoods. Stabilize property values in real estate markets where values have been falling and increase property values for residential and commercial land in already stable real estate markets. December 2016 Page 4


10 Figure 2 Study Area December 2016 Page 5
11 The alternatives under consideration within the AA consist of the following: No Build Alternative: Represents future conditions in the AA analysis year of 2035 without the proposed project. The No Build Alternative includes the existing transit and transportation system in the region plus all projects in the region s fiscally constrained long range transportation plan. The No Build Alternative is included in the AA as a means of comparing and evaluating the impacts and benefits of the Build Alternatives. The No Build Alternative is included in all tiers of screening for comparison purposes but is not evaluated/screened in the same manner as the Build Alternatives. It is instead used as a baseline against which the Build Alternatives are compared during evaluation. Build Alternatives: Build Alternatives are future conditions in the AA analysis year of 2035 with the proposed project. The Build Alternatives are being developed through a tiered screening and alternatives definition process. The process began with a determination of a Long List of Alternatives. There were two major categories of Build Alternatives under consideration: 1) fixed-guideway alternatives, meaning either Light Rail Transit (LRT) or Bus Rapid Transit (BRT), and 2) non-fixed guideway alternatives, meaning the alternatives that are less capital investment intensive and represent more modest improvement to transit services and are the Enhanced Bus Alternative and the Preferred Bus Alternative. NFTA developed the Long List of Alternatives from previous studies, new concepts NFTA and its engineering consultants developed, and ideas identified through agency, stakeholder and public outreach activities. Given the developed nature of the study area and an effort to avoid and minimize negative effects, the Long List of Alternatives that NFTA identified primarily used existing transportation rights of way. The Long List of Alternatives was screened in the Tier 1 evaluation process and the remaining Alternatives were developed in more detail and evaluated in the Tier 2 screening process. From the Tier 2 screening process, the following Build Alternatives are being further evaluated as part of the Tier 3 process: Niagara Falls Boulevard LRT 1, Millersport Highway LRT 1, Niagara Falls Boulevard BRT 1, Millersport Highway BRT 1, Niagara Falls Boulevard Preferred Bus, Millersport Highway Preferred Bus, and Enhanced Bus. 3.1 Feedback Received on Tier 2 Alternatives Two public open house informational meetings were held on June 11 th and 23 rd in Participants had the opportunity to speak with study team members and complete comment forms to provide input on the Tier 2 screening and the four recommended alternatives that were proposed to advance to Tier 3 analysis. Common themes received as feedback include the following: LRT was clearly the preferred mode over BRT with roughly 85% of those who commented favoring LRT. Most favor the light rail alternative via Niagara Falls Boulevard as it was perceived to have the most available right of way and was perceived that it would have less direct impacts on properties along the alignment. December 2016 Page 6
12 LRT was seen as the best mode for lessening impacts on the environment, for speed of travel, for the potential for offering a one-seat ride (meaning requiring fewer transfers), for serving disadvantaged and transit-dependent populations, and for providing convenient connections among destinations as well as to other modes of travel. BRT was generally perceived as too slow, requiring many transfers and less easy to use and as a sample the following comment was made: All the Bus "Rapid Transit alternatives are anything but rapid. Buses stuck in mixed traffic and 35MPH on Millersport, Bailey or Niagara Falls Blvd doesn't attract ridership. Strong support for making any new transit investment bicycle-friendly and LRT was seen as better option for bicyclists bringing a bike on-board transit than BRT. The Tier 2 screening results were also reviewed with NFTA s Project Steering Committee and Project Advisory Committee and the common themes mentioned by the public were echoed during the review and discussion with the committees. The committees suggested that there appeared to be a lack of LRT alternatives being recommended as moving forward into Tier 3 with only one LRT alternative being considered for advancement into Tier 3. The committees stated that as a result if these recommendations hold, the focus in Tier 3 will be too centered on BRT alternatives and that this suggests that NFTA had already identified a preferred mode and that it was BRT. The committees strongly favored advancing a more equitable balance in modes for the alternatives moving forward in Tier 3. Additionally, the committees recognized that BRT could be developed in a corridor as a precursor, high-quality transit service that then lends to eventual construction and transit service by LRT and as a result, the committees indicated that both LRT and BRT alternatives should be examined in the same corridor in Tier 3. The committees also recognized the existing constrained environment (only 2 travel lanes; limited setbacks from the existing roadway of residential properties; probable high impacts to private property in implementing BRT) on Bailey Avenue and that BRT on Bailey would need to operate in mixed traffic, thus, would not offer any speed differential or improved reliability and suggested that the BRT Alternative on Bailey does not merit further consideration in Tier 3 and should be dropped. From a technical view, the Bailey BRT alternative as a precursor to eventually upgrading the corridor to LRT was not a reasonable alternative to continue to pursue in Tier 3. Prior work completed in Tier 2, identified that the Baily LRT alternatives were inferior from an engineering perspective to either of the LRT alternatives on Niagara Falls Boulevard or Millersport Highway due to the significant increase in the length of underground construction including underground stations and the greater level of impacts then either of the LRT alternatives in the other corridors under consideration. Equally important was that the location of the Bailey LRT alignments was essentially duplicating the ridership capture area provided by the Niagara Falls Boulevard LRT and BRT alignments with fewer impacts. The addition of the Millersport Highway LRT alternative into the set of recommended alternatives to be carried forward into Tier 3 is consistent with the public and committee desires to consider the potential that if BRT alternatives are selected that they provide the opportunity to build transit ridership for future consideration of LRT. The Millersport Highway LRT alignment provides that opportunity for potential upgrading of the alignment if warranted from BRT service to LRT service at some future date. Reflecting public and committee feedback that demonstrates a preference for LRT over BRT as a mode, the concerns offered by the public and committees that it would benefit the study to advancing more LRT alternatives into Tier 3, and the recognition by the committees that BRT December 2016 Page 7
13 could be implemented as a precursor transit service to LRT in a corridor and that Bailey Avenue represents a constrained corridor for BRT, the AECOM team recommended to NFTA that the following fixed guideway alternatives be advanced into Tier 3: LRT Alternatives Niagara Falls Boulevard 1 Millersport Highway 1 BRT Alternatives Niagara Falls Boulevard 1 Millersport Highway Refinement of Alternatives As a result of both the conceptual engineering conducted and on-going dialogue with key stakeholders, alignment pathways for the alternatives were also refined. For example, to access Niagara Falls Boulevard using LRT from the existing underground Metro Rail at UB South Campus University Station, conceptual engineering determined that the use of Main Street and Bailey Avenue in an underground environment was required as the curve radii at Kenmore Avenue could not be met and prevents direct access to Niagara Falls Boulevard from this location by light rail. Conceptual level options, opportunities, and constraints associated with the horizontal alignment and vertical profile configurations to bring the existing Light Rail Transit (LRT) to the surface at the UB South Campus University Station were explored. See the South Campus Conceptual Profile Analysis Technical Memorandum dated February 2015 for additional detail. Additionally, dialogue with UB officials resulted in one preferred common alignment pathway for LRT alternatives through the UB North Campus. This definition of one common LRT pathway through UB North Campus resulted in the elimination of one LRT alternative (Millersport LRT 2) as the only difference between Millersport LRT 1 and Millersport LRT 2 was how each traversed through UB North. And similarly a common alignment pathway for BRT alternatives through the UB North Campus also resulted from dialogue with UB officials. As a result, this also reduced the BRT alternatives using Millersport Highway to one. Also, on the I-990, there will be ballasted track and also safety walls/barriers separating LRT operating area from highway operating since LRT will be in the median. Table 1 provides general information on the alignment pathways and service plans for the alternatives being evaluated in Tier 3. The alternatives are described in more detail in the Operations and Maintenance Cost Estimation Report (December 2015). Note that these alternatives were developed at a conceptual level. These conceptual alternatives will be refined and defined in greater detail in subsequent stages of project development. December 2016 Page 8
14 Table 1 Tier 3 Alternatives Alternative Alignment Pathway ROW Niagara Falls Blvd LRT 1 Millersport Hwy LRT 1 Niagara Falls Blvd BRT 1 Millersport Hwy BRT 1 Niagara Falls Blvd Preferred Bus Millersport Hwy Preferred Bus Enhanced Bus Main St, Bailey Ave, Eggert Rd, Niagara Falls Blvd, Maple Rd, Sweet Home Rd, UB North Campus, Audubon Pkwy, I-990, Crosspoint Main St, Bailey Ave, Grover Cleveland Hwy, Millersport Hwy, Flint Rd, UB North Campus, Audubon Pkwy, Sylvan Pkwy, Millersport Hwy, Crosspoint Main St, Kenmore Ave, Niagara Falls Blvd, Ridge Lee Rd, North Bailey Ave, Maple Rd, Sweet Home Rd, Rensch Rd, UB North Campus, Audubon Pkwy, I-990, Crosspoint Main St, Bailey Ave, Grover Cleveland Hwy, Millersport Hwy, Flint Rd, UB North Campus, Audubon Pkwy, Sylvan Pkwy, Millersport Hwy, Crosspoint Main St, Kenmore Ave, Niagara Falls Blvd, Ridge Lee Rd, North Bailey Ave, Maple Rd, Sweet Home Rd, Rensch Rd, UB North Campus, Audubon Pkwy, I-990, Crosspoint Main St, Bailey Ave, Grover Cleveland Hwy, Millersport Hwy, Flint Rd, UB North Campus, Audubon Pkwy, Sylvan Pkwy, Millersport Hwy, Crosspoint Frequency/span/coverage improvements to Routes 34, 35, 44, 47, 48, 49, 64 fixed guideway fixed guideway partial fixed guideway partial fixed guideway mixed traffic mixed traffic mixed traffic Span of Service Weekdays 5 AM 1 AM; Saturdays 7 AM 1 AM; Sundays 8 AM 12 AM Varies by route; mostly 17 hours per day Frequency of Service 10 minutes peak; 12 minutes transitional; 15 minutes off-peak and Saturdays; 20 minutes Sundays 10 minutes peak; 12 minutes transitional; 15 minutes off-peak and Saturdays; 20 minutes Sundays 10 minutes peak; 15 minutes offpeak, Saturdays and Sundays 10 minutes peak, 15 minutes offpeak, Saturdays and Sundays 10 minutes peak; 15 minutes offpeak, Saturdays and Sundays 10 minutes peak; 15 minutes offpeak, Saturdays and Sundays minutes peak; minutes off-peak; minutes Saturdays and Sundays December 2016 Page 9
15 3.3 Alternate Alignments During the process of refining the Tier 2 alternatives for Tier 3 analysis, two alternate alignment schemes were also analyzed. First, a minimum operating segment (MOS) that terminated all alternatives just north of UB North was analyzed. Second, the feasibility of operating the BRT alternatives in the median along the LRT alignments was evaluated. Note that these alternative alignments were developed at a conceptual level. These conceptual alternatives will be refined and defined in greater detail in subsequent stages of project development Minimum Operable Segment (MOS) The team reviewed the alignments for each of the LRT and fixed-guideway BRT alternatives for each of the remaining two corridors Niagara Falls Blvd and Millersport Highway. Based on the review of capital costs and ridership by station, it was determined that any truncation/or phased construction of a minimum operable segment (MOS) would only be to the intersection of Audubon Parkway and the I-990 for both corridors. At that location a Park and Ride station would be identified for determining resulting ridership for the MOS for each of the LRT and fixed-guideway BRT alternatives. Thus, north of the University s North Campus, all truncated alternatives would use a common alignment to a I-990 Park and Ride station. Based on the land use along Millersport Highway north of the UB North Campus and the lack of a Millersport Highway connection with the I-990 in the near vicinity of UB North, an MOS does not exist along Millersport Highway that would potentially capture the I-990 trips. Potential linkages along Millersport Highway with the I-990 would require extensive extensions in the area of French Road requiring increased miles of guideway, defeating the purpose of the truncated alignment or MOS. Accordingly, all fixed-guideway BRT and LRT truncated or MOS alternatives, including those for Millersport Highway would terminate at Audubon Parkway and the I-990. Table 2 includes an estimate of capital costs for the MOS Alternatives and Table 3 includes projected 2035 total daily boardings and subset figures for UB and Park and Ride boardings for the MOS Alternatives. Table 2 MOS Capital Costs Alternative Capital Cost Niagara Falls Blvd LRT 1 $ 1,249 Millersport Hwy LRT 1 $ 1,274 Niagara Falls Blvd BRT 1 $ 266 Millersport Hwy BRT 1 $ 167 Table 3 Projected 2035 MOS Ridership Alternative Daily Boardings UB Boardings PnR Boardings Niagara Falls Blvd LRT 1 22,000 13, Millersport Hwy LRT 1 19,000 12, Niagara Falls Blvd BRT 1 20,600 12, Millersport Hwy BRT 1 15,700 11, December 2016 Page 10
16 3.3.2 Feasibility of BRT Center Running Alignment As part of the more in depth analysis of Tier 3 Alternatives, the potential for using LRT alignments and center running cross sections for BRT operations was evaluated. This evaluation was performed to identify modifications to the LRT alignments and cross sections (presented in the Tier 2 Report) that would be necessary to accommodate BRT operations. In addition, this evaluation would ascertain whether future Right-of-Way (ROW) needs for BRT Alternatives could be reduced. This would be utilized for implementing BRT and later replacing the BRT with LRT using the same alignment Alternatives Evaluated The LRT alignments, retained for Tier 3 screening, were evaluated for initial use of BRT operation including the following Tier 3 Alternatives. The discussion presented in this section was originally developed for the Feasibility of BRT Center Running Alignment Technical Memorandum dated September Niagara Falls Boulevard LRT Alternative 1 Conceptual Alignment Main Street Bailey Avenue Eggert Road- Niagara Falls Boulevard- Maple Road Sweet Home Road Rensch Road- UB North Campus Alignment John James Audubon Parkway I-990 Crosspoint Business Park The concept alignment would begin at the South Campus Station and utilize the existing run out tunnel to Bailey Avenue. The concept alignment will continue underground below Bailey Avenue and Eggert Road to a portal in near Alberta Drive. Once at the surface, the concept alignment would utilize a dedicated guideway in the center of Niagara Falls Boulevard ROW to the Boulevard Mall. North of Sheridan Drive, the guideway would be constructed within the existing Niagara Falls Boulevard median and would continue in the center of Maple Road to Sweet Home Road. The concept alignment would utilize dedicated guideway rail lines in the center of Sweet Home Road to a point near the Rensch Road Entrance to the UB North Campus. On the campus the concept alignment would utilize surface lanes running parallel to and south of Putnam Way. The concept alignment would exit the UB campus utilizing a surface guideway and travel in the median of John James Audubon Parkway to the I-990. The LRT alignment would be located in the median of I-990 on newly constructed guideway to Crosspoint Business Park. New or widened bridges would be utilized at existing grade crossings. The guideway would be elevated on a new structure from the I-990 median into the Crosspoint Business Park. BRT center running alignment was considered from the portal north to the Crosspoint Business Park. South of the portal, BRT service would operate as presented in the Tier 3 BRT Alternative. Millersport Highway LRT Alternative 1 Conceptual Alignment Main Street Bailey Avenue Grover Cleveland Highway Millersport Highway Flint Road UB North Campus Alignment Putnam Way John James Audubon Parkway Sylvan Parkway Millersport Highway - Crosspoint Business Park The concept alignment would begin at the South Campus Station utilizing the existing run out tunnel and continue underground to Bailey Avenue and surface through a portal on Millersport Highway near Westfield Road. On Millersport Highway surface guideway would be constructed in the median to the intersection of Flint Road. A shallow cut and cover tunnel would be used to provide a grade separated crossing of the Maple Road and the UB North Campus circulatory December 2016 Page 11
17 road to a point south of Augsburger Road. On the campus the concept alignment would utilize surface guideway and approximately follow Putnam Way. The concept alignment would exit the UB campus utilizing a surface guideway and travel in the median of John James Audubon Parkway and Sylvan Parkway to Millersport Highway. The LRT would continue in the median of Millersport Highway to Crosspoint Business Park utilizing a dedicated surface guideway. BRT center running alignment was considered from the portal north to the Crosspoint Business Park. South of the portal, BRT service would operate as presented in the Tier 3 BRT Alternative LRT and BRT Design Criteria Conceptual design criteria were developed for LRT and BRT Alternatives in Tier 2. These criteria are summarized below and were used to determine the potential for BRT center running on LRT alignments. Design and operating parameters for the NFTA s existing LRT vehicles and system were used to develop design criteria set forth in Table 4. Table 4 LRT Design Criteria 1. Design Vehicle - Existing NFTA light rail vehicle 2. Speeds a. Below Ground Tunnel Segments 50 mph b. Above Ground Bridge Section 50 mph c. At Grade outside Street ROW- 50 mph d. At Grade within Street ROW Speed limit of adjacent roadway e. At Grade mixed pedestrian 15 mph f. Yard 5 mph 3. Horizontal Alignment a. Minimum length of the tangent section between curves is 3 times the speed or 100 ft whichever is larger b. Minimum radius is governed by design speed c. Minimum radius for yard and secondary track is 75 feet d. Equilibrium super elevation maximum is 10 inches e. Curvature in degrees based on Ee of 10 inches, D = 6.1 degrees (maximum) 4. Vertical Alignment a. Maximum grade shall be 5% b. Changes in grade should be connected by parabolic curves c. Minimum length of vertical curve (L) shall be larger of the following: i. L = D V 2 ii. L = 33D L = length of curve D = Algebraic difference of adjoining grades in percent V = Design Speed in mph d. Absolute minimum length (L) of vertical curve is 100 feet e. The minimum length of constant grade between curves shall be 75 feet Design criteria for BRT provide criteria relative to horizontal and vertical alignment geometry, travel lane widths as well as geometry for intersections, queue jumps and other BRT design elements. A standard low floor articulated bus was selected as the design vehicle. Geometric December 2016 Page 12
18 operating characteristics associated with that bus are illustrated in Figure 3. BRT design criteria are set forth in Table 5. Figure 3 Articulated Bus Geometric Operating Characteristics Table 5 BRT Design Criteria 1. Design Vehicle Articulated Bus 2. Speeds a. At Grade outside Street ROW- 55 mph b. At Grade within Street ROW Speed limit of adjacent roadway c. Above Ground Bridge Section 45 mph d. At Grade Mixed Pedestrian Section 15 mph 3. Horizontal Alignment a. Minimum radius is governed by design speed per AASHTO Geometric Design of Highways and Streets b. Minimum radius at intersections is 20 feet based on Design Vehicle Turning Geometry c. Maximum super elevation maximum is 4% 4. Vertical Alignment a. Maximum grade shall be 5% b. Changes in grade should be connected by simple curves c. Minimum length of vertical curve (L) shall be 100 feet December 2016 Page 13
19 LRT Cross Sections LRT vehicles would operate within dedicated guideways that are located in underground tunnels, within existing streets or in at-grade surface off-street guideways. Tunnel or existing street segments were not considered for BRT operations. Co-location of LRT/BRT operations was only considered for segments where LRT operations would occur within at-grade surface guideways. Surface guideway cross sections for Niagara Falls Boulevard LRT 1 and Millersport Highway LRT 1 were developed using the following criteria. All surface segments of LRT Preliminary Alternatives would operate in dedicated guideways. Vehicle traffic would be precluded from operating within LRT guideways. Within existing street rights-of-way, existing turn lanes would be eliminated with turns being restricted to street intersections. Available snow storage as well as parkway and green space will be reduced to required minimum widths based on AASHTO and NYSDOT design criteria. The guideway width in segments would be 35 feet and includes stations. Stations would consist of offset raised boarding platform and be located adjacent to the BRT travel lane. The minimum station platform width would be 10 feet. In areas where guideway is located outside of existing street rights-of-way, the guideway width shall be 60 feet. This width will accommodate the LRT guideway as well as areas outside the guideway for construction and future maintenance. A representative cross section for the Niagara Falls Boulevard and Millersport Highway corridors is illustrated in Figure 4 and described below. LRT Cross Section This section represents an at-grade guideway located in the center of the travel lanes. The existing center turn lane or median would be eliminated and left turns now would be restricted to cross street intersections. Surface stations would incorporate separate staggered outside platforms for inbound and outbound trains. The additional width required for LRT development is 35 feet. This cross section was used to determine modifications required for BRT operations. December 2016 Page 14
20 Figure 4 LRT Surface Cross Section BRT Cross Sections For the purposes of this co-location analysis, BRT vehicles would operate within the LRT dedicated guideways that are located within existing streets or off-street. Accordingly, a single representative cross section was developed for BRT operating within the LRT cross section using the following criteria. The guideway width in segments between stations would be 35 feet. At stations, this guideway width would increase to 45 feet. Stations would consist of offset level boarding platforms and be located adjacent to the BRT travel lane. The minimum station platform width would be 10 feet. A single cross section have been developed using these criteria and representative cross sections for the Niagara Falls Boulevard and Millersport Highway corridors. The BRT cross section is illustrated in Figure 5 and described below. BRT Cross Section This section represents an at-grade guideway located in the center of the travel lanes. The existing center turn lane or median would be eliminated and left turns now would be restricted to cross street intersections. Surface stations would incorporate separate staggered outside platforms for inbound and outbound buses. The additional width required for BRT development is 35 feet. December 2016 Page 15
21 Figure 5 BRT Center Running Cross Section LRT and BRT Alignment Analysis Results LRT and BRT cross sections presented above were compared to determine if BRT operations generally could be accommodated within the LRT cross section. As demonstrated by Figures 2 and 3, within non-station on-roadway segments both BRT and LRT guideways will require approximately 35 feet. In those segments that are located off roadway, the proposed guideway cross section of 60 feet would be wide enough to accommodate BRT or LRT operations including stations. Therefore with the exception of passenger boarding stations associated with the BRT Alternatives, BRT vehicles could operate within the proposed LRT cross section. At BRT stations, an additional 10 feet would be required to accommodate the station consisting of the level boarding passenger platform and shelter. Accordingly, the proposed cross section would be widened to accommodate staggered station locations. Tapered transitions would be utilized to shift adjacent traffic lanes before and after the station. Typically, the overall length of the station including approach and departure transitions would be approximately 780 LF. This would consist of the 80 LF platform, 400 LF approach transition and 300 LF departure transition. In addition to cross section width, the other issue that would potentially impact BRT operations within the proposed LRT corridor is the use of bypass lanes to skip" BRT stations. The use of bypass lanes to skip BRT stations would not be feasible. Additional cross section width would be required to create separate inbound and outbound pull off lanes at designated bypass stations. The additional cross section width to accommodate bypass lanes is approximately 14 feet. In addition, the length of tapered transitions to shift adjacent travel lanes would be increased to 1,170 LF approach transition and 1,040 LF departure transition. This would make the overall length of the station greater than 2,290 LF. December 2016 Page 16
22 A detailed analysis of the ROW impacts of this change has not been assessed. However, we would envision that this change to co-locate BRT within the LRT alignment would bring the ROW acquisition requirements for BRT more in line with LRT Alternatives Conclusion - Center Running BRT The shift to center-running BRT would occur beginning near the portals where tunnel segments transition to surface segments. Between the existing South Campus Station and these LRT tunnel portals, the BRT alignment would follow the original proposed BRT Alternative alignment. The center running BRT option could reduce the amount of initial ROW needed for future LRT operations and would avoid impacting the same properties twice. The option also provides a basis for establishing a transit ROW for use in future development planning and land use regulation (see Section 4.4 for more information on this concept). Based on the analysis presented herein, it is feasible to shift BRT operations to the center running LRT alignments for Niagara Falls Boulevard 1 and Millersport Highway 1. However, the study team is not advocating for the implementation of BRT on Bailey Avenue as a precursor to LRT as BRT operations were not deemed feasible on Bailey Avenue during the Tier 2 evaluation process and the only LRT option to access Niagara Falls Boulevard is to use Bailey Avenue through an underground alignment. The use of BRT as a precursor to LRT for the Niagara Falls Boulevard 1 alignment is only feasible north of the portal. Thus, for Niagara Falls Boulevard, the BRT precursor to LRT would be on Niagara Falls Boulevard, not Bailey Avenue. 3.4 Definition of Tier 3 Alternatives In preparation for the Tier 3 evaluation process, the remaining Build Alternatives are defined as follows: Niagara Falls Boulevard o LRT o BRT o Preferred Bus Millersport Highway o LRT o BRT o Preferred Bus Enhanced Bus The fixed guideway alternative alignments were developed at a conceptual level and described in detail in the Tier 2 report and any refinements were noted earlier in this section as well as in the Operations and Maintenance Cost Estimation Report (December 2015). Maps of each of the alignments are provided on the following pages and include type of operations, running ways, stations/stops and locations of queue jumps and transit signal priority (TSP) as appropriate. These conceptual alternatives will be refined and defined in greater detail in subsequent stages of project development. Preferred Bus and Enhanced Bus alternatives were not evaluated in the Tier 2 report. Preferred Bus alternatives follow the same alignment as the BRT alternatives, except that they operate in December 2016 Page 17
23 mixed traffic rather than within a designated ROW. They have the same stations as the BRT alternatives. The Preferred Bus alternatives are described in detail in the Operations and Maintenance Cost Estimation Report (December 2015). The Preferred Bus alternatives are shown on the maps with the BRT alternatives on the following pages. The Enhanced Bus alternative includes improvements to existing NFTA bus routes operating within the study area (see Figure 10): 34, 35, 44, 47, 48, 49, and 64 Improvements to the existing routes that are part of the Enhanced Bus alternative include: better frequency, longer span of service on weekdays and/or weekends, and extension to cover more area. The Enhanced Bus improvements are described in detail in the Operations and Maintenance Cost Estimation Report (December 2015). December 2016 Page 18


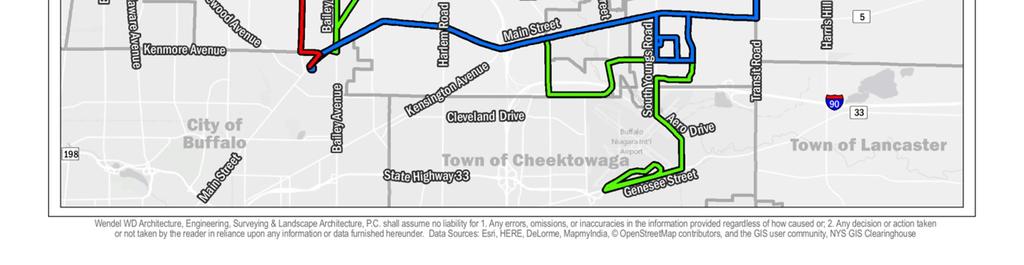
24 Figure 6 Niagara Falls Boulevard LRT 1 Map December 2016 Page 19
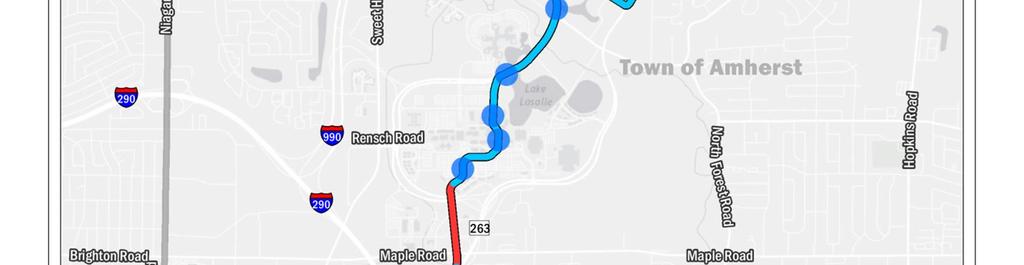
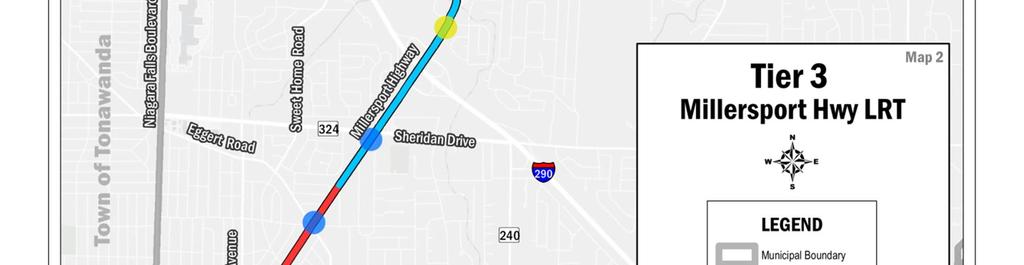
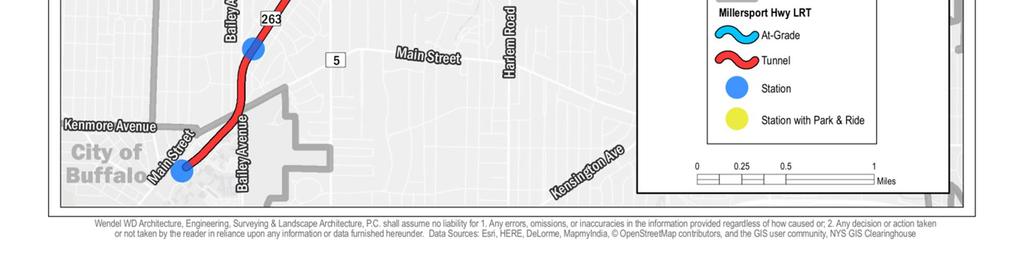
25 Figure 7 Millersport Highway LRT 1 Map December 2016 Page 20


26 Figure 8 Niagara Falls Boulevard BRT 1 and Preferred Bus Map December 2016 Page 21


27 Figure 9 Millersport Highway BRT 1 and Preferred Bus Map December 2016 Page 22


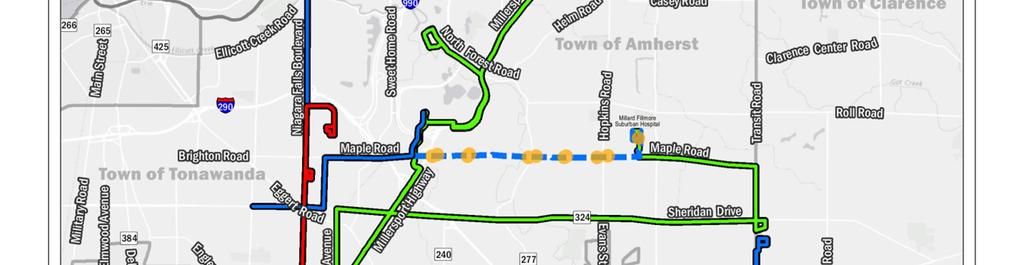
28 Figure 10 Enhanced Bus Map December 2016 Page 23
29 3.5 Planning Framework NFTA s Tier 2 screening criteria reflect FTA s framework for evaluating and rating major transit capital investments in FTA s New Starts program. New Starts projects are evaluated and rated according to criteria set forth in FTA s 2013 Final Rules and New and Small Starts Policy Guidance. As noted FTA recently released Proposed Interim Policy Guidance for their Capital Investment Grant Program in April 2015.The statutory project justification criteria and their associated measures include: Mobility improvements total number of linked trips using the project with extra weight given to trips made by transit dependent persons (estimated annual trips); Environmental benefits dollar value of anticipated direct and indirect benefits to human health, safety, energy, and the air quality environment scaled by the cost of the project and computed based on the change in vehicle miles traveled (VMT) resulting from the implementation of the proposed project (as calculated from estimates of change in automobile and transit vehicle miles traveled); Congestion relief as per the recently released guidance (April 2015), FTA is proposing to use new transit trips resulting from implementation of the project. FTA proposed to calculate new transit trips by comparing total transit trips for the No Build alternative with total transit trips once the proposed project is implemented. Economic development effects the extent to which a proposed project is likely to enhance additional, transit supportive development in the future is based on a qualitative examination of local plans and policies to support economic development proximate to the project; Land use an examination of existing corridor and station area development; development character; existing station area pedestrian facilities; existing corridor and station area parking supply; and affordable housing in the corridor and station areas; and Cost-effectiveness annual capital and operating cost per trip on the project. The statute also requires FTA to examine the following when evaluating and rating a local financial commitment: Availability of reasonable contingency amounts; Availability of stable and dependable capital and operating funding sources; and Availability of local resources to recapitalize, maintain, and operate the overall existing and proposed public transportation system without requiring a reduction in existing services. The statute requires FTA to give comparable, but not necessarily equal weight to their evaluation criteria. In the Guidance, FTA will give each of the project justification criteria equal weight. Because of changes made by MAP-21, the FTA s Final Rules do not address how FTA will develop overall New Starts project ratings. Instead, FTA has indicated that this will be the subject of future, subsequent rulemaking. As an interim approach until that rulemaking process is complete, FTA has proposed to give 50 percent weight to the summary project justification rating and 50 percent to the summary local financial commitment rating to arrive at an overall rating. FTA also has proposed to continue requiring at least a medium rating on both project justification and local financial commitment to obtain a medium or better rating overall. December 2016 Page 24
30 In the Tier 2 screening, NFTA developed criteria to measure the effectiveness of the Preliminary Alternatives at achieving the project purpose, need and goals. In doing so, NFTA considered several factors. First NFTA s Tier 2 screening criteria reflected FTA s statutory project justification criteria for which sufficient engineering and environmental detail has been developed to yield meaningful results. Second, some criteria were shaped by the planning, community involvement and stakeholder collaboration activities undertaken to date. Third, NFTA s criteria included other engineering and environmental factors that could be determined by the conceptual engineering undertaken to date. In the Tier 3 screening, the alternatives were defined in greater detail. NFTA examined the following five criteria categories in Tier 3: cost parameters/operations/right-of-way needs; ridership/market served; system connectivity; support for transit-oriented development; and community and environmental impacts. Table 6 lists the criteria for each category, and provides a description of the screening measures for each criterion. Table 6 Tier 3 Screening Criteria Criteria Cost Parameters, Operations, and Right of Way Needs Ridership and Market System Connectivity Support for TOD/ Redevelopment/ Land Use Environmental and Community Impacts Measures Private Land Area Affected by Guideway Capital Cost Operating and Maintenance Cost ($M annual) Comparative Revenue (annual) Percent Mixed Traffic Operations Percent Signalized Intersections of Total Intersections 2035 Project Boardings (Average Weekday) 2035 Total Boardings by Zero Car HH (Average Weekday) UB Ridership Forecast (Average Weekday) Forecasted Park and Ride Patrons, 2035 VMT Change from No Build 2035 Employment Served - 1/2 mile station radius 2035 Population Served - 1/2 mile station radius Commercial Retail Area Served (acres) - 1/2 mile station radius Access to Activity Centers (number served) Number of Park and Recreation Areas Served Minimum Number of Transfers Required Connecting NFTA Bus Routes Travel Time between UB Campuses (UB South - UB North), min Travel Time Savings (between key station pairs v. No Build) Consistency with Local and Regional Plans and Strategies Number of Stations with Transit Supportive Zoning (area within 1/2 mi. station radius; total of high and medium rated stations) Floodplains (acres) Wetlands (acres) Streams (feet) Impacts to Parks, Recreation Areas, Open Space (acres) Number of Affected Properties December 2016 Page 25
31 4. DETAILED TIER 3 RATING & CRITERIA METHODOLOGY This section summarizes the Tier 3 rating and criteria methodology, focusing on the criteria NFTA applied to measure the effectiveness of each Conceptual Alternative in achieving the project purpose, needs and goals and which served as a primary step in the decision-making process to determine the LPA. The criteria are organized by category as shown in the matrix in Table 5; each criterion is described and the resulting data is presented. 4.1 Engineering/Right of Way Needs The engineering and right of way needs criteria are related to the measures used in FTA s New Starts Project Justification Criteria, specifically cost effectiveness. Further project development under NEPA and SEQR will provide NFTA with further opportunities to refine the LPA to avoid, minimize, and mitigate negative effects on private property. Mixed traffic operations can negatively affect the on-time performance and relatability of transit service. Because the LRT and BRT alternatives operate within a designated ROW (for the BRT Alternatives, at least some portion of the alternatives length is in a dedicated ROW) and outside of mixed traffic, they have both higher reliability and shorter travel times than the Preferred and Enhanced Bus alternatives. Additionally, because the BRT alternatives do not operate 100% within a fixed guideway and are sometimes operating in mixed traffic, they have lower reliability and higher travel times than the LRT alternatives that operate 100% within a designated ROW. Similarly, the larger the number of intersections, the greater the adverse impact to transit operations. The alternatives with fewer intersections have shorter travel times and increased reliability. Signalized intersections provide the opportunity to prioritize transit vehicle movement through the corridor Criteria: Estimated Right-of-way Needs Measure: Private land area affected The measure, private land area affected by ROW needs, quantifies the approximate area in acres of privately-owned property the alternative running way would directly impact. The analysis assumed a consistently applied guideway width and ROW need. NFTA s consultant team calculated these land area values using GIS analysis of the location of the proposed guideway and ROW need for each BRT and LRT alternative relative to the location of privately owned land parcels and existing ROW. Publicly owned properties were excluded from the calculations (i.e., municipal and county owned land). The tables below describe the rating scale, acres of private land, and rating for each alternative. Table 7 Private Land Area Scale Category Acres High Medium-High Medium-Low Low 30+ December 2016 Page 26
32 Table 8 Private Land Area Affected Alternative Private Land Area Affected (Acres) Niagara Falls Blvd LRT Medium-High Millersport Hwy LRT High Niagara Falls Blvd BRT Medium-Low Millersport Hwy BRT High Niagara Falls Blvd Preferred Bus 16 Medium-High Millersport Hwy Preferred Bus 2.8 High Enhanced Bus 0 High Criteria: Capital Cost Measure: Capital cost estimates This indicator shows the estimates of the capital costs, excluding ROW acquisition that would be required to construct each alternative. These estimates are expressed in terms of current (2015) dollars, assuming a 3% future annual escalation in costs. The estimates do not include bike paths or sidewalk additions or renovations. New parking lots are assumed to be at-grade with 100 spaces each. The estimates for the BRT alternatives include an allowance of $40 / route foot for existing roadway / curb-related work. Bus maintenance facility cost 1 estimates are based upon an average cost per bus and a set base cost for two bus facilities. Other assumptions include the following: Cooperation between stakeholders will occur State of the art construction technology will be utilized Adequate experienced craft labor will be available Normal productivity rates as historically experienced will be realized Compatible trade agreements exist No strike impacts will be experienced Sufficient experience contractors are available Normal weather will affect the construction schedule The table below shows the rating system (showing that a higher rating corresponds with lower costs), along with the capital cost estimates and rating for each alternative. 1 The estimated cost for additional storage and maintenance needed for larger vehicles required for BRT and additional LRT vehicles is included. However, the impact on storage and maintenance from the larger number of vehicles and larger size of vehicles will require further study and development after the LPA is determined and the project development phase advances (especially for BRT as NFTA does not currently house or maintain this type of vehicle). December 2016 Page 27
33 Table 9 Capital Cost Estimate Scale Category Cost ($ millions) High $ Medium-High $ Medium-Low $ Low $ 1,000+ Table 10 Capital Cost Estimate Alternative Capital Cost ($ millions) Niagara Falls Blvd LRT 1 $ 1,468 Low Millersport Hwy LRT 1 $ 1,412 Low Niagara Falls Blvd BRT 1 $ 430 Medium-High Millersport Hwy BRT 1 $ 238 Medium-High Niagara Falls Blvd Preferred Bus $ 94 High Millersport Hwy Preferred Bus $ 63 High Enhanced Bus $ 18 High Criteria: Operating and Maintenance Cost Measure: Operating and maintenance cost estimates This indicator reflects estimates of the annual operating and maintenance (O&M) costs for each alternative. These costs are based upon constant year 2014 dollars. These estimates were based upon two models based upon the different cost structures of light rail and BRT operations, along with another model to estimate costs for revising existing NFTA bus service to complement the alternatives. Each of these models utilized a 3-variable O&M cost model, which follows a structure that FTA recommends. The three variables are operator cost per vehicle hour, maintenance and operator cost per vehicle mile, and cost per peak vehicle. Once the models were established, operating plans for each alternative were used to estimate the O&M costs. The operating plans included the following characteristics: service frequency, span of service, route distance, run time, fleet requirements, and modifications to existing service. The following tables show the rating system for O&M costs (showing that a higher rating corresponds with lower costs), along with the costs and ratings for each alternative. December 2016 Page 28
34 Table 11 O&M Cost Estimate Scale Category Costs ($ millions) High $ Medium-High $ Medium-Low $ Low $ 15+ Table 12 O&M Cost Estimate Alternative O&M Cost ($ millions) Niagara Falls Blvd LRT 1 $ 15.8 Low Millersport Hwy LRT 1 $ 12.5 Medium-Low Niagara Falls Blvd BRT 1 $ 9.5 Medium-High Millersport Hwy BRT 1 $ 7.3 Medium-High Niagara Falls Blvd Preferred Bus $ 15.2 Low Millersport Hwy Preferred Bus $ 11.4 Medium-Low Enhanced Bus $ 14.2 Medium-Low Criteria: Comparative Revenue Measure: Comparative revenue estimate This indicator assessed the amount of increased annual operating revenue that each alternative would generate in The calculations were based upon the projected total boardings multiplied by the average revenue per passenger. The average revenue was calculated based upon available NFTA ridership and revenue data for FY The current standard fare for Metro Rail or Bus service is $2. (No zonal charges apply, except that Route 64, Lockport Express, does apply a $.50 surcharge.) The average revenue is less than $2, however, because of discounted fares for children, senior citizens, and disabled persons, as well as other patrons who realize discounts by purchasing passes. The total operating revenue is slightly higher than fare revenue due to miscellaneous revenue, particularly advertising. Based upon the available data, the average operating revenue per rail passenger is $1.27 and per bus passenger is $1.41. For purposes of these calculations, it was assumed that this rail passenger rate would apply to ridership on the LRT alternatives and this bus passenger rate would apply to the BRT, preferential bus, and enhanced bus alternatives. The following tables show the rating system (showing that a higher rating corresponds with greater revenue), along with the increased revenue (in millions of dollars) and the rating for each alternative. December 2016 Page 29
35 Table 13 Comparative Revenue Scale Category Revenue ($ millions) High $ 6+ Medium-High $ Medium-Low $ Low $ Table 14 Comparative Revenue Estimate Alternative Annual Boardings (millions) Average Revenue per Passenger Total Operating Revenue ($ millions) Niagara Falls Blvd LRT $1.27 $ 6.2 High Millersport Hwy LRT $1.27 $ 5.6 Medium-High Niagara Falls Blvd BRT $1.41 $ 5.8 Medium-High Millersport Hwy BRT $1.41 $ 5.0 Medium-High Niagara Falls Blvd Preferred Bus 3.7 $1.41 $ 5.2 Medium-High Millersport Hwy Preferred Bus 3.3 $1.41 $ 4.7 Medium-Low Enhanced Bus 0.9 $1.41 $ 1.2 Low Criteria: Percent of Mixed Traffic Operations Measure: Percent Mixed Traffic Operations to Total Corridor Length The extent to which the operations of an alternative are interspersed with vehicular traffic on the roadway system is an important indicator because it reflects the propensity for the transit service to be subject to the same congestion and delay as vehicular traffic. The light rail alternatives will operate on a dedicated fixed transit guideway and thus will have no operations in mixed traffic, while the preferential and enhanced bus alternatives will operate completely in mixed traffic. The BRT alternatives will operate mostly on a dedicated guideway, but a portion of the operations will be in mixed traffic. The following tables show the rating system for mixed traffic operations (showing that a higher rating corresponds with a lower percentage of mixed traffic operations), along with the percentage and rating for each alternative. Table 15 Percent Mixed Traffic Operations Scale Category % High Medium-High Medium-Low Low 75+ December 2016 Page 30
36 Table 16 Percent Mixed Traffic Operations Alternative Percent Mixed Traffic Niagara Falls Blvd LRT 1 0% High Millersport Hwy LRT 1 0% High Niagara Falls Blvd BRT 1 17% High Millersport Hwy BRT 1 35% Medium-High Niagara Falls Blvd Preferred Bus 100% Low Millersport Hwy Preferred Bus 100% Low Enhanced Bus 100% Low Criteria: Percent of Signalized Intersections to Total Intersections Measure: Percent Signalized Intersections to Total Intersections The extent of signalized intersections along an alternative alignment is an important indicator because it reflects the potential to utilize technology (such as signal pre-emption and queue jumps) that will expedite travel on the travel service. The project team identified the total number of intersections and the number and percentage of signalized intersections along each alternative. The following tables show the rating system for signalized intersections (showing that a higher rating corresponds with a higher percentage of signalized intersections), along with the percentage and rating for each alternative. Table 17 Percent Signalized Intersections to Total Intersections Scale Category % High 45+ Medium-High Medium-Low Low Table 18 Percent Signalized Intersections to Total Intersections Alternative Percent Signalized Niagara Falls Blvd LRT 1 44% Medium-High Millersport Hwy LRT 1 28% Medium-Low Niagara Falls Blvd BRT 1 35% Medium-High Millersport Hwy BRT 1 35% Medium-High Niagara Falls Blvd Preferred Bus 35% Medium-High Millersport Hwy Preferred Bus 35% Medium-High Enhanced Bus N/A N/A December 2016 Page 31
37 4.2 Ridership/Markets Served The ridership and markets served measures are related to the measures used in the FTA s New Starts Project Justification Criteria, specifically those related to land use/economic development (2035 population and employment in station areas), forecasted ridership and VMT change. Ridership forecasts for park and ride patrons represent a reduction in the overall automobile travel in the region, despite the minimal effect shown on VMT. In general, transit service can lead to development patterns that are not dependent on single occupancy vehicle usage, which can in turn open opportunities for more sustainable development patterns. Such sustainable development patterns can improve air quality and reduce energy use. Quality transit service is also important in providing mobility options for residents, students, and employees in the region, particularly those who are transportation disadvantaged. Transportation disadvantaged people in the region include individuals and families with low incomes, households without vehicles, college students, and environmental justice populations. Using transit service to serve employment locations and businesses improves access to jobs for area residents and delivers both employees and customers to businesses. Maps of population and employment within station areas are used to highlight concentrations of people and jobs in this section. Projected ridership, as calculated by the STOPS model, version 1.5, provides various indicators for the assessment. Projections for 2035 show total average weekday boardings, boardings by zero-vehicle households, University at Buffalo (UB) boardings, park-and-ride patrons, and the reduction in vehicle miles traveled (VMT) between the alternative and the No Build condition. The following table presents these data for each alternative. Table 19 Projected Ridership Summary Alternative 2035 Total Project Boardings (Average Weekday) 2035 Total Boardings by 0 Car HH (Average Weekday) UB Boardings (Average Weekday) Park and Ride Patrons (Average Weekday) VMT change from No- Build Niagara Falls Blvd LRT 1 22,600 12,400 13, ,900 Millersport Hwy LRT 1 20,900 11,600 12, ,140 Niagara Falls Blvd BRT 1 20,000 11,700 12, ,628 Millersport Hwy BRT 1 17,800 10,900 12, ,969 Niagara Falls Blvd Preferred 18,200 10,900 12, ,498 Bus Millersport Hwy Preferred Bus 16,700 10,200 11, ,416 Enhanced Bus 5,200 4,100 5,000 N/A 1, Criteria: Ridership Measure: Number of Forecasted 2035 Project Boardings The following tables show the rating system (showing that a higher rating corresponds with higher ridership), along with the projected 2035 total boardings and rating for each alternative. December 2016 Page 32
38 Table 20 Projected Daily Boardings Scale Category Boardings High 20,000+ Medium-High 15,000 19,999 Medium-Low 10,000 14,999 Low 0 9,999 Table 21 Projected Daily Boardings Alternative Number of Forecasted 2035 Average Daily Project Boardings Niagara Falls Blvd LRT 1 22,600 High Millersport Hwy LRT 1 20,900 High Niagara Falls Blvd BRT 1 20,000 High Millersport Hwy BRT 1 17,800 Medium-High Niagara Falls Blvd Preferred Bus 18,200 Medium-High Millersport Hwy Preferred Bus 16,700 Medium-High Enhanced Bus 5,200 Low Criteria: Transit Dependent Ridership Measure: Number of Forecasted 2035 Project Boardings from Zero Car Households The following tables show the rating system (showing that a higher rating corresponds with higher ridership), along with the projected 2035 total boardings by 0-car households and rating for each alternative. Table 22 Boardings From Zero Car Households Scale Category Boardings High 12,000+ Medium-High 8,000 11,999 Medium-Low 4,000 7,999 Low 0 3,999 December 2016 Page 33
39 Table 23 Households Forecasted 2035 Average Daily Project Boardings From Zero Car Alternative Number of Forecasted 2035 Average Daily Project Boardings from Zero Car Households Niagara Falls Blvd LRT 1 12,400 High Millersport Hwy LRT 1 11,600 Medium-High Niagara Falls Blvd BRT 1 11,700 Medium-High Millersport Hwy BRT 1 10,900 Medium-High Niagara Falls Blvd Preferred Bus 10,900 Medium-High Millersport Hwy Preferred Bus 10,200 Medium-High Enhanced Bus 4,100 Medium-Low Criteria: UB Ridership Measure: Projected UB Boardings in 2035 The following tables show the rating system (showing that a higher rating corresponds with higher ridership), along with the projected 2035 UB boardings and rating for each alternative. Table 24 Projected UB Boardings Scale Category Boardings High 12,000+ Medium-High 8,000 11,999 Medium-Low 4,000 7,999 Low 0 3,999 Table 25 Projected UB Boardings, 2035 Alternative Number 2035 UB Boardings Niagara Falls Blvd LRT 1 13,300 High Millersport Hwy LRT 1 12,700 High Niagara Falls Blvd BRT 1 12,900 High Millersport Hwy BRT 1 12,600 High Niagara Falls Blvd Preferred Bus 12,100 High Millersport Hwy Preferred Bus 11,700 Medium-High Enhanced Bus 5,000 Medium-Low Criteria: Park and Ride Ridership Measure: Projected Park-and-Ride Boardings in 2035 The following tables show the rating system (showing that a higher rating corresponds with higher ridership), along with the projected 2035 park and ride patrons and rating for each alternative. The enhanced bus alternative will not have any park and ride facilities associated with it. December 2016 Page 34
40 Table 26 Park and Ride Boardings Scale Category Patrons High 600+ Medium-High Medium-Low Low Table 27 Projected Park-and-Ride Boardings, 2035 Alternative Number 2035 Park and Ride Boardings Niagara Falls Blvd LRT Medium-High Millersport Hwy LRT High Niagara Falls Blvd BRT Low Millersport Hwy BRT Low Niagara Falls Blvd Preferred Bus 355 Low Millersport Hwy Preferred Bus 399 Low Enhanced Bus N/A N/A Criteria: VMT Change Measure: VMT Change from No Build The following tables show the rating system (showing that a higher rating corresponds with a greater reduction in vehicle miles traveled (VMT)), along with the projected decrease in VMT and rating for each alternative. The greater the reduction in VMT, the greater the amount of potential congestion relief. Table 28 VMT Change Scale Category VMT Reduction High 18,000+ Medium-High 12,000 17,999 Medium-Low 6,000 11,999 Low 0 5,999 Table 29 VMT Change, 2035 Alternative VMT Change Niagara Falls Blvd LRT 1 21,900 High Millersport Hwy LRT 1 19,140 High Niagara Falls Blvd BRT 1 13,628 Medium-High Millersport Hwy BRT 1 16,969 Medium-High Niagara Falls Blvd Preferred Bus 9,498 Medium-Low Millersport Hwy Preferred Bus 15,416 Medium-High Enhanced Bus 1,488 Low December 2016 Page 35
41 4.2.6 Criteria: Station Area Population and Employment Measure: 2035 Population and Employment This indicator assesses the levels of population and employment located within the station areas for each alternative. The methodology and calculations followed the process that FTA proposes in its Reporting Instructions for the Section 5309 New Starts Criteria and New Starts Spreadsheet Template. Overlay ½-mile radius station areas over Traffic Analysis Zones (TAZs) Merge overlapping station areas Calculate the percentage of the zone area that lies within the station area and apply that percentage to the zonal totals to estimate the demographics only for the station area portion of the zone Add all the zonal sub-totals to calculate the demographics for the station area Add all station area sub-totals to calculate the demographics for the entire alternative The initial step in the process was to prepare GIS mapping of the station locations and calculate a ½-mile radius area around each station. Since most of the station areas are overlapping, this resulted in merged station areas for ease of calculation and display. The project team then used the TAZ-based 2035 demographic projections from GNBRTC as the basis for the calculations. The following is the rating system (showing that a higher rating corresponds with higher population or employment), along with the projected 2035 station-area population and rating for each alternative, followed by the projected 2035 station-area employment and rating for each alternative. Figures show the 2035 projected population and employment density by TAZ for each of the alternatives. Table 30 Station Area Population and Employment Scale Category Number High 40,000+ Medium-High 30,000 39,999 Medium-Low 20,000 29,999 Low 0 19,999 Table 31 Population Served Alternative Population Served (2035) Niagara Falls Blvd LRT 1 27,768 Medium-Low Millersport Hwy LRT 1 22,762 Medium-Low Niagara Falls Blvd BRT 1 35,390 Medium-High Millersport Hwy BRT 1 25,067 Medium-Low Niagara Falls Blvd Preferred Bus 35,390 Medium-High Millersport Hwy Preferred Bus 25,067 Medium-Low Enhanced Bus N/A N/A December 2016 Page 36
42 Table 32 Employment Served Alternative Employment Served (2035) Niagara Falls Blvd LRT 1 31,755 Medium-High Millersport Hwy LRT 1 18,992 Low Niagara Falls Blvd BRT 1 37,377 Medium-High Millersport Hwy BRT 1 23,825 Medium-Low Niagara Falls Blvd Preferred Bus 37,377 Medium-High Millersport Hwy Preferred Bus 23,825 Medium-Low Enhanced Bus N/A N/A December 2016 Page 37


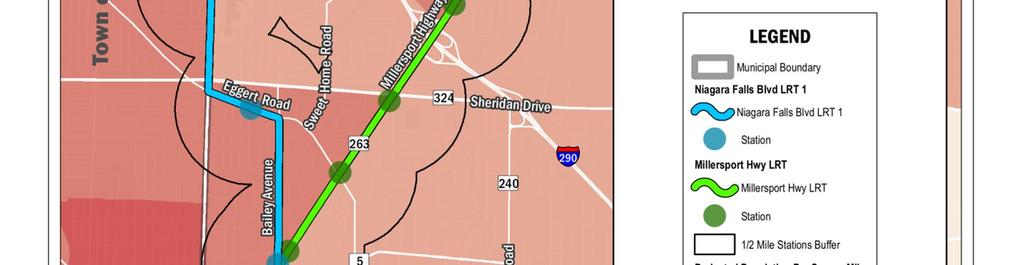
43 Figure Population Density LRT Alternatives December 2016 Page 38

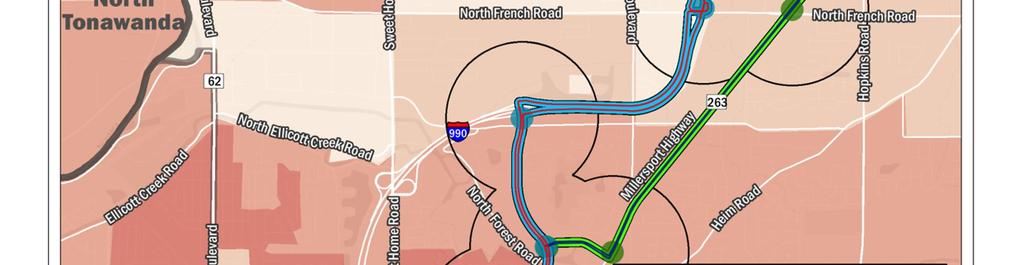
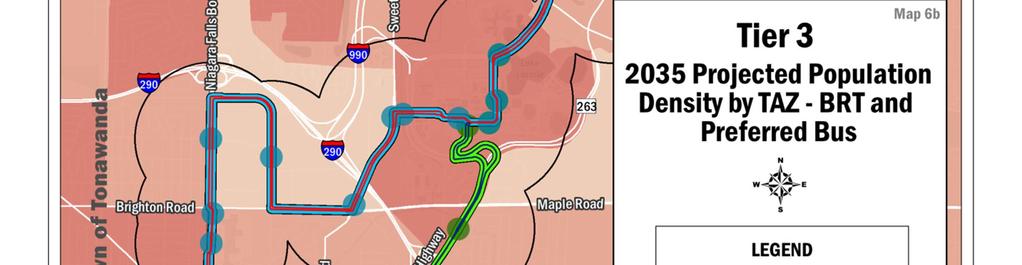

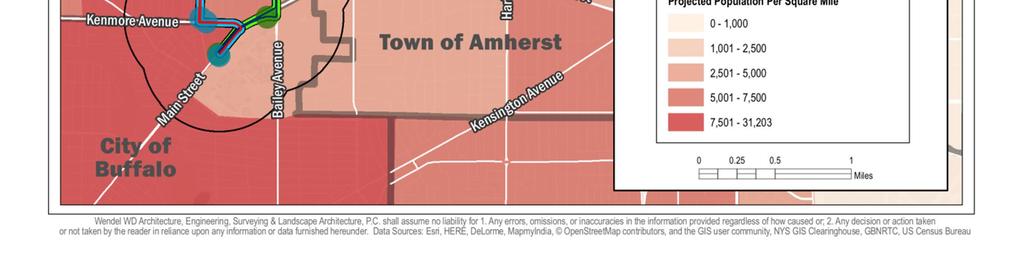
44 Figure Population Density BRT/Preferred Bus Alternatives December 2016 Page 39

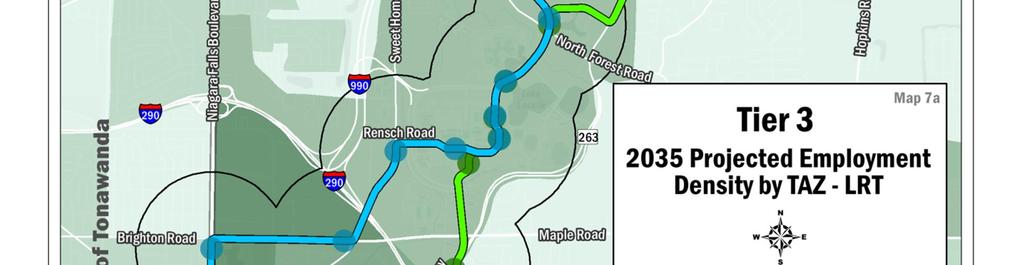
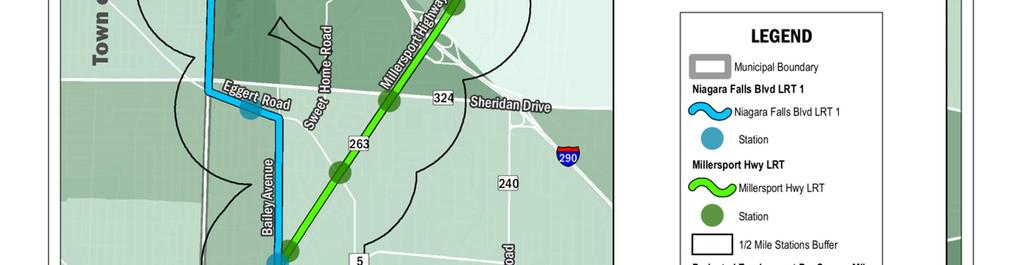
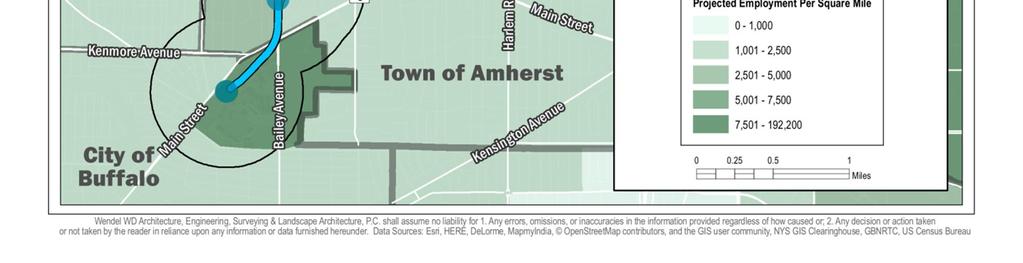
45 Figure Employment Density LRT Alternatives December 2016 Page 40


46 Figure Employment Density BRT/Preferred Bus Alternatives December 2016 Page 41
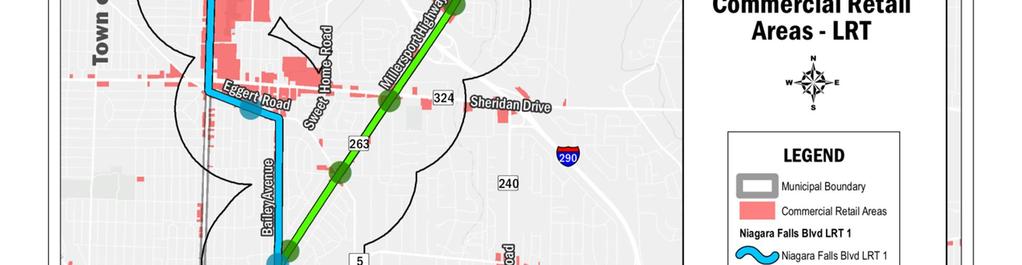
47 4.2.7 Criteria: Commercial Areas Served Measure: Commercial/Retail Area Served This indicator reflects the amount of commercial land use area (in acres) within the ½-mile station areas for each alternative. The calculation methodology used the following steps: Delineate ½-mile station areas based upon proposed alternative alignments. Merge the individual station areas to create a GIS layer of the aggregate station area for each alternative. Overlay the aggregate station area for each alternative on top of the available 2012 land use files for Amherst, Tonawanda, and Buffalo. Determine what land uses are Commercial as defined by the land use files Calculate the total amount of commercial land use area within each aggregate station area for each alternative. The following tables show the rating system (showing that a higher rating corresponds with a greater area), along with the commercial area and rating for each alternative. Figures 15 and 16 show commercial areas served for each alternative. Table 33 Commercial/Retail Areas Served Scale Category Acres High 900+ Medium-High Medium-Low Low Table 34 Commercial/Retail Areas Served Alternative Commercial Areas Served (acres) Niagara Falls Blvd LRT Medium-High Millersport Hwy LRT Medium-Low Niagara Falls Blvd BRT High Millersport Hwy BRT Medium-Low Niagara Falls Blvd Preferred Bus 961 High Millersport Hwy Preferred Bus 432 Medium-Low Enhanced Bus N/A N/A December 2016 Page 42

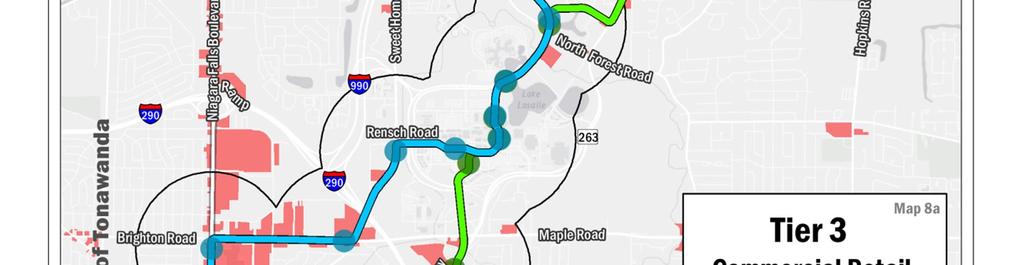
48 Figure 15 Commercial Area LRT Alternatives December 2016 Page 43

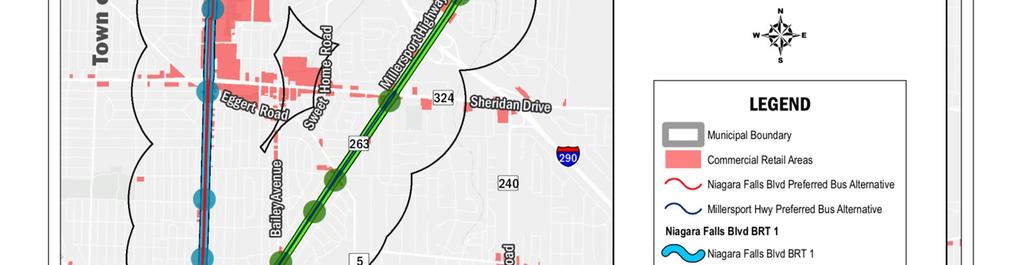

49 Figure 16 Commercial Area BRT/Preferred Bus Alternatives December 2016 Page 44
Waco Rapid Transit Corridor (RTC) Feasibility Study
 Feasibility Study") Waco Rapid Transit Corridor (RTC) Feasibility Study Chris Evilia, Director of Waco Metropolitan Planning Organization Allen Hunter, General Manager Waco Transit System Jimi Mitchell, Project Manager AECOM
Waco Rapid Transit Corridor (RTC) Feasibility Study Chris Evilia, Director of Waco Metropolitan Planning Organization Allen Hunter, General Manager Waco Transit System Jimi Mitchell, Project Manager AECOM
Needs and Community Characteristics
 Needs and Community Characteristics Anticipate Population and Job Growth in the City Strongest density of population and jobs in Ann Arbor are within the Study Area Population expected to grow 8.4% by
Executive Summary. Treasure Valley High Capacity Transit Study Priority Corridor Phase 1 Alternatives Analysis October 13, 2009.
 Treasure Valley High Capacity Transit Study Priority Corridor Phase 1 Alternatives Analysis October 13, 2009 Background As the Treasure Valley continues to grow, high-quality transportation connections
6/6/2018. June 7, Item #1 CITIZENS PARTICIPATION
 June 7, 2018 Item #1 CITIZENS PARTICIPATION 1 Item #2 APPROVAL OF MINUTES Item #3 TRAC GOALS, FRAMEWORK & AGENDA REVIEW 2 COMMITTEE GOALS Learn about Southern Nevada s mobility challenges, new developments
4.0 TIER 2 ALTERNATIVES
 4.0 TIER 2 ALTERNATIVES The Tier 2 Alternatives represent the highest performing Tier 1 Alternatives. The purpose of the Tier 2 Screening was to identify the LPA utilizing a more robust list of evaluation
Draft Results and Open House
 Waco Rapid Transit Corridor (RTC) Feasibility Study Draft Results and Open House Chris Evilia, Director of Waco Metropolitan Planning Organization Allen Hunter, General Manager Waco Transit System Jimi
Public Meeting. City of Chicago Department of Transportation & Department of Housing and Economic Development
 Public Meeting City of Chicago Department of Transportation & Department of Housing and Economic Development Funded by Regional Transportation Authority September 12, 2011 In partnership with Presentation
I-26 Fixed Guideway Alternatives Analysis
 I-26 Fixed Guideway Alternatives Analysis Steering & Technical Advisory Committees Joint Meeting January 15, 2016 @ 10:00 AM SC/TAC Meeting Winter 2016 Agenda I. Welcome & Introductions II. III. Project
Kendall Drive Premium Transit PD&E Study Project Kick-Off Meeting SR 94/Kendall Drive/SW 88 Street Project Development and Environment (PD&E) Study
 Study") Florida Department of Transportation District Six Kendall Drive Premium Transit PD&E Study Project Kick-Off Meeting SR 94/Kendall Drive/SW 88 Street Project Development and Environment (PD&E) Study What
Florida Department of Transportation District Six Kendall Drive Premium Transit PD&E Study Project Kick-Off Meeting SR 94/Kendall Drive/SW 88 Street Project Development and Environment (PD&E) Study What
STRATEGIC PRIORITIES AND POLICY COMMITTEE MAY 5, 2016
 STRATEGIC PRIORITIES AND POLICY COMMITTEE MAY 5, 2016 Shift Rapid Transit Initiative Largest infrastructure project in the city s history. Rapid Transit initiative will transform London s public transit
BROWARD BOULEVARD CORRIDOR TRANSIT STUDY
 BROWARD BOULEVARD CORRIDOR TRANSIT STUDY FM # 42802411201 EXECUTIVE SUMMARY July 2012 GOBROWARD Broward Boulevard Corridor Transit Study FM # 42802411201 Executive Summary Prepared For: Ms. Khalilah Ffrench,
WELCOME. Transit Options Amherst - Buffalo Public Workshops
 WELCOME Transit Options Amherst - Buffalo Public Workshops Sponsored by Niagara Frontier Transportation Authority Greater Buffalo Niagara Regional Transportation Council Where do you live? Where do you
Draft Results and Recommendations
 Waco Rapid Transit Corridor (RTC) Feasibility Study Draft Results and Recommendations Chris Evilia, Director of Waco Metropolitan Planning Organization Allen Hunter, General Manager Waco Transit System
7 COMPARATIVE EVALUATION OF ALTERNATIVES
 7 COMPARATIVE EVALUATION OF ALTERNATIVES 7.1 INTRODUCTION This chapter presents the comparative analysis of the four Level 2 build alternatives along with a discussion of the relative performance of the
CEDAR AVENUE TRANSITWAY Implementation Plan Update
 CEDAR AVENUE TRANSITWAY Implementation Plan Update EECUTIVE SUMMARY DECEMBER 2015 Executive Summary In 2013, the Twin Cities metropolitan area s first bus rapid transit (BRT) line, the METRO Red Line,
Energy Technical Memorandum
 Southeast Extension Project Lincoln Station to RidgeGate Parkway Prepared for: Federal Transit Administration Prepared by: Denver Regional Transportation District May 2014 Table of Contents Page No. Chapter
Northeast Corridor Alternatives Analysis. Public Involvement Round 2 Input on Alternatives for Further Study
 Northeast Corridor Alternatives Analysis Public Involvement Round 2 Input on Alternatives for Further Study Feb. 7-9, 2012 Agenda Review project background Progress summary Recommended alternatives for
Tier 2 Screening and Selection522. of the Short List Alternatives KISSIMMEE CORRIDOR. Downtown CRA. US 192 Alternatives Analysis
 LAKE COUNTY ORANGE COUNTY Ticket and Transportation Center Walt Disney / Reedy Creek Improvement District CR 535 John Young Parkway 441 17 92 Florida s Turnpike VE 92 mee Hall JOHN YOUNG PKY 192 OAK ST
METRO Orange Line BRT American Boulevard Station Options
 METRO Orange Line BRT American Boulevard Station Options Bloomington City Council Work Session November 18, 2013 Christina Morrison BRT/Small Starts Project Office Coordinating Planning and Design AMERICAN
Transit Access to the National Harbor
 Transit Access to the National Harbor December 2014 Table of Contents Executive Summary... 3 Introduction and Project Purpose... 6 Methodology.. 9 Definition of Alternatives..... 9 Similar Project Implementation
Restoration of Historic Streetcar Services in Downtown Los Angeles
 Restoration of Historic Streetcar Services in Downtown Los Angeles Early Scoping Meeting for Alternatives Analysis (AA) May 17, 2011 Introduction Key players Local lead agency: Metro Federal lead agency:
I-26 Fixed Guideway Alternatives Analysis
 I-26 Fixed Guideway Alternatives Analysis Public Meetings: North Charleston, January 25, 2016 Charleston: January 26, 2016 Summerville: January 28, 2016 Agenda I. Project Update II. III. IV. Screen Two
5. OPPORTUNITIES AND NEXT STEPS
 5. OPPORTUNITIES AND NEXT STEPS When the METRO Green Line LRT begins operating in mid-2014, a strong emphasis will be placed on providing frequent connecting bus service with Green Line trains. Bus hours
I-20 EAST TRANSIT INITIATIVE Tier 1 and Tier 2 Alternatives Screening Report EXECUTIVE SUMMARY
 EXECUTIVE SUMMARY The purpose of this report is to document the results of the Tier 1 and Tier 2 Screening of alternatives for the I-20 East Transit Initiative. The two-tier screening process presented
EUGENE-SPRINGFIELD, OREGON EAST WEST PILOT BRT LANE TRANSIT DISTRICT
 EUGENE-SPRINGFIELD, OREGON EAST WEST PILOT BRT LANE TRANSIT DISTRICT (BRIEF) Table of Contents EUGENE-SPRINGFIELD, OREGON (USA)... 1 COUNTY CONTEXT AND SYSTEM DESCRIPTION... 1 SYSTEM OVERVIEW... 1 PLANNING
6/11/2018. June 7, Item #1 CITIZENS PARTICIPATION
 June 7, 2018 Item #1 CITIZENS PARTICIPATION 1 Item #2 APPROVAL OF MINUTES Item #3 TRAC GOALS, FRAMEWORK & AGENDA REVIEW 2 COMMITTEE GOALS Learn about Southern Nevada s mobility challenges, new developments
Restoration of Historic Streetcar Services in Downtown Los Angeles
 Restoration of Historic Streetcar Services in Downtown Los Angeles Alternatives Analysis Community Update Meeting August 2, 2011 Introduction Key players Local lead agency: Metro Federal lead agency: Federal
Alternatives Analysis Findings Report
 6.0 This chapter presents estimates of the potential capital, operations and maintenance costs associated with the alternatives carried forward for detailed evaluation. The methodology used to develop
Pacific Electric Right-of-Way / West Santa Ana Branch Corridor Alternatives Analysis
 Pacific Electric Right-of-Way / West Santa Ana Branch Corridor Alternatives Analysis Transit Coalition September 26, 2012 2 Study Area Pacific Electric Rightof-Way/West Santa Ana Branch (PEROW/ WSAB) extends
Executive Summary. Draft Environmental Impact Statement/Environmental Impact Report ES-1
 Executive Summary Introduction The Eastside Transit Corridor Phase 2 Project is a vital public transit infrastructure investment that would provide a transit connection to the existing Metro Gold Line
Public Meeting. March 21, 2013 Mimosa Elementary School
 Public Meeting March 21, 2013 Mimosa Elementary School Today s Meeting Purpose 2 Where We Are The Process What We ve Heard and Findings Transit Technologies Station Types Break-out Session Where We Are
TORONTO TRANSIT COMMISSION REPORT NO.
 Form Revised: February 2005 TORONTO TRANSIT COMMISSION REPORT NO. MEETING DATE: October 24, 2012 SUBJECT: DOWNTOWN RAPID TRANSIT EXPANSION STUDY (DRTES) PHASE 1 STRATEGIC PLAN ACTION ITEM RECOMMENDATIONS
CITY OF LONDON STRATEGIC MULTI-YEAR BUDGET ADDITIONAL INVESTMENTS BUSINESS CASE # 6
 2016 2019 CITY OF LONDON STRATEGIC MULTI-YEAR BUDGET ADDITIONAL INVESTMENTS BUSINESS CASE # 6 STRATEGIC AREA OF FOCUS: SUB-PRIORITY: STRATEGY: INITIATIVE: INITIATIVE LEAD(S): BUILDING A SUSTAINABLE CITY
Chapter 7: Travel Demand Analysis. Chapter 8. Plan Scenarios. LaSalle Community Center. Image Credit: Town of LaSalle
 Chapter 7: Travel Demand Analysis Chapter 8 Plan Scenarios LaSalle Community Center. Image Credit: Town of LaSalle 164 Chapter 8: Plan Scenarios Moving Ahead for Progress in the 21 st Century Act (MAP
Operating & Maintenance Cost Results Report
 Operating & Maintenance Cost Results Report Prepared for: Hennepin County Regional Railroad Authority Prepared by: Connetics Transportation Group Under Contract To: Kimley-Horn and Associates FINAL June
Bi-County Transitway/ Bethesda Station Access Demand Analysis
 Bi-County Transitway/ Bethesda Station Access Demand Analysis Prepared for: Washington Metropolitan Area Transit Authority Office of Planning and Project Development May 2005 Prepared by: in conjunction
Leadership NC. November 8, 2018
 v Leadership NC November 8, 2018 Planning for our region s growth The Triangle is one of the fastestgrowing regions in the nation. More than 2 million people are already part of the equation, and the
Tier 1 and Tier 2 Alternatives Screening Report
 I - 2 0 E A S T T R A N S I T I N I T I A T I V E Tier 1 and Tier 2 Alternatives Screening Report Prepared for: Metropolitan Atlanta Rapid Transit Authority Prepared by: AECOM/JJG Joint Venture Atlanta,
August 2, 2010 Public Meeting
 Public Meeting LYMMO Expansion Alternatives Analysis Study Purpose of study is to provide a fresh look at potential LYMMO expansion, following Federal Transit Administration (FTA) Alternatives Analysis
Background Information about the Metrobus 29 Lines Study
 Background Information about the Metrobus 29 Lines Study Questions Overview of Existing Service Q. Why is the study being conducted? A. The 29 Lines provide an important connection between Annandale and
Service Quality: Higher Ridership: Very Affordable: Image:
 Over the past decade, much attention has been placed on the development of Bus Rapid Transit (BRT) systems. These systems provide rail-like service, but with buses, and are typically less expensive to
FREQUENTLY ASKED QUESTIONS
 FREQUENTLY ASKED QUESTIONS 2018 What is the More MARTA Atlanta program? The More MARTA Atlanta program is a collaborative partnership between MARTA and the City of Atlanta to develop and implement a program
NEW HAVEN HARTFORD SPRINGFIELD RAIL PROGRAM
 NEW HAVEN HARTFORD SPRINGFIELD RAIL PROGRAM Hartford Rail Alternatives Analysis www.nhhsrail.com What Is This Study About? The Connecticut Department of Transportation (CTDOT) conducted an Alternatives
Point A Point B Point C Point D. Fulton County Board of Commissioners and Mayors Meeting December 14, 2017
 Fulton County Board of Commissioners and Mayors Meeting December 14, 2017 Master Plan Overview Phase 1 Community Vision and Existing Transit Conditions Phase 2 Scenario Development Phase 3 Transit Master
Midtown Corridor Alternatives Analysis. Policy Advisory Committee Meeting February 12, 2014
 Midtown Corridor Alternatives Analysis Policy Advisory Committee Meeting February 12, 2014 Today s Agenda Introductions Outreach efforts and survey results Other updates since last meeting Evaluation results
Proposed Program of Interrelated Projects
 DALLAS AREA RAPID TRANSIT Proposed Program of Interrelated Projects Federal Transit Administration Capital Investment Program Summer 204 INTRODUCTION The current federal transportation bill, Moving Ahead
Troost Corridor Transit Study
 Troost Corridor Transit Study May 23, 2007 Kansas City Area Transportation Authority Agenda Welcome Troost Corridor Planning Study Public participation What is MAX? Survey of Troost Riders Proposed Transit
Attachment 5. High Speed Transit Planning Study REPORT SUMMARY. Prepared by: City of Edmonton Transportation Planning Branch. Stantec Consulting Ltd.
 Attachment 5 High Speed Transit Planning Study Prepared by: City of Edmonton Transportation Planning Branch Stantec Consulting Ltd. Transportation Management & Design, Inc. with Lea Consulting Ltd. [135-35130]
West Broadway Transit Study. Community Advisory Committee September 17, 2015
 West Broadway Transit Study Community Advisory Committee September 17, 2015 Introductions Community Engagement Summer Outreach Fall Outreach Technical Analysis Process Update Alternatives Review Economic
DRAFT Evaluation Scores. Transit
 DRAFT Evaluation s The criteria for evaluating applications for new funding commitments are used to measure how well they advance the six goals identified for the MTP. Through transportation: Reduce per
Click to edit Master title style
 Nelson/Nygaard Consulting Associates SERVICE IMPROVEMENT STRATEGIES September 22, 2015 1 PROJECT OVERVIEW & WORK TO DATE 1. Extensive stakeholder involvement Throughout 2. System and market assessment
Form Revised: February 2005 TORONTO TRANSIT COMMISSION REPORT NO. MEETING DATE: August 30, SUBJECT: Scarborough Rt Strategic Plan
 Form Revised: February 2005 TORONTO TRANSIT COMMISSION REPORT NO. MEETING DATE: August 30, 2006 SUBJECT: Scarborough Rt Strategic Plan RECOMMENDATIONS It is recommended that the Commission: 1. Endorse
D2 - CBD Second Alignment
 D2 - CBD Second Alignment Joint Meeting of DART Board of Directors/City of Dallas Transportation and Trinity River Project Council Committee 28 October 2013 Steve Salin, AICP Vice President, Rail Planning
KANSAS CITY STREETCAR
 KANSAS CITY STREETCAR KAREN CLAWSON MID-AMERICA REGIONAL COUNCIL KANSAS CITY STREETCAR Regional Context Alternatives Analysis Kansas City Streetcar Project KANSAS CITY REGION KANSAS CITY REGION KANSAS
Green Line LRT: Beltline Recommendation Frequently Asked Questions
 Green Line LRT: Beltline Recommendation Frequently Asked Questions June 2017 Quick Facts Administration has evaluated several alignment options that would connect the Green Line in the Beltline to Victoria
Tempe Streetcar. March 2, 2016
 Tempe Streetcar March 2, 2016 Tempe Profile 40 sq. miles, highest density in state University Town, center of region Imposed growth boundaries (density increase) Mixed use growth/intensifying land use
SERVICE DESIGN GUIDELINES
 VTA TRANSIT SUSTAINABILITY POLICY: APPENDIX A SERVICE DESIGN GUIDELINES Adopted February 2007 COMMUNITYBUS LOCALBUS EXPRESSBUS BUSRAPIDTRANSIT LIGHTRAILTRANSIT STATIONAREAS S A N T A C L A R A Valley Transportation
US 29 Bus Rapid Transit Planning Board Briefing. February 16, 2017
 US 29 Bus Rapid Transit Planning Board Briefing February 16, 2017 Project Goals Improve the quality of transit service Improve mobility opportunities and choices Enhance quality of life Support master
Public Meeting. June 15, :30 7:30 p.m.
 Public Meeting June 15, 2017 5:30 7:30 p.m. Welcome 2015 Naval Station Norfolk Transit Extension Study 2015 Naval Station Norfolk Transit Extension Study 2017 Norfolk Westside Transit Study HRT and the
Stakeholders Advisory Working Groups (SAWGs) Traffic and Transit SAWG Meeting #7
 Traffic and Transit SAWG Meeting #7") Presentation Tappan Zee Bridge/I-287 Corridor Environmental Review December 4, 2008 Slide 1 Title Slide Slide 2 This presentation discusses the contents of the Transit Mode Selection Report. Slide 3 The
Presentation Tappan Zee Bridge/I-287 Corridor Environmental Review December 4, 2008 Slide 1 Title Slide Slide 2 This presentation discusses the contents of the Transit Mode Selection Report. Slide 3 The
Green Line LRT: Beltline Segment Update April 19, 2017
 Green Line LRT: Beltline Segment Update April 19, 2017 Quick Facts On April 11, 2017, City Council approved Administration s recommendation for the Green Line to be underground in the Beltline from 2 Street
Travel Forecasting Methodology
 Travel Forecasting Methodology Introduction This technical memorandum documents the travel demand forecasting methodology used for the SH7 BRT Study. This memorandum includes discussion of the following:
US 81 Bypass of Chickasha Environmental Assessment Public Meeting
 US 81 Bypass of Chickasha Environmental Assessment Public Meeting March 14, 2013 Introductions ODOT FHWA SAIC Meeting Purpose Present need for bypass Provide responses to 10/04/11 public meeting comments
STH 60 Northern Reliever Route Feasibility Study Report
 #233087 v3 STH 60 Northern Reliever Route Feasibility Study Report Washington County Public Works Committee Meeting September 28, 2016 1 STH 60 Northern Reliever Route Feasibility Study Hartford Area Development
FINAL. Sound Transit Long-Range Plan Update. Issue Paper S.1: Tacoma Link Integration with Central Link. Prepared for: Sound Transit
 Sound Transit Long-Range Plan Update Issue Paper S.1: Tacoma Link Integration with Central Link Prepared for: Sound Transit Prepared by: Quade & Douglas, Inc. FINAL March 2005 Foreword This issue paper
DRAFT METROCENTER CORRIDOR STUDY
 DRAFT METROCENTER CORRIDOR STUDY TIER 2 EVALUATION OF ALTERNATIVES JUNE 20, 2005 TABLE OF CONTENTS SECTION PAGE 1.0 INTRODUCTION... 1 1.1 Overview... 1 1.2 Project Description... 1 2.0 EVALUATION PROCESS...
Tier 3 Screening and Selection. of the Recommended Alternative KISSIMMEE CORRIDOR. June Downtown CRA. US 192 Alternatives Analysis
 LAKE COUNTY ORANGE COUNTY Ticket and Transportation Center Walt Disney / Reedy Creek Improvement District CR 535 John Young Parkway 441 17 92 Florida s Turnpike VE 92 mee Hall JOHN YOUNG PKY 192 OAK ST
Welcome. Green Line in Your Community
 Welcome Green Line in Your Community Today's session will provide you with information about Administration's recommendation for connecting the Green Line in the Beltline to Victoria Park and Inglewood/Ramsay
IV. ENVIRONMENTAL IMPACT ANALYSIS K.2. PARKING
 IV. ENVIRONMENTAL IMPACT ANALYSIS K.2. PARKING ENVIRONMENTAL SETTING The following analysis summarizes the findings and conclusions of the Traffic Analysis (Traffic Study), prepared by The Mobility Group,
RECOMMENDED ALTERNATIVE REPORT
 DRAFT METROCENTER CORRIDOR STUDY RECOMMENDED ALTERNATIVE REPORT JULY 12, 2005 TABLE OF CONTENTS SECTION PAGE 1.0 INTRODUCTION... 1 2.0 TIER 1 ALTERNATIVES EVALUATION... 1 3.0 TIER 2 ALTERNATIVES EVALUATION...
Parking Management Element
 Parking Management Element The State Transportation Planning Rule, adopted in 1991, requires that the Metropolitan Planning Organization (MPO) area implement, through its member jurisdictions, a parking
3.15 SAFETY AND SECURITY
 3.15 SAFETY AND SECURITY Introduction This section describes the environmental setting and potential effects of the alternatives analyzed in this EIR with regard to safety and security in the SantaClara-Alum
CITY OF ANN ARBOR, MICHIGAN 301 E. Huron St., P.O. Box 8647 Ann Arbor, Michigan
 Date: Wednesday, June 18, 2014 Location: Ann Arbor District Library Attendees: 14 citizen attendees Ann Arbor Station Environmental Review Citizen Working Group Meeting Notes Meeting #3 The third meeting
City of Lake Oswego Transportation System Plan Update PLAN AND POLICY REVIEW, PART 1
 City of Lake Oswego Transportation System Plan Update PLAN AND POLICY REVIEW, PART 1 Date: March 7, 2012 Project #: 11187 To: Cc: From: Project: Subject: Project Management Team Transportation System Plan
A Presentation to: Project Advisory Group Meeting #10
 A Presentation to: Project Advisory Group Meeting #10 October 21, 2015 Agenda Introductions Action Items From Last PAG Meeting (August 26, 2015) Recent Agency Involvement Update on Refined Alternative
Michigan/Grand River Avenue Transportation Study TECHNICAL MEMORANDUM #18 PROJECTED CARBON DIOXIDE (CO 2 ) EMISSIONS
 EMISSIONS") TECHNICAL MEMORANDUM #18 PROJECTED CARBON DIOXIDE (CO 2 ) EMISSIONS Michigan / Grand River Avenue TECHNICAL MEMORANDUM #18 From: URS Consultant Team To: CATA Project Staff and Technical Committee Topic:
TECHNICAL MEMORANDUM #18 PROJECTED CARBON DIOXIDE (CO 2 ) EMISSIONS Michigan / Grand River Avenue TECHNICAL MEMORANDUM #18 From: URS Consultant Team To: CATA Project Staff and Technical Committee Topic:
Harlem Avenue between 63 rd and 65 th
 Harlem Avenue between 63 rd and 65 th Public Meeting #2 March 13, 2018 Summit Park District Welcome to the second Public Meeting for the preliminary engineering and environmental studies of Illinois 43
King County Metro. Columbia Street Transit Priority Improvements Alternative Analysis. Downtown Southend Transit Study. May 2014.
 King County Metro Columbia Street Transit Priority Improvements Alternative Analysis Downtown Southend Transit Study May 2014 Parametrix Table of Contents Introduction... 1 Methodology... 1 Study Area...
Community Advisory Committee. October 5, 2015
 Community Advisory Committee October 5, 2015 1 Today s Topics Hennepin County Community Works Update Project Ridership Estimates Technical Issue #4:Golden Valley Rd and Plymouth Ave Stations Technical
Snelling Bus Rapid Transit. May 13, 2013 Technical Advisory Committee Meeting #1
 Snelling Bus Rapid Transit May 13, 2013 Technical Advisory Committee Meeting #1 1 Today s meeting TAC Introductions Project Overview Arterial BRT Concept Background Snelling Corridor Plan, Funding & Schedule
Regional Transit Extension Studies. Hampton Roads Transportation Planning Organization Passenger Rail Task Force Meeting December 17, 2013
 Regional Transit Extension Studies Hampton Roads Transportation Planning Organization Passenger Rail Task Force Meeting December 17, 2013 Topics Virginia Beach Transit Extension Study (VBTES) Naval Station
Broward County Intermodal Center And People Mover. AASHTO Value Engineering Conference Presentation. September 1, 2009 San Diego, CA
 Project Development & Environment Study Broward County Intermodal Center And People Mover AASHTO Value Engineering Conference Presentation September 1, 2009 San Diego, CA Background P D & E Study Regional
Travel Time Savings Memorandum
 04-05-2018 TABLE OF CONTENTS 1 Background 3 Methodology 3 Inputs and Calculation 3 Assumptions 4 Light Rail Transit (LRT) Travel Times 5 Auto Travel Times 5 Bus Travel Times 6 Findings 7 Generalized Cost
Crenshaw-Prairie Transit Corridor Study Public Meetings
 Crenshaw-Prairie Transit Corridor Study Public Meetings Darby Park: Wednesday, February 20, 2008 6:30 8:00 PM US Bank Community Room: Thursday, February 21, 2008 6:30 8:00 PM Nate Holden Performing Arts
King of Prussia Rail Project Frequently Asked Questions - Archive Version: Summer 2016
 - Archive These frequently asked questions (FAQ) have been developed to help residents, businesses and area stakeholders develop a better understanding of the proposed, the project development process,
Downtown Transit Connector. Making Transit Work for Rhode Island
 Downtown Transit Connector Making Transit Work for Rhode Island 3.17.17 Project Evolution Transit 2020 (Stakeholders identify need for better transit) Providence Core Connector Study (Streetcar project
ANDERSON PROPERTY SITE ANALYSIS
 ANDERSON PROPERTY SITE ANALYSIS Introduction The Montgomery County Department of Transportation (MCDOT) initiated a feasibility study in the fall of 2012 to evaluate the need for transit service expansion
2 EXISTING ROUTE STRUCTURE AND SERVICE LEVELS
 2 EXISTING ROUTE STRUCTURE AND SERVICE LEVELS In the Study Area, as in most of the Metro Transit network, there are two distinct route structures. The base service structure operates all day and the peak
West Broadway Reconstruction/LRT Design. March 19, 2015
 West Broadway Reconstruction/LRT Design March 19, 2015 1 Meeting Agenda 6:05 6:30 PM Brief presentation What we heard Project overview 6:30 8:00 PM Visit Six Topic Areas Road and LRT design elements Pedestrian
To Infill or Not to Infill?
 To Infill or Not to Infill? Mark Fuhrmann Program Director, Rail New Starts Metropolitan Council/Metro Transit MarySue Abel Deputy Project Director, METRO Blue Line Extension Metropolitan Council/Metro
Madison BRT Transit Corridor Study Proposed BRT Operations Plans
 Madison BRT Transit Corridor Study Proposed BRT Operations Plans This paper presents a description of the proposed BRT operations plan for use in the Madison BRT Transit Corridor Study. The objective is
A Transit Plan for the Future. Draft Network Plan
 A Transit Plan for the Future Draft Network Plan Project Overview and Status Completed Market Analysis and Service Evaluation. Developed Plan Framework and Guiding Principles. Developed a draft Five Year
METRONext. Vision & Moving Forward Plans. Board Workshop. December 11, DRAFT For Preliminary Discussion Only
 METRONext Vision & Moving Forward Plans Board Workshop December 11, 2018 Disclaimer This presentation is being provided solely for discussion purposes by the Board of Directors of the Metropolitan Transit
Recommended Vision for the Downtown Rapid Transit Network
 Recommended Vision for the Downtown Rapid Transit Network April 2008 Presentation Overview Context Transit options Assessment of options Recommended network Building the network 2 1 Rapid Our Vision Reliable
Clifton Corridor Transit Initiative. Briefing to Medlock Area Neighborhood Association (MANA) February 15, 2016
 February 15, 2016") Clifton Corridor Transit Initiative Briefing to Medlock Area Neighborhood Association (MANA) February 15, 2016 Neighborhood Concerns and Requests Provide a general overview and background of the project
Clifton Corridor Transit Initiative Briefing to Medlock Area Neighborhood Association (MANA) February 15, 2016 Neighborhood Concerns and Requests Provide a general overview and background of the project
TIER TWO SCREENING REPORT
 TIER TWO SCREENING REPORT November 2012 Parsons Brinckerhoff DRAFT November 2012 1 Parsons Brinckerhoff DRAFT November 2012-2 TABLE OF CONTENTS Table of Contents...3 List of Tables...4 List of Figures...5
Central City Line Locally Preferred Alternative (LPA) Amendment Public Hearing. July 24, 2014
 Amendment Public Hearing. July 24, 2014") Central City Line Locally Preferred Alternative (LPA) Amendment Public Hearing July 24, 2014 Project Description The Central City Line is a High Performance Transit project that will extend from Browne
Central City Line Locally Preferred Alternative (LPA) Amendment Public Hearing July 24, 2014 Project Description The Central City Line is a High Performance Transit project that will extend from Browne
What We Heard Report - Metro Line NW LRT
 What We Heard Report - Metro Line NW LRT by Metro Line NW LRT Project Team LRT Projects City of Edmonton April 11, 2018 Project / Initiative Background Name Date Location Metro Line Northwest Light Rail
METRO Light Rail Update
 American Society of Highway Engineers METRO Light Rail Update Brian Buchanan Director, Design and Construction October 13, 2009 1 High Capacity Transit System 2 20-Mile Light Rail Line 3 Operations Operations
Green Line Long-Term Investments
 Enhancements Short-term improvements to keep Austin moving. Investments Long-term projects to support our future. Mobility Hubs MetroRapid MetroRail MetroExpress Connectors Circulators Project Connect