University of Washington. Stadium Expansion Parking Plan and Transportation Management Program
|
|
|
- Hortense Mason
- 6 years ago
- Views:
Transcription

1 University of Washington Transportation Office University of Washington Stadium Expansion Parking Plan and Transportation Management Program 2006 Report
2 2006 Stadium Parking Plan and Transportation Management Program Report
3 University of Washington Transportation Office Contents EXECUTIVE SUMMARY...1 INTRODUCTION...2 BACKGROUND...3 TMP ELEMENTS...3 CARPOOL INCENTIVES...3 TRANSIT...3 Free Regular Service...3 Free Park & Ride Service...4 Free Husky Special Service...4 BOAT SHUTTLES...6 BOAT MOORAGE...6 CHARTER BOATS AND BUSES...6 BICYCLES...6 RESTRICTED PARKING ZONE...6 MARKETING...6 DATA COLLECTION...7 SURVEY PROCESS...7 IMPLEMENTATION OF PREVIOUS YEAR S SURVEY RECOMMENDATIONS...9 DATA COLLECTION OUTCOMES...9 RESULTS...10 TRAVEL MODE CHOICE...10 AUTO OCCUPANCY AND PARKING...12 BUSES...14 WALKING...15 BOATS...15 BICYCLES...15 OTHER...16 OUT-TRAFFIC MANAGEMENT SYSTEM...16 PRE-EXPANSION COMPARISON...17 NEIGHBORHOOD PARKING...19 IMPACT AREAS...19 CONCLUSIONS...20 i
4 2006 Stadium Parking Plan and Transportation Management Program Report ii
5 University of Washington Transportation Office Executive Summary After nineteen years of operation, the Husky Stadium Expansion Parking Plan and Transportation Management Program (TMP) continued to fulfill its primary goal of "accommodating a sellout crowd of 72,200 with less reliance on parking in the residential areas near campus." The mode split targets set in the TMP have been surpassed. This report outlines the findings of the 2006 TMP monitoring efforts. In 2006, data were collected by conducting a random intercept survey of game attendees as they entered the gates at Husky Stadium on October 14 th surveys were attempted, with 1371 responses, a response rate of 86%. Reported game attendance was 62,656 on the survey date. Results are estimated within a confidence interval of +/- 2.6% at a 95% confidence level. Key findings of this report are presented below: Game attendees traveled to the stadium using these modes: o 47.6% carpooled in 2006, compared to 46.3% in % drove alone, compared 4.3% in The average auto occupancy in 2006 was 2.91 persons per car, remarkably similar to the 2.98 persons per car in o 23% arrived by transit or charter bus, compared to 27.8% in o 18% walked to the game, up from 13.5% in o 4.4% arrived by boat vs. 6.1% in o 1% arrived by bicycle, up from 0.7% in The change in mode split following the implementation of the TMP is greater than anticipated in the 1986 TMP plan. Projected mode shares compare to actual 2006 mode shares as follows: o Projected auto use was 72% vs. actual auto use of 51.8%. o Projected transit and charter bus use was 16% vs. actual transit and charter bus use of 23%. o Projected pedestrian share was 8.1% vs. the actual 18%. o Projected boat use was 3.9% vs. actual boat use of 4.4%. Roughly 2,000 vehicles parked in surrounding neighborhood parking impact areas in 2006, down from 2,900 vehicles in Fewer than 120 parking citations were issued in these areas on average. 1
6 2006 Stadium Parking Plan and Transportation Management Program Report Introduction The University of Washington hosted six football games at Husky Stadium during the 2006 season, listed in Table 1: Table Husky Football Games Date Kickoff Time Opponent Reported Game Attendance 9/2/ :30 PM San Jose State 52,256 9/16/2006 3:30 PM Fresno State 57,012 9/23/2006 4:00 PM UCLA 58,255 10/14/2006 3:30 PM Oregon State 62,656 10/28/2006 4:00 PM Arizona State 58,822 11/11/ :30 PM Stanford 55,896 Season Average 57,483 * Highlighted row indicates day of 2006 survey During the 2006 season, the Husky Stadium Expansion Parking Plan and Transportation Management Program (TMP) was executed to provide transportation options and to discourage guests from driving alone. Alternative modes of transportation were fostered and encouraged, including: carpools transit & charter buses walking boats bicycles The purpose of this document is to monitor the effectiveness of the TMP during the 2006 season. To monitor TMP effectiveness, the University uses several indicators: travel mode choice average auto occupancy parking location choice duration of exiting traffic neighborhood parking impacts This report explains the TMP efforts in It details the methodology used to collect the data related to performance indicators and discusses the results. It illustrates travel mode choice in 2006 and draws comparisons to previous years. Finally, it describes the neighborhood parking impact areas and draws conclusions about the success of the TMP in
7 University of Washington Transportation Office Background In 1987, Husky Stadium was enlarged to accommodate 72,200 spectators. The TMP was first implemented in 1987 to mitigate the additional impacts of traffic on the surrounding community. Due to the nature of football games, large numbers of people travel to and from Husky Stadium over short time periods. The TMP is in place to reduce the number and impact of vehicles in the area before and after football games and to reduce parking impacts on surrounding neighborhoods. The University of Washington is responsible for encouraging football attendees to not drive or to drive together, and the City of Seattle is responsible for traffic management and parking enforcement in residential parking zones. The Seattle City Council Resolution 27435, relative to the TMP, requires the University and City of Seattle to collect data during each football season. The data are used to monitor the performance of the TMP. The 1986 data collection is a baseline for comparing impacts after the stadium expansion in This document summarizes the data collected for the 2006 season and compares them to the past data. TMP Elements Carpool Incentives The TMP uses a pricing system to provide incentives for carpooling. During the 2006 season, parking on campus cost $10.00 for vehicles with three or more persons, $20.00 for vehicles with less than three persons, $30.00 for buses and $40.00 for motor homes and campers. In addition to financial incentives to carpool, the TMP uses marketing information to encourage carpooling. The 2006 Husky Football Transportation Guide highlighted the Event Ridematch feature provided by RideshareOnline. The regional ridematching service designed by King County Metro allows game attendees to find others going to the game with who they might share a ride. Transit Free Regular Service One of the goals of the TMP is to encourage football game attendees to ride public transit to the stadium. All ticket-holders may ride King County Metro buses free to the stadium by showing their game ticket to the driver. Sound Transit Express route 550 is also free to ticket-holders between Bellevue and downtown Seattle, where passengers can transfer to buses headed to the stadium. 3

8 2006 Stadium Parking Plan and Transportation Management Program Report Free Park & Ride Service King County Metro provided special game day bus service in 2006 from eight Park & Ride lots in the region, shown in Figure 1. To use the Park & Ride service, fans park for free at the Park & Ride lots and show their game tickets to ride free on Metro buses to Husky Stadium. Buses begin boarding at the lots two hours before the kickoff, and leave every 20 minutes. Following the games, fans board the buses at special locations, as shown in Figure 2, to return to the designated lots. Figure 2. Park & Ride Post-game Boarding Location On average, Metro provided 175 inbound and 133 outbound Park and Ride bus trips each game. An average of 9,323 passengers rode to Husky Stadium on the Park & Ride Service. The average number of return passengers for the 2006 football season was 9,254. Figure 1. Park & Ride Lot Locations Free Husky Special Service King County Metro operated five special bus routes to Husky Stadium during each game in Service was provided from downtown Seattle, Ballard, and Lake City. Over the course of the 2006 season, Husky Special Service carried 7,452 passengers to Husky Stadium in 192 trips, averaging 39 passengers per trip. Figure 3 illustrates these special routes. 4
9 University of Washington Transportation Office Figure 3. Husky Special Transit Service 5
10 2006 Stadium Parking Plan and Transportation Management Program Report Boat Shuttles In 2006, passengers in boats anchored offshore could flag down a boat shuttle service. The shuttle took the fans to the Husky Stadium boat dock for free. After the game, the shuttle returned the fans to their boats for a cost of $5 per person. Boat Moorage For private vessels, boat moorage was available on a season or single game basis in The price of the permit was dependent on the length of the vessel. Single game permits were available through the Tyee Office by the Thursday before each home game. Charter Boats and Buses Several Seattle restaurants, hotels, and clubs featured activities that included a chartered bus or boat ride to a Husky football game. A list of organizations that sponsored charter buses was provided on the U-PASS website. Bicycles In 2006, the University of Washington Transportation Office continued its program to provide bicycle parking space by placing 12 additional bicycle racks near the stadium entrances during football season. Bicycling was also promoted in the Husky Football Transportation Guide. Restricted Parking Zone In some surrounding neighborhoods, Special Event Restricted Parking Zones (RPZ) limited game day parking to neighborhood residents. Seattle s parking enforcement officers give $44 citations to non-residents who park in the restricted zones. Marketing The Transportation Office produces and distributes a Husky Football Transportation Guide every year. In 2006, more than 16,000 brochures were printed and mailed to season ticket holders and individuals who requested the information. The guide focused on providing information to help game attendees use one of the modes encouraged in the TMP (walking, biking, carpooling, and taking the bus). Contact information was provided, as well as information about parking and post-game traffic routing. Individuals who purchased their tickets on-line received a link to the electronic version of the guide. The information was available on-line at the University s U-PASS web site: 6
11 University of Washington Transportation Office Data Collection Data collection consisted of a survey of game attendees conducted by the UW Transportation Office at one football game in the season, as well as bus ridership data collected by Metro Transit, campus parking and charter bus data collected by the UW Parking Services, and boat passengers and game attendance data collected by the UW Intercollegiate Athletics. Survey Process On October 14th, 2006 the UW Transportation Office conducted a survey of football game attendees as they passed through the gates at Husky Stadium. The weather was typical for the season, cloudy and cool but free of rain. Twenty-six surveyors in teams of two were distributed to the seven stadium gates, proportional to the number of game attendees estimated to enter through each gate. The teams attempted 1592 surveys and obtained 1371 responses, equating to a higher-than-expected response rate of 86%. Surveyors were instructed to ask the following questions, in this order: Q1 Did you drive or ride in a car driven to the game today? If respondent answered yes to Q1: Q1-a How many passengers, including you, came to the game in that vehicle? Q1-b Please point to your approximate parking location on this map. [Respondent was shown a map of the area, with campus, retail areas, and the neighborhoods in the Special Event Parking Zone each identified by a different color background, see Figure 5]. If respondent answered no to Q1: Q2 By which transportation mode did you come to the game today? Regardless of response to Q1: Q3 What is your home zip code? The survey map is shown in Figure 4. 7


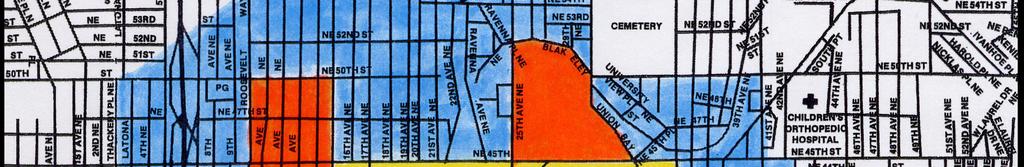
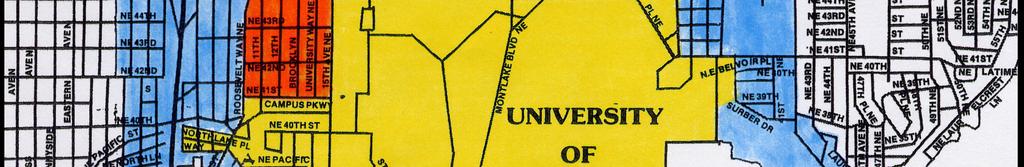
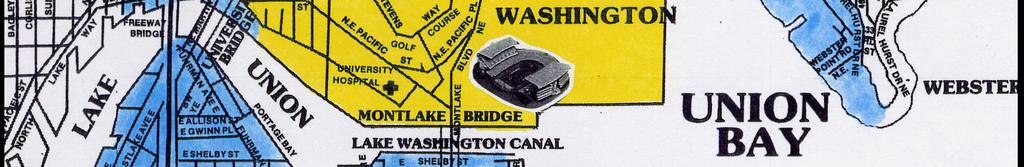
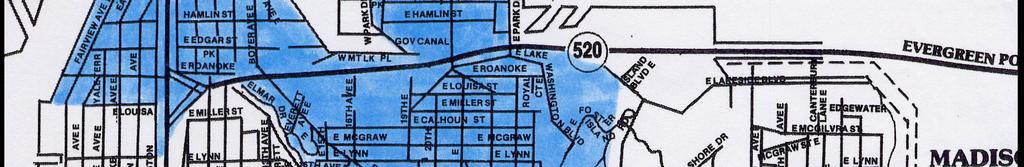
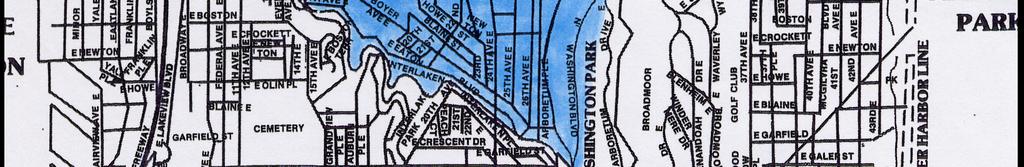
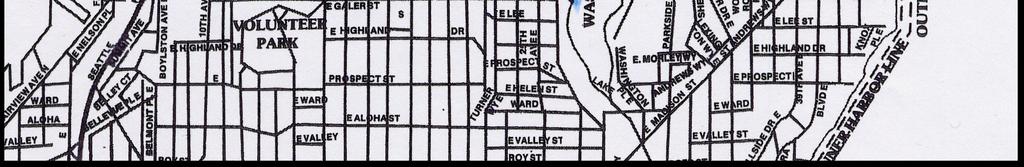
12 2006 Stadium Parking Plan and Transportation Management Program Report Figure 4. Map used to indicate parking location Legend Neighborhood On Campus Retail Area Out of Area 8
13 University of Washington Transportation Office Implementation of Previous Year s Survey Recommendations Several suggestions were made at the conclusion of previous surveys about possible improvements to the survey methodology. Following is a list of some of the suggestions and how they were addressed in Continue to coordinate with City of Seattle regarding RPZs. The Transportation Office discussed data collection needs with Seattle Department of Transportation (SDOT) prior to the 2005 season. SDOT agreed to provide data on the number of tickets issued by parking enforcement officers assigned to the neighborhood impact areas. SDOT also conducted a pre-season check for signage in RPZ areas. This agreement continued in Change wording on Survey. On the survey sheet, change the wording for Q#2 to Including yourself, # people in car? This recommendation was intended to ensure that the surveyor includes the including yourself phrase in the question. The wording on the survey sheet was changed accordingly in 2005 and continued to be used in Do survey earlier in season. If possible, conduct the survey earlier than November. This year, the survey was conducted on October 14 th. Data Collection Outcomes 1592 surveys were attempted, with 1371 responses, a response rate of 86%. With a total population of 62,656 fans (reported paid attendance), the results are within a confidence interval of +/- 2.6% at 95% confidence, which is considered an acceptable confidence level. The population was defined as game attendees who pass through the gates, and the sample was taken from only this population. This population did not include game workers who did not pass through the gates, although these workers account for approximately 800 trips to the game. It is not known which proportion of game workers travel by which mode. Like most surveys, this survey was subject to a non-response error as a result of people who refused to take the survey. Transportation surveys also suffer from social desirability bias. For example, respondents can have a tendency to say that they carpooled when in fact they drove solo in order to portray themselves favorably to the surveyors. While not much can be done to suppress social desirability biases, it is expected that the proportion of this bias remains constant over time and therefore the data still gives accurate information about relative changes in traveler behavior. 9
14 2006 Stadium Parking Plan and Transportation Management Program Report Results Travel Mode Choice Approximately half of all attendees traveled to the game by auto, including 47.6% in a carpool and 4.2% in a single-occupant vehicle (SOV). Taking the bus and walking were the next most popular travel modes. Mode choices are listed in Tables 2, 3 and 4 and illustrated in Figure 5. Table 3 provides a historical comparison of travel mode choice over the three years of the intercept survey. Bus mode share declined by approximately two percent per year until 2006, when it dropped by almost 5%. The carpool mode share in 2006 was 1.3% higher than The SOV mode share increased steadily since 2003, but seems to have leveled off at just over 4%. Table 2. Travel Mode Choice Mode Responses Percentage of Responses Share of Attendance Carpool % 27,362 Bus % 13,221 Walk % 10,347 Boat % 2,506 SOV % 2,414 Bike % 575 Other % 1,035 Total % 57,460 * estimates based on average paid attendance for the 2006 football season as reported by Intercollegiate Athletics (ICA) 10
15 University of Washington Transportation Office Table 3. Travel Mode Choice, Mode Carpool 45.4% 52.1% 46.3% 47.6% Bus 31.7% 29.9% 27.8% 23.0% Walk 13.2% 8.2% 13.5% 18.0% Boat 5.2% 4.0% 6.1% 4.4% SOV 1.8% 3.9% 4.3% 4.2% Bike 1.6% 0.7% 0.7% 1.0% Other 1.0% 1.2% 1.4% 1.8% Total 100.0% 100.0% 100.0% 100.0% * Estimates based on average paid attendance for the football seasons as reported by Intercollegiate Athletics (ICA) SOV 4.2% Travel Mode Choice Boat 4.4% Bike 1.0% Other 1.8% Walk 18.0% Carpool 47.6% Bus 23.0% Figure 5: Mode Choice As in previous years, game attendance is based on reported paid attendance, not actual attendance. If paid attendance exceeds actual attendance, the estimated number of people traveling by each mode would be overestimated. Actual attendance is unknown. 11
16 2006 Stadium Parking Plan and Transportation Management Program Report Auto Occupancy and Parking Most people (92%) who traveled to the game by auto came in a carpool. Only 8% of those who came in an automobile drove alone. Auto occupancy is summarized in Table 4. Table 4. Auto Occupancy Auto Occupancy Percent of Attendees Who Arrived in Autos 1 8.0% % % % % Total 100.0% The average auto occupancy was 2.91 people. Therefore, on an average game, roughly 29,800 people arrived in 10,200 vehicles. These vehicles were parked in one of four areas: campus parking lots retail areas (University Way area and University Village) neighborhoods within the TMP parking impact area areas outside the TMP parking impact area Based on average occupancies by parking area, the number of autos parked in each of the four areas were estimated and listed in Table 5. Table 5. Average Occupancy of Parked Autos Parking Area Total Occupancy* Average Occupancy Autos* A - campus 17, ,894 B - retail 2, C - neighborhood 5, ,013 D - out of area 1, E - didn't know 1, X dropped off 1, Total 29, ,233 * estimates based on average paid attendance for the 2006 football season as reported by ICA In Figure 4 on page 8, TMP neighborhood parking impact areas are illustrated in blue, campus is shown in yellow, retail areas are indicated by orange, and neighborhoods outside of the TMP parking impact areas are white. 12
17 University of Washington Transportation Office Approximately 60.2% of attendees who arrived in autos parked on campus in approximately 5,900 vehicles. While the total number of cars parking on campus is 100 fewer than in 2005, the proportion of campus parking is greater than 2005 s 56.3%. Average occupancy for autos parked on campus remained at approximately three people per vehicle. Game day parking location choices are illustrated in Figure 6 below. Parking Area Choice Out of Area 3.6% Dropped Off 4.0% Didn't Know 5.0% Neighborhood 18.8% Retail 8.4% Cam pus 60.2% Figure 6. Parking Area Choice for Game Attendees Arriving by Auto Surrounding areas were impacted by parking. About 40% of autos parked off campus or in unidentified areas. Over 2,000 autos parked within the neighborhoods identified as parking impact areas, and over 400 autos parked in neighborhoods outside the impact areas. Approximately 950 autos parked in retail areas. 13
18 2006 Stadium Parking Plan and Transportation Management Program Report UW Parking Services Estimate of Vehicles Parked on Campus: Over the 2006 Husky football season the average number of vehicles parked on campus on game days, as counted by Parking Services, was 7,885. This count included autos carrying people not attending the football game. To assess how many of those vehicles might be associated with people who came to campus for non-game related reasons, counts were conducted on the three Saturdays in October, 2006 with no home football game. Counts were conducted in the same lots included in the game day counts. These counts yielded, on average, just under 2,450 vehicles. If 2,450 autos came to campus on game days for nongame related purposes, approximately 5,435 of the 7,885 vehicles counted by Parking Services would have come to campus for the football game. This estimate is lower than the survey s estimate of 5,894 autos parked on campus by game attendees. For comparison, 9,338 autos were counted in The decline is most likely due to decreased attendance. Buses Just under a quarter of respondents (23%) arrived by transit or charter bus. This represents about 13,200 people who arrived by bus on a typical game day. Bus ridership varies for Band Day, when marching bands from area high schools perform during one game each season. The bands travel to the stadium on charter buses. Band Day was held on September 16 th during the Fresno State game. Approximately 2,270 participants arrived in 62 buses. UW Parking Services and Metro Transit Estimates of Bus Ridership: Data on bus ridership to Husky football games are collected in the following ways: Parking lot attendants count charter bus passengers. Metro transit workers count Park & Ride bus passengers as they board the buses. Metro counts regular transit and Husky Special riders when they alight buses at the stadium. However, a significant number of passengers may alight the buses before they reach the stadium and then walk several blocks to the stadium. These passengers are not counted. Passengers going to the game who take routes that stop elsewhere in the University District are also not counted. During the 2006 football season, these counting methods yielded an average of 500 people on charter buses and 11,000 people on transit buses, for an average of 11,500 people who arrived at each game by bus (12,223 arrived by transit bus on October 14th). Using the Metro Transit and Parking Services estimates of bus ridership, and ICA s estimates of total average attendance, approximately 20% of game attendees alighted at Husky Stadium from a Metro Transit or Charter bus on an average game day during the 2006 season. This compares to 23% of survey respondents, or an estimated 13,200 people per game. 14
19 University of Washington Transportation Office Table 6. Average number of Metro Bus Trips and Passengers (Metro Estimates) 2-Sep 16-Sep 23-Sep 14-Oct 28-Oct 11-Nov Average Total Pregame Trips Total Postgame Trips Pregame Passengers 10,676 10,614 11,857 12,223 10,769 10,107 11,041 Postgame Passengers 10,806 10,734 12,428 12,355 10,568 9,787 11,113 * Highlighted column indicates day of 2006 survey Walking Approximately 10,350 (18%) walked to the stadium, up from 13.5% in A reasonable explanation for this increase may be attributed to the overall decline in attendance in The Transportation Office hypothesizes that the number of students who attend games remains constant, and that students are the most likely to walk due to their residences being in close proximity to the stadium. Hence, while the total attendance decreased from previous years, if the total number of students remained the same, there would indeed be an increase in the percentage of fans that walked to the game. Boats It is estimated that 2,530 people (4.4%) arrived by boat, a decline of 1.7% from ICA substantiated the assumption that poor weather in 2006 had an adverse affect on conditions on Lake Washington, which in turn reduced the number of people willing to cross the lake by boat. UW Intercollegiate Athletics Boat Passenger Estimate: ICA counts the number of boats and estimates the number of passengers based on boat size at each Husky football game. Charter boat companies provide ICA with actual passenger counts from the charter boats. ICA uses boat shuttle ticket sales to count the number of passengers in boats anchored off shore. In the 2006 season, these estimation methods yielded an average of approximately 2,324 people in 171 boats. 2,836 people arrived by boat on October 14 th. Using ICA s estimates of the average number of boat passengers and average attendance, approximately 4% of game attendees arrived by boat. This compares to 4.4% of survey respondents, or 2,530 people. Bicycles It is estimated that 575 people (1%) arrived by bicycle. Thanks in part to increased numbers of bike racks at all stadium gates, the proportion of bicyclists actually increased from 2005 s 0.7%. 15
20 2006 Stadium Parking Plan and Transportation Management Program Report Other Approximately 1030 people (1.8%) arrived by other travel modes. These other modes could include motorcycle, taxi, and limousine. Out-Traffic Management System Parking Services collects data on traffic leaving parking areas for each game. The data gives a performance indicator for the traffic management system, which includes Seattle Police operations. Table 7 details the time elapsed in minutes between when vehicles began exiting the E1 and E11/12 parking lots and when the lots were significantly clear of vehicles. While the data is limited, generally the out-traffic durations improved in 2006 compared to This is most likely attributed to the overall decline in game attendance. Table 7. Out Traffic Duration Sept 2 Sept 16 Sept 23 Oct 14 Oct 28 Nov 11 E1 Vehicles Cleared 47 min 45 min 65 min 40 min 40 min 45 min E11/12 Vehicles Cleared N/A N/A 50 min 85 min 50 min 85 min N/A: Not Available. Data were not collected on these dates. 16
21 University of Washington Transportation Office Pre-Expansion Comparison Figures 10, 11, and 12 illustrate Historical comparisons for bus passengers, attendees arriving by automobile, and vehicles parked on campus, respectively. The figures show comparisons between the current year and 1984 (before stadium expansion and to post-expansion projections (from the 1986 Stadium Expansion Plan TMP, based on a sellout crowd of 72,200). Data for 2006 are from the intercept survey conducted at the October 14th game. The comparisons show that the desired modal shifts surpass the expectations of the 1986 Stadium Expansion Parking Plan TMP. Percentage of Attendees Arriving by Bus: A Historical Comparison 35% 30% 25% 23% 20% 15% 10% 5% 10% 16% 0% 1984 Post-Expansion Projection 2006 Figure 10. Historical Comparison: Bus Passengers 17
22 2006 Stadium Parking Plan and Transportation Management Program Report Percentage of Attendees Arriving by Automobile: A Historical Comparison 90% 80% 70% 79% 72% 60% 50% 40% 52% 30% 20% 10% 0% 1984 Post-Expansion Projection 2006 Figure 11. Historical Comparison: Arriving by Automobile Total Number of Vehicles Parked on Campus: A Historical Comparison Post Expansion Projection 2006* Figure 12. Historical Comparison: Vehicles Parked on Campus * In all instances, data represent the total number of vehicles parked on campus (on a game day, vehicles parked by game patrons, as well as UW employees and other visitors to campus). In 2006, counts conducted by Parking Services estimated an average of 7,885 vehicles parked on game days, compared to approximately 2,450 vehicles parked on campus during typical non-game Saturdays. 18
23 University of Washington Transportation Office Neighborhood Parking Impact Areas Figure 4 on page 8 shows the neighborhood parking impact areas (in blue) that are defined in City Council Resolution Portions of these parking impact areas have Special Event RPZs for football game days. On average during the 2006 football season, an estimated 5,600 people parked in the neighborhood parking impact areas in 2,000 autos on each game day, compared to 8,000 people in 2,900 vehicles in Game attendees parked an additional 400 vehicles in neighborhoods outside of the parking impact areas, compared to 700 vehicles in The 1986 Stadium Expansion Parking Plan and Transportation Management Program cites the need for the City of Seattle to increase enforcement and monitoring in neighborhood parking impact areas during Husky games. The Seattle Department of Transportation (SDOT) provided a summary of parking citations issued in neighborhood parking impact areas during the two home games during the 2006 season. On average, 118 citations were issued per game, which is down from an average of 196 citations in While it is not known if the same amount of time was devoted to issuing citations in 2006, it appears as though citations are discouraging parking in the neighborhood impact areas. 19
24 2006 Stadium Parking Plan and Transportation Management Program Report Conclusion clusions The TMP continues to successfully encourage fans to travel to games by alternative modes. Almost one quarter of all game attendees arrived at the stadium in transit and charter buses. Almost one fifth of fans walked to the stadium. Also, carpool parking price incentives appear to be successful, resulting in higher average auto occupancy in campus parking lots compared to other parking areas. It is estimated that approximately 2,000 autos parked in residential neighborhoods identified as parking impact areas. 20
University of Washington. Stadium Expansion Parking Plan and Transportation Management Program Report
 University of Washington Stadium Expansion Parking Plan and Transportation Management Program 2010 Report Table of Contents EXECUTIVE SUMMARY... 3 BACKGROUND... 4 INTRODUCTION... 5 TMP ELEMENTS... 6 Carpool
Stadium Expansion Parking Plan and Transportation Management Report
 University of Washington Stadium Expansion Parking Plan and Transportation Management 0 TABLE OF CONTENTS EXECUTIVE SUMMARY... 3 BACKGROUND... 4 INTRODUCTION... 5 TRANSPORTATION MANAGEMENT PLAN ELEMENTS...
Stadium Expansion Parking Plan and Transportation Management Program
 University of Washington Stadium Expansion Parking Plan and Transportation Management Program 2001 Data Collection Summary Contents Background... Introduction... Executive Summary... TMP Elements... Transit
University of Washington. Stadium Expansion Parking Plan and Transportation Management Program Report
 University of Washington Stadium Expansion Parking Plan and Transportation Management Program 2014 Report TABLE OF CONTENTS EXECUTIVE SUMMARY... 4 BACKGROUND... 5 INTRODUCTION... 6 TMP ELEMENTS... 7 Carpool
Husky Stadium: TMP Modernization Project
 Husky Stadium: TMP Modernization Project 1 Husky Stadium: TMP History 2 Husky Stadium TMP History 1986-1987 Husky Stadium adds the north upper deck. City of Seattle and UW agree on a plan (TMP) to mitigate
Denver Car Share Program 2017 Program Summary
 Denver Car Share Program 2017 Program Summary Prepared for: Prepared by: Project Manager: Malinda Reese, PE Apex Design Reference No. P170271, Task Order #3 January 2018 Table of Contents 1. Introduction...
Parking Management Element
 Parking Management Element The State Transportation Planning Rule, adopted in 1991, requires that the Metropolitan Planning Organization (MPO) area implement, through its member jurisdictions, a parking
Trip Generation and Parking Study New Californian Apartments, Berkeley
 Trip Generation and Parking Study New Californian Apartments, Berkeley Institute of Transportation Engineers University of California, Berkeley Student Chapter Spring 2012 Background The ITE Student Chapter
Long Bridge Park. Parking Analysis and Transportation Management Plan. Long Range Planning Committee of the Planning Commission Meeting
 Long Bridge Park Parking Analysis and Transportation Management Plan Long Range Planning Committee of the Planning Commission Meeting Thursday, February 7, 2013 Purpose Achieve consensus on parking and
Food Truck Consulting Study of Proposed Food Truck Regulations
 Food Truck Consulting Study of Proposed Food Truck Regulations Introduction The City of San Diego is considering revisions to its mobile vending ordinance. The revised ordinance would, in part, 1) prevent
appendix 4: Parking Management Study, Phase II
 appendix 4: Parking Management Study, Phase II A4-1 A4-2 Eastlake Parking Management Study Final Phase 2 Report Future Parking Demand & Supply January 6, 2017 Submitted by Denver Corp Center III 7900 E.
CORE AREA SPECIFIC PLAN
 only four (A, B, D, and F) extend past Eighth Street to the north, and only Richards Boulevard leaves the Core Area to the south. This street pattern, compounded by the fact that Richards Boulevard is
Tulane University Stadium. Community Forum Parking and Traffic Presentation June 18, 2012
 1 Tulane University Stadium Community Forum Parking and Traffic Presentation June 18, 2012 Tulane University Football Stadium Parking & Traffic 2 Parking & Traffic Presentation AGENDA - Timeline - Comparable
Organization. SDOT Date and Commute Seattle. Dave Sowers, Deputy Program Administrator
 Organization SDOT Date and Commute Seattle Dave Sowers, Deputy Program Administrator October 22, 2018 TODAY S FOCUS The big picture #Realign99 closure/opening the tunnel Removal, decommissioning, surface
Husky Stadium Expansion Parking Plan and Transportation Management Program
 TRANSPORTATION RESEARCH RECORD 1232 49 Husky Stadium Expansion Parking Plan and Transportation Management Program MICHAELE. WILLIAMS In 1984 the University of Washington sought approval of the city of
Appendix C. Parking Strategies
 Appendix C. Parking Strategies Bremerton Parking Study Introduction & Project Scope Community concerns regarding parking impacts in Downtown Bremerton and the surrounding residential areas have existed
Ingraham High School Parking and Traffic Analysis
 Parking and Traffic Analysis Seattle, WA Prepared for: URS Corporation 1501 4th Avenue, Suite 1400 Seattle, WA 98101-1616 Mirai Transportation Planning & Engineering 11410 NE 122nd Way, Suite 320 Kirkland,
Downtown Lee s Summit Parking Study
 Downtown Lee s Summit Parking Study As part of the Downtown Lee s Summit Master Plan, a downtown parking and traffic study was completed by TranSystems Corporation in November 2003. The parking analysis
FINAL REPORT FORM 1 (Formerly titled Project Monitoring Form 1 - Ridesharing ) Total Project Cost: $
 Total Project Cost: $") FINAL REPORT FORM 1 (Formerly titled Project Monitoring Form 1 - Ridesharing ) For Ridesharing; Shuttle/Vanpool; Carpool/Transit Information; Rail-Bus Integration; and Smart Growth Projects TFCA Project
FINAL REPORT FORM 1 (Formerly titled Project Monitoring Form 1 - Ridesharing ) For Ridesharing; Shuttle/Vanpool; Carpool/Transit Information; Rail-Bus Integration; and Smart Growth Projects TFCA Project
Plattsburgh Downtown Parking Study
 Plattsburgh Downtown Parking Study Study Update October 2017 Powered by Purpose of Study Engage Community in Parking Discussion Assess Current Conditions Parking Demand Patron Service Levels Administration
Office of Transportation Bureau of Traffic Management Downtown Parking Meter District Rate Report
 Office of Transportation Bureau of Traffic Management 1997 Downtown Parking Meter District Rate Report Introduction The City operates approximately 5,600 parking meters in the core area of downtown. 1
2015 LRT STATION ACTIVITY & PASSENGER FLOW SUMMARY REPORT
 LRT STATION ACTIVITY & PASSENGER FLOW SUMMARY REPORT CAPITAL and METRO LINES Project Team: ETS Transit Data Management Transportation Planning Strategic Monitoring and Analysis April, 2016 LRT STATION
Trip Generation Study: Provo Assisted Living Facility Land Use Code: 254
 Trip Generation Study: Provo Assisted Living Facility Land Use Code: 254 Introduction The Brigham Young University Institute of Transportation Engineers (BYU ITE) student chapter completed a trip generation
M E M O R A N D U M INTRODUCTION. POTENTIAL TDM STRATEGIES Marketing & Management. Residents & Employees. Exhibit 6
 Exhibit 6 M E M O R A N D U M To: From: Joe Ernst and Bryan Graves Nelson\Nygaard Date: February 6, 2015 Subject: Preliminary TDM Strategies INTRODUCTION The memorandum provides an overview of potential
CO 2 Emissions: A Campus Comparison
 Journal of Service Learning in Conservation Biology 3:4-8 Rachel Peacher CO 2 Emissions: A Campus Comparison Abstract Global warming, little cash inflow, and over-crowded parking lots are three problems
East Link Extension. September 16, Bel-Red Conclusion to Final Design Open House Public Involvement Summary
 East Link Extension September 16, 2014 Bel-Red Conclusion to Final Design Open House Public Involvement Summary Table of contents 1 Background 2 Overview 2 Notification 3 Open House Overview 4 Comment
Car Sharing at a. with great results.
 Car Sharing at a Denver tweaks its parking system with great results. By Robert Ferrin L aunched earlier this year, Denver s car sharing program is a fee-based service that provides a shared vehicle fleet
Energy Technical Memorandum
 Southeast Extension Project Lincoln Station to RidgeGate Parkway Prepared for: Federal Transit Administration Prepared by: Denver Regional Transportation District May 2014 Table of Contents Page No. Chapter
Streamlining the District s Nightlife Curbside Access. Managing High-Demand Curbside Passenger Loading Zones
 Streamlining the District s Nightlife Curbside Access Managing High-Demand Curbside Passenger Loading Zones Washington, DC Regional Setting 68.3 square miles DC metropolitan area Population 6.1 million
June 9, /29/2011
 June 9, 2011 9/29/2011 New Rate Policy Set by City Council SDOT shall establish on-street parking rates based on measured occupancy so that approximately 1or 2 open spaces are available on each blockface
Kauai Resident Travel Survey: Summary of Results
 Kauai Resident Travel Survey: Summary of Results Kauai Multimodal Land Transportation Plan Charlier Associates, Inc. November 23, 2011 1 Table of Contents Executive Summary... 2 Survey Goals and Methodology...
6/6/2018. June 7, Item #1 CITIZENS PARTICIPATION
 June 7, 2018 Item #1 CITIZENS PARTICIPATION 1 Item #2 APPROVAL OF MINUTES Item #3 TRAC GOALS, FRAMEWORK & AGENDA REVIEW 2 COMMITTEE GOALS Learn about Southern Nevada s mobility challenges, new developments
2015 LRT PASSENGER COUNT. CAPITAL and METRO LINES
 2015 LRT PASSENGER COUNT CAPITAL and METRO LINES Project Team: ETS Transit Data Management Transportation Planning Strategic Monitoring and Analysis April, 2016 2015 LRT PASSENGER COUNT Edmonton Transit
Trip and Parking Generation Study of the Peaks Ice Arena
 Trip and Parking Generation Study of the Peaks Ice Arena Introduction The Brigham Young University Institute of Transportation Engineers student chapter (BYU ITE) completed a trip and parking generation
Trip Generation and Parking Utilization Data Collection at Mini-Mart with Gas Station
 Trip Generation and Parking Utilization Data Collection at Mini-Mart with Gas Station Final Report 2013 ITE District 6 - Data Collection Project Institute of Transportation Engineers Student Chapter at
San Rafael Civic Center Station Area Plan May 2012 DRAFT FOR PUBLIC REVIEW
 CHAPTER 4. PARKING Parking has been identified as a key concern among neighbors and employers in the area, both in terms of increased demand from potential new development and from SMART passengers that
CITY OF ANN ARBOR, MICHIGAN 301 E. Huron St., P.O. Box 8647 Ann Arbor, Michigan
 Date: Wednesday, June 18, 2014 Location: Ann Arbor District Library Attendees: 14 citizen attendees Ann Arbor Station Environmental Review Citizen Working Group Meeting Notes Meeting #3 The third meeting
UC Santa Cruz TAPS 3-Year Fee & Fare Proposal, through
 UC Santa Cruz TAPS 3-Year Fee & Fare Proposal, 2016-17 through 2018-19 Introduction Transportation and Parking Services (TAPS) proposes a three-year series of annual increases to most Parking fees and
David Martin, Director of Planning and Community Development. Establishment of LAX FlyAway Stop in Santa Monica
 Information Item Date: January 31, 2014 To: From: Subject: Mayor and City Council David Martin, Director of Planning and Community Development Establishment of LAX FlyAway Stop in Santa Monica Introduction
2018 Long Range Development Plan Update Community Advisory Group- February 21, 2018
 Transportation @ UC San Diego 2018 Long Range Development Plan Update Community Advisory Group- February 21, 2018 Agenda UC San Diego Transportation Services Organizational Overview Current State Parking,
This letter summarizes our observations, anticipated traffic changes, and conclusions.
 Mr. David Jorschumb Project Manager Boulder Valley School District Re: Review of proposed school access improvements at the Foothills Elementary School in Boulder Dear Mr. Jorschumb, At your request, the
CTR Employer Survey Report
 CTR Employer Survey Report Employer Id : E11056 City of Lacey Employer : Worksite : City of Lacey Street : 420 College St Se Jurisdiction : City of Lacey Thank you for completing your Commute Trip Reduction
San Francisco State University Transportation Survey Results Final Report
 San Francisco State University 2018 Transportation Survey Results Final Report July 2018 2018 Transportation Survey Results Final San Francisco State University Nelson\Nygaard Consulting Associates Inc.
TR15: Public Outreach
 TR15: Public Outreach Brief Summary: The Public Outreach control measure includes activities to encourage Bay Area residents to make choices that benefit air quality. This measure includes various public
Address Land Use Approximate GSF
 M E M O R A N D U M To: Kara Brewton, From: Nelson\Nygaard Date: March 26, 2014 Subject: Brookline Place Shared Parking Analysis- Final Memo This memorandum presents a comparative analysis of expected
Traffic Impact Analysis West Street Garden Plots Improvements and DuPage River Park Garden Plots Development Naperville, Illinois
 Traffic Impact Analysis West Street Garden Plots Improvements and DuPage River Park Garden Plots Development Naperville, Illinois Submitted by April 9, 2009 Introduction Kenig, Lindgren, O Hara, Aboona,
U N I V E R S I T Y O F B R I T I S H C O L U M B I A. Fall 2008 Transportation Status Report
 U N I V E R S I T Y O F B R I T I S H C O L U M B I A Fall 2008 Transportation Status Report 6 February 2009 U N I V E R S I T Y O F B R I T I S H C O L U M B I A Fall 2008 Transportation Status Report
Memorandum. To: The Arlington County Board Date: June 29, 2018 From: Subject:
 OFFICE OF THE COUNTY MANAGER 2100 Clarendon Boulevard, Suite 302, Arlington, VA 22201 TEL 703.228.3120 FAX 703.228.3218 TTY 703.228.4611 www.arlingtonva.us Memorandum To: The Arlington County Board Date:
Revised Strategy for Downtown Parking
 Revised Strategy for Downtown Parking December 4, 2017 Council Workshop Presented by Jennifer McCoy, P.E., City Traffic Engineer City-Owned Parking Today 3,500 metered parking spaces Parking meters charge
King County Metro. Columbia Street Transit Priority Improvements Alternative Analysis. Downtown Southend Transit Study. May 2014.
 King County Metro Columbia Street Transit Priority Improvements Alternative Analysis Downtown Southend Transit Study May 2014 Parametrix Table of Contents Introduction... 1 Methodology... 1 Study Area...
CHAPTER 9. PARKING SUPPLY
 CHAPTER 9. PARKING SUPPLY The goal of this chapter is to provide City and University decision-makers with information about Study Area parking that can be used to determine the amount of parking that should
Transportation Demand Management Element
 Transportation Demand Management Element Over the years, our reliance on the private automobile as our primary mode of transportation has grown substantially. Our dependence on the automobile is evidenced
TORONTO TRANSIT COMMISSION REPORT NO.
 Revised: March/13 TORONTO TRANSIT COMMISSION REPORT NO. MEETING DATE: March 26, 2014 SUBJECT: COMMUNITY BUS SERVICES ACTION ITEM RECOMMENDATION It is recommended that the Board not approve any routing
The TDM Plan for Fort Washington Office Park NOVEMBER 1 6, 2017 FORT WASHINGTON OFFICE PARK STAKEHOLDERS
 The TDM Plan for Fort Washington Office Park NOVEMBER 1 6, 2017 FORT WASHINGTON OFFICE PARK STAKEHOLDERS What is Transportation Demand Management (TDM)? Sources: Philly.com, Montgomery County, GVF Location
Parking and Transportation Services
 Parking and Transportation Services Annual Report: Fiscal Year 2008-2009 Director's Message A Message from Don Thornton Dear University of Kentucky Parking Customer, The 2008-09 fiscal year was one full
CTR Employer Survey Report
 CTR Employer Survey Report Employer Id : E12740 WA State Dept. of Agriculture Employer : Worksite : Cleveland Lab Street : 3939 Cleveland Ave Se Jurisdiction : City of Olympia Thank you for completing
Emergency Ride Home Program Survey
 Emergency Ride Home Program Survey Philip L. Winters Director, TDM Program Center for Urban Transportation Research University of South Florida August 24, 2017 Emergency Ride Home 173 Total Responses Date
Los Angeles County Metropolitan Transportation Authority. Paid Parking Pilot Program Parking Management
 Los Angeles County Metropolitan Transportation Authority Paid Parking Pilot Program Parking Management Overview Metro currently operates over 22,000 parking spaces at 48 stations. This number will increase
Trip and Parking Generation Data Collection at Grocery Store with Gas Station and Auto Repair
 Trip and Parking Generation Data Collection at Grocery Store with Gas Station and Auto Repair Final Report 2011 ITE District 6 - Data Collection Project Institute of Transportation Engineers Student Chapter
Parking & Transportation Services Virtual Parking Permits at Stanford Stanford Staffers Brown Bag Forum Kingscote Gardens, Room 140 November 8, 2018
 Parking & Transportation Services Virtual Parking Permits at Stanford Stanford Staffers Brown Bag Forum Kingscote Gardens, Room 140 November 8, 2018 What drives P&TS? Reducing peak trips is a University
Sound Transit Operations July 2016 Service Performance Report. Ridership
 Ridership Total Boardings by Mode Mode Jul-15 Jul-16 % YTD-15 YTD-16 % ST Express 1,618,779 1,545,852-4.5% 10,803,486 10,774,063-0.3% Sounder 333,000 323,233-2.9% 2,176,914 2,423,058 11.3% Tacoma Link
Travel Time Savings Memorandum
 04-05-2018 TABLE OF CONTENTS 1 Background 3 Methodology 3 Inputs and Calculation 3 Assumptions 4 Light Rail Transit (LRT) Travel Times 5 Auto Travel Times 5 Bus Travel Times 6 Findings 7 Generalized Cost
Strategies to keep people and goods moving in and through Seattle
 Strategies to keep people and goods moving in and through Seattle SR 99 Closure and the Seattle Squeeze 2018-2024 DON Information Session Department of Transportation Delridge Community Center November
ROCHESTER, MINNESOTA
 ROCHESTER, MINNESOTA Rochester Public Works TRANSIT AND PARKING DIVISION Transit and Parking Manager Tony Knauer tknauer@rochestermn.gov SERVICE ATTITUDE CONSISTENCY - TEAMWORK ROCHESTER TRANSIT & PARKING
Trip Generation & Parking Occupancy Data Collection: Grocery Stores Student Chapter of Institute of Transportation Engineers at UCLA Spring 2014
 Trip Generation & Parking Occupancy Data Collection: Grocery Stores Student Chapter of Institute of Transportation Engineers at UCLA Spring 2014 Page 1 Introduction The UCLA Institute of Transportation
Transportation: On the Road to Cleaner Air Did you know?
 Opposite and above State transportation officials are urging commuters to use mass transit, carpool, ride a bike, or to telecommute, in a campaign to help communities get cleaner air. Cities are also turning
APPENDIX B Traffic Analysis
 APPENDIX B Traffic Analysis Rim of the World Unified School District Reconfiguration Prepared for: Rim of the World School District 27315 North Bay Road, Blue Jay, CA 92317 Prepared by: 400 Oceangate,
TRANSPORTATION DEMAND MANAGEMENT
 TRANSPORTATION DEMAND MANAGEMENT Deborah Stacey Senior Transportation Planner CDTC dstacey@cdtcmpo.org Unique Process CDTC Programs $525,000 per Year (CMAQ) in the TIP for TDM CDTA, the Region s Transit
City of Minnetonka Maximum Parking Regulations Urban GIS. Group Members Brad Johnston Mark Kelley Jonathan Winge
 City of Minnetonka Maximum Parking Regulations Urban GIS Group Members Brad Johnston Mark Kelley Jonathan Winge This project was supported by the Resilient Communities Project (RCP), a program at the University
PARKING OCCUPANCY IN WINDSOR CENTER
 PARKING OCCUPANCY IN WINDSOR CENTER TOWN OF WINDSOR, CONNECTICUT REPORT JUNE 2017 CONTENTS Background... 3 Other Relevant Data... 3 Parking Survey Design... 6 Parking Supply Inventory... 6 Parking Demand
TRAVEL DEMAND FORECASTS
 Jiangxi Ji an Sustainable Urban Transport Project (RRP PRC 45022) TRAVEL DEMAND FORECASTS A. Introduction 1. The purpose of the travel demand forecasts is to assess the impact of the project components
Vehicle Speeds in School Zones
 Vehicle Speeds in School Zones THE POSTED SPEED LIMIT IN SCHOOL ZONES IS 20 MPH, AND VARIOUS TYPES OF SIGNS THAT INFORM DRIVERS OF THE SCHOOL-ZONE SPEED LIMIT ARE IN USE. THE STUDY DISCUSSED IN THIS FEATURE
CITY OF VANCOUVER ADMINISTRATIVE REPORT
 Supports Item No. 1 T&T Committee Agenda May 13, 2008 CITY OF VANCOUVER ADMINISTRATIVE REPORT Report Date: April 29, 2008 Author: Don Klimchuk Phone No.: 604.873.7345 RTS No.: 07283 VanRIMS No.: 13-1400-10
Best Route. Best Care. The Milwaukee Regional Medical Center s Alternative Transportation Program
 Best Route to the Best Care Programs include: CARPOOL Make a friend; save the earth! PARK & RIDE SHUTTLE SERVICE Avoid the construction and the long walk from the parking lot. WASHINGTON COUNTY COMMUTER
Parking and Curb Space Management Element
 Parking and Curb Space Management Element An Element of the Arlington Master Transportation Plan (MTP) Civic Federation Meeting November 10th, 2009 Background 2 MTP Goals and Policies Document adopted
2.1 Outline of Person Trip Survey
 Trip Characteristics 2.1 Outline of Person Trip Survey 2.1.1 Outline of the Survey The Person Trip survey was carried out from 2006 to 2007 as a part of the Istanbul Transportation Master Plan undertaken
Leander ISD General Stadium Information
 Leander ISD Athletic Administration 202 W. South, Street Leander, TX 78641 (512) 570-0170 Leander ISD General Stadium Information A.C. Bible Jr. Stadium: 3301 S Bagdad Rd, Leander, TX 78641 John Gupton
The South Waterfront District and the Portland Aerial Tram
 The South Waterfront District and the Portland Aerial Tram How infrastructure investment can catalyze redevelopment and remove barriers to healthy lifestyles Role of transportation infrastructure in creating
Transportation Demand Management Program
 TRANSPORTATION DEMAND MANAGEMENT PROGRAM Transportation Demand Management Program Greenside Office Hyannis, Massachusetts PREPARED FOR Keller Company, Inc. 1436 Iyannough Road Hyannis, Massachusetts 02601
Mercer Island Center for the Arts Parking Management Plan
 Parking Stalls Mercer Island Center for the Arts Parking Management Plan June 15, 2016 This Parking Management Plan (P) covers all tenants at the Mercer Island Center for the Arts (MICA) campus, including
L. A. Metro s Parking Management Program Principles Applied. October 17, 2011 Rail-Volution, Washington D.C.
 Los Angeles County Metropolitan Transportation Authority L. A. Metro s Parking Management Program Principles Applied October 17, 2011 Rail-Volution, Washington D.C. What is Parking Management? Various
Who has trouble reporting prior day events?
 Vol. 10, Issue 1, 2017 Who has trouble reporting prior day events? Tim Triplett 1, Rob Santos 2, Brian Tefft 3 Survey Practice 10.29115/SP-2017-0003 Jan 01, 2017 Tags: missing data, recall data, measurement
Key Findings and Recommendations Introduction and Overview Task 1 Existing Conditions Analysis Task 2 Parking Demand Analysis...
 Table of Contents Introduction and Overview... 1 Key Findings and Recommendations... 1 Task 1 Existing Conditions Analysis... 1 Task 2 Parking Demand Analysis... 1 Task 3 Facilities Cost Analysis... 2
RUPOOL: A Social-Carpooling Application for Rutgers Students
 Katarina Piasevoli Environmental Solutions Rutgers Energy Institute Competition Proposal March 2015 RUPOOL: A Social-Carpooling Application for Rutgers Students Introduction Most climate change policy
Berkeley Lab - Innovative Fleet Ideas, Goal Performance & Challenges
 Berkeley Lab - Innovative Fleet Ideas, Goal Performance & Challenges June 19, 2013 Blair Horst, PE, CEM Sustainability Coordinator / Energy Manager LBNL Happy Juneteenth!! Juneteenth: observed on June
Pedestrians, Cars, Buses and Trains? Considerations for Rapid Transit Service at Western University
 Pedestrians, Cars, Buses and Trains? Considerations for Rapid Transit Service at Western University Shift: The City of London s Rapid Transit Proposal Shift: The City of London s Rapid Transit Proposal
Service Quality: Higher Ridership: Very Affordable: Image:
 Over the past decade, much attention has been placed on the development of Bus Rapid Transit (BRT) systems. These systems provide rail-like service, but with buses, and are typically less expensive to
Chapter 740, Street Vending One Year Review
 STAFF REPORT ACTION REQUIRED Chapter 740, Street Vending One Year Review Date: April 7, 2015 To: From: Wards: Reference Number: Licensing and Standards Committee Executive Director, Municipal Licensing
IV. ENVIRONMENTAL IMPACT ANALYSIS K.2. PARKING
 IV. ENVIRONMENTAL IMPACT ANALYSIS K.2. PARKING ENVIRONMENTAL SETTING The following analysis summarizes the findings and conclusions of the Traffic Analysis (Traffic Study), prepared by The Mobility Group,
Sustainable Transportation Award Winner. UC/CSU Sustainability Conference Santa Barbara, 2006
 Sustainable Transportation Award Winner UC/CSU Sustainability Conference Santa Barbara, 2006 Translocator (Transit Locator) San Jose State University CSU: Transportation Demand Management Eyedin Zonobi,
EXPERIENCE IN A COMPANY-WIDE LONG DISTANCE CARPOOL PROGRAM IN SOUTH KOREA
 EXPERIENCE IN A COMPANY-WIDE LONG DISTANCE CARPOOL PROGRAM IN SOUTH KOREA JB s Social Club Presented at TRB 94th Annual Meeting on Jan 12, 2015 Louis Berger Kyeongsu Kim Land & Housing Institute (LHI)
San Joaquin Valley Air Pollution Control District Indirect Source Review (ISR) - Air Impact Assessment (AIA) Non-Residential Project Application Form
 - Air Impact Assessment (AIA) Non-Residential Project Application Form") A. Applicant Information Applicant/Business Name: San Joaquin Valley Air Pollution Control District Indirect Source Review (ISR) - Air Impact Assessment (AIA) n-residential Project Application Form Mailing
A. Applicant Information Applicant/Business Name: San Joaquin Valley Air Pollution Control District Indirect Source Review (ISR) - Air Impact Assessment (AIA) n-residential Project Application Form Mailing
VIRGINIA RAILWAY EXPRESS MANASSAS PARK STATION PARKING EXPANSION. Site Evaluation & Recommendation. October 18, 2016
 MANASSAS PARK STATION PARKING EXPANSION Site Evaluation & Recommendation October 18, 2016 1 INFORMATION ITEM Project Overview Parking Demand Site Evaluation VRE Recommended Preferred Alternative Next Steps
List of Figures. List of Tables Membership. Parking ations
 Denver Car Share Program 2015 Program Summary Prepared for: Prepared by: Project Manager: Jeff Ream, PE, PTOE Apex Design Reference No. P130145, Task Order #20 March 15, 2016 Table of Contents 1. Introduction...
November
 November 13 2008 4509.04 Mr. Rob Siddoo Siddoo Holdings 105 2277 West 2 nd Avenue Vancouver BC V6K 1H8 Dear Mr. Siddoo: Re: Transportation Assessment: 1030 Denman Street, Residential Conversion, Vancouver
MOTION NO. M Preferred Alternative for the Puyallup Station Access Improvement Project
 MOTION NO. M2014 64 Preferred Alternative for the Puyallup Station Access Improvement Project MEETING: DATE: TYPE OF ACTION: STAFF CONTACT: Capital Committee Board PROPOSED ACTION 8/14/14 8/28/14 Recommendation
TRANSPORTATION REVIEW
 TRANSPORTATION REVIEW - PROPOSED MIX OF LAND USES IS CONSISTENT WITH THE CITY S UNDER THE GRANVILLE BRIDGE POLICIES THAT AIM TO MEET NEIGHBOURING RESIDENTS SHOPPING NEEDS AND REDUCE RELIANCE ON AUTOMOBILE
Campus Parking, Traffic, and Transportation Information
 2017 18 Campus Parking, Traffic, and Transportation Information General Information The use of motor vehicles on the University of Puget Sound campus is a privilege and not a right. This privilege is extended
1.963 Report: A Sustainable Transportation Plan for MIT Campus May 2007
 1.963 Report: A Sustainable Transportation Plan for MIT Campus May 2007 Authors: David Block-Schachter Michael Kay Francesca Napolitan Tegin Teich Supervisors: John Attanucci, Lawrence Brutti, Fred Salvucci
Stoughton Center Parking
 Stoughton Center Parking Existing Conditions and Observations October 4, 2017 Agenda Introduction Metropolitan Area Planning Council Project Team Parking Studies Background Scope of Work Study Area Survey