Bus Rapid Transit Applications Phase 2
|
|
|
- Gerald Small
- 5 years ago
- Views:
Transcription


1 Bus Rapid Transit Applications Phase 2 Florida Department of Transportation, District IV December 2011
2 ii


3 Bus Rapid Transit Applications Phase 2 December 2011 Funded by the Florida Department of Transportation, District IV Project Manager: Principal Investigators: Khalilah Ffrench, P.E. Florida Department of Transportation District IV Planning and Environmental Management 3400 West Commercial Boulevard Fort Lauderdale, FL Brian Pessaro, AICP National Bus Rapid Transit Institute Center for Urban Transportation Research University of South Florida 4202 E. Fowler Avenue, CUT 100 Tampa, FL Marie Elsie Dowell, P.E., PTOE Parsons Brinckerhoff 7300 Corporate Center Drive, Suite 600 Miami, Florida Michelle Gonzales, MURP Parsons Brinckerhoff 7300 Corporate Center Drive, Suite 600 Miami, Florida Alan R. Danaher, P.E., PTOE, AICP, PTP Senior Supervising Engineer Parsons Brinckerhoff 100 East Pine Street, Suite 500 Orlando, Florida 32801
4 ii
5 Contents 1 Introduction Executive Summary Cleveland HealthLine Project Background Costs Before and After Performance System Characteristics Running Way Stations Vehicles Fare Collection ITS Technologies Service and Operations Branding Lessons Learned Future Plans Eugene EmX Project Background Costs Before and After Performance System Characteristics Running Way Stations Vehicles Fare Collection ITS Technologies Service and Operations Branding Lessons Learned Future Plans Los Angeles Metro Rapid Project Background Costs Before and After Performance System Characteristics Running Way Stations Vehicles Fare Collection ITS Technologies Service and Operations Branding i
6 5.5 Lessons Learned Future Plans Los Angeles Orange Line Project Background Costs Before and After Performance System Characteristics Running Way Stations Vehicles Fare Collection ITS Technologies Service and Operations Branding Lessons Learned Future Plans San Pablo Rapid Project Background Costs Before and After Performance System Characteristics Running Way Stations Vehicles Fare Collection ITS Technologies Service and Operations Branding Lessons Learned Future Plans Kansas City MAX Project Background Costs Before and After Performance System Characteristics Running Way Stations Vehicles Fare Collection ITS Technologies Service and Operations Branding Lessons Learned Future Plans ii
7 9 Boston Silver Line Project Background Costs Before and After Performance System Characteristics Running Way Stations Vehicles Fare Collection ITS Technologies Service and Operations Branding Lessons Learned Future Plans Las Vegas MAX Project Background Costs Before and After Performance System Characteristics Running Way Stations Vehicles Fare Collection ITS Technologies Service and Operations Branding Lessons Learned Future Plans Appendix A: BRT System Characteristics Appendix B: Lessons Learned Appendix C: BRT Route Maps iii
8 List of Figures Figure 1: Light Rail Transit Signal... 8 Figure 2: HealthLine Stations... 9 Figure 3: HealthLine Vehicle... 9 Figure 4: HealthLine Next Connect Sign Figure 5: EmX Dad s Gate Station Figure 6: EmX Vehicle Figure 7: EmX Logo Figure 8: EmX Station Art Figure 9: Metro Rapid Station Figure 10: Metro Rapid 60 Foot Articulated Vehicle Figure 11: Metro Rapid Logo Figure 12: Orange Line Busway at Valley College Station Figure 13: Orange Line Valley Village Station Figure 14: Orange Line Vehicle Figure 15: Orange Line Ticket Vending Machine Figure 16: Orange Line Real Time Bus Arrival Sign Figure 17: San Pablo Rapid Shelter and Sign Figure 18: San Pablo Rapid Vehicle Figure 19: San Pablo Rapid Logo Figure 20: KC MAX Crown Center Station Figure 21: KC MAX BRT Vehicle Figure 22: KC MAX Real Time Information Sign Figure 23: Silver Line Lennox Street Station Figure 24: Silver Line Vehicle Figure 25: Las Vegas MAX Craig Rd. Station Figure 26: Las Vegas MAX Civis Vehicle Figure 27: Las Vegas MAX Wright Streetcar List of Tables Table 1: Comparison of Transit Agencies... 4 Table 2: Comparison of BRT Systems... 5 iv
9 1 Introduction In February 2010, the Florida Department of Transportation (FDOT) District 4 Office tasked Kittelson and Associates with preparing the BRT Applications Phase I report. That report discussed in general terms the characteristics, system costs, and funding opportunities for BRT. It also described the running way types used by several BRT systems in the U.S. and Canada. Finally, it summarized six previous BRT related studies for South Florida. The District 4 Office has now asked the National Bus Rapid Transit Institute at the University of South Florida and Parsons Brinckerhoff to prepare the BRT Applications Phase II report. This effort is intended to provide a detailed summary of various U.S. BRT systems and to support development of BRT in correlation with the Broward MPO 2035 Long Range Transportation Plan (LRTP). There are eight BRT systems included in this report. They include the Cleveland HealthLine, the Eugene EmX, the Kansas City MAX, the Los Angeles Metro Rapid system and Orange Line, the San Pablo Rapid, the Boston Silver Line, and the Las Vegas MAX. The summary for each system has six parts: project background, costs, before and after performance, system characteristics, lessons learned, and future plans. Under system characteristics, information is provided on the running way, stations, vehicles, method of fare collection, ITS technologies, service and operations, and branding. 1
10 2
11 2 Executive Summary The eight BRT systems come from cities of various sizes and are operated by transit agencies that carry various amounts of passengers. Table 1 provides some comparative data about the transit agencies profiled in this report. Table 2 provides some comparative data specifically about their BRT systems. More extensive tables can be found at the back of the report in Appendix A. Some of the key findings from the report are summarized below. Future Plans: Because of their initial success, all of the transit agencies profiled in this report have added new BRT routes to their system and/or have plans to do so in the near future. Boston added a second BRT line in Cleveland has just finished the design of its second BRT line. Eugene, Oregon and Kansas City, Missouri opened their second BRT lines at the beginning of 2011, and both have plans to add more. Los Angeles expanded the two demonstration routes of the Metro Rapid BRT into network of 21 routes and is currently constructing a four mile extension of its full service Orange Line BRT. Las Vegas began with a single BRT line and now has four with construction underway on a fifth. Finally, Oakland will begin construction of their second BRT line in Dedicated lanes: Two of the projects (Boston Washington Street Silverline and L.A. Orange Line) have dedicated bus lanes for 90 percent or more of their length. Four have 60 percent or greater coverage. Two have no dedicated lanes (L.A. Metro Rapid and Oakland San Pablo Rapid). However, both L.A. and Oakland are planning implementation of dedicated bus lanes in future. In fact, all of the planned expansions mentioned above include provision for dedicated bus lanes. In the case of Eugene, the planned expansion of the EmX includes business access and transit (BAT) lanes where the buses would share the lane with turning vehicles. Median stations: Two of the BRT systems, Cleveland and Eugene, use median stations. Both cities are planning future BRT lines without median stations. Among the profiled systems, there are no known plans for expansions that include median stations. Transit signal priority (TSP): All of the BRT systems use transit signal priority. Six systems include TSP at all or most of the route intersections while two (Boston and Las Vegas) limit it to specific locations. Five of the projects use conditional priority and two use unconditional priority (L.A. Orange Line and Las Vegas). Oakland s approach is not known. Off Board Fare Collection: Four of the BRT systems use off board fare collection. Of the planned expansions mentioned above, Las Vegas and Oakland are including provision for off board fare collection. Queue jumper lanes: The BRT systems in Eugene, Oakland and Las Vegas use queue jumpers at one intersection along their respective routes. Their performance is unknown, and there are no known plans for future use of queue jumpers. Agency Interviews Another part of work effort for this report included phone interviews with key staff from the transit agencies of these BRT systems. A recurring theme that was heard was the importance of branding. Joseph Calabrese, the General Manager of the Greater Cleveland Regional Transit Authority stated that 3
12 image and branding were the most critical parts of the HealthLines s success. GCRTA marketed the HealthLine as a rubber tired rail system and incorporated as many rail like features into it as possible. Mark Huffer, the General Manager of the Kansas City Area Transportation Authority, stated in the interview, I have people tell me all the time that they don t ride a bus to work. They ride MAX. The point being made is that good BRT systems are perceived differently than local bus service. Martha Butler, the planning manager for the Metro Rapid BRT in Los Angeles, commented how local residents associate the distinctly colored Metro Rapid buses with a much faster ride. Steffano Viggiano, the former Assistant General Manager of Lane Transit District, echoed these sentiments in regards to the success of the EmX. He also emphasized the importance of designing a BRT system that is easy for the public to understand and has frequent service that eliminates the need for a schedule. Appendix B provides a summary of the key lessons learned by the transit agencies in this report. Agency Name Table 1: Comparison of Transit Agencies Service Area (square miles) 1 Service Area Population 1 Density 2009 Passenger Trips 2,3 LACMTA 1,513 8,626,817 5, ,029,758 MBTA 3,244 4,510,400 1, ,769,313 RTC 280 1,986,146 7,093 66,100,239 AC Transit 364 1,415,129 3,888 60,468,401 GCRTA 458 1,412,140 3,083 38,214,394 KCATA 919 1,445,584 1,573 15,004,166 LTD ,600 1,210 11,732,650 1 Source: National Transit Database 2 Source: Florida Transit Information System, specifically the Integrated National Transit Database Analysis System (INTDAS) 3 Directly operated fixed route transit LACMTA = Los Angeles County Metropolitan Transportation Authority (Metro) MBTA = Massachusetts Bay Transportation Authority AC Transit = Alameda Contra Costa Transit District GCRTA = Greater Cleveland Regional Transit Authority KCATA = Kansas City Area Transportation Authority LTD = Lane Transit District RTC = Regional Transportation Commission of Southern Nevada 4
13 Agency LACMTA LACMTA BRT System Metro Rapid Ventura Line Metro Rapid Wilshire Line Year Started Table 2: Comparison of BRT Systems Length (miles) Capital Cost per Mile Bus Lanes Signal Priority Queue Jumpers Off Board Fare Collection Median Stations No. of Stations $0.2M No Yes No No No $0.2M No Yes No No No 38 MBTA Silverline $12.1M Yes Yes No No No 11 AC Transit San Pablo Rapid $0.2M No Yes Yes No No 28 RTC Las Vegas MAX $2.6M Yes Yes Yes Yes No 22 KCATA Kansas City $3.5M Yes Yes No No No 40 MAX LAMTA Orange Line $21.0M Yes Yes No Yes No 14 LTD EmX $6.3M Yes Yes Yes Yes Yes 10 GCRTA HealthLine $28M Yes Yes No Yes Yes 36 1 Figures are for Washington St. line. 2 Figures are for Main Street line. 3 Figures are for Franklin Boulevard corridor. 5
14 6
15 3 Cleveland HealthLine 3.1 Project Background In 2008 the Greater Cleveland Regional Transit Authority (GCRTA) began the HealthLine BRT service along the city s main east west thoroughfare, Euclid Avenue. The HealthLine provides service between the dual hubs of Public Square in downtown Cleveland and University Circle. University Circle is the location for the Cleveland Clinic, University Hospital, the Cleveland Institute of Art, and Case Western Reserve University. The question of how best to connect these two hubs dates back to the 1950s when voters approved a bond referendum for a subway line on Euclid Avenue. However, the project never began because the Cuyahoga County Engineer was unsupportive of the project and stalled implementation until the bonding authority expired. 1 For many years, the only transit service on Euclid Avenue was the Route 6 bus. Although it had the highest ridership in the system and had frequent 10 minute service, the Route 6 was also slow. It was not the type of high quality transit service that would attract choice riders. 2 Although GCRTA had the lead role in the project, other cities and agencies played critical supporting roles. GCRTA and the Northeast Ohio Areawide Coordinating Agency, which is the MPO, worked closely during the alternatives analysis. In 1995, GCRTA and the MPO both selected BRT as the locally preferred alternative for Euclid Avenue after learning that light rail would cost in the area of $750 million. 3 The cities of Cleveland and East Cleveland both agreed to give up a travel lane on Euclid Avenue for the buses, and they contributed $20 million to upgrade the water and sewer lines below Euclid. Furthermore, the City of Cleveland established a low interest loan program for business owners along the corridor that were negatively impacted by the construction. At the state level, Governor George Voinovich, who was a former mayor of Cleveland, was a project champion and secured state funding as the local match to federal dollars. 4 The HealthLine was one of the earliest FTA New Starts projects. It entered the pipeline in Construction began in The first section opened in November 2007, and it was completely finished by July GCRTA markets the HealthLine as a rapid transit system on par with its Red, Green, and Blue rail lines. 3.2 Costs The HealthLine was funded 50 percent through the Federal New Starts Program. 7 The total capital cost was $197 million, or $27.7 million per mile. 8 That price includes the cost for the median bus lanes as well as the cost for the complete streetscape renovation of Euclid Avenue. That renovation included the reconstruction of concrete sidewalks with brick inlay, new curbs, complete sewer and water system upgrades, and amenities such as new light fixtures, landscaping, and sidewalk benches. The HealthLine s annual operating costs are about $7.2 million per year. GCRTA General Manager, Joseph Calabrese, stated this amount is comparable to the operational costs of the former Route 6 bus line, which the HealthLine replaced. On the one hand, the driver costs are less because the HealthLine has fewer stops than the old Route 6 and can cover the distance in a shorter time. On the other hand, 7
16 the labor costs associated with maintaining the stations are higher because the HealthLine has true stations instead of simple bus stops. However, the total operational costs have worked out to be the same Before and After Performance Ridership on the HealthLine is 58 percent higher than the Route 6 it replaced. There were 4.1 million passengers in 2010 compared to the 2.6 million who rode the old No. 6 local bus line in As of May 2011, average weekday ridership on the HealthLine was 12,238 riders. 12 This is higher than what GCRTA projected. In terms of travel time savings, GCRTA reports that the end to end travel time was reduced from 46 to 34 minutes during the peak period, a 12 minute or 25 percent savings System Characteristics Running Way The total system length of the HealthLine BRT is 7.1 miles. Of that length, 4.4 miles are exclusive bus lanes and 2.7 are mixed flow lanes. 14 At this time, the HealthLine BRT does not use queue jumpers. The BRT buses use the same type of traffic signals specified in the Manual on Uniform Traffic Control Devices (MUTCD) for light rail (see Figure 1) Stations Figure 1: Light Rail Transit Signal Source: MUTCD, Federal Highway Administration The HealthLine BRT consists of 36 stations. 15 On average, the stations are located every 0.42 miles. 16 Some are combined stations located in the median of Euclid Avenue that serve buses in both directions. Other stations in the median are in pairs with one station serving eastbound and the other westbound buses. Usually these station pairs are located on opposite sides of an intersection. The remaining stations are curbside. All HealthLine BRT stations come equipped with emergency phones, fare vending machines, and interactive kiosks that showcase Cleveland history and provide transit information. Realtime bus arrival information is also provided. The stations have 14.5 inch raised platforms to provide near level boarding. 17 Intersection crosswalks in the downtown section use brick pavers to create a more pedestrian friendly environment and to discourage jaywalking to/from the station. 8
, transponders to communicate with the transit signal priority system, multiple doors for boarding on the left and right sides, 11")

17 Figure 2: HealthLine Stations Source: GCRTA Vehicles The HealthLine BRT uses 60 foot stylized articulated buses manufactured by New Flyer. Each bus comes equipped with a Global Positioning System (GPS), transponders to communicate with the transit signal priority system, multiple doors for boarding on the left and right sides, 11 cameras (six inside/five outside), and has text display and audio announcement of the next stop. Each bus has 47 seats with capacity for an additional 53 standees Fare Collection Figure 3: HealthLine Vehicle Source: GCRTA The single ride fare on the HealthLine is $2.25. Off board fare collection is used. Each station is equipped with a ticket vending machine. Customers must retain proof of payment once on board. GCRTA Transit Police randomly check passengers. Passengers without valid fare media are issued a Penalty Fare 9

18 notice equal to the cost of a monthly pass. Riders failing to pay the penalty fare within seven days are charged with a misdemeanor and processed through the court system ITS Technologies Both the stations and the buses are equipped with advanced technology. The stations feature Next Connect variable message signs that show bus arrival information. Although the arrival times displayed are from the schedule, GCRTA has plans to post real time arrivals using Automated Vehicle Location (AVL) data. The HealthLine includes the use of transit signal priority (TSP). The TSP is a GPS based system manufactured by Opticom. 20 There are 52 signalized intersections on Euclid Avenue, of which 33 have TSP. 21 The green signal is extended if the bus is within 1,000 feet of the intersection and running behind schedule. The red signal is shortened if the bus is stopped at the intersection and is behind schedule Service and Operations Figure 4: HealthLine Next Connect Sign Source: GCRTA The HealthLine is an all day, all stop service. It replaced the old Route 6, which was the busiest line in the system. Service runs 24 hours, seven days a week. On weekdays, buses run every five minutes during the peak periods, every 10 minutes at mid day, and every 15 minutes in the evening. On Saturdays and Sundays, buses run every 15 minutes throughout the day Branding HealthLine buses have a distinctive silver livery. In addition, the HealthLine name is a naming right granted to the Cleveland Clinic and University Hospitals in exchange for paying GCRTA $6.25 million over 25 years. 24 Mr. Calabrese stated that branding was the most critical piece of the HealthLine s success. Specifically, he called attention to the use of sleeker, rail like vehicles that have doors on both sides, center median stations, exclusive bus lanes, signal priority, and off board fare collection Lessons Learned Initially there were some issues with unauthorized vehicles operating in and across the BRT s right ofway. To resolve this issue, GCRTA installed flexible delineators to prohibit restricted turns and revised the Bus Only signs to better indicate the exclusive lane. Transit Police began ticketing vehicles 10
19 operating improperly in the BRT lanes. 26 There were also some initial problems with the traffic signal timing that needed to be resolved with traffic engineers from the City of Cleveland. Finally there were some customer complaints about the operation of the fare vending machines not being intuitive. 3.6 Future Plans GCRTA has completed the design of a new BRT line on Clifton Boulevard on the west side of Cleveland. The mayors of Cleveland and Lakewood are both very enthused about the project and are trying to find dollars to help fund the local match. The new BRT line is projected to cost between $10 and $12 million, much less than the HealthLine. It will not include all of the same features as the HealthLine such as offboard fare collection and median stations. But it will still include exclusive, curbside bus lanes and transit signal priority. Besides the BRT line on Clifton Boulevard, GCRTA has two studies underway that will look at extending the Red Line (heavy rail) and Blue Line (light rail). The question being examined in both studies is whether to extend the lines using rail or BRT. The advantage of the BRT option is that it can be done much quicker and more cheaply. The disadvantage of the BRT option is that it would require people to transfer
20 12
21 4 Eugene EmX 4.1 Project Background Lane Transit District (LTD) has named its BRT system the EmX, short for Emerald Express. The original EmX began service on January 14, It is a 4 mile system that operates east west on Franklin Boulevard between downtown Eugene and downtown Springfield. 29 On January 9, 2011, the Gateway Extension was opened. 30 It added 7.8 miles to the EmX. 31 The Gateway Extension runs north south on Pioneer Parkway from the Springfield Station and provides service to the Gateway Mall and Sacred Heart Medical Center. Figure 5 shows a map of the EmX system. LTD s BRT concept originated at a work session of their Board of Directors. Although LTD had a well used transit system, the Board challenged staff to identify strategies that would allow transit in the community to take a quantum leap. The ensuing discussion is what led to consideration of BRT. 32 The BRT concept was further vetted by the Lane Council of Governments during its 1996 update of the 20 year long range transportation plan known as TransPlan. 33 Several transit options were considered including rail, enhanced bus, and conventional bus (i.e., current service). 34 BRT emerged as the preferred transit strategy because it could achieve many of the same benefits as light rail at a lower cost. The RTP calls for a 61 mile, multi corridor BRT system that connects with local neighborhood routes. 35 The selection of the initial corridor on Franklin Boulevard was made by the LTD Board in consultation with partner agencies. LTD had the lead role in project implementation though the alignment did require the approval of the cities of Eugene and Springfield. This arrangement has caused friction at times between the LTD Board and the two city councils. LTD used extensive public involvement, including workshops along the corridor, open houses, design charettes, newsletters, lists, presentations (more than 100) to community groups, and individual meetings with property and business owners along the corridors Costs The capital cost of the Franklin Boulevard portion of the EmX was $25 million or $6.25 million per mile. 37 The capital cost of the Gateway Extension was $41.3 million or $5.3 million per mile. 38 The Franklin Boulevard portion was funded 80 percent through the FTA New Starts Program, and the Gateway Extension was one of the first FTA Small Starts projects, also funded at 80 percent LTD s local share came from a dedicated portion of payroll taxes that they receive for capital funds. 4.3 Before and After Performance In its first year of operation, the EmX on Franklin Boulevard exceeded the 20 year ridership projection. In its first full month of operation, average weekday ridership on the EmX was 4,000 passengers, or 50 percent higher than the Route 11 that it replaced. 41 Today the EmX on Franklin Boulevard averages 7,200 weekday boardings when school is in session. 42 Ridership on the Gateway Extension is at the level that was projected during planning. It averages 2,200 average weekday boardings when school is in session. In terms of travel times, the EmX reduced the travel time on Franklin Boulevard from 16 to 15 13

22 minutes. 43 The reduction seems small, but it should be kept in mind that the corridor is only four miles in length. Interestingly, over 80 percent of riders perceived the EmX as faster than the Route 11, with almost half of surveyed respondents indicating that the EmX was at least 15 minutes faster. 44 On time performance was already high (97%) under the Route 11 and stayed that way after the EmX. However, it should be noted that the high on time performance of the Route 11 was due to a large amount of slack built into the schedule System Characteristics Running Way The original EmX on Franklin Boulevard is four miles, of which 1.4 miles are mixed traffic and 2.5 miles are exclusive bus lanes. 46 It includes a queue jumper at McVay Station to bypass traffic. 47 In some areas, EmX buses share a single bus lane for both directions, requiring block signaling to ensure that it is safe for a bus to enter the bus lane. 48 In order to dampen sound and absorb fluid leaks from the bus, portions of the bus lane have a grassy strip in the center. The Gateway Extension added 7.8 miles (round trip), of which 5.2 miles are exclusive bus lanes Stations The original EmX on Franklin Boulevard consists of 10 stations between downtown Eugene and downtown Springfield. The Gateway Extension added 14 new stations in Springfield. 50 Each station provides a covered shelter, trash receptacles, ticket vending machines, lighting, and a map of the EmX route. A local architectural firm was hired to design the EmX stations. Support columns are located in the center of the station to facilitate boarding on both sides. Stations have 14 inch raised platforms to enable near level boarding. 51 Yellow guide strips have been installed along the side of the platform to assist the bus operators while docking. Figure 6 shows one of the stations. Figure 5: EmX Dad s Gate Station Source: NBRTI 14

23 4.4.3 Vehicles The EmX BRT uses the same specially designed 60 foot New Flyer buses procured by GCRTA for the HealthLine. These buses use a hybrid electric propulsion system to attain low emissions and quiet running. Three wide doors are located on the right side of the vehicle, and two are located on the left side. The buses use a low floor design to enable fast boarding and ease of use, especially for wheelchairs. On board there is space for two wheelchairs, three bicycles, 44 seats, and room for 56 standing riders. 52 Figure 6: EmX Vehicle Source: Lane Transit District Fare Collection Any standard LTD bus pass or Day Pass is a valid fare on EmX. However, passengers that begin their trip on EmX need to use the ticket vending machines on the EmX platforms. 53 The EmX uses a proof of purchase system meaning all fares are purchased off board. The standard cash fare on the EmX is $1.50 per trip. 54 Also of note is that LTD opted for vending machines that are smaller than the typical BRT vending machines, essentially modified parking meter/stations ITS Technologies All EmX buses are equipped with AVL and APC systems. TSP is provided at 16 intersections along the Franklin EmX and 18 intersections along the Gateway EmX The buses are eligible for priority once every three cycles to allow for a recovery period. 57 Because portions of the busway are a single lane serving both directions, block signaling is used to ensure that only one bus is in the lane at a time Service and Operations The EmX runs every 10 minutes on weekdays, every 15 minutes during early weekday evenings and on Saturday, and every 30 minutes during late weekday evenings and on Sunday. Service hours are from 5:40 AM to 11:33 PM Monday through Friday, 6:57 AM to 11:35 PM on Saturday, and 7:45 AM to 8:28 PM on Sunday. 58 On the Gateway loop the EmX runs both clockwise and counterclockwise to provide more convenience


24 4.4.7 Branding EmX branding is conveyed via the EmX logo, as shown in Figure 8, the distinctive green livery on the buses, and unique design of the stations. Additionally, LTD commissioned a local artist to give each station a look characterized by a different plant. Figure 7: EmX Logo Source: Lane Transit District Figure 8: EmX Station Art Source: NBRTI 4.5 Lessons Learned LTD noted four main lessons learned during the planning and implementation of the Franklin EmX. 60 First, it is important to consider any city ordinances that may affect the project. In Eugene, a public vote must be held before any tree older than 50 years is removed from the right of way. Second, LTD found 16
25 that it was much easier to implement the system when all stakeholders are kept informed and interested. Third, it is important to find a politician willing to back the project as a champion. LTD did not do this and recognized that it would have made the planning process smoother. Finally, during the planning process, LTD made use of visualization techniques to give stakeholders and interested parties the ability to see a final project and keep them interested. The former Assistant General Manager of LTD, Mr. Steffano Viggiano, listed five factors that were critical to the success of the EmX. They included the higher visibility of the EmX because of its branding, the ease of understanding the service because there is no need to consult a schedule, the improved reliability that came with having a dedicated bus lane, reduced travel time, and more frequent service. 4.6 Future Plans The regional transportation plan calls for build out of a 61 mile BRT system. The next leg of the EmX that is being planned is the West Eugene EmX extension. This would add another four to five miles to the system. 61 Construction is scheduled to begin in 2015, and operations are expected to commence in LTD stated that they have learned a number of things from building the first two EmX lines and there will be a re evaluation of the 61 mile network. This may result in fewer BRT miles and more service that falls somewhere between traditional fixed route service and BRT service
26 18
27 5 Los Angeles Metro Rapid 5.1 Project Background The Metro Rapid was Los Angeles s first foray into bus rapid transit. Currently, Metro Rapid consists of 21 routes and covers a network of 400 miles. 64 However, it began in 2000 as a demonstration project on two corridors, Ventura Boulevard and Wilshire/Whittier Boulevard The impetus for the Metro Rapid came from a City of Los Angeles study on Metro bus service that showed buses spent half of their time stopped, either at a red traffic signal or at a bus stop for boarding/alighting. 65 In 1998, officials from the City of Los Angeles, including then Mayor Richard Riordan, and from the Los Angeles County Metropolitan Transportation Authority (Metro) made a tour of the BRT in Curitiba, Brazil. 66 On that trip, the delegation observed Curitiba s BRT system in operation and made note of its key attributes. Upon returning to the U.S., Metro commissioned a BRT feasibility study that in the end recommended a demonstration program. Planning for the demonstration began in the summer of Two lines were identified as candidate routes. They were the Line 720 on Wilshire/Whittier Boulevard, and the Line 750 on Ventura Boulevard The Wilshire/Whittier line is an urban corridor route that travels through the L.A. central business district, and the Ventura line is a suburban route that connects with the Metro Rail Red Line. The demonstration was to include 7 of 13 key BRT attributes identified from the Curitiba trip. These included: simple route layout; frequent service; headway based schedules; less frequent stops; level boarding; color coded buses and stations; and transit signal priority. 67 The City of Los Angeles was Metro s partner on the Rapid program. It was the city that developed the proprietary TSP system for the Metro Rapid. 68 Service on the Wilshire and Ventura Metro Rapid lines began on June 24, 2000, coinciding with the opening of the Red Line extension to the San Fernando Valley Costs The total capital cost for the two demonstration lines was $8,274,300 ($5,010,000 for the Metro Rapid on Wilshire/Whittier Boulevard and $3,264,300 for the Metro Rapid on Ventura Boulevard) The cost per mile was $195, Funding came primarily through Congestion Mitigation and Air Quality (CMAQ) grants. 71 The current annual operating cost of the Metro Rapid on Wilshire/Whittier Boulevard is $28,827,075 while the operating cost for the Metro Rapid on Ventura Boulevard is $4,630,071. The Metro Rapid on Wilshire/Whittier Boulevard is the most expensive to operate out of all 21 routes in the Metro Rapid system because it has the highest number of annual revenue hours. The Metro Rapid with the lowest operational cost is the Route 741 on Reseda Boulevard at $1.8 million per year. The median operational cost for the 21 routes is $4.9 million

28 5.3 Before and After Performance After the implementation of Metro Rapid, operating speeds increased by 29 percent on the Wilshire/Whittier line and 23 percent on the Ventura line. Independent research conducted by the City of Los Angeles concluded that a third of the speed improvement was due to transit signal priority while the other two thirds were due to the other Metro Rapid attributes. 73 Ridership in the Wilshire/Whittier corridor increased 42 percent from 63,500 to 90,300 daily riders. Ridership in the Ventura corridor increased 27 percent from 13,500 to 17,100 daily riders. A survey conducted after implementation indicated that the ridership increase could be attributed evenly to three groups: new riders, existing riders taking more trips, and riders shifting from other corridors. 74 System wide, ridership on the Metro Rapid has been increasing even as ridership on the local routes has decreased. Some passengers have switched their travel patterns from non Metro Rapid corridors to Metro Rapid ones because of the faster speeds associated with the latter System Characteristics Running Way Both the Wilshire/Whittier and Ventura lines operate in mixed traffic lanes. Metro has plans to operate the Wilshire line in a bus lane in both directions by The Wilshire/Whittier line is 26 miles. The Ventura Line is 16 miles Stations Enhanced stations are provided along Metro Rapid routes and provide passenger amenities such as seating, shelter, lighting, and real time bus arrival information. Generally, the stations are provided at the far side of the intersection and are spaced approximately 0.75 miles apart. 78 Figure 9: Metro Rapid Station Source: NBRTI 20

29 5.4.3 Vehicles For the initial demonstration, the Metro Rapid used standard 40 foot buses manufactured by North American Bus Industries (NABI) as shown in the station photo in Figure 11 above. These were low floor CNG buses with seating capacity for 47 passengers. Since then, Metro has expanded the fleet to include 60 foot stylized articulated Metro Liners, also manufactured by NABI, similar to what is used on the Orange Line (see Figure 10). The Metro Liners have seating capacity for 57 passengers and 12 standing passengers Fare Collection Figure 10: Metro Rapid 60 Foot Articulated Vehicle Source: Fares for the Metro Rapid are collected on board the vehicle. 79 The fare is $1.50, the same as for the local buses. 80 There is no charge to transfer between Metro buses. However, there is a $0.35 charge to transfer to/from municipal (i.e., non Metro) buses ITS Technologies The Metro Rapid demonstration program on Wilshire/Whittier and Ventura Boulevards included a proprietary TSP system developed especially for it by the City of Los Angeles. The TSP was deployed at 211 intersections along the two corridors (88 intersections on Ventura Boulevard and 123 intersections on Wilshire/Whittier Boulevard). The system is unique in that it uses loop detectors that serve as the automatic vehicle identification sensor. Metro Rapid buses are equipped with transponders mounted under the vehicle that communicate the bus identification number to the loop detector. The bus information is then relayed to the City of Los Angeles s Automated Traffic Control Center computer where the determination is made on the need for signal priority. Priority is only granted when the bus is late or past its scheduled headway. The TSP priority can be in the form of either an extended green or shortened red signal phase. Also developed in house by the City of Los Angeles was the bus arrival information system. Dynamic message signs at select bus shelters display the expected arrival time of the next bus with an accuracy of approximately one minute

30 5.4.6 Service and Operations Both the Ventura and Wilshire/Whittier lines operate on headway based schedules, as opposed to time of day based schedules. 83 The Ventura line operates Monday through Friday every five to seven minutes in the AM peak period, every 30 minutes during mid day, and approximately every 15 minutes in the PM peak period. Service goes from approximately 5 AM to 10 PM. The Wilshire/Whittier line operates seven days a week. On weekdays, buses run as frequently as every three minutes during the AM and PM peaks and every seven minutes during mid day. Weekday service spans from approximately 4 AM to 1 AM. Weekend service is still very frequent, sometimes as frequent as every six minutes. Weekend service spans from approximately 4:30 AM to 1 AM Branding Metro Rapid buses have a distinctive red and silver livery. Additionally Metro Rapid stations include a distinctive logo to distinguish them from regular bus stops. 5.5 Lessons Learned Figure 11: Metro Rapid Logo L.A. s Metro Rapid was the first BRT system to be developed in the U.S., and from it several key lessons were learned. Metro reported that it took the bus operators a while to get used to a completely new type of operational model with wider spacing between stops and the inclusion of transit signal priority. The Metro Rapid was the first BRT system in the U.S. to use TSP, and Metro quickly learned that TSP works better with far side stop locations. A final lesson learned pertained to performance thresholds. Metro was highly selective on the two lines that were chosen for the demonstration program. Because the Metro Rapid was so successful, other areas of Los Angeles wanted Metro Rapid for themselves as 22
31 well. Because of the pressure to be equitable, Metro Rapid lines were started in some areas that in retrospect were not the best candidates. Since then, there has been cancellation of several underperforming Metro Rapid lines Future Plans On Wilshire Boulevard, Metro has plans to improve the existing Metro Rapid line by adding 9.6 miles of dedicated peak hour bus lanes in both directions. Metro is in the process of entering into agreements with the City of Los Angeles for design and construction. Construction will begin around spring The existing TSP system will be improved and include adding TSP at intersections with near side bus stops, increasing the maximum time for signal priority from 10 to 15 percent of the traffic signal cycle at minor intersections, and reducing the number of traffic signal recovery cycles from two to one at key intersections along the corridor. 87 On board fare collection will remain as the method of payment. In addition to the Wilshire project, Metro will soon begin a study that looks at improving and expanding the Metro Rapid system as a whole. In August 2011, Los Angeles City Mayor Antonio Villaraigosa made a motion at a Metro Board meeting to identify a minimum of five new corridors in the county that could accommodate BRT. Metro staff will return to the board in October to get permission to study 16 corridors initially. Of those 16 corridors, 12 have existing transit service, and four have none. Of the 12 corridors that have transit service, some have Metro Rapid service already. The study will look at adding new Metro Rapid service to the corridors that currently have no transit service, converting existing local transit service to Metro Rapid service, and enhancing existing Metro Rapid service with dedicated bus lanes. In addition the study will look at operational improvements such as switching to multiple door boarding and off board fare collection
32 24
33 6 Los Angeles Orange Line 6.1 Project Background The Metro Orange Line, located in the San Fernando Valley of the City of Los Angeles, opened in October 2005 and runs east west between North Hollywood and Warner Center. A map of the route is shown in Figure 14. The Orange Line is the first full service BRT in the U.S. Its history dates back to 1980 with the passage of Proposition A, a half cent sales tax dedicated to funding regional rail service. A portion of the funds was supposed to go toward the extension of rail service in the San Fernando Valley. The Southern Pacific Burbank Branch, an abandoned rail line paralleling the congested U.S. 101 Freeway, was recommended as the preferred alignment for the corridor. In 1991, the Los Angeles Metropolitan Transportation Authority (Metro) purchased the right of way and began developing concepts for light rail. 89 Shortly thereafter though, state legislative restrictions on rail funding were enacted that halted the pursuit of rail in the San Fernando Valley. In 1998, Metro staff conducted a scanning tour of the BRT system in Curitiba, Brazil. Upon their return home, they undertook a major investment study (MIS) to reassess transit alternatives for the San Fernando Valley east west corridor. In 2000, the busway concept was proposed, and in 2001 the Metro Board of Directors officially adopted BRT as the Locally Preferred Alternative. 90 Metro did not pursue New Starts funding for the Orange Line, relying instead on a combination of state and local funds. Planning and engineering of the busway took place from 2000 to Construction began in 2003 but was delayed after a lawsuit was filed by a local activist group called Citizens Organized for Smart Transit (COST). COST argued that the projected travel time savings of the Orange Line could be achieved at much lower cost by expanding the Metro Rapid system. Construction was temporarily halted in 2004 after a California Court of Appeals ordered Metro to evaluate adding Metro Rapid lines as an alternative to the Orange Line. In October 2004, Metro issued a revised Environmental Impact Report (EIR) that concluded the Orange Line would yield greater benefits than additional Metro Rapid service. Construction resumed, and the Orange Line opened in October In terms of public involvement, more than 200 public meetings were held, and nearly 11,000 contacts were identified. The public meetings included workshops to solicit input on station design and landscaping and to address the concerns of adjacent neighborhoods. Metro organized an Arts Advisory Group to discuss artwork for the stations. As part of its safety program, Metro distributed an interactive Orange Line safety presentation, in the form of a DVD, to more than 30,000 residents within a mile radius of the busway. Metro also delivered safety presentations to more than 100 schools within a 1.5 mile radius of the Orange Line
34 6.2 Costs The capital costs for the Orange Line was $304.6 million, or $21 million per mile. 93 This includes the costs of the dedicated busway, vehicle acquisition, and station construction. Metro did not pursue New Starts funding from the Federal Transit Administration (FTA), relying instead on a combination of state and local funds for the Orange Line. 94 The annual operating cost of the Orange Line is $12.8 million Before and After Performance The Orange Line did not replace a specific route. During planning, the projected ridership was 7,500 passengers per day. By May 2006 (i.e., eight months into operations), the Orange Line had already exceeded the 2020 projections and was carrying 22,000 riders per day. 96 As of October 2010, it was carrying 23,900 passengers per day. 97 Interestingly, the Orange Line has attracted some riders away from the Metro Rapid Ventura line (Route 750), which runs 1.5 miles to the south and parallel to the Orange Line. Consequently, Metro recently discontinued weekend service on the Ventura line. 98 The travel time on U.S. 101 between Warner Center and North Hollywood is 50 minutes. Metro had projected that the Orange Line would reduce travel times to between 28.8 and 40 minutes. The actual travel time, according to Automatic Passenger Counter (APC) data, is 43 minutes. Although this represents a 22 percent improvement, it is still short of Metro s goal. The less than hoped for travel time savings are due to a 10 mph speed restriction Metro has placed on buses when crossing signalized intersections. This restriction was put in place shortly after opening because of several accidents that occurred System Characteristics Running Way The 14.5 mile Orange Line runs almost entirely on an at grade, two lane dedicated busway. The western terminus is the Warner Center mall and office complex in Woodland Hills. The eastern terminus is the Red Line subway in North Hollywood. 100 The busway is 26 feet wide but is widened further at the stations to provide an added lane to allow for bus passing. The busway passes through 38 signalized intersections. Loop detectors are installed at all intersections to give Orange Line vehicles signal priority. The only location where the bus travels in mixed traffic is for half a mile near the western terminus at Warner Center. Construction of the busway included a 14 mile bicycle and pedestrian path, complete with fencing, crosswalks, and lighting. Rubberized asphalt was used on the segments of the busway near the residential sections. 101 The rubberized asphalt has since been replaced with Super Pave asphalt because significant cracking and rutting occurred and test results showed that the noise reductions were negligible


35 6.4.2 Stations Figure 12: Orange Line Busway at Valley College Station Source: Bus Rapid Transit Around the World, photo by Peter Ehrlich The Orange Line has 14 stations. Each station has two platforms, one for each direction. Stations are able to accommodate up to three articulated buses. The stations are spaced approximately one mile apart. 103 Station amenities include bicycle racks, covered seating, lighting, security cameras, and real time bus arrival information. The stations are decorated with terrazzo pavement and enameled art panels Vehicles Figure 13: Orange Line Valley Village Station Source: NBRTI The Orange Line uses 60 foot stylized articulated Metro Liners manufactured by North American Bus Industries (NABI). The buses have a low floor design to allow for near level boarding. All buses are equipped with large windows and wide aisles for passenger comfort. Buses are also equipped with video cameras, and real time information signs. It has a carrying capacity of 57 seated and 12 standing 27
 engine equipped with a five speed automatic transmission.")
36 passengers, with room for two wheel chairs. An external bike rack has room for two bicycles. It is powered by a Cummins six cylinder 320 horsepower compressed natural gas (CNG) engine equipped with a five speed automatic transmission. Figure 14: Orange Line Vehicle Source: Metro In September 2007, Metro tested a new, super sized 65 foot Metro Liner demonstration vehicle. Nicknamed Longfellow, it has the highest capacity of any articulated CNG bus in North America with room for 66 seated passengers. It was tested for one year and has since been put into daily revenue service on the Orange Line. However, California law restricts transit bus lengths to 60 feet. The Longfellow was granted a special permit as a demonstration project only. Until state law is changed, it is unlikely that Metro will be purchasing any more 65 foot buses Fare Collection The standard cash fare for a single trip on the Orange Line is $1.50, the same as for other Metro routes. 105 Tickets are purchased off board at the stations using ticket vending machines. The tickets are retained by the passenger as proof of purchase and may be verified by fare inspectors at any time. The other form of payment allowed on the Orange Line is an electronic smart card known as the transit access pass, or TAP Card. Passengers tap their card on the electronic validation machine at the station prior to boarding. For proof of payment, fare inspectors use wireless handheld units to make sure that TAP users have validated their cards. There is no charge to transfer between Metro buses. However, there is a $0.35 charge to transfer to/from municipal (i.e., non Metro) buses

37 Figure 15: Orange Line Ticket Vending Machine Source: NBRTI ITS Technologies Each Orange Line bus is equipped with AVL and APC. TSP is provided at all 38 intersections, including the on street segment near Warner Center, via a network of loop detectors embedded in the pavement. Unconditional priority is granted meaning the TSP does not take into account whether the bus is behind schedule. 107 LADOT chose to use unconditional priority for the Orange Line in order to achieve the best possible travel times and to meet the project s design objective of a light rail on rubber tires. 108 The TSP system is based on the system built for the Metro Rapid in 2000 but modified to work on a dedicated busway crossing major streets. By using the same TSP system already deployed throughout the rest of Los Angeles, the Orange Line corridor could be better integrated with the existing system. 109 Cameras are installed both at stations and on vehicles for safety and security. Real time bus arrival signs are located at each station. 29

38 6.4.6 Service and Operations Figure 16: Orange Line Real Time Bus Arrival Sign Source: NBRTI The Orange Line operates on a headway based schedule seven days a week, 22 hours per day. Service frequencies are every four to five minutes during the peak periods, 10 minutes during the middle of the day, 15 to 20 minutes overnight, and 10 to 20 minutes on Saturday and Sunday Branding Metro has branded the Orange Line as part of their rail network by giving it a color coded name designation. The buses are painted silver and gray to match the color scheme of Metro rail vehicles. Additionally, all Orange Line stations have the same basic design and construction, ensuring a consistent, recognizable brand identity along the line. 6.5 Lessons Learned During initial months of operation, the Orange Line experienced a series of collisions and near miss incidents, primarily due to motorists on cross streets running red lights at busway intersections. Only one of these reported accidents was due to negligence on behalf of an Orange Line operator; all other accidents were the fault of the other party. In response to these initial collisions, Metro reduced running speeds from 25 mph to 10 mph at all intersections. In addition, enhanced signage and warning signals were added and photo enforcement cameras were installed at many of the Orange Line s intersections to deter red light running. Since then, the Orange Line has maintained a lower accident rate than the Metro system as a whole. Because of the high frequency of service and unconditional signal priority, bus bunching is an issue. Metro advises its Orange Line drivers to leave the terminal exactly at the scheduled depart time; maintain a safe speed, but never exceed the posted speed limit; if another bus is encountered, fall back 30
39 or slow down until the other bus is no longer visible; and if directed to do so by the Bus Operations Control Center (BOCC), reduce speed. A final lesson learned pertains to the use of rubberized asphalt for the busway pavement. It was used on the segments of the busway near the residential sections. The rubberized asphalt has since been replaced with Super Pave asphalt because significant cracking and rutting occurred and test results showed that the noise reductions were negligible Future Plans According to Metro, the 30 year long range transit plan does not include plans to do another BRT project on the scale of the Orange Line. Any rail rights of way owned by Metro would most likely be used for rail not BRT. Metro does plan to add more BRT service to its system, but it will be additional Metro Rapid service. 112 The only exception is the extension of the Orange Line. Construction is underway now to extend the Orange Line four miles north from Canoga Station on the western end of the line to the Chatsworth Metrolink Station. Four new stations are being added. This extension will improve northsouth mobility in the western San Fernando Valley. It is scheduled to open in summer
40 32
41 7 San Pablo Rapid 7.1 Project Background In June 2003, AC Transit in California began the San Pablo Rapid along the north south corridor of San Pablo Avenue. It is a 14 mile route that traverses seven cities, Oakland, Emeryville, Berkeley, Albany, El Cerrito, Richmond, and San Pablo, and two counties, Alameda and Contra Costa. 114 San Pablo Avenue is parallel and a quarter mile to the east of Interstate 80. Prior to the construction of the interstate, San Pablo Avenue was the main north south thoroughfare. The San Pablo Rapid grew out of the 1997 San Pablo Avenue Corridor Plan. 115 This plan was jointly developed by the cities of Albany, Berkeley, Emeryville, and Oakland along with the Alameda County Congestion Management Agency (CMA), AC Transit, Caltrans, and the Metropolitan Transportation Commission (MTC), which is the MPO for that area. Prior to implementation, there were three bus routes that served the corridor: Routes 72, 72L, and The San Pablo Rapid is designated as the Route 72R, and it replaced the 72L. 7.2 Costs The total cost of the San Pablo Rapid was approximately $3.2 million, or $230,000 per mile. 117 This cost includes transit signal priority and signal improvements, shelters and furniture, marketing, rider surveys, and initial operations. 7.3 Before and After Performance The San Pablo Rapid reduced travel times in the corridor by 12 minutes, which is 21 percent less compared to local service and 17 percent less compared to the previous 72L. 118 After implementation, there was a net 13 percent increase in total weekday corridor ridership from 10,693 to 12,084. Ridership on the Rapid is 200 percent higher than it was on the former 72L. It was averaging 1,939 daily riders in 2003 immediately prior to the start of the San Pablo Rapid. By March 2004, less than a year after its start, the Rapid was averaging 5,855 daily riders. 119 Some of the increase was due to riders diverting from other routes in the corridor. Another reason for the increase is that the San Pablo Rapid offers much more service than the former 72L. While the 72L operated only from 6:00 to 10:00 AM and 1:00 to 5:30 PM at 20 to 30 minute frequencies, the San Pablo Rapid operates continuously from 6:00 AM to 7:00 PM at 12 minute frequencies System Characteristics Running Way The San Pablo Rapid operates in mixed traffic along the San Pablo corridor, parallel to I 80. The corridor is 14 miles long with 28 stops spaced approximately every half mile. The southern terminus for the Rapid is Jack London Square located in downtown Oakland. The northern terminus is located at Contra Costa College in San Pablo

42 7.4.2 Stations The San Pablo Rapid originally consisted of 26 stops, but 2 more have been added since All stops are distinctly identified as Rapid stops via the red color scheme, logo, and a marker sign. All stops are located on the far side of the intersection. 122 This is so the bus can leave the stop as soon as boarding is complete without waiting for the signal and to facilitate the use of TSP. All Rapid stops provide covered seating and are ADA accessible. The shelters have glass sides and roof to allow for natural lighting during the day. Other amenities include trash receptacles, an information kiosk with route and fare information, and real time bus arrival signs. Figure 17: San Pablo Rapid Shelter and Sign Source: NBRTI 34

43 7.4.3 Vehicles The San Pablo Rapid uses the 40 foot Van Hool A330 bus. The vehicles feature low floors for faster boarding and alighting and three right side doors. The seating capacity of the buses is 32 with standing room for 77. A bicycle rack is located on the front exterior of the bus with room for two bikes Fare Collection Figure 18: San Pablo Rapid Vehicle Source: Fares are collected on board the vehicle. The San Pablo Rapid uses the same fare structure as other AC Transit buses with a base fare of $2.10. There is a $0.25 charge to transfer to/from the Rapid to other local buses ITS Technologies All San Pablo Rapid buses are equipped with AVL and APC, and TSP is provided at 63 intersections. Only San Pablo Rapid buses are able to trigger the system. Once the TSP is activated by a bus, it cannot be activated again for 10 minutes. Both extended green and truncated red signal phase activations are used. Real time information signs are provided at all shelters to provide the time for the next bus arrival Service and Operations The San Pablo Rapid runs every 12 minutes on weekdays between 6:00 a.m. and 8:00 p.m
44 7.4.7 Branding The livery colors for the San Pablo Rapid are red, white, and green. As shown earlier in the station photo, each Rapid bus stop includes a distinctive marker sign to set it apart from other bus stops. A portion of the federal funds was set aside for a marketing campaign to build the Rapid brand. The Rapid logo was designed to differentiate the Rapid service from other AC Transit services. Both internal and external launch events were held to promote the service within AC Transit and to the community. A television commercial with the theme Live Your Life in the Fast Lane was produced at a cost of $10,000 to promote the new Rapid service. Door hangers were distributed with free tickets in residential areas within a quarter mile of the route, and an outreach program was started to promote the Rapid service to local businesses Lessons Learned Figure 19: San Pablo Rapid Logo Source: Alameda Contra Costa Transit District AC Transit commented that installation of the real time bus arrival signs should have been addressed earlier. AC Transit had to dig trenches to the nearest utility location and install electric meters on the shelters. This involved a lengthy permitting process. Consequently, real time information was not available at the stops until a year after the service began. A second lesson learned was the importance of marketing the new service. AC Transit did this through TV commercials, door hangers with free tickets, and partnering with local businesses. 7.6 Future Plans AC Transit has plans to begin construction of the East Bay BRT in The project would build bus lanes and BRT stations in the cities of Berkeley, Oakland, and San Leandro. The buses will operate on Telegraph Ave., International Boulevard, and East 14 th St. This BRT system will feature dedicated bus lanes, off board fare collection, level boarding, real time next bus arrival signs, and TSP. It is anticipated that construction will be completed in
45 8 Kansas City MAX 8.1 Project Background In July 2005, the Kansas City Area Transportation Authority (KCATA) began operating the Metro Area Express (MAX) BRT service on Main Street. It is a north south route that provides service to River Market, Downtown, the Crown Center, Midtown, and Country Club Plaza. The MAX is an arterial running BRT with simple but distinct stations that have enhanced amenities such as real time bus arrival information. The MAX features peak hour bus lanes, transit signal priority at 31 intersections, distinctive branding, and very frequent service. The Main Street Corridor had been the subject of numerous alternatives analyses and major investment studies going back to the 1970s. Much of the focus had been on planning for light rail. In 1995, preliminary engineering began on a 23.8 mile starter rail line on Main Street. The estimated cost was $793 million. 129 In August 2001, KCATA sponsored a sales tax referendum to support light rail that was defeated by a wide margin. Afterwards, KCATA met with city staff to look at alternatives to light rail, and the idea for BRT originated. 130 A key selling feature of BRT to local political and business leaders was that no new local taxes would be needed for its construction. 131 The MAX was implemented very quickly. Planning began in Design and engineering began in 2003, and construction began in In July 2005, the MAX started service. 132 In terms of roles, KCATA was the project lead. It issued the requests for proposals (RFPs) for the construction contracts. KCATA partnered with the City of Kansas City. KCATA was responsible for repaving the curb lane that would be used by the MAX buses while the city repaved the general purpose lanes. The city also upgraded the traffic signals with TSP. 133 In terms of public involvement, KCATA hosted public workshops along the corridor. The MAX BRT project was KCATA s first large scale use of the internet. KCATA posted all design documents and artist sketches online via a project website. They also provided links for people to post comments Costs The total capital cost of the MAX was $21 million or $3.5 million per mile. Of that amount, 80 percent was paid for with federal funds. 135 The federal funds came from a variety of sources including $3.4 million from FTA New Starts, $8.3 million from FTA Section 5309, and $5 million from Section 330 (Revenue Aligned Budget Authority). 136 The current operating cost of the MAX is just under $4 million annually. 137 Mark Huffer, KCATA General Manager, acknowledged that the MAX s operating costs was slightly more than the previous Route 56. The increase was mostly due to improved headways, which required the use of more buses Before and After Performance The MAX replaced the Route 56 on Main Street. After implementation, ridership in the corridor increased approximately 50 percent from 3,200 per day to over 6,000 per day. The actual ridership is slightly higher than originally projected. Currently, the Main Street MAX has the third highest ridership 37

46 in the KCATA system. 139 Travel times from Country Club Plaza to Downtown improved from 24 to 18 minutes, a 25 percent savings On time performance improved from 80 to 90 percent System Characteristics Running Way The total length of the MAX is six miles, of which 3.75 miles are exclusive bus lanes. 142 There are two sections to the bus lanes. One section operates as a bus lane only during the peak hours. The other section, located in downtown, is a full time bus lane Stations The MAX has 40 stations. 144 Each one is named for the community or neighborhood where it is located and has the station name prominently featured. An 18 foot tall marker with the MAX logo serves as a beacon from blocks away. Sheltered seating is provided at all stations. Additional amenities include trash receptacles, a route information kiosk, and a real time information sign to indicate the arrival time of the next bus Vehicles Figure 20: KC MAX Crown Center Station Source: Kansas City Area Transportation Authority The MAX uses 42 foot semi stylized Gillig buses that have seating capacity for 39 passengers. The buses are equipped with bicycle racks, low floors, wide aisles, and large windows for passenger convenience and comfort. All buses are equipped with APC and AVL


47 Figure 21: KC MAX BRT Vehicle Source: Kansas City Area Transportation Authority Fare Collection Fares are collected on board the vehicle via fare boxes. The MAX has the same $1.50 single fare as standard service. 146 There is no charge to transfer ITS Technologies All MAX vehicles are equipped with AVL and APC. This allows for the arrival times of the next bus to be displayed at the station. An example of the real time information sign is shown in Figure 25. TSP is provided at 31 intersections along the Main Street BRT corridor and priority is granted if a bus is more than one minute late. 147 Figure 22: KC MAX Real Time Information Sign Source: Kansas City Area Transportation Authority 39
48 8.4.6 Service and Operations The MAX operates seven days per week from 5:30 AM to midnight. Service is every 10 minutes during the peak periods, every 15 minutes at midday and on Saturday, and every 30 minutes at night and on Sunday Branding MAX buses are distinguished from other buses in the KCATA system by the unique MAX logo and blue color scheme. MAX stations are attractive, well lit, and are unique to the MAX. They share the same blue color scheme and include an 18 foot high marker with the MAX logo. 8.5 Lessons Learned Mr. Huffer stated that the two factors that have contributed most to the MAX s success are its brand identity and the real time bus arrival signs. The MAX branding has been so successful that many riders do not even consider it a bus. Mr. Huffer said during the phone interview, I have people tell me all the time that they don t ride a bus to work. They ride MAX. 149 As successful as the MAX is, KCATA noted several things they would have done differently. They would have placed more emphasis on far side stations, reduced the number of stations to maintain spacing, and requested additional hours for the peak period bus lanes. KCATA also stated that it would have liked TSP at more intersections, would have included more sidewalk improvements, and would have placed more emphasis on pavement improvements to enhance the ride quality Future Plans After the 2001 ballot initiative for light rail failed and KCATA started moving toward BRT, the MPO said the area needed a new long term transit plan because the previous one assumed light rail. The MPO (Mid America Regional Council) developed a long range transit plan in conjunction with KCATA, Johnson County Transit and Unified Government Transit (Wyandotte County). The plan was called Smart Moves. It identified seven candidate corridors for BRT that could be converted to light rail at some point in the future. Of those seven corridors, two now have BRT (Main Street and Troost Avenue), one in Johnson County has BRT under construction, and another corridor in Wyandotte County will have BRT under construction in spring The BRT project in Johnson County is the Shawnee Mission/Metcalf BRT. It will run from Kansas City, Missouri west into Johnson County, Kansas along the Shawnee Mission Parkway and then south on Metcalf Ave. Johnson County Transit is the lead on this project with KCATA providing some technical support especially on the Missouri portions of the route. The BRT project in Wyandotte County is the State Avenue BRT. It will run from the 10th and Main transit center in downtown Kansas City, Missouri through downtown Kansas City, Kansas and on to the Village West area in Wyandotte County. KCATA is the lead on the State Avenue BRT project and conducted the Alternatives Analysis in partnership with Wyandotte County. The first phase (pre BRT) of implementation is being funded with a TIGER grant to KCATA to build 2 transit centers and up to 30 stations along the corridor
49 9 Boston Silver Line 9.1 Project Background The Boston Silver Line is a collection of four BRT routes that opened in two phases. The first phase opened in July 2002 on Washington Street between Dudley Square and Downtown Crossing. 153 The second phase opened in December 2004 with service to the Waterfront District. 154 In June 2005, the Waterfront Silver Line was extended to Logan Airport. 155 The Washington Street line is served by the routes SL4 and SL5 while the Waterfront Line is served by the SL1 and SL2. Currently, the Washington Street and Waterfront Silver Lines are unconnected. MBTA has longer term plans to connect the two lines with what they call Silver Line Phase 3. However, that project has been put on hold due to funding shortage. The Washington Street Silver Line replaced the Route 49 bus, which in turn was a temporary replacement for the Orange Line rail that was relocated from Washington Street in 1987 and placed underground. 156 Fifteen years would pass before the Silver Line came into being. This was largely due to indecision about what was the best permanent replacement for the Orange Line. Some residents wanted light rail. Others wanted a type of trolley or just buses. 157 In 1992, the FTA rejected MBTA s request for New Starts money for light rail on Washington Street because of cost ineffectiveness. 158 With federal assistance unavailable, MBTA looked to more cost effective solutions, and the idea for BRT was born. In 1996, MBTA approved plans for the BRT service that would come to be known as the Silver Line. In regards to the roles played by other agencies, MBTA reported that they coordinated closely with the City of Boston s Transportation Department and Redevelopment Authority, who both had control over the streetscape. They reported working with the state DOT as well. The Washington Street project was a complete reconstruction of the street cross section from building front to building front that included new sidewalks and street furniture. These street improvements were paid for by the state DOT. 159 For the Waterfront project, MBTA reported that the alternatives analysis included light rail, but it was ruled out early on as cost ineffective. The decision was made to go with BRT. The Waterfront Silver Line project included the construction of a one mile busway tunnel and three underground stations. 160 The construction was part of the larger Central Artery/Tunnel project, popularly known as the Big Dig, which relocated Interstate 93 into a tunnel
50 MBTA did extensive public outreach and marketing for the Waterfront Silver Line. The marketing campaign cost approximately $170,000 and included ads, billboards, and an opening day kickoff event. 162 MBTA did not do extensive outreach or marketing for the Waterfront Silver Line. This was due to the fact that there was not much employment or residential development in the Waterfront District prior to the opening of the line. There was not much transit service in that area either. The Route 4 bus was running there, but the ridership and service frequencies were both low. The Waterfront Silver Line was one piece of a larger plan by the City of Boston to bring economic development to the Waterfront District in the form of arts and entertainment and new residential development Costs The Silver Line is one of the few U.S. BRT projects not to have used federal funds. The Massachusetts Highway Department paid for the road construction, and MBTA used bond revenues to cover the rest. The capital cost paid by MBTA for Washington Street Silver Line was $27.3 million, or $12.1 million per mile. 164 The road construction cost paid by the Massachusetts Highway Department was $19.23 million. 165 The capital cost of the Waterfront Silver Line was $619 million Before and After Performance The Route 49 bus was MBTA s best performing route, but after it was replaced by the Washington Street Silver Line, ridership was 71 percent higher. Almost immediately after it opened, the Silver Line was carrying an average of 13,018 passengers per weekday compared to the 7,627 passengers per weekday carried by the Route MBTA reported that the first year s ridership on the Washington Street Silver Line was about 35 percent higher than what they had projected. 168 For the Waterfront Silver Line, the results are mixed. On a positive note, ridership increased 100 percent over the previous local bus service. However, the Waterfront District did not have much transit service prior to the Silver Line. When the Silver Line was expanded to Logan Airport, transit ridership to the airport increased 24 percent. 169 Ridership today on the Waterfront Silver Line has been trending upward, but it is still lower than the 2010 projections. According to MBTA, this is because development in the Waterfront has occurred at a slower pace than expected. 42

51 9.4 System Characteristics Running Way The Washington Street Silver Line is 2.4 miles long of which 2.2 miles are exclusive bus lanes. 170 However, general traffic is allowed to use the bus lane for right turns at intersections. Bicycles are also allowed in the bus lane, and there is adjacent on street parking. 171 The buses operate in mixed traffic for a short time at the two ends of the route. For three blocks between Herald and Berkeley Streets, the southbound buses use a contra flow bus lane. 172 To make room for the contra flow lane, the road was widened and on street parking was removed on the west side of the roadway. Plastic dividers were put into place to separate the contra flow traffic from regular traffic. The Waterfront Silver Line has a onemile transitway tunnel with three underground stations. 173 After the SL1 and SL2 leave the tunnel, they each operate on surface streets for approximately two miles Stations The Washington Street Silver Line has 11 stations. 174 The previous Route 49 had 20 bus stops. Figure 23 shows an example of a Silver Line station. Amenities include covered seating, trash receptacles, bike racks, emergency call buttons, and information kiosks. The kiosks include the station name, real time bus arrival information, system maps, and historical information about the area. The Waterfront Silver Line has three underground stations South Station, Courthouse, and World Trade Center that are built to the same quality and standards as MBTA s subway stations. 175 Figure 23: Silver Line Lennox Street Station Source: NBRTI 43

52 9.4.3 Vehicles The Washington Street Silver Line uses 60 foot articulated buses manufactured by Neoplan. The buses run on compressed natural gas (CNG), have low floors, and three right side doors. Each bus has a capacity of 79 passengers, with room for 57 seated passengers. 176 Because of the transitway tunnel on the Waterfront Silver Line, the SL 1 and SL 2 routes use dual mode (electric/diesel) articulated vehicles. These vehicles are also manufactured by Neoplan. They have capacity for 65 passengers, 47 seated Fare Collection Figure 24: Silver Line Vehicle Source: NBRTI At the surface street stations, all fares are collected on board the buses. At the three below ground stations in the Waterfront section, an off board barrier system is used. Passengers pay for their ticket at a vending machine and then proceed through a turnstile to the station platform. 178 Routes SL1 and SL2 are part of the subway fare structure and have a smart card fare of $1.70. Routes SL4 and SL5 are part of the bus fare structure and have a Charlie Card fare of $ There is a $0.45 charge to transfer from the SL 4 and SL 5 to the SL 1 and SL ITS Technologies All Silver Line vehicles are equipped with AVL. The public address system inside the vehicle makes prerecorded stop announcements, and the information is also displayed inside the vehicle on a variable message sign. 181 At the stations, kiosks are equipped with variable message signs that have real time bus arrival information. In 2006, TSP was activated at four intersections on Washington Street (Herald 44
53 Street, East Berkeley Street, Massachusetts Avenue, and Melnea Cass Boulevard). The buses request priority only when they are behind schedule Service and Operations The Silver Line operates 7 days per week from approximately 5:00 AM to 1:00 AM Monday through Saturday and 6:00 AM to midnight on Sunday. During the peaks, service frequency is under 10 minutes, and in the off peaks it varies but is often under 15 minutes Branding MBTA has branded the Silver Line as part of their rail network by giving it a color coded name designation. It is the only bus service for which MBTA conducted major marketing. Ads, billboards, and a kickoff event for opening day were a part of the marketing push. The marketing campaign cost approximately $170, Originally the Silver Line did have a logo, but it was later discontinued. The reason is because MBTA uses the T logo as their system wide brand Lessons Learned There were implementation problems with the vehicles. It took longer than expected for the buses to be delivered because at the time they were the first low floor, articulated, CNG buses to be used in the U.S. This is not likely to be an issue today as CNG low floor buses are more common. The buses underwent 18 months of testing at the FTA Altoona Bus Research and Testing Center. After the buses were put into circulation, a new problem developed in that the buses emitted a loud, low vibration upon acceleration. Numerous complaints were made, and the problem was even reported in the press. It took a year of working with the manufacturer to fix the problem Future Plans MBTA has no immediate plans for additional BRT. There had been a plan for Silver Line Phase 3 to connect the Washington Street and Waterfront lines, but that has been put on hold due to funding shortages. MBTA s future plans for BRT at this point are limited to the long term. MBTA has a project on their long term planning horizon called the Urban Ring. It calls for a circumferential network of transit around the city and includes a BRT element
54 46
55 10 Las Vegas MAX 10.1 Project Background The Las Vegas MAX BRT opened in June 2004, but its genesis dates back to 2000 when the Nevada Department of Transportation (NDOT) was completing a street overlay project on a five mile stretch of North Las Vegas Boulevard north of downtown. 188 The overlay project involved resurfacing, restriping, and reconfiguring the lanes. As a result, the breakdown lane in both directions became available as an extra travel lane. NDOT and the City of Las Vegas proposed the idea of using the new lane as a bus only lane to the Regional Transportation Commission (RTC) of Southern Nevada, which acts as both the MPO and the transit operator for the Las Vegas metropolitan area. RTC took the idea one step further by proposing an express rapid transit system that would make use of the lane. NDOT and the City of Las Vegas supported the idea, and in 2002 RTC applied for federal funding under the Federal Transit Administration s BRT Initiative. Because of the RTC s dual role as MPO and transit operator, they were able to fast track the project development of the MAX. By mid 2003, RTC completed the feasibility study for a BRT on North Las Vegas Boulevard, and on June 30, 2004, the MAX opened to the public. Throughout the project development period, RTC conducted an effective multimedia marketing campaign that included direct mailers, press releases, one on one media tours, and a carefully orchestrated unveiling of the MAX BRT vehicle. As a result, the MAX received extensive coverage in the local news media Costs The total capital cost for the MAX was $20.3 million, or $2.6 million per mile. 189 Federal dollars covered 82 percent and came from a variety of sources including FTA Section 5309 and 5307, and CMAQ funds Before and After Performance The MAX supplements the Route 113 on North Las Vegas Boulevard but has fewer stops. 191 In terms of performance, the MAX has shorter travel times and faster speeds than the Route 113. Travel times in the peak directions are between 38 and 43 percent shorter, and speeds are between 36 and 66 percent faster. 192 Two factors that contribute to the MAX outperforming the Route 113 are the wider spacing of MAX stations and the shorter dwell times associated with multiple door entry and off board fare collection. 193 After the MAX s opening in July 2004, there was steady rider diversion from the Route

56 to MAX. Between July and December 2004, monthly boardings on the Route 113 declined 22 percent from 189,422 to 147,063. Over the same time period, monthly boardings on the MAX increased 198 percent from 44,431 to 132, System Characteristics Running Way The MAX operates along a 7.5 mile corridor, of which 4.5 miles are dedicated bus lanes. 195 The dedicated lanes are curb side and are shared with right turn traffic. The running way also includes a queue jump at the intersection of Tonopah Avenue and Las Vegas Boulevard near the southern end of the route. At this intersection, all conflicting vehicular and pedestrian signals are held at red while the MAX vehicle clears the intersection. The signal to proceed is conveyed to the MAX operator via a special signal display that uses a vertical white bar indication Stations The MAX consists of 22 stations (11 northbound, 11 southbound) spaced approximately 1 mile apart. 197 Each station is 220 feet long with a 17 inch raised curb for level boarding. Furthermore, the edge of the platform is outfitted with a tactile surface to assist visually impaired passengers. Ticket vending machines are provided at all stations to facilitate off board fare collection. Additional amenities include vending machines, shelters, and lighting. Figure 25: Las Vegas MAX Craig Rd. Station Source: Bus Rapid Transit Around the World, photo by Digital Joe 48


57 Vehicles The buses originally utilized for the MAX were 61 foot Civis buses manufactured by the French company Irisbus. They are articulated with four right side doors, two at the front and two at the rear. They are highly stylized to give a rail like appearance and can carry 120 passengers. It was the only bus in U.S. operation where the driver sat in a center cab configuration. 198 Figure 26: Las Vegas MAX Civis Vehicle Source: NBRTI In 2008, RTC added the 62 foot Wright Streetcar, manufactured by Wrightbus, a Northern Ireland company. It has capacity for 104 passengers (44 seated, 60 standing). Like the Civis, the Wright Streetcar is articulated, albeit with three right side doors instead of four. It has a fully enclosed driver cabin. 199 Figure 27: Las Vegas MAX Wright Streetcar Source: Las Vegas ACE Downtown Connector, photo by So Cal Metro 49
58 Fare Collection The MAX uses proof of payment off board fare collection. 200 The base adult single cash fare is $2.00. Passes are purchased and validated at the station ticket vending machines. 201 There is no charge to transfer from local bus service to the MAX ITS Technologies TSP is provided at 11 intersections on North Las Vegas Boulevard. Although both the MAX and the Route 113 operate on this street, only the MAX vehicles are equipped with TSP emitters. The only TSP functionality used is extension of the green cycle so that the MAX can get through the intersection. The decision was made by the City of North Las Vegas and RTC not to include truncating the red portion of the cycle so as not to impact cross street traffic. The MAX vehicles use infrared emitters to send the TSP request as they approach the intersection. The requests are sent automatically, and there are no conditional restrictions on the granting of requests. Another ITS technology that was included on the original Civis vehicles was an optical guidance system (OGS). It was to be used for precision docking at the stations by reading the pavement markings. The OGS was discontinued shortly after the MAX began service because of the extensive maintenance requirements necessary to keep the pavement markings clean and readable in the desert climate Service and Operations The MAX operates seven days a week from 5:00 AM to 7:00 PM. By itself, it operates on 30 minute headways. However because it operates in conjunction with the Route 113, the combined service frequency in the corridor is between 12 and 18 minutes. 203 To maintain headways, the MAX bypasses stations where stops are not requested and no passengers are waiting Branding The main branding feature of the MAX is its sleek, state of the art vehicles. As stated in the Project Background section, RTC conducted an effective multimedia marketing campaign throughout the development of the MAX. This included a carefully orchestrated unveiling of the MAX BRT vehicle. The original MAX vehicles featured a high gloss blue, white, and silver exterior. The color scheme of the BRT vehicles has since changed to gold, blue, and white. 50
59 10.5 Lessons Learned There were multiple lessons learned from the implementation of the MAX. 205 Some of them were due to the fact that the MAX was the first deployment of a fully stylized BRT vehicle in the U.S. Going with a French company to design and manufacture the vehicles presented challenges because of the distance involved and language barriers. RTC estimates that five times as much inspection and monitoring was needed for the procurement of the Civis vehicles in order to ensure that Federal Motor Vehicle Safety Standards and USDOT standards were met. RTC did several things to overcome the challenges of working with an overseas vendor. This included having an in plant inspector in France to oversee the design and manufacture of the vehicles and sending maintenance technicians to France for several weeks of maintenance and air conditioning training. In spite of the extra effort that was required, RTC reported being very happy with the procurement process. In fact, they went with another overseas company, Wrightbus, to procure 50 new BRT vehicles. However, it needs to be noted that the RTC did have to apply for a waiver to FTA s Buy America requirements. Another lesson learned from working with an overseas vendor was that there is considerable lag time between when spare parts are requested and when they arrive due to the distance involved. This lag time delayed the opening of the MAX by four weeks. RTC learned quickly that special attention needs to be paid to the lead time required. Also, they learned to include a liquidated damages clause in their future procurement contracts. Such a clause would place more responsibility on the manufacturer to meet the requirements for spare parts delivery. The optical guidance system (OGS) that was to facilitate precision docking was a technical lesson learned. The OGS is a form of vehicle assist and automation (VAA) technology. Both then and now, VAA is still largely an experimental technology. It has not seen much use in bus revenue service. The OGS had been used with success by Irisbus in Rouen, France. However, the harsh desert environment of Las Vegas proved to be problematic for its application. Although the OGS performed well in acceptance testing, problems occurred shortly after it began to be used in revenue service. The OGS uses a camera that reads the pavement marking to determine the bus s position. It then sends steering corrections via a steering motor activator to properly align the bus. However, the operation of the OGS is predicated on being able to read the pavement markers. The harsh desert environment results in constant buildup of oil and dirt on the markers to the extent that the OGS could not see them. 51
60 Because the vehicle was custom designed, a major lesson learned was that it is very important to identify the conduits for routing the APC and AVL systems before the vehicle is completed. Because the Civis vehicle had more doors than usual and the doors were wider than normal, the APC had to be custom installed. Also, there were some challenges getting the APC to work properly. The APC sensor had to be placed above the door instead of on the side Future Plans Just recently in September 2011, the RTC of Southern Nevada launched two new BRT routes that connect downtown Las Vegas with the south eastern valley and the City of Henderson. They are the Boulder Highway Express and the Henderson and Downtown Express. The two routes share a common trunk segment on Boulder Highway, but the Henderson and Downtown Express travels further south. The Boulder Highway Express has service every 20 minutes, and the Henderson and Downtown Express has service every 30 minutes. They operate on dedicated curbside bus lanes for a portion of the route and include aesthetically designed stations with level platform boarding and ticket vending machines. In February 2011, the RTC began construction on the Sahara Express BRT project, which will consist of a 12 mile corridor from Hualapai Way to Boulder Highway. Sahara Avenue serves the heaviest employment centers in the Las Vegas Valley. It is expected to be completed by December When it opens, the Sahara Express BRT will add to the region s network of BRT by connecting to two other BRT routes, the Las Vegas Monorail and the Deuce premium double deck bus service on the Las Vegas Strip
61 Appendix A: BRT System Characteristics 53
62 54
63 Cleveland Eugene Los Angeles Los Angeles Oakland Kansas City Boston Las Vegas Healthline EmX (Franklin Corridor) Metro Rapid (All Routes) Orange Line San Pablo MAX (Main St.) Silver Line Washington Street Waterfront: Airport Waterfront: Design Center MAX Running Way Information Running-Way Description Bus Lane Bus Lane Mixed Traffic Busway Mixed Traffic Bus Lane & Mixed Traffic Bus Lane & Mixed Traffic Tunnel & Mixed Traffic Tunnel & Mixed Traffic Number of Routes Total System Miles Exclusive Bus Lanes Queue Jumpers Running Way Marking Type Signage, Rumble Strips Raised delineators, pavement coloring, None None Pavement markings, signage Bus Lane & Mixed Traffic Signage, striping Signage Signage, Striping Lateral Guidance Type Mechanical Plastic Striping None None None None None None None Optical, no longer in use Fare Collection Cleveland Eugene Los Angeles Los Angeles Oakland Kansas City Boston Las Vegas EmX Metro Rapid Silver Line Waterfront: Waterfront: Healthline Orange Line San Pablo MAX (Main St.) MAX (Franklin Corridor) (All Routes) Washington Street Airport Design Center Fare Collection Process Proof of payment Proof of payment Pay on-board Proof-of-payment Pay on-board Pay on-board Pay on-board Fare Media/Payment Options Cash, paper passes Tickets, standard paper passes Cash, paper, smart card Cash, paper transfers, magnetic stripe, smart card Barrier at 3 underground stations; pay onboard elsewhere cash, paper ticket, smart card Barrier at 3 underground stations; pay onboard elsewhere cash, paper ticket, smart card Proof of payment Magnetic Strip Fare Structure Flat Flat Flat Flat Flat Flat Flat Flat Flat TVMs at 3 TVMs at 3 Equipment at Stations Ticket Vending underground underground Ticket Vending machines (TVM) stations and 5 stations and 5 Machines (TVMs) airport terminals airport terminals Equipment for On-Board Validation Electronic farebox Electronic farebox Electronic farebox Electronic farebox, GPS Electronic farebox, GPS Hand-held validators
64 Cleveland Eugene Los Angeles Los Angeles Oakland Kansas City Boston Las Vegas EmX Metro Rapid Silver Line Waterfront: Waterfront: Healthline Orange Line San Pablo MAX (Main St.) MAX (Franklin Corridor) (All Routes) Washington Street Airport Design Center Station Information On-Street Stations No Shelter Simple Enhanced Off-Street Station Amenities Telephone X Restroom Vending Seating X X X Trash Container X X X X Temperature Control Public Art X X Public Address Emergency Telephone X X Security Monitoring X Platform Height and Length Curb Design Near level Raised Curb Standard Curb Standard Curb Standard Curb Standard Curb Standard Curb Standard Curb Raised curb Maximum Vehicles Accommodated Passing Capability No No 1 40' + I 60' ' (200) 1 1 Passing lane at each in-line station Bus pullouts Park-and-Ride Lots None 7 lots 0 1 above ground, 3 underground 226 parking spaces at South Station; street & private lots everywhere 1 above ground, 3 underground 227 parking spaces at South Station; street & private lots everywhere 1 Bus pullouts
65 Cleveland Eugene Los Angeles Los Angeles Oakland Kansas City Boston Las Vegas Healthline EmX (Franklin Corridor) Metro Rapid (All Routes) Orange Line San Pablo MAX (Main St.) Silver Line Washington Street Waterfront: Airport Waterfront: Design Center MAX Vehicle Information Vehicle Configuration Stylized articulated Stylized articulated Stylized standard and articulated Stylized articulated Stylized standard Stylized standard Stylized articulated Articulated Articulated Stylized Articulated Vehicle Length 60' 60' 40'/45'/60' 60' 40.5' 42' 60' 60' 60' 62' Manufacturer and Model New Flyer New Flyer NABI and New Flyer NABI 60' BRT-01, 2005 Van Hool A330 Gillig NEOPLAN USA Neoplan Neoplan Wright Streetcar Floor Height Low Low Low (15") Low (15") Low floor Low AN 460 LF Low Low Low Description of Livery/Image Interior Features Silver Wide aisles and doors Distinctive green livery Wide aisles and doors Red/silver two-tone paint scheme; Metro Silver metallic twotone paint scheme & USSC Aries cloth seats Red, white and green livery Max logo, unique livery and image, Modern-looking interior, increased aisle width, increase hip-to-knee room, wider doors and windows Step Low Silver Silver Gold Silver band similar with T logo, similar to rail vehicle livery Luggage Racks Aisle Seating Right-Side Doors 3 3 2/ Left-Side Doors Sleek, modern lines with large windows Bus Capacity (Seated) to Bus Capacity (Seated and Standing) to Wheelchair Loading Lift Ramp (at front door Ramp (at front door only) only) Ramp Front door ramp Ramp Ramp Ramp Wheelchair Securement Telescoping ARM Telescoping ARM Rear-facing position ICE Tie-down Tie-down Propulsion System Hybrid Hybrid ICE Cummins-Westport L- Gas ICE ICE Dual-mode diesel and electric traction Dual-mode diesel and electric traction Fuel Diesel Diesel CNG CNG ULSD ULSD CNG ULSD ULSD Diesel electric hybrid
66 Intelligent Transportation Systems Signal Timing/Phasing Optimization Station and Lane access Control Transit Signal Priority (Number of Intersections Cleveland Eugene Los Angeles Los Angeles Oakland Kansas City Boston Las Vegas EmX Metro Rapid Silver Line Waterfront: Waterfront: Healthline Orange Line San Pablo MAX (Main St.) MAX (Franklin Corridor) (All Routes) Washington Street Airport Design Center X X X X Precision Docking Yes Manual with curb Computer Aided Dispatch (CAD) Automatic Vehicle Location (AVL) Automated Passenger Counters (APCs) Vehicle Component Monitoring System Passenger Information At stations Vehicle, Web Passenger Information Systems X X X X X X X GPS GPS GPS, Loop Detectors GPS, Loop Detectors GPS GPS GPS GPS GPS GPS X X X X X X Nextbus VMS at stations, Telephone, Internet Nextbus VMS Real-time at all stations, trip planning AVM X X VMS at stations and in-vehicle LED signs with schedule info at stations; info at stations; vehicles have public address and VMS with stop announcements LED signs with schedule info at stations; info at stations; vehicles have public address and VMS with stop announcements Pre-trip X X X X X En-route Station/Terminal X (VMS) X (Next-bus VMS) X (Next-bus VMS) X X (Next-bus info) X X X In-Vehicle X X X X X X X Station, telephone, internet, on-vehicle, electronic displays
67 Cleveland Eugene Los Angeles Los Angeles Oakland Kansas City Boston Las Vegas EmX Metro Rapid Silver Line Waterfront: Waterfront: Healthline Orange Line San Pablo MAX (Main St.) MAX (Franklin Corridor) (All Routes) Washington Street Airport Design Center Safety and Security On-board Silent Alarms X X X On-board Voice Monitoring X X X X On-board Video Monitoring X X X X Measured Indicator of safety (e.g. number of accidents) Survey of Customer Perception of Safety or Security exists? (yes/no) avg=4.83 accidents per 100,000 miles avg=1.45 accidents per 100,000 miles 75% of customers rated personal safety on vehicles as good or very good. Accidents down 40% for MAX 5.86 accidents and 0.76 injuries per 100,000 vehicle miles; lower than systemwide 78% rated safety above average or excellent 5.86 accidents and 0.76 injuries per 100,000 vehicle miles; lower than systemwide 78% rated safety above average or excellent Accidents down 40% for MAX Cleveland Eugene Los Angeles Los Angeles Oakland Kansas City Boston Las Vegas EmX Metro Rapid Silver Line Waterfront: Waterfront: Healthline Orange Line San Pablo MAX (Main St.) MAX (Franklin Corridor) (All Routes) Washington Street Airport Design Center BRT Service Plans Route Structure Replaced Local Route Replaced Local Route Overlay on Local Route New Service Overlay on Local Route Replaced Local Route Replaced Local Route New Service New Service Overlay on Local Route Route Type All Stop All Stop Limited All Stop All Stop Limited Stop All Stop All Stop All Stop Limited Stop Span of Service All Day All Day All Day All Day All Day All Day All Day All Day All Day All Day Frequency of Service in Peak Hours (Headway in Minutes) Frequency of Service Off-Peak (Headway in Minutes) Average Station Spacing Distance (miles) /30 15/20 15/ /
68 Cleveland Eugene Los Angeles Los Angeles Oakland Kansas City Boston Las Vegas EmX Metro Rapid Silver Line Waterfront: Waterfront: Healthline Orange Line San Pablo MAX (Main St.) MAX (Franklin Corridor) (All Routes) Washington Street Airport Design Center Performance Maximum End-to-End Travel Time Uncongested End-to-End Travel Time (min) Average Speed (mph) Average Uncongested Speed (mph) % Travel Time Reduction Before vs. After BRT % Travel Time Reduction Compared to Local Bus n/a n/a to 16 mph (avg for all routes) 16 to 22 mph (avg for all routes) 20 mph mph % % 8 Overall average 25% faster than local bus routes 21% 20% 9% 25% Cleveland Eugene Los Angeles Los Angeles Oakland Kansas City Boston Las Vegas Healthline EmX Metro Rapid Silver Line Waterfront: Waterfront: Orange Line San Pablo MAX (Main St.) (Franklin Corridor) (All Routes) Washington Street Airport Design Center MAX Total Capital Cost (millions) $197 $25.0 $304.6 $3.2 $21.0 $27.3 $618.0 $20.3 Running Way $19.5 (includes the stations) $180.0 $10.9 $572.2 Stations $50,000 per station $40.0 $2.6 Included in running way $5.4 Vehicles $5.5 $16.0 $13.1 $42.2 $12.3 ITS $100, $10.0 $0.70 $0.5 Fare Collection $6.0 $2.1 Other $9.6 Sources: TCRP Report 118: Bus Rapid Transit Practitioner's Guide (2010) FTA Characteristics of Bus Rapid Transit for Decision-Making (2009) Updates from individual transit agencies.
69 Appendix B: Lessons Learned 61
70 62
71 BRT System Cleveland HealthLine Eugene EmX Los Angeles Metro Rapid Lessons Learned Summary 1. Encroachment Issues with unauthorized vehicles operating in and across the BRT s right of way were resolved through enforcement, installation of flexible delineators to prohibit restricted turns and revised the Bus Only signs to better indicate the exclusive lane. 2. Traffic Signal Timing Some initial problems with the traffic signal timing were resolved with traffic engineers from the City of Cleveland. 3. Fare Collection Some customer complaints about the operation of the fare vending machines not being intuitive. 1. Local Ordinances Consider any city ordinances that may affect the project. In Eugene, a public vote must be held before any tree older than 50 years is removed from the right of way. 2. Communication with Stakeholders LTD found that it was much easier to implement the system when all stakeholders are kept informed and interested. 3. Champion A local politician willing to back the project as a champion. would have made the planning process smoother. 4. Visualization During the planning process, LTD made use of visualization techniques to give stakeholders and interested parties the ability to see a final project and keep them interested. 5. Success Factors: a. Higher visibility of the EmX because of its branding, b. Ease of understanding the service because there is no need to consult a schedule, c. Improved reliability that came with having a dedicated bus lane, reduced travel time, and more frequent service. 1. Bus Operators Familiarity Metro reported that it took the bus operators a while to get used to a completely new type of operational model with wider spacing between stops and the inclusion of transit signal priority. 2. Transit Signal Priority The Metro Rapid was the first BRT system in the U.S. to use TSP, and Metro quickly learned that TSP works better with far side stop locations. 3. Performance thresholds. Metro was highly selective on the two lines that were chosen for the demonstration program. Because the Metro Rapid was so successful, other areas of Los Angeles wanted Metro Rapid for themselves as well. Because of the pressure to be equitable, Metro Rapid lines were started in some areas that in retrospect were not the best candidates. Since then, there has been cancellation of several underperforming Metro Rapid lines. 63
72 BRT System Los Angeles Orange Line San Pablo Rapid Kansas City MAX Lessons Learned Summary 1. Drivers Familiarity During initial months of operation, the Orange Line experienced a series of collisions and near miss incidents, primarily due to motorists on cross streets running red lights at busway intersections. These were addressed by reducing running speeds from 25 mph to 10 mph at all intersections. In addition, enhanced signage and warning signals were added and photo enforcement cameras were installed at many of the Orange Line s intersections to deter red light running. Since then, the Orange Line has maintained a lower accident rate than the Metro system as a whole. 2. Bus Bunching Because of the high frequency of service and unconditional signal priority, bus bunching is an issue. Metro advises its Orange Line drivers to leave the terminal exactly at the scheduled depart time; maintain a safe speed, but never exceed the posted speed limit; if another bus is encountered, fall back or slow down until the other bus is no longer visible; and if directed to do so by the Bus Operations Control Center (BOCC), reduce speed. 3. Rubberized Asphalt Pavement. Used on the segments of the busway near the residential sections, The rubberized asphalt has since been replaced with Super Pave asphalt because significant cracking and rutting occurred and test results showed that the noise reductions were negligible. 1. Real Time Information AC Transit commented that installation of the real time bus arrival signs should have been addressed earlier. AC Transit had to dig trenches to the nearest utility location and install electric meters on the shelters. This involved a lengthy permitting process. Consequently, real time information was not available at the stops until a year after the service began. 2. Marketing AC Transit announced and provided information about the new service through TV commercials, door hangers with free tickets, and partnering with local businesses. 1. Branding The MAX branding has been so successful that many riders do not even consider it a bus. Mr. Huffer said during the phone interview, I have people tell me all the time that they don t ride a bus to work. They ride MAX. 2. Real Time Information Providing real time information at the stations along the route. 3. Stations and Operating Times KCATA noted that in hind sight, they would have placed more emphasis on far side stations, reduced the number of stations to maintain spacing, and requested additional hours for the peak period bus lanes. 4. Signalization and Pedestrian Facilities KCATA also stated that it would have liked TSP at more intersections, would have included more sidewalk improvements, and would have placed more emphasis on pavement improvements to enhance the ride quality. 64
73 BRT System Boston Silverline Las Vegas MAX Lessons Learned Summary 1. Vehicles Longer than expected procurement period because at the time they were the first low floor, articulated, CNG buses to be used in the U.S. This is not likely to be an issue today as CNG low floor buses are more common. The buses underwent 18 months of testing at the FTA Altoona Bus Research and Testing Center. After the buses were put into circulation, a new problem developed in that the buses emitted a loud, low vibration upon acceleration. Numerous complaints were made, and the problem was even reported in the press. It took a year of working with the manufacturer to fix the problem. 1. RTC estimates that five times as much inspection and monitoring was needed for the procurement of the French Civis vehicles in order to ensure that Federal Motor Vehicle Safety Standards and USDOT standards were met. RTC had an inplant inspector in France to oversee the design and manufacture of the vehicles and sent maintenance technicians to France for several weeks of maintenance and air conditioning training. 2. When working with an overseas vendor special attention needs to be paid to the lag time between when spare parts are requested and when they arrive. Not doing so caused a delay in the opening of the MAX by four weeks. 3. Because the vehicle was custom designed, a major lesson learned was that it is very important to identify the conduits for routing the APC and AVL systems before the vehicle is completed. 65
74 66
75 Appendix C: BRT Route Maps (Note: not all transit agencies had high resolution maps available for the report) 67
76 68


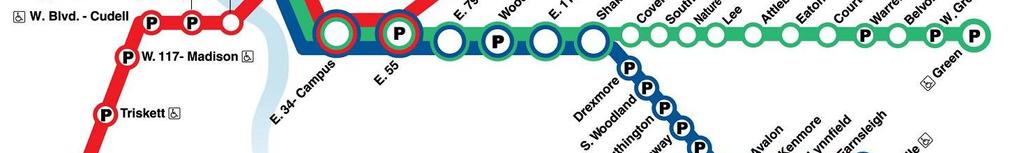
77 Cleveland RTA Rapid System
78


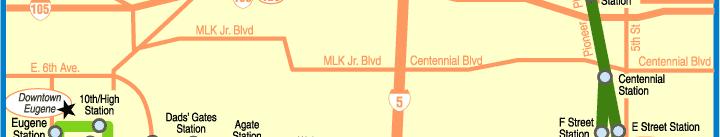
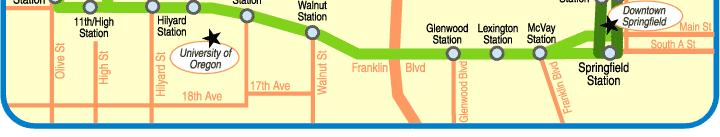
79 Lane Transit District EmX
Brian Pessaro, AICP National Bus Rapid Transit Institute
 Brian Pessaro, AICP National Bus Rapid Transit Institute Source: WCVB TV, Boston BRT is an enhanced bus system that operates on bus lanes or other transitways in order to combine the flexibility of buses
5. OPPORTUNITIES AND NEXT STEPS
 5. OPPORTUNITIES AND NEXT STEPS When the METRO Green Line LRT begins operating in mid-2014, a strong emphasis will be placed on providing frequent connecting bus service with Green Line trains. Bus hours
EUGENE-SPRINGFIELD, OREGON EAST WEST PILOT BRT LANE TRANSIT DISTRICT
 EUGENE-SPRINGFIELD, OREGON EAST WEST PILOT BRT LANE TRANSIT DISTRICT (BRIEF) Table of Contents EUGENE-SPRINGFIELD, OREGON (USA)... 1 COUNTY CONTEXT AND SYSTEM DESCRIPTION... 1 SYSTEM OVERVIEW... 1 PLANNING
Service Quality: Higher Ridership: Very Affordable: Image:
 Over the past decade, much attention has been placed on the development of Bus Rapid Transit (BRT) systems. These systems provide rail-like service, but with buses, and are typically less expensive to
BROWARD BOULEVARD CORRIDOR TRANSIT STUDY
 BROWARD BOULEVARD CORRIDOR TRANSIT STUDY FM # 42802411201 EXECUTIVE SUMMARY July 2012 GOBROWARD Broward Boulevard Corridor Transit Study FM # 42802411201 Executive Summary Prepared For: Ms. Khalilah Ffrench,
FREQUENTLY ASKED QUESTIONS
 FREQUENTLY ASKED QUESTIONS 2018 What is the More MARTA Atlanta program? The More MARTA Atlanta program is a collaborative partnership between MARTA and the City of Atlanta to develop and implement a program
6/6/2018. June 7, Item #1 CITIZENS PARTICIPATION
 June 7, 2018 Item #1 CITIZENS PARTICIPATION 1 Item #2 APPROVAL OF MINUTES Item #3 TRAC GOALS, FRAMEWORK & AGENDA REVIEW 2 COMMITTEE GOALS Learn about Southern Nevada s mobility challenges, new developments
Bus Rapid Transit. Jennifer Flynn and Cheryl Thole Senior Research Associates Commuter Choice Workshop January 2012 Tampa, FL
 Bus Rapid Transit Jennifer Flynn and Cheryl Thole Senior Research Associates Commuter Choice Workshop January 2012 Tampa, FL What is Bus Rapid Transit? BRT is an enhanced bus system that operates on bus
Preliminary Definition of Alternatives. 3.0 Preliminary Definition of Alternatives
 3.0 What preliminary alternatives are being evaluated? The alternatives for the East San Fernando Valley Transit Corridor project that were considered for screening include the No Build Alternative, Transportation
What IS BRT, Really? Not BRT and RNY
 What IS BRT, Really? 2007 Winter TexITE Meeting Presented by Jeff Arndt, TTI Not BRT and RNY 1 What is Bus Rapid Transit? A flexible, rubber-tired from of rapid transit that combines stations, vehicles,
TRANSIT IDEA STRATEGIC INITIATIVE On BUS RAPID TRANSIT (BRT)
") TRANSIT IDEA STRATEGIC INITIATIVE On BUS RAPID TRANSIT (BRT) The panel for the Transit IDEA program has endorsed a Bus Rapid Transit (BRT) strategic initiative and focus area as part of the Transit IDEA
TRANSIT IDEA STRATEGIC INITIATIVE On BUS RAPID TRANSIT (BRT) The panel for the Transit IDEA program has endorsed a Bus Rapid Transit (BRT) strategic initiative and focus area as part of the Transit IDEA
I-26 Fixed Guideway Alternatives Analysis
 I-26 Fixed Guideway Alternatives Analysis Public Meetings: North Charleston, January 25, 2016 Charleston: January 26, 2016 Summerville: January 28, 2016 Agenda I. Project Update II. III. IV. Screen Two
6/11/2018. June 7, Item #1 CITIZENS PARTICIPATION
 June 7, 2018 Item #1 CITIZENS PARTICIPATION 1 Item #2 APPROVAL OF MINUTES Item #3 TRAC GOALS, FRAMEWORK & AGENDA REVIEW 2 COMMITTEE GOALS Learn about Southern Nevada s mobility challenges, new developments
Waco Rapid Transit Corridor (RTC) Feasibility Study
 Feasibility Study") Waco Rapid Transit Corridor (RTC) Feasibility Study Chris Evilia, Director of Waco Metropolitan Planning Organization Allen Hunter, General Manager Waco Transit System Jimi Mitchell, Project Manager AECOM
Waco Rapid Transit Corridor (RTC) Feasibility Study Chris Evilia, Director of Waco Metropolitan Planning Organization Allen Hunter, General Manager Waco Transit System Jimi Mitchell, Project Manager AECOM
Tempe Streetcar. March 2, 2016
 Tempe Streetcar March 2, 2016 Tempe Profile 40 sq. miles, highest density in state University Town, center of region Imposed growth boundaries (density increase) Mixed use growth/intensifying land use
CEDAR AVENUE TRANSITWAY Implementation Plan Update
 CEDAR AVENUE TRANSITWAY Implementation Plan Update EECUTIVE SUMMARY DECEMBER 2015 Executive Summary In 2013, the Twin Cities metropolitan area s first bus rapid transit (BRT) line, the METRO Red Line,
Troost Corridor Transit Study
 Troost Corridor Transit Study May 23, 2007 Kansas City Area Transportation Authority Agenda Welcome Troost Corridor Planning Study Public participation What is MAX? Survey of Troost Riders Proposed Transit
Click to edit Master title style
 Nelson/Nygaard Consulting Associates SERVICE IMPROVEMENT STRATEGIES September 22, 2015 1 PROJECT OVERVIEW & WORK TO DATE 1. Extensive stakeholder involvement Throughout 2. System and market assessment
Greater Cleveland Regional Transit Authority. Joe Calabrese CEO/General Manager
 Greater Cleveland Regional Transit Authority Joe Calabrese CEO/General Manager Greater Cleveland RTA Overview Service Area Population of 1.5 million Customers Served 200,000 on a typical weekday 1.6 million
CTfastrak Expansion. Stakeholder Meeting #4 Manchester Town Hall June 3, 2016
 CTfastrak Expansion Stakeholder Meeting #4 Manchester Town Hall June 3, 2016 Today s Agenda Phase I Update 2016 Service Plan Implementation Schedule & Cost Update Phase II Services Timeline Market Analysis
Northeast Corridor Alternatives Analysis. Public Involvement Round 2 Input on Alternatives for Further Study
 Northeast Corridor Alternatives Analysis Public Involvement Round 2 Input on Alternatives for Further Study Feb. 7-9, 2012 Agenda Review project background Progress summary Recommended alternatives for
COMMUNITY REPORT FISCAL YEAR We are making progress, are you on board? GOLD COAST TRANSIT DISTRICT
 FISCAL YEAR 178 GOLD COAST TRANSIT DISTRICT COMMUNITY REPORT We are making progress, are you on board? OJAI OXNARD PORT HUENEME VENTURA COUNTY OF VENTURA GENERAL MANAGER S MESSAGE STEVEN P. BROWN DEAR
Bus Rapid Transit: Basic Design for Non-Transit Planners
 Bus Rapid Transit: Basic Design for Non-Transit Planners Paul Bignardi, AICP - Principal Planner San Francisco Municipal Transportation Agency Graham Carey, PE Principal careybrt Consulting Peter Gabancho,
US 29 Bus Rapid Transit Planning Board Briefing. February 16, 2017
 US 29 Bus Rapid Transit Planning Board Briefing February 16, 2017 Project Goals Improve the quality of transit service Improve mobility opportunities and choices Enhance quality of life Support master
REPORT CARD FOR CALIFORNIA S INFRASTRUCTURE WHAT YOU SHOULD KNOW ABOUT CALIFORNIA S TRANSIT FACILITIES
 TRANSIT GRADE: C- WHAT YOU SHOULD KNOW ABOUT TRANSIT FACILITIES California needs robust, flexible and reliable transit systems to reduce peak congestion on our highways, provide options for citizens who
Public Meeting. City of Chicago Department of Transportation & Department of Housing and Economic Development
 Public Meeting City of Chicago Department of Transportation & Department of Housing and Economic Development Funded by Regional Transportation Authority September 12, 2011 In partnership with Presentation
Independence Institute Denver West Parkway, Suite 185 Golden, Colorado i2i.org/cad.aspx BRT = BTR
 Independence Institute 14142 Denver West Parkway, Suite 185 Golden, Colorado 80401 303-279-6536 i2i.org/cad.aspx BRT = BTR Bus-Rapid Transit Is Better Than Rail: The Smart Alternative to Light Rail Joseph
METRO Orange Line BRT American Boulevard Station Options
 METRO Orange Line BRT American Boulevard Station Options Bloomington City Council Work Session November 18, 2013 Christina Morrison BRT/Small Starts Project Office Coordinating Planning and Design AMERICAN
Madison BRT Transit Corridor Study Proposed BRT Operations Plans
 Madison BRT Transit Corridor Study Proposed BRT Operations Plans This paper presents a description of the proposed BRT operations plan for use in the Madison BRT Transit Corridor Study. The objective is
Arterial Bus Rapid Transit. System Policy Oversight Committee April 7, 2014
 Arterial Bus Rapid Transit System Policy Oversight Committee April 7, 2014 1 Meeting Agenda Welcome and Introductions A Line - Project Status Shelter and Pylon Development Arterial BRT Branding Update
Kendall Drive Premium Transit PD&E Study Project Kick-Off Meeting SR 94/Kendall Drive/SW 88 Street Project Development and Environment (PD&E) Study
 Study") Florida Department of Transportation District Six Kendall Drive Premium Transit PD&E Study Project Kick-Off Meeting SR 94/Kendall Drive/SW 88 Street Project Development and Environment (PD&E) Study What
Florida Department of Transportation District Six Kendall Drive Premium Transit PD&E Study Project Kick-Off Meeting SR 94/Kendall Drive/SW 88 Street Project Development and Environment (PD&E) Study What
Stakeholders Advisory Working Group Traffic and Transit Group Meeting #4, October 10, 2007
 Contact Us FAQs Search + HOME + ABOUT THE STUDY + ALTERNATIVES + PUBLIC INVOLVEMENT + WORKING GROUPS + PRESS RELEASES + LIBRARY Stakeholders Advisory Working Group Traffic and Transit Group Meeting #4,
Vehicle Assist and. Bus Revenue Service
 Vehicle Assist and Automation Technologies in Bus Revenue Service Brian Pessaro, AICP National Bus Rapid Transit Institute t University of South Florida What is Vehicle Assist and Automation? Vehicle Assist
Community Outreach Meetings
 Community Outreach Meetings BCT At A Glance 410 square miles service area More than 41.5 million annual trips 327 fixed-route buses 44 bus routes 78 Community Buses in 19 Municipalities BCT At A Glance
East San Fernando Valley Transit Corridor. TAC Briefing December 4, 2013
 East San Fernando Valley Transit Corridor TAC Briefing December 4, 2013 Overview Measure R Project Long Range Transportation Plan Reserves $170.1 Million 2018 Revenue Operations Date Coordination with
WAKE TRANSIT PLAN Summer 2018
 WAKE TRANSIT PLAN Summer 2018 Planning for growth WAKE COUNTY s population already exceeds ONE MILLION and grows by more than 60 people a day. That s 23,000 people a year or basically another Morrisville.
Develop ground transportation improvements to make the Airport a multi-modal regional
 Project Overview TRANSPORTATION IMPROVEMENTS WHAT ARE THE PROJECT GOALS? Transportation transportation hub. Develop ground transportation improvements to make the Airport a multi-modal regional Land Use
Draft Results and Open House
 Waco Rapid Transit Corridor (RTC) Feasibility Study Draft Results and Open House Chris Evilia, Director of Waco Metropolitan Planning Organization Allen Hunter, General Manager Waco Transit System Jimi
Analysis of Top BUS RAPID TRANSIT. Projects in North America SPONSORED BY APRIL 2007 METRO MAGAZINE 27
 Analysis of Top BUS RAPID TRANSIT Projects in North America SPONSORED BY APRIL 2007 METRO MAGAZINE 27 BRT Projects Continue tothrive This year s compilation of METRO s BRT 25 survey showcases 35 projects
Greater Cleveland Regional Transit Authority. Joe Calabrese - General Manager
 Greater Cleveland Regional Transit Authority Joe Calabrese - General Manager RTA Ridership by Mode! 500 Buses - 75 %! 60 Heavy Rail Vehicles - 10%! 24 RTV s (BRT) - 8%! 48 Light Rail Vehicles - 6%! Paratransit
FINAL. Sound Transit Long-Range Plan Update. Issue Paper S.1: Tacoma Link Integration with Central Link. Prepared for: Sound Transit
 Sound Transit Long-Range Plan Update Issue Paper S.1: Tacoma Link Integration with Central Link Prepared for: Sound Transit Prepared by: Quade & Douglas, Inc. FINAL March 2005 Foreword This issue paper
Table 8-1: Service Frequencies for All Short-List Alternatives by Day of Week and Time of Day Frequency Day of Week Time of Day Time Period
 8. Operating Plans The following Section presents the operating plans for the Short-List Alternatives. The modern streetcar operating plans are presented for Alternatives 2 and 3, followed by bus rapid
DRAFT Subject to modifications
 TREASURE COAST REGIONAL PLANNING COUNCIL M E M O R A N D U M DRAFT To: Council Members AGENDA ITEM 7A From: Date: Subject: Staff September 17, 2010 Council Meeting High Speed Rail Update Introduction The
Leadership NC. November 8, 2018
 v Leadership NC November 8, 2018 Planning for our region s growth The Triangle is one of the fastestgrowing regions in the nation. More than 2 million people are already part of the equation, and the
Draft Results and Recommendations
 Waco Rapid Transit Corridor (RTC) Feasibility Study Draft Results and Recommendations Chris Evilia, Director of Waco Metropolitan Planning Organization Allen Hunter, General Manager Waco Transit System
Snelling Bus Rapid Transit. May 13, 2013 Technical Advisory Committee Meeting #1
 Snelling Bus Rapid Transit May 13, 2013 Technical Advisory Committee Meeting #1 1 Today s meeting TAC Introductions Project Overview Arterial BRT Concept Background Snelling Corridor Plan, Funding & Schedule
SERVICE DESIGN GUIDELINES
 VTA TRANSIT SUSTAINABILITY POLICY: APPENDIX A SERVICE DESIGN GUIDELINES Adopted February 2007 COMMUNITYBUS LOCALBUS EXPRESSBUS BUSRAPIDTRANSIT LIGHTRAILTRANSIT STATIONAREAS S A N T A C L A R A Valley Transportation
Needs and Community Characteristics
 Needs and Community Characteristics Anticipate Population and Job Growth in the City Strongest density of population and jobs in Ann Arbor are within the Study Area Population expected to grow 8.4% by
Project Scoping Report Appendix B Project Web Site. APPENDIX B Project Web Site
 Project Scoping Report Appendix B Project Web Site APPENDIX B Project Web Site WESTSIDE EXTENSION TRANSIT CORRIDOR STUDY February 4, 2008 News and Info of 1 http://metro.net/projects_programs/westside/news_info.htm#topofpage
Downtown Transit Connector. Making Transit Work for Rhode Island
 Downtown Transit Connector Making Transit Work for Rhode Island 3.17.17 Project Evolution Transit 2020 (Stakeholders identify need for better transit) Providence Core Connector Study (Streetcar project
Pacific Electric Right-of-Way / West Santa Ana Branch Corridor Alternatives Analysis
 Pacific Electric Right-of-Way / West Santa Ana Branch Corridor Alternatives Analysis Transit Coalition September 26, 2012 2 Study Area Pacific Electric Rightof-Way/West Santa Ana Branch (PEROW/ WSAB) extends
CHAPTER 5 CAPITAL ASSETS
 CHAPTER 5 CAPITAL ASSETS This chapter describes the capital assets of GCTD, including revenue and nonrevenue vehicles, operations facilities, passenger facilities and other assets. VEHICLE REVENUE FLEET
Point A Point B Point C Point D. Fulton County Board of Commissioners and Mayors Meeting December 14, 2017
 Fulton County Board of Commissioners and Mayors Meeting December 14, 2017 Master Plan Overview Phase 1 Community Vision and Existing Transit Conditions Phase 2 Scenario Development Phase 3 Transit Master
1.0 Detailed Definition of Alternatives
 1.0 Detailed Definition of Alternatives 1.1 Introduction This chapter provides supplemental information on the four alternatives, including both physical and operational characteristics (e.g. service plans)
Where will. BRT run? BRT will serve 20 stations along the line, connecting to bus routes and serving major destinations. How often will service run?
 Where will 32 65 87 223 Rosedale Transit Center 225 227 264 801 ROSEVILLE 65 Snelling & County Road B BRT run? Snelling & Roselawn FALCON HEIGHTS BRT will serve 20 stations along the line, connecting to
Background Information about the Metrobus 29 Lines Study
 Background Information about the Metrobus 29 Lines Study Questions Overview of Existing Service Q. Why is the study being conducted? A. The 29 Lines provide an important connection between Annandale and
East San Fernando Valley Transit Corridor. Information Session, October 10, 2017
 East San Fernando Valley Transit Corridor Information Session, October 10, 2017 1 Welcome and Meeting Purpose Introductions Metro Transit Corridors Planning Metro Real Estate Metro Community Relations
Charlotte-Mecklenburg Region Rapid Transit and Land-Use Integration
 Charlotte-Mecklenburg Region Rapid Transit and Land-Use Integration Legislative Committee on Urban Growth and Infrastructure Carolyn Flowers CEO Charlotte Area Transit System March 23, 2010 Charlotte Region
Green Line opens June 14
 Winter 2014 Green Line opens June 14 To-do list for METRO Green Line s grand opening Yours: Study safety tips at www.centralcorridor.org/safety Learn about planned Metro Transit bus service changes on
CORE AREA SPECIFIC PLAN
 only four (A, B, D, and F) extend past Eighth Street to the north, and only Richards Boulevard leaves the Core Area to the south. This street pattern, compounded by the fact that Richards Boulevard is
TORONTO TRANSIT COMMISSION REPORT NO.
 Revised: March/13 TORONTO TRANSIT COMMISSION REPORT NO. MEETING DATE: March 26, 2014 SUBJECT: COMMUNITY BUS SERVICES ACTION ITEM RECOMMENDATION It is recommended that the Board not approve any routing
Application of IVI Technologies for Bus Rapid Transit Systems
 Application of IVI Technologies for Bus Rapid Transit Systems Authors: Matthew Hardy Lead Transportation Engineer Mitretek Systems 600 Maryland Ave., SW Suite 755 Washington, DC 20024 (202) 863-2982 matthew.hardy@mitretek.org
PUBLIC TRANSPORTATION
 PUBLIC TRANSPORTATION PROJECT TITLE U-MED DISTRICT MULTI-MODAL IMPROVEMENTS- PHASE II Transit Vehicles and Upgrades MUNICIPALITY OF ANCHORAGE Capital Improvement Program PROJECT LIST BY DEPARTMENT Public
Kenosha-Racine-Milwaukee (KRM)
") Kenosha-Racine-Milwaukee (KRM) Commuter Rail #147925 November 6, 2009 1 Guidance of KRM Commuter Rail Studies Intergovernmental Partnership Technical Steering Committee Temporary and Limited Authority
Kenosha-Racine-Milwaukee (KRM) Commuter Rail #147925 November 6, 2009 1 Guidance of KRM Commuter Rail Studies Intergovernmental Partnership Technical Steering Committee Temporary and Limited Authority
State Avenue Corridor Bus Rapid Transit (BRT)
") State Avenue Corridor Bus Rapid Transit (BRT) Moving Forward Incrementally April 2010 State Ave. BRT Update Bus Rapid Transit Overview State Ave. Alternatives Analysis Results What s Coming Up Right Away!
State Avenue Corridor Bus Rapid Transit (BRT) Moving Forward Incrementally April 2010 State Ave. BRT Update Bus Rapid Transit Overview State Ave. Alternatives Analysis Results What s Coming Up Right Away!
A Transit Plan for the Future. Draft Network Plan
 A Transit Plan for the Future Draft Network Plan Project Overview and Status Completed Market Analysis and Service Evaluation. Developed Plan Framework and Guiding Principles. Developed a draft Five Year
Midtown Corridor Alternatives Analysis Initial Screening Analysis
 Midtown Corridor Alternatives Analysis Initial Screening Analysis 7/24/2013 Prepared by the SRF Consulting Group Team for Table of Contents Purpose... 1 Initial Screening Analysis Methodology... 1 Screening...
Vanpooling and Transit Agencies. Module 3: Benefits to Incorporating Vanpools. into a Transit Agency s Services
 Vanpooling and Transit Agencies Module 3: Benefits to Incorporating Vanpools into a Transit Agency s Services A common theme we heard among the reasons why the transit agencies described in Module 2 began
APPENDIX I: [FIXED-GUIDEWAY TRANSIT FEASIBILITY]
![APPENDIX I: [FIXED-GUIDEWAY TRANSIT FEASIBILITY]](/thumbs/83/87090921.jpg "APPENDIX I: [FIXED-GUIDEWAY TRANSIT FEASIBILITY]") APPENDIX I: [FIXED-GUIDEWAY TRANSIT FEASIBILITY] Jackson/Teton Integrated Transportation Plan 2015 Appendix I. Fixed-Guideway Transit Feasibility Jackson/Teton County Integrated Transportation Plan v2
APPENDIX I: [FIXED-GUIDEWAY TRANSIT FEASIBILITY] Jackson/Teton Integrated Transportation Plan 2015 Appendix I. Fixed-Guideway Transit Feasibility Jackson/Teton County Integrated Transportation Plan v2
The Engineering Department recommends Council receive this report for information.
 CORPORATE REPORT NO: R161 COUNCIL DATE: July 23, 2018 REGULAR COUNCIL TO: Mayor & Council DATE: July 19, 2018 FROM: General Manager, Engineering FILE: 8740-01 SUBJECT: Surrey Long-Range Rapid Transit Vision
LOS ANGELES COUNTY METROPOLITAN TRANSPORTATION AUTHORITY (LACMTA) AND FEDERAL TRANSIT ADMINISTRATION (FTA)
 AND FEDERAL TRANSIT ADMINISTRATION (FTA)") LOS ANGELES COUNTY METROPOLITAN TRANSPORTATION AUTHORITY (LACMTA) AND FEDERAL TRANSIT ADMINISTRATION (FTA) NOTICE OF PREPARATION (NOP)/NOTICE OF INTENT (NOI) OF AN ENVIRONMENTAL IMPACT STATEMENT (EIS)/ENVIRONMENTAL
LOS ANGELES COUNTY METROPOLITAN TRANSPORTATION AUTHORITY (LACMTA) AND FEDERAL TRANSIT ADMINISTRATION (FTA) NOTICE OF PREPARATION (NOP)/NOTICE OF INTENT (NOI) OF AN ENVIRONMENTAL IMPACT STATEMENT (EIS)/ENVIRONMENTAL
Kendall Drive Premium Transit PD&E Study
 Florida Department of Transportation District Six Kendall Drive Premium Transit PD&E Study Project Kick-Off Meeting SR 94/Kendall Drive/SW 88 Street Project Development and Environment (PD&E) Study From
THE WILSHIRE CORRIDOR: RAIL AND ITS ALTERNATIVES. Prepared By: Jacki Murdock Transportation and Environmental Planner
 THE WILSHIRE CORRIDOR: RAIL AND ITS ALTERNATIVES Prepared By: Jacki Murdock Transportation and Environmental Planner December 13 th, 2012 Overview Characteristics of Wilshire Boulevard Overview of the
METRO TRANSIT a n n ua l re p o r t. madison, wisconsin // mymetrobus.com
 METRO TRANSIT 2016 a n n ua l re p o r t madison, wisconsin // mymetrobus.com metro transit In 2016, Metro Transit took steps to address capacity issues both on and off the road. Off the road, Metro began
The range of alternatives has been reviewed with the RTAC Subgroup and the preliminary analysis is proceeding on the following HCT alternatives:
 Attachment 2 Boise Treasure Valley Phase 1 Alternatives Analysis August 14, 2009 Introduction The Treasure Valley High Capacity Transit Priority Corridor Phase 1 Alternatives Analysis is being prepared
We Want Your Input! Review the design alternatives and tell us what s important to you in the design of these areas of the approved BRT Network:
 We Want Your Input! Review the design alternatives and tell us what s important to you in the design of these areas of the approved BRT Network: Richmond North of Oxford Street Richmond Row Dundas Street
Mobility Corridor Updates. Transit & Active Transportation Projects
 Mobility Corridor Updates Transit & Active Transportation Projects Manjeet Ranu, SEO East San Fernando Valley Transit Corridor Metro Board LPA selection: June 2018 Recently awarded $200 million in Senate
East San Fernando Valley Transit Corridor. Community Meetings April/May, 2012
 East San Fernando Valley Transit Corridor Community Meetings April/May, 2012 Meeting Format Sign-In/Open-House 6:00 P.M. to 6:30 P.M. Welcome/Presentation 6:30 P.M. to 7 P.M. Open-House 7:00 P.M. to 8:00
Traffic Management Plan and Queuing Analysis Lakehill Preparatory School Z Hillside Drive, Dallas, TX October 27, 2015
 Traffic Management Plan and Queuing Analysis Lakehill Preparatory School Z145-235 2720 Hillside Drive, Dallas, TX October 27, 2015 Introduction: The Lakehill Preparatory School is located on the northeast
DETAILED DEFINITION OF ALTERNATIVES. July 2014 FINAL
 DETAILED DEFINITION OF ALTERNATIVES July 2014 Table of Contents 1.0 Introduction... 1 1.1 Detailed Mode Alternatives... 1 1.2 Detailed Alignment Alternatives... 1 1.3 Key Physical and Service Elements...
IV. ENVIRONMENTAL IMPACT ANALYSIS K.2. PARKING
 IV. ENVIRONMENTAL IMPACT ANALYSIS K.2. PARKING ENVIRONMENTAL SETTING The following analysis summarizes the findings and conclusions of the Traffic Analysis (Traffic Study), prepared by The Mobility Group,
Executive Summary. Treasure Valley High Capacity Transit Study Priority Corridor Phase 1 Alternatives Analysis October 13, 2009.
 Treasure Valley High Capacity Transit Study Priority Corridor Phase 1 Alternatives Analysis October 13, 2009 Background As the Treasure Valley continues to grow, high-quality transportation connections
Appendix C. Parking Strategies
 Appendix C. Parking Strategies Bremerton Parking Study Introduction & Project Scope Community concerns regarding parking impacts in Downtown Bremerton and the surrounding residential areas have existed
FasTracks News. RTD s Eagle P3 Transit Project Nears Halfway Mark to Opening Day EP3 will add three commuter rail lines to metro area in 2016
 July 29, 2013 Welcome to Inside RTD FasTracks a monthly e- update to keep you informed about the progress of the Regional Transportation District's FasTracks program. FasTracks News RTD s Eagle P3 Transit
Help shape your community investment in Wake Transit. Fiscal Year 2019 Draft Work Plan Summary
 Help shape your community investment in Wake Transit Fiscal Year 2019 Draft Work Plan Summary Wake County, growth and transit The Triangle is one of the fastest-growing regions in the nation. Wake County
KEY BUS ROUTE IMPROVEMENT PROJECT ROUTE 23 AGENDA
 KEY BUS ROUTE IMPROVEMENT PROJECT ROUTE 23 December 9, 2009 Codman Tech 450 Washington Street AGENDA Introduction Key Bus Routes Program Route 23 Challenges Proposed Improvement Plan Next Steps Question
West Broadway Reconstruction/LRT Design. March 19, 2015
 West Broadway Reconstruction/LRT Design March 19, 2015 1 Meeting Agenda 6:05 6:30 PM Brief presentation What we heard Project overview 6:30 8:00 PM Visit Six Topic Areas Road and LRT design elements Pedestrian
Bi-County Transitway/ Bethesda Station Access Demand Analysis
 Bi-County Transitway/ Bethesda Station Access Demand Analysis Prepared for: Washington Metropolitan Area Transit Authority Office of Planning and Project Development May 2005 Prepared by: in conjunction
Paid Parking at Park & Ride Lots: Framing the Issues. Capital Programs Committee May 2014
 Paid Parking at Park & Ride Lots: Framing the Issues Capital Programs Committee May 2014 Outline Current Status Industry Review DART Case Study Issues Alternatives Mechanics 2 Current Status: All Lots
HDR Engineering. HART North / South. Tampa Bay Applications Group Meeting May 14, 2009
 HDR Engineering HART North / South BRT Corridor PD&E Tampa Bay Applications Group Meeting May 14, 2009 1 Agenda Update on Project Development and Environment (PD&E) Study Project Overview System Branding
Rapid Transit and Land-Use Integration a Reality
 City of Charlotte Rapid Transit and Land-Use Integration a Reality Transportation Oversight Committee Carolyn Flowers CEO Charlotte Area Transit System April 29, 2010 Charlotte Region Statistics Mecklenburg
Executive Summary October 2013
 Executive Summary October 2013 Table of Contents Introduction... 1 Rider Transit and Regional Connectivity... 1 Plan Overview... 2 Network Overview... 2 Outreach... 3 Rider Performance... 4 Findings...
Herding Cats; Strategies used for KC Downtown Streetcar Utility Coordination ASCE Transportation Conference
 Herding Cats; Strategies used for KC Downtown Streetcar Utility Coordination ASCE Transportation Conference November 9, 2016 Kansas City Streetcar Project overview Current status Scope of water and sewer
Metro Transit Update. Christina Morrison, Senior Planner Metro Transit BRT/Small Starts Project Office. John Dillery, Senior Transit Planner
 Metro Transit Update Christina Morrison, Senior Planner Metro Transit BRT/Small Starts Project Office John Dillery, Senior Transit Planner Metro Transit Service Development May 16, 2013 1 Transit Planning
Community Open Houses November 29 December 7, 2017
 Community Open Houses November 29 December 7, 2017 1 Community Open House Agenda 6:00 PM Open House 6:30-7:30 PM Presentation and Q&A 7:30-8:00 PM Open House Resumes after the presentation and Q&A Thank
Van Ness Transit Corridor Improvement Project. Engineering, Maintenance and Safety Committee March 25, 2015
 Van Ness Transit Corridor Improvement Project Engineering, Maintenance and Safety Committee March 25, 2015 Project Need 16,000 daily passenger boardings within the project corridor Average bus speed 8
Chapter 4 : THEME 2. Transportation
 Chapter 4 : THEME 2 Strengthen connections to keep the Central Area easy to reach and get around 55 Figure 4.2.1 Promote region-wide transit investments. Metra commuter rail provides service to the east,
VAN NESS AVENUE BUS RAPID TRANSIT
 VAN NESS AVENUE BUS RAPID TRANSIT Commission of the Environment Policy Committee May 22, 2014 Peter Gabancho Project Manager III Capital Programs & Construction SFMTA 1 Conceptual Visual Simulation Center-Running
UTA Transportation Equity Study and Staff Analysis. Board Workshop January 6, 2018
 UTA Transportation Equity Study and Staff Analysis Board Workshop January 6, 2018 1 Executive Summary UTA ranks DART 6 th out of top 20 Transit Agencies in the country for ridership. UTA Study confirms
US 81 Bypass of Chickasha Environmental Assessment Public Meeting
 US 81 Bypass of Chickasha Environmental Assessment Public Meeting March 14, 2013 Introductions ODOT FHWA SAIC Meeting Purpose Present need for bypass Provide responses to 10/04/11 public meeting comments