Traffic Assessment SUNY Buffalo School of Medicine & Biomedical Sciences TRAFFIC ASSESSMENT
|
|
|
- Aron Brown
- 5 years ago
- Views:
Transcription

1 TRAFFIC ASSESSMENT University at Buffalo School of Medicine & Biomedical Sciences Buffalo Niagara Medical Campus Buffalo, NY Prepared for: State University Construction Fund 353 Broadway Albany, New York University at Buffalo 12 Capen Hall Buffalo, New York Prepared by: Fisher Associates Project Number: Fisher Associates, P.E., L.S., P.C
2 TABLE OF CONTENTS PAGE EXECUTIVE SUMMARY... 1 I. INTRODUCTION... 7 A. Scoping Process B. Project Description II. EXISTING CONDITIONS A. Description of Transportation Network Corridors B. Description of Transportation Network Intersections C. Public Transportation D. Pedestrian E. Traffic Operations F. Capacity Analysis Methodology G. Existing Operations & Capacity Analysis III. BASE CONDITIONS A. Background Growth B. Ellicott Street Two-Way Conversion C. Future BNMC Developments D. Base Operations & Capacity Analysis IV. FUTURE CONDITIONS A. Description of Proposed Development B. Trip Generation C. Trip Distribution D. Future Operations & Capacity Analysis E. Cumulative Impacts of Development V. FUTURE CONDITIONS WITH MITIGATION A. Approach B. Description C. Operations VI. CONCLUSIONS REFERENCES APPENDIX Fisher Associates, P.E., L.S., P.C
3 LIST OF TABLES TABLES PAGE 1 Overall New Trips Tier 1 - New Trips Tier 2 - New Trips New Trips to Study Network by Parking Location & Tier Group Mitigation Summary Detailed Intersection Level of Service Summary Morning Peak Hour Detailed Intersection Level of Service Summary Evening Peak Hour LIST OF FIGURES FIGURE PAGE 1 Project Location Map Annual Average Daily Traffic Volumes Intersection Geometry & Traffic Control Details Existing Traffic Volumes Morning Peak Hour Existing Traffic Volumes Evening Peak Hour Base Traffic Volumes Morning Peak Hour Base Traffic Volumes Evening Peak Hour Students General New Trip Distributions Faculty General New Trip Distributions Future Traffic Volumes Morning Peak Hour Future Traffic Volumes Evening Peak Hour Mitigation Type Summary Fisher Associates, P.E., L.S., P.C
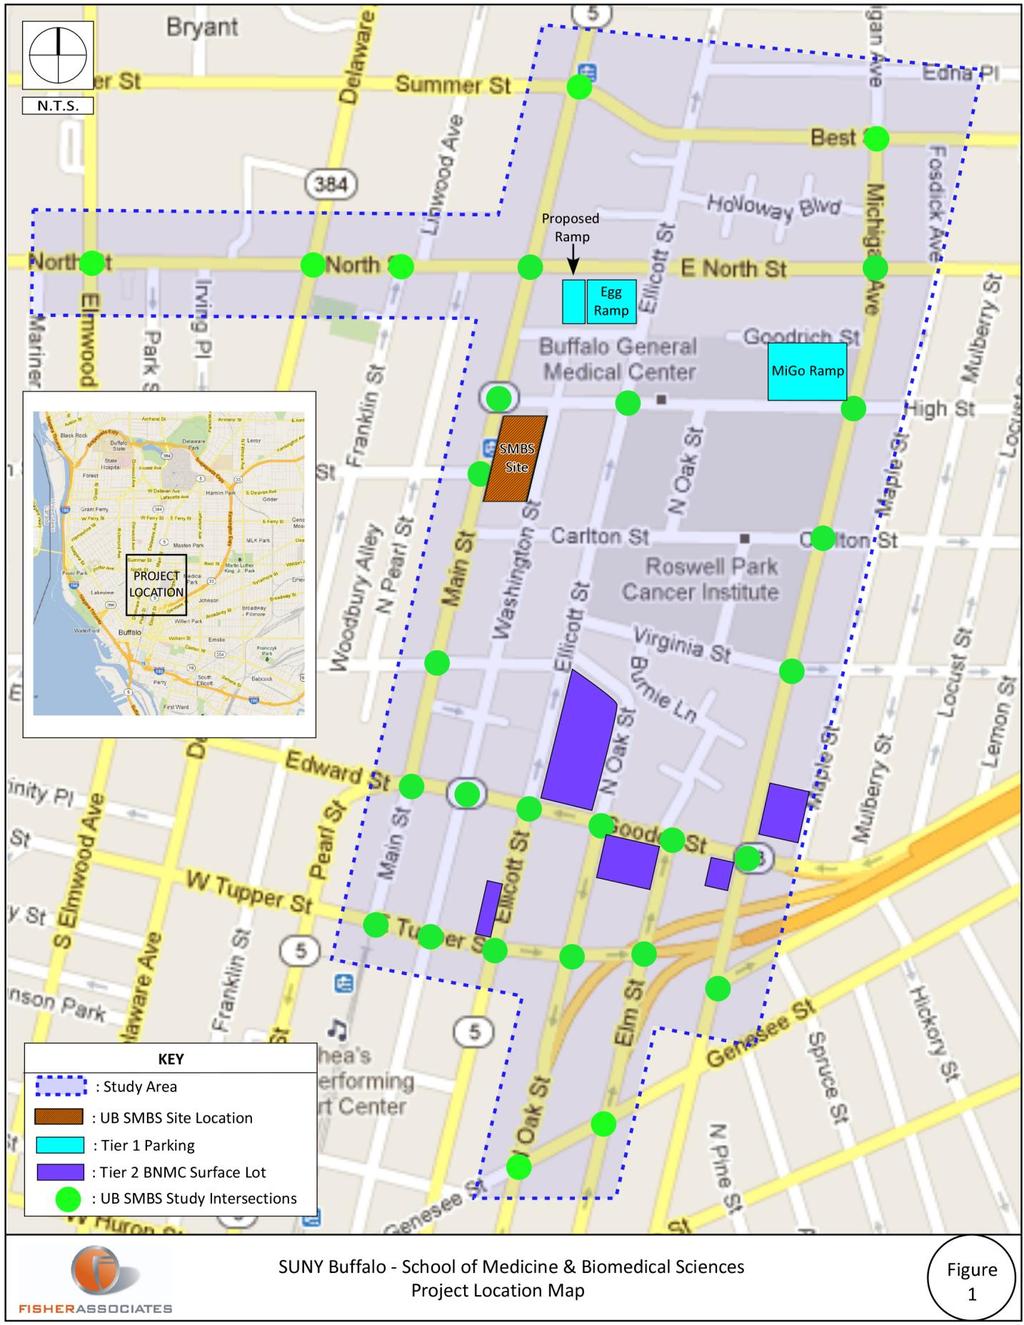
4 Executive Summary This traffic assessment has been conducted to address the affects that the proposed University of Buffalo s (UB) School of Medicine and Biomedical Sciences (SMBS) may have on the adjacent roadway network. The project site is located in the City of Buffalo, New York, specifically within the Buffalo Niagara Medical Campus (BNMC) on the parcel bordered by Main Street (west), High Street (north), Washington Street (east), and Carlton Street (south). The overall study area for the traffic assessment contains 29 intersections and is generally defined by: Tupper Street (Main Street to Michigan Avenue) Southern Boundary Best Street (Main Street to Michigan Avenue) Northern Boundary Main Street (Tupper Street to Best Street) Western Boundary Michigan Avenue (Cherry Street to Best Street) Eastern Boundary Project Overview The proposed facility is approximately 610,000 gross square feet and will include educational and laboratory facilities. It is anticipated that the Estimated Time of Completion (ETC) of the project is Parking for the project will be provided through a number of ramp garages and surface lots within the BNMC area and study area limits. There are two parking tiers. Tier 1 parking (premium parking) is within an 800-1,200 ft. walking distance of the proposed SMBS consisting of the Michigan Goodrich (MiGo) Parking Ramp and a new garage ramp located on 1031 & 1021 Main Street (Scrubs property adjacent to the existing Ellicott Goodrich Garage (EGG)). Tier 2 parking will consist of surface lots on the BNMC that are at least a 1,200 foot walking distance from the SMBS and the use of public transportation options such as the light rail/park-n-ride from the UB South Campus. A projected need of 1,104 total parking spaces is anticipated for the UB SMBS; each parking space translates into one trip. Trip estimations were based on parking demand. However, these trips are not all new trips to the BNMC and do not occur during both peak periods. Therefore, trip adjustments were made based on the arrival/dismissal patterns during the peak periods and the proportion of the student and faculty population that are currently travelling to the BNMC. After the adjustments, the estimated new trips to the study network is 1,113 trips during the weekday morning commuter peak period and 968 trips during the weekday evening commuter peak period. Total New Trips Weekday Morning Weekday Evening Enter Exit Total 1, Page 1
5 The use of public transportation options such as the light rail/park-n-ride from the UB South Campus is considered a travel demand management technique that will effectively reduce the total number of trips destined to and leaving the study area by about 14% or up to 155 trips. General (Macroscopic) trip distribution patterns to/from the study area were based on origin/destination data provided by UB, student desire or intent to live within close proximity of the SMBS and proximity to the major expressways network. Detailed trip distributions at the study intersections were primarily dictated by parking facility locations for each Parking Tier Group, local street network and operational considerations observed from Existing Condition. Analysis Findings Currently, traffic patterns to and from the BMNC area favor the roadway corridors of Tupper Street, Goodell Street and Michigan Avenue. A majority of the BMNC area traffic enters/exits from the southeast and utilizes the MiGo Ramp and EGG Ramp for parking. As a result, a number of study intersections have movements that operate under volume-to-capacity (v/c) conditions and/or at a Level-of-Service (LOS) when congestion would be apparent, but not unacceptable in a built-up urban/city environment. One exception is the intersection of Goodell Street/Michigan Avenue, where the southbound movement is operating at a v/c of 1.18 and a failing LOS. The project s anticipated completion is A 1% general growth rate per year was applied to the study area to account for ambient traffic volume increases between and Additionally, several other projects within the BMNC area and study area are anticipated to occur by the year 2016; they are: Ellicott Street converted from one-way to two-way travel Women s and Children s Hospital of Buffalo Conventus, Medical Office Building The inclusion of these projects within the study area represented the assessment s Base intersection traffic volumes and roadway network. The proposed UB SMBS trips were applied to the Base, which represented the assessment s Future intersection traffic volumes and roadway network at Capacity analysis was conducted for Existing, Base, and Future. The following Level of Operations table provides an overview of operational impacts by study intersection. The analysis findings indicated that a majority of the study intersections are not expected to be exceedingly affected. However, the intersections with shading indicate that these intersections have a turning movement that is operating near, at or over capacity and/or at a LOS E or F ; for which mitigation is recommended. Page 2
6 Level of Operations Summary Study Intersection (Synchro Reference Number) Existing Base Future Tupper Street & Main Street (1) Tupper Street & Washington Street (2) Tupper Street & Ellicott Street (3) Tupper Street & Oak Street (4) Tupper Street & Elm Street (5) Goodell Street & Michigan Avenue (7) Goodell Street & Elm Street (8) Goodell Street & Oak Street (9) Goodell Street & Ellicott Street (10) Goodell Street & Washington Street (11) Goodell Street & Main Street (12) Main Street & Virginia Street (13) Main Street & Allen Street (14) Main Street & High Street (15) Main Street & North Street (16) Main Street & Best Street (17) Michigan Avenue & Cherry Street (18) Michigan Avenue & Virginia Street (19) Michigan Avenue & Carlton Street (20) Michigan Avenue & High Street (21) Michigan Avenue & North Street (22) Michigan Avenue & Best Street (23) North Street & Elmwood Avenue (24) North Street & Delaware Avenue (25) North Street & Franklin Street (26) North Street & Linwood Avenue (27) Genesee Street & Oak Street (28) Genesee Street & Elm Street (29) High Street & Ellicott Street (30) Key: = Under Capacity = Near Capacity = At Capacity and/or LOS E = Over Capacity and/or LOS F Page 3
7 The addition of the WCHOB and Conventus developments under Base will notably degrade intersection operations. It is also recognized that the UB SMBS project alone will contribute to the further reduction in intersection operations. There is a high likelihood that these three developments will be constructed concurrently and considering current operations, the compounding effect of one potential development layered over the other in no particular order as well as the application of a regional ambient growth rate leads to the conclusion that no one entity is responsible for all of the degradation in intersection operations. Therefore, a set of comprehensive mitigation measures have been developed that address the cumulative impacts of all three projects. Mitigation Recommendations Mitigation thresholds were established in context of generally accepted operations within an urban/city environment. These thresholds included maintaining an overall intersection LOS D and intersection turning movements of LOS E for signal controlled intersections and LOS e for stop controlled intersections. Additionally, it is not uncommon for commuter peak traffic to experience short periods of congested operations that are near or at capacity; therefore a v/c of 0.95 or less was maintained. To attain these operational thresholds (or better) and offset the anticipated network impacts the following mitigation practices were applied: Multiple Arterial Signal Coordination Schemes Multiple Signal Timing Improvements Minor Roadway Striping Modifications Intersection Monitoring for operational degradation as project(s) come on-line The next table provides a detail summary of the mitigation by intersection with an accompanying figure that depicts the proposed mitigation at each study intersection. Page 4
8 Mitigation Summary Mitigation Type Location Description Proposed Arterial Signal Coordination Proposed Signal Timing Improvements Proposed Striping Changes Proposed Intersection Monitoring Tupper Street: Main Street to Elm Street Goodell Street: Michigan Avenue to Washington Street Michigan Avenue: Virginia Street to High Street Tupper Street / Ellicott Street Tupper Street / Oak Street Tupper Street / Elm Street Goodell Street / Michigan Avenue Goodell Street / Oak Street Goodell Street / Main Street Main Street / High Street Main Street / North Street Michigan Avenue / Virginia Street Michigan Avenue / Carlton Street Michigan Avenue / High Street North Street / Elmwood Avenue High Street / Ellicott Street Tupper Street / Ellicott Street Goodell Street / Elm Street Optimized signal timing splits at intersections noted below, Optimized offsets at all intersections in Arterial Optimized signal timing splits & Cycle Lengths at intersections noted below, Optimized offsets at all intersections in Arterial Optimized signal timing splits & Cycle Lengths at intersections noted below, Optimized offsets at all intersections in Arterial Optimized signal timing splits & offset Optimized signal timing splits & offset Optimized signal timing splits & offset Coordinated as part of Goodell St. Arterial, Changed Cycle Length & Optimized signal timing splits/offset Optimized signal timing splits & offset Optimized signal timing splits Optimized signal timing splits Optimized signal timing splits & offset (AM peak) Removed from Coordination & Changed Cycle Length (PM Peak) Coordinated as part of Michigan Ave. Arterial, Changed Cycle Length & Optimized signal timing splits/offset Coordinated as part of Michigan Ave. Arterial, Changed Cycle Length & Optimized signal timing splits/offset Coordinated as part of Michigan Ave. Arterial, Changed Cycle Length & Optimized signal timing splits/offset Optimized signal timing splits & offset Changed Cycle Length & Optimized signal timing splits Southbound Approach Changed from: to Subject to detailed design analysis Monitor intersection for 2 years to determine if future intersection improvements, such as the implementation of a signal are needed Page 5
9 Page 6
10 I. Introduction This traffic assessment has been conducted to address the affects that the proposed University at Buffalo s (UB) School of Medicine and Biomedical Sciences (SMBS) may have on the adjacent roadway network. A. Scoping Process An extensive scoping process was conducted, which formulated the framework of this assessment. This process included: Multiple meetings and discussions with the State University Construction Fund (SUCF), UB, the City of Buffalo, and the New York State Department of Transportation (NYSDOT) Field Investigations and observations Comprehensive review of all previous assessments conducted for the Buffalo Niagara Medical Campus (BNMC) Review of the Parking Study conducted for the UB SMBS Detailed analysis of population distribution data provided by UB for both Students and Faculty/Staff/Visitors This process resulted in the determination of the following parameters: Study Area & Intersections Base Parameters Trip Generation Basis Overall Trip Distribution Characteristics B. Project Description The project involves the construction of a new facility for the relocation of the University at Buffalo s (UB) School of Medicine and Biomedical Sciences (SMBS) within the Buffalo Niagara Medical Campus (BNMC) in the City of Buffalo, NY. The proposed facility is approximately 610,000 gross square feet and will include educational and laboratory facilities. This site is located on the parcel bordered by Main Street (west), High Street (north), Washington Street (east), and Carlton Street (south). Parking will not be provided at the proposed facility proper. Parking will be accommodated through parking ramps and surface lots within and surrounding the BNMC and through the use of transportation demand management (TDM) in the form light rail/park-n-ride from the UB South Campus. For the UB SMBS there are two parking categories (tiers). Tier 1 parking (premium parking) will consist of the Michigan Goodrich (MiGo) Parking Ramp and a proposed parking ramp (New Parking Ramp) located on 1031 & 1021 Main Street (Scrubs property adjacent to the existing Ellicott Goodrich Garage (EGG)). Tier 2 Page 7
11 parking will consist of surface lots on the BNMC that are at least a 1,200 foot walking distance from the SMBS and the use of public transportation options such as the light rail/park-n-ride from the UB South Campus. Figure 1 depicts the Project Location, Study Limits, Anticipated Parking Locations, and the 29 Intersections within the defined study area that were analyzed in this assessment. The following sections of the report document analysis procedures, assumptions taken, operations and conclusions made in the traffic assessment. Page 8
12 Page 9

 volumes are based on the most recently available count data from the New York State Department of Transportation.")
13 II. Existing This section of the report describes the current roadway network included in this assessment and documents field observations, capacity analysis methodology and current operations. A. Description of Transportation Network Corridors The following are descriptions of the main transportation corridors within the study area. Functional Classifications of the roadways were retrieved from the New York State Department of Transportation 2000 Functional Classification Maps 1. Annual Average Daily Traffic (AADT) volumes are based on the most recently available count data from the New York State Department of Transportation. Tupper Street Tupper Street is an east-west travel route designated as an Urban Principle Arterial. This street is a two-way roadway between Main Street and Ellicott Street with two eastbound lanes and one westbound lane. It reduces to one-way travel (eastbound) between Ellicott Street and Michigan Avenue, with three travel lanes from Ellicott Street to Oak Street. To the east of Oak Street it reduces further to two travel lanes and becomes NYS Route 33 EB. The travel lanes are 11 wide. The roadway s AADT ranges from 11,700 to 24,600 vehicles per day. The posted speed limit is 30 mph within the study limits. Tupper Street Eastbound (One-way) Goodell Street Goodell Street is a one-way westbound travel route and is designated as an Urban Principle Arterial. This street is the NYS Route 33 WB to the east of Michigan Avenue. The roadway has four travel lanes. The travel lanes are 11 wide. The roadway s AADT ranges from 13,600 to 24,600 vehicles per day. The posted speed limit is 30 mph within the study limits. Goodell Street Westbound Page 10


14 Main Street Main Street is a north-south travel route and is designated as an Urban Principle Arterial. The roadway has two travel lanes in each direction. The travel lanes are 11 wide. The roadway s AADT ranges from 3,000 to 11,900 vehicles per day. The posted speed limit is 30 mph within the study limits. Main Street Northbound Michigan Avenue Michigan Avenue is a north-south travel route and is designated as an Urban Minor Arterial. The roadway has two travel lanes in each direction between Cherry Street and Goodell Street, one northbound and two southbound travel lanes between Goodell Street and Virginia Street, and one travel lane in each direction between Virginia Street and Best Street. The travel lanes are 11 wide. The roadway s AADT ranges from 3,700 to 10,400 vehicles per day. The posted speed limit is 30 mph within the study limits. Michigan Avenue Southbound North Street North Street is an east-west travel route and is designated as an Urban Minor Arterial. The roadway has one travel lane in each direction. The travel lanes are 11 wide. The roadway s AADT ranges from 3,300 to 7,700 vehicles per day. The posted speed limit is 30 mph within the study limits. North Street Eastbound Page 11


15 Ellicott Street Ellicott Street is a north-south travel route and is designated as an Urban Major Collector. The roadway has two-way travel from Tupper Street to Goodell Street, with one travel lane in each direction, and is one-way travel northbound from Goodell Street to Best Street with two travel lanes. The travel lanes are 11 wide. The roadway s AADT ranges from 1,500 to 4,500 vehicles per day. The posted speed limit is 30 mph within the study limits. Ellicott Street Northbound High Street High Street is an east-west travel route and is designated as an Urban Collector. The roadway has one travel lane in each direction. The travel lanes are 11 wide. The roadway s AADT is approximately 3,600 vehicles per day. The posted speed limit is 30 mph within the study limits. High Street Westbound Best Street Best Street is an east-west travel route. It is designated as an Urban Minor Arterial. The roadway has one travel lane in each direction. The travel lanes are 11 wide. The roadway s AADT ranges from 4,600 to 10,100 vehicles per day. The posted speed limit is 30 mph within the study limits. Best Street Westbound Page 12
 with three travel lanes.")

16 Oak Street Oak Street is a north-south travel route. It is designated as a Local Road. The roadway is two-way travel between Ellicott Street and Goodell Street with one travel lane in each direction. Between Goodell Street and Tupper Street it becomes one-way travel (southbound) with three travel lanes. At Tupper Street it reduces to two travel lanes that merge with two NY 33 West offramp travel lanes creating a four lane approach at Genesee Street and then reduces to three travel lanes. The travel lanes are 11 wide. The roadway s AADT was unavailable; however based on recent turning movement count data it is estimated to range from 5,000 (Goodell St to Rt. 33 WB Off-Ramp) to 20,000 (Rt. 33 WB Off-Ramp to Project Limits) vehicles per day. The posted speed limit is 30 mph within the study limits. Oak Street Southbound Elm Street Elm Street is a one-way northbound travel route and is designated as an Urban Principle Arterial. The roadway has four travel lanes from Genesee Street to the NY 33 Eastbound on-ramp reducing to two travel lanes from the NY 33 Eastbound on-ramp to Goodell Street. The travel lanes are 11 wide. The roadway s AADT ranges from 6,600 to 31,400 vehicles per day. The posted speed limit is 30 mph within the study limits. Elm Street Northbound Figure 2 depicts the available AADT s for the roadway segments. Page 13
17 Page 14
18 B. Description of Transportation Network Intersections The study intersections are part of an urban network; typically closely spaced with on-street parking and curbing. Multiple intersections have dedicated turning lanes and/or restricted parking on their approaches. The majority of the study intersections are signal controlled with two to five phases of operation. Signal Coordination is present on sections of the following corridors: Main Street Goodell Street Tupper Street More detail about the study intersection geometry and traffic control are depicted in Figure 3. Page 15
19 Page 16
20 C. Public Transportation The Niagara Frontier Transportation Authority (NFTA) currently services the BNMC with four bus routes, #7 Baynes-Richmond, #8 Main, #29 Wohlers, #81 Eastside, and a light rail line called the Metro Rail. NFTA bus stops are located throughout the campus and the Metro Rail s Allen/Medical Campus Station is located at the intersection of Allen Street and Main Street. The University at Buffalo provides weekday transportation services directly between the Downtown and South Campuses via its Blue Line shuttle service between 6:30 AM and 8:30 PM. The Blue Line connects with South Campus Orange Line shuttle that travels throughout the South Campus. University transportation is reserved for UB students, faculty, staff members, and guests. A free shuttle service, The Wave, is provided for employees, patients and visitors on the BNMC weekdays between 5:00 AM and 8:30 PM. The Wave has eight shuttle stops throughout the campus. D. Pedestrian Overall pedestrian activity throughout the BNMC was observed to be moderate in occurrence with higher pedestrian activity expected during the warmer months. Generally, people were observed traveling to the BNMC area by personal vehicles and parked in parking ramps and surface lots. On campus, people were observed utilizing the shuttle services to travel to campus buildings from parking lots. Based on observations and pedestrian count data provided by the Greater Niagara Buffalo Regional Transportation Council (GBNRTC), three intersections with significant pedestrian activity were identified: Main Street & Allen Street High Street & Ellicott Street Carlton Street & Elm Street The Main Street/Allen Street intersection receives significant pedestrian activity from the NFTA station to Allen Street which is exacerbated during summer festivals that occur in Allentown. The other two intersections see significant pedestrian traffic due to their proximity to the main entrances of Buffalo General Medical Center and Roswell Park Cancer Institute respectively. Pedestrian accommodations in the form of crosswalks and pedestrian signal indications were noted throughout the study area. E. Traffic Operations A Synchro model of the study area was provided by the GBNRTC. This model included the following data: Existing intersection turning movement volumes (collected in 2011 & 2012) Signal timing and phasing data Roadway Geometry Page 17
21 To supplement unavailable or missing data from this model additional turning movement counts were collected during the morning and evening peaks on January 23 rd and 24 th, 2013 at the following four intersections: North Street & Elmwood Avenue North Street & Delaware Avenue North Street & Franklin Street Oak Street & Genesee Street Figures 4 and 5 depict Existing traffic volumes for the study intersections. Field observations and verification of signal data were conducted at the study intersections during the morning and evening commuter travel periods on January 23 rd and 24 th, This information, in addition to local knowledge of the transportation network, was used to calibrate the Existing Synchro models. Upon completion of this assessment, these calibrated models will be provided to the GBNRTC to be incorporated into their regional data inventory. Page 18
22 Page 19
23 Page 20
24 F. Capacity Analysis Methodology a. Intersection Level of Service Intersection capacity analysis was conducted using Version 7 of Synchro 2 software, which is based on the methods presented in the 2000 Highway Capacity Manual 3 describing the levels of operation for intersections controlled by signals and regulated by stop signs. Using this analytical approach, a Level of Service (LOS), an operations performance measure, is determined for traffic travelling through an intersection. The Level of Service is defined or quantified in terms of average delay experienced by motorists, which is equated to the letters A to F or a to f for signal controlled and stop sign controlled intersections, respectively. The following provides delay descriptions for each level of service: Signal Controlled Intersections A 10 seconds or less B 10.1 to 20 seconds C 20.1 to 35 seconds D 35.1 to 55 seconds E 55.1 to 80 seconds F Greater than 80 seconds Stop Sign Controlled Intersections a 10 seconds or less b 10.1 to 15 seconds c 15.1 to 25 seconds d 25.1 to 35 seconds e 35.1 to 50 seconds f Greater than 50 seconds Based on our professional experience with other agencies and municipalities, an overall intersection LOS D and intersection turning movement LOS E generally represent the thresholds of acceptable operations for a signal controlled intersection in an urban/city environment. A LOS e generally represents the threshold of acceptable operations for a stop controlled intersection. Page 21
25 b. Intersection Volume to Capacity Ratio & Vehicular Queue Lengths Volume to capacity (v/c) ratios are another performance measure, which provide additional insight on operations. Capacity is the volume service threshold for turning movements based on factors such as geometry (including number of lanes) and intersection controls. Volume to capacity ratios are a good indicator of turning movement sufficiency. They indicate when unstable operational conditions are present or approaching. The following provides general descriptions for v/c ratio ranges: 0.85: Under Capacity : Near Capacity : At Capacity 1.00: Over Capacity In general, turning movements with a near capacity v/c ratio experience hindered traffic flows and elevated levels of delay may result. Turning movements with at capacity operating conditions are unstable and operations are difficult to predict. Traffic flow experiences significantly reduced travel speeds, poor vehicular progression, and high delays. At over capacity operating conditions traffic flow experiences extremely low travel speeds, poor vehicular progression, and extensive delays. Additionally as v/c ratios increase notable and at times extensive queuing at intersections will occur. It is not uncommon for commuter peak traffic to experience operations that are near or at capacity in an urban/city environment. This is generally tolerated, given that it occurs for relatively short periods of time over the course of a typical day; and the ability to construct additional capacity in the form of new travel lanes is logistically impossible and cost-prohibitive or undesirable by the community. Page 22
26 G. Existing Operations & Capacity Analysis The study area in this assessment is a complex urban network in which the roadways and intersections function interdependently. Operational issues at one location (intersection) may influence the operations at another location or cause traffic to seek out another route. Traffic volumes, observations, and the capacity analysis indicate that Tupper Street, Goodell Street, and Michigan Avenue carry a significant amount of traffic to/from the BNMC area. Traffic associated with BNMC also favors these roads due to a majority of the traffic entering/exiting the study area from the southeast (Route 33, Michigan Avenue, Oak Street, Elm Street) and travelling to major parking origins/destinations, such as the MiGo Ramp and the EGG Ramp. The following is a description of these three important corridors and their existing operations: Tupper Street Corridor: Tupper Street is a wide (4 lanes) one-way street that serves significant traffic volumes to Route 33. Traffic exiting to Route 33 utilizes Tupper Street during the evening peak period. Traffic on Tupper Street flows counter to traffic on Goodell Street between the morning and evening peak. The capacity analysis indicates that Tupper Street is near capacity during the evening peak period with v/c s up to 0.89 (at Ellicott Street) on the mainline and occasional long queues for eastbound traffic. The following intersections will have movements that are near capacity: o Tupper Street / Ellicott Street o Tupper Street / Oak Street Goodell Street Corridor: Goodell Street is a wide (4 lanes) one-way street that serves significant traffic volumes from Route 33. Both traffic entering the study area and traffic destined for Downtown Buffalo from Route 33 utilize Goodell Street during the morning peak hour. Goodell Street carries high traffic volumes during the morning peak but is operating at acceptable conditions. Michigan Avenue Corridor: Michigan Avenue carries northbound/southbound traffic to/from the major parking ramps on the north side of the BNMC. There is steady southbound traffic during the evening peak that can create long queues. The Michigan Avenue/Goodell Street intersection experiences LOS F (129 seconds delay) on the southbound approach during the evening peak period. This approach is over capacity with a 1.18 v/c and extensive queues. This intersection operates at overall LOS E with 67 seconds of delay per vehicle. Page 23
27 The capacity analysis also notes the following intersections with near capacity conditions for turning movements that are not related to the respective overall corridor operations: Main Street / North Street North Street / Elmwood Avenue North Street / Delaware Avenue Currently there are no known operational issues on Best Street or High Street within the study area. All remaining study intersections will operate at an overall Level of Service of C or better and LOS D or better for all turning movements during both study periods. Analysis results were representational of field observations. Tables summarizing Intersection Level of Service are provided at end of the Future section of this report starting on Page 45. Capacity analysis printouts are included in the Appendix. III. Base This section of the report establishes the Base upon which the proposed UB SMBS will be added to produce future conditions for the study intersections. A. Background Growth It is anticipated that the Estimated Time of Completion (ETC) for the project will be in A straight-line annual growth rate of 1.0% per year was applied to the 2013 Existing Volumes to account for ambient traffic volume growth within and adjacent to the study area. Figures detailing the 2016 volume growth adjustments are included in the Appendix. B. Ellicott Street Two-Way Conversion The City of Buffalo is converting Ellicott Street (Goodell Street to North Street) from one-way to two-way operation by the year It is our understanding that Ellicott Street will be one travel lane in each direction with parking accommodations on the east side of the street. For this study, a collaborative approach with the City of Buffalo s DPW was developed to estimate southbound traffic volumes along Ellicott Street. It was assumed that northbound traffic volumes patterns would remain consistent with existing/current conditions. The first step in this process was to estimate an approximate overall directional split for Ellicott Street. This was done by examining directional splits on adjacent roadways which produced an overall approximate directional split of 60/40. Next, to generate southbound traffic and produce the approximate directional split (assuming northbound traffic volumes would remain consistent at current conditions) on Ellicott Street, it was determined Page 24
28 approximately 20% of traffic movements onto southbound Main Street, Washington Street, and Michigan Avenue should be re-routed onto southbound Ellicott Street. Figures detailing the Ellicott Street two-way conversion re-routed traffic volumes are included in the Appendix. C. Future BNMC Developments Two other developments within the study area are anticipated to occur by the year 2016; these developments are: Women s and Children s Hospital of Buffalo (WCHOB) Conventus, Medical Office Building (Conventus) The projected volumes generated by these developments were extrapolated from the Children s Hospital of Buffalo Traffic Impact Study 4 (January 2012) and are included in the Appendix. The 2016 Base traffic volumes were then established by adding the re-routed Ellicott Street traffic and WCHOB/Conventus trips to the 2016 traffic volumes with 1% growth only. Figures 6 and 7 depict Base traffic volumes. Page 25
29 Page 26
30 Page 27
31 D. Base Operations & Capacity Analysis Capacity analysis conducted for Base for each of the study intersections indicated notable degradation in intersection operations can be expected due to the increase in traffic volumes. The degradation is highlighted in the tables summarizing Intersection Level of Service provided at end of the Future with Mitigation section of this report starting on Page 45. The impacts to the favored arterials to and from the BNMC area are as follows: Tupper Street Corridor: Will generally remain near capacity during the evening peak. Additional traffic may create longer queues and v/c s up to 0.90 (at Oak Street) on the mainline. The following intersections are projected to have movements that are approaching capacity as base conditions developments materialize: o Tupper Street / Ellicott Street o Tupper Street / Oak Street o Tupper Street / Elm Street Goodell Street Corridor: The Goodell Street/Oak Street intersection is projected to degrade from overall LOS B to LOS D, during the evening peak period, due to failing operations on the southbound approach. The southbound approach is projected to degrade to LOS F (138 seconds delay) with a 1.2 v/c. This is caused by the additional southbound traffic from both the Ellicott Street two-way conversion and the proposed WCHOB/Conventus developments. The other intersection that is projected to have movements with capacity constraints is: o Goodell Street / Main Street Michigan Avenue Corridor: During the evening peak, southbound queues on Michigan Avenue are projected to increase appreciably over existing conditions. The southbound approach to the Michigan Avenue/Carlton Street intersection is projected to degrade to LOS F (90 seconds delay) and become over capacity with a 1.10 v/c and extensive queuing during the evening peak. It is projected to also continue to experience long queues during the morning peak. The Michigan Avenue/Goodell Street intersection is projected to degrade from overall LOS E (67 seconds delay) to LOS F (114 seconds delay) due to increased delay on the southbound approach during the evening peak period. Existing extensive queues will become longer as base conditions developments materialize. Ellicott Street Corridor: The conversion of Ellicott Street from one-way to two-way traffic changes the operational dynamic of the roadway and travel patterns to some degree within the study and BMNC area. Two-way traffic will increase access within the BNMC and will also provide an alternate north/south roadway for traffic seeking to bypass Michigan Avenue to access/exit the major parking ramps on the north end of the BNMC. However, two-way operations will also reduce capacity in the northbound direction as a Page 28
32 result of it being reduced from two lanes to one lane. The High Street/Ellicott Street study intersection is projected to experience increased queuing in both the morning and evening peaks under Base. Other Intersections: The following remaining study intersections are projected to have capacity/queuing constraints for turning movements that are not related to their respective overall corridor operations during Base : Main Street / North Street North Street / Elmwood Avenue North Street / Delaware Avenue All remaining study intersections are projected to operate at an overall Level of Service of C or better and LOS D or better for all turning movements during both study periods. Tables summarizing Intersection Level of Service are provided at end of the Future section of this report. Capacity analysis printouts are included in the Appendix. IV. Future This section of the report documents the proposed development, the amount of traffic the development is anticipated to generate and the future operational conditions of the study intersections by A. Description of Proposed Development The project involves the construction of a new facility for the relocation of the University at Buffalo s (UB) School of Medicine and Biomedical Sciences (SMBS) within the Buffalo Niagara Medical Campus (BNMC) in the City of Buffalo, NY. The proposed facility is approximately 610,000 gross square feet and will include educational and laboratory facilities. This site is located on the parcel bordered by Main Street (west), High Street (north), Washington Street (east), and Carlton Street (south). There will be no parking at the proposed facility. Parking will be accommodated through garage ramps and surface lots within and surrounding the BNMC and through the use of transportation demand management (TDM) in the form light rail/park and ride from the UB South Campus. The UB School of Medicine & Biomedical Sciences Parking Study 5 (UB SMBS Parking Study), October 2012, was conducted to address the parking needs associated with this development. The recommendations of this study combined with conversations with UB were used to identify the parking locations to be utilized for the proposed facility in this study. Per the UB SMBS Parking Study, two tiers of parking were identified. Tier 1 parking (premium parking) is defined by a maximum walking distance of 1200 ft to the SMBS, with an 800 ft walking distance and sheltered parking being desirable. This equates to approximately a five minute walk. Given this criteria, Tier Page 29
33 1 parking will mainly consist of the MiGo Ramp and a proposed parking ramp (New Ramp) located on 1031 & 1021 Main Street (Scrubs property adjacent to the existing EGG Ramp). Tier 2 parking is all other facilities outside the (Tier 1) 1200 ft walking distance. Tier 2 parking will consist of surface lots on the BNMC outside the 1200 ft walking distance and the use of TDM in the form of light rail/park and ride from the UB South Campus. Refer to Figure 1, in the Introduction section of the report for parking locations. B. Trip Generation This project includes two distinct trip generator groups: Students Faculty/Staff/Visitors Trip estimations were based on parking demand in the UB SMBS Parking Study. A projected need of 1,104 total parking spaces is anticipated for the UB SMBS; each parking space translates into one trip. However, these trips are not all new trips to the BNMC and do not occur during both peak periods. Therefore, the following trip credits and adjustments were made: Approximately 90% of the year 3, 4, and 5 students and limited staff are currently travelling to the BNMC on a daily basis and, therefore, are accounted for in the study networks existing traffic volumes for both peak periods. As a result, a trip credit was applied to the 1,104 total trips to account for these students and staff for both peak periods. Approximately 50% of the year 1 and year 2 students will remain on campus past the evening peak; either moving to resident rooms for advanced training or to small group study rooms for personal or group work within the school. As a result, a trip credit was applied to the 1,104 total trips to account for these students in the evening peak. Utilizing ITE trip generation as a reference, crossover traffic amounting to 15% or about trips in addition to the trip generation basis was assumed for exiting and entering traffic during the morning and evening peaks, respectively. Table 1 summarizes the new trips for the two trip generator groups. Detailed trip generation calculations including credits and adjustments are included in the Appendix. Page 30
34 Table 1 New Trips Trip Type Weekday AM Weekday PM Enter Exit Total Enter Exit Total Student Faculty/Staff/Visitors Total New Trips Tier 1 parking trip estimations were based on the Anticipated Tier 1 Downtown Parking Demand with No New TDM from the UB SMBS Parking Study and are summarized in Table 2 Table 2 Tier 1 - New Trips Trip Type Weekday AM Weekday PM Enter Exit Total Enter Exit Total Student Faculty/Staff/Visitors Total Tier 2 parking trips include all remaining non Tier 1 trips and are summarized in Table 3. Table 3 Tier 2 - New Trips Trip Type Weekday AM Weekday PM Enter Exit Total Enter Exit Total Student Faculty/Staff/Visitors Total Page 31
35 Included in the Tier 2 trips are TDM trips, in the form of offsite parking available on the UB South Campus paired with light rail. These trips will not be realized within the study area and account for approximately 155 of the 442 Tier 2 trips during the morning peak and approximately 141 of the 401 Tier 2 trips during the evening peak in Table 3. To provide a conservative analysis it was assumed that no additional TDM will be instituted as a result of this project. Table 4 summarizes the Tier 1 and Tier 2 trips by parking location, which is needed to conduct trip distributions. Table 4 New Trips to Study Network By Parking Location & Tier Group Student Tier 1 Parking Tier 2 Parking Tier 1 Parking Tier 2 Parking Trip Type Faculty/Staff/Visitors Weekday AM Weekday PM Enter Exit Total Enter Exit Total MiGo Ramp New Ramp Tier 1 Total UB South Campus (Offsite) Surface Lots Tier 2 Total Student Total MiGo Ramp New Ramp Tier 1 Total UB South Campus (Offsite) Surface Lots Tier 2 Total Faculty/Staff/Visitors Total Total Trip Generation Page 32
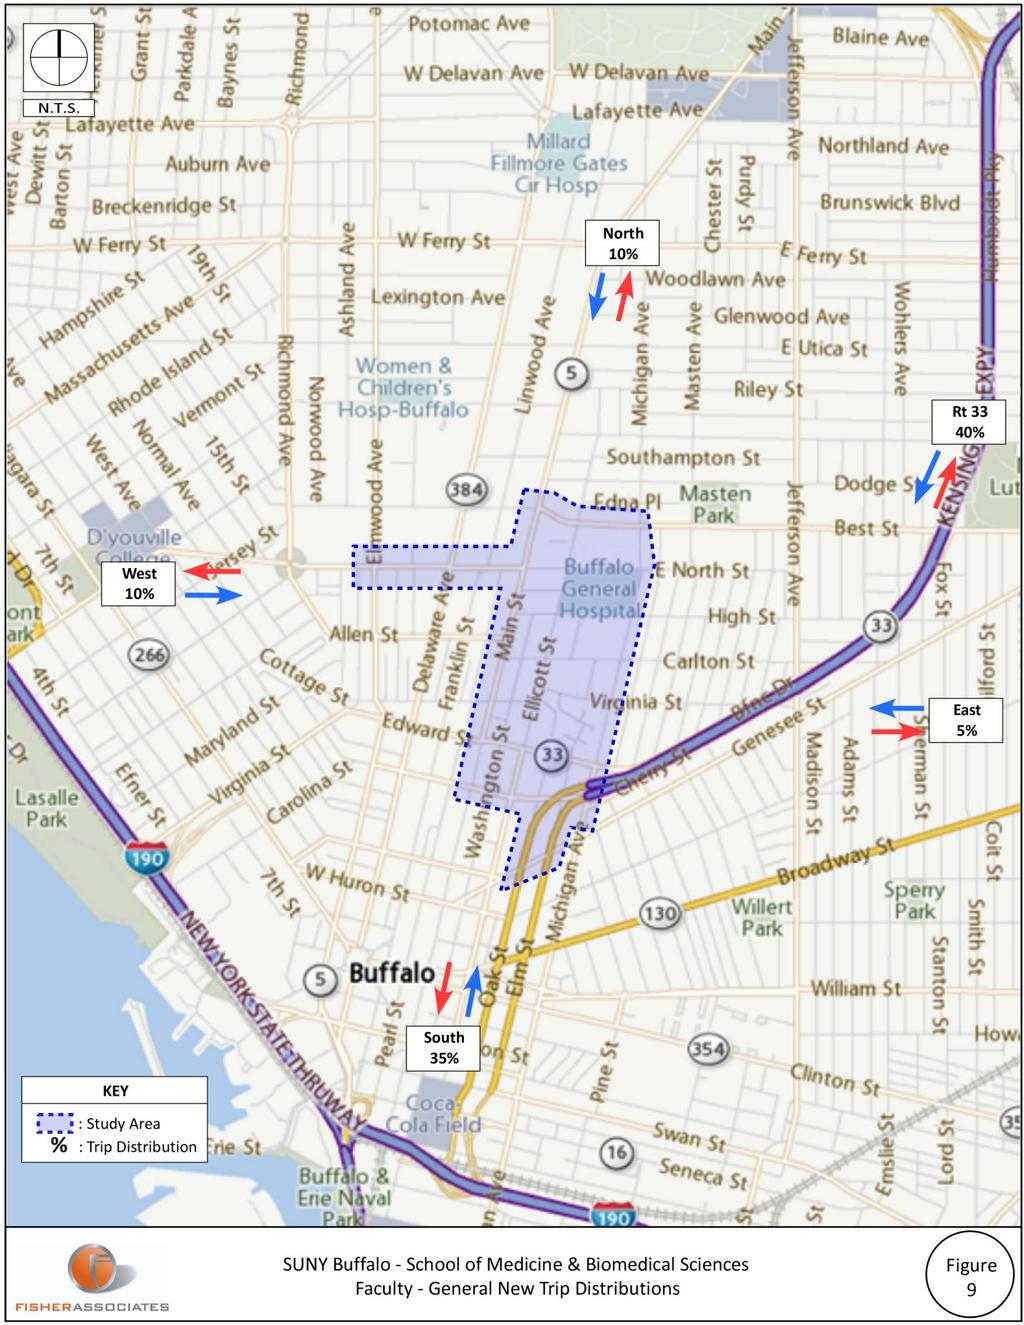
36 C. Trip Distribution a. Trip Distribution Percentages Overall trip distributions to and from the study area were based on population distribution data provided by UB for both trip generation groups; Students and Faculty/Staff/Visitors. Two sets of overall general trip distributions were developed due to the differences in origin/destinations for the Students and Faculty/Staff/Visitors as depicted on Figure 8 and Figure 9. Internal trip distribution percentages through the study intersections were calculated based on the overall entering/exiting distributions, the location of the parking locations, local knowledge of the network, operational constraints and the trip volume data as documented above in the Trip Generation section. Traffic volume data & discussions with the SUCF, UB, the City of Buffalo, GBNRTC, and NYSDOT indicated that, due to the heavy traffic volumes on Goodell Street and Tupper Street paired with the location of major parking ramps such as the MiGo ramp, some trips from Route 33 will divert to Best Street and High Street to access the BNMC. These diverted trips are reflected in the internal trip distribution percentages through the study intersections. Figures detailing the internal trip distribution percentages through the study intersections are included in the Appendix. b. Future Traffic Volumes All of the new trips generated by the UB SMBS, except for those that will use parking facilities on UB South Campus, were applied to Base to produce Future as depicted on Figures 10 and 11. Additional Future Trip volume detail is included in the Appendix. Page 33
37 Page 34
38 Page 35
39 Page 36
40 Page 37
41 D. Future Operations & Capacity Analysis Future intersection traffic volumes were applied to Base Condition s intersection geometry and controls (signal operations and stop signs) at all study intersections. Capacity analysis conducted for Future for each of the study intersections revealed further degradation in intersection operations can be expected due to the increase in traffic volumes from the UB SMBS. The degradation will follow the patterns observed under Base and is highlighted in the tables summarizing Intersection Level of Service provided at end of the Future with Mitigation section of this report starting on Page 45. The impacts to the favored arterials utilized by traffic within the BNMC area are as follows: Tupper Street: Will be near capacity during the evening peak. Additional traffic will create longer queues and v/c s up to 0.94 (Oak Street) on the mainline. The following intersections will have movements that are projected to experience capacity constraints and/or queuing issues: o Tupper Street / Ellicott Street o Tupper Street / Oak Street o Tupper Street / Elm Street Goodell Street: Will have intersections with individual movements that are projected to experience failing LOS, capacity constraints and/or queuing issues due to the increase in traffic volumes; they are: o Goodell Street / Michigan Avenue o Goodell Street / Oak Street o Goodell Street / Main Street Additionally, the unsignalized Goodell Street / Elm Street intersection is projected to experience tenuous operations. The northbound stop controlled left turn from Elm Street onto Goodell Street is projected to operate at LOS c during the morning peak period. However, the operations of adjacent intersections have a direct impact on the Goodell Street / Elm Street intersections operations. A sensitivity analysis indicated that during the morning peak, minor increases in volumes at the Goodell Street / Elm Street intersection or at adjacent intersections may increase delays and queues resulting in failing operations at the Goodell Street / Elm Street intersection. Michigan Avenue: Northbound queues will become extensive for short periods during the morning peak period. Southbound traffic will be near or exceed capacity at some intersections on Michigan Avenue and queues will continue to become more extensive during the evening peak. The following intersections are projected to experience failing LOS, capacity constraints and/or queuing issues: o Michigan Avenue / Goodell Street o Michigan Avenue / Virginia Street o Michigan Avenue / Carlton Street o Michigan Avenue / High Street Page 38
42 Ellicott Street Corridor: The Ellicott Street / High Street intersection is anticipated to experience notable degradation in operations during both the morning and evening peaks under Future. Other Intersections: The following remaining study intersections are projected to have turning movements with failing LOS, capacity constraints and/or queuing issues during Future : Main Street / High Street Main Street / North Street Main Street / Best Street North Street / Elmwood Avenue North Street / Delaware Avenue All remaining study intersections are projected to operate at an overall Level of Service of C or better and LOS D or better for all turning movements during both study periods. Tables summarizing Intersection Level of Service are provided at end of this section of the report starting on Page 45. Capacity analysis printouts are included in the Appendix. E. Cumulative Impacts of Development Under Existing, movements at multiple intersections are nearing capacity indicated by v/c ratios, LOS and queue lengths. Under Base these measures degrade and the intersections will underserve traffic as development continues. The addition of the WCHOB and Conventus developments under Base will add approximately 680 to 1,000 trips per peak to the study network which will notably degrade intersection operations as discussed in the Base section of the report. If these two developments were not assumed the UB SMBS project alone would add approximately 970 to 1,115 trips per peak to the study network. As a result, it is recognized that the UB SMBS project will contribute to the further reduction in intersection operations. The breakdown of the percent of new trips to study network generated by the three developments is approximately: WCHOB: 10% Conventus: 35% UB SMBS: 55% There is a high likelihood that these three developments will be constructed concurrently and considering current operations, the compounding effect of one potential development layered over the other in no particular order as well as the application of a regional ambient growth rate leads to the conclusion that no one entity is responsible for all of the degradation in intersection operations. Therefore, a set of comprehensive mitigation measures have been developed that address the cumulative impacts of all three projects. Page 39
43 V. Future with Mitigation This section of the report documents the recommended mitigation measures. A. Approach The promotion of TDM applications such as increased use of public transportation options is recommended as a general mitigation measure to help reduce traffic congestion within the study network. However, network specific mitigation measures were examined to offset the operational deficiencies should the increased use of TDM applications not come to fruition. The following is the approach to the development of these mitigation measures. The study area is a complex urban transportation network where intersections function interdependently and where mitigating an issue at one location (intersection) may translate into another issue at another location. Hence, mitigation recommendations were developed first from an overall network approach perspective and then by intersection turning movements with operational deficiencies, as possible. As a result, overall intersection and arterial operational impacts are offset, but there may be specific intersection movements, particularly side street approaches that experience increases in delay. Also, as noted earlier under Existing, generally accepted operational thresholds in an urban/city environment, are an overall intersection LOS D and an intersection turning movement LOS E for signal controlled intersections ; and a LOS e for stop controlled intersections. Additionally, it is common that commuter peak traffic experiences (and tolerates) operations that are near or at capacity, represented by a v/c of 0.95 or less. Therefore, these transportation network understandings and generally accepted operational thresholds guided the mitigation recommendations for offsetting the anticipated operational deficiencies. Page 40
APPENDIX C1 TRAFFIC ANALYSIS DESIGN YEAR TRAFFIC ANALYSIS
 APPENDIX C1 TRAFFIC ANALYSIS DESIGN YEAR TRAFFIC ANALYSIS DESIGN YEAR TRAFFIC ANALYSIS February 2018 Highway & Bridge Project PIN 6754.12 Route 13 Connector Road Chemung County February 2018 Appendix
EXECUTIVE SUMMARY. The following is an outline of the traffic analysis performed by Hales Engineering for the traffic conditions of this project.
 EXECUTIVE SUMMARY This study addresses the traffic impacts associated with the proposed Shopko redevelopment located in Sugarhouse, Utah. The Shopko redevelopment project is located between 1300 East and
LAWRENCE TRANSIT CENTER LOCATION ANALYSIS 9 TH STREET & ROCKLEDGE ROAD / 21 ST STREET & IOWA STREET LAWRENCE, KANSAS
 LAWRENCE TRANSIT CENTER LOCATION ANALYSIS 9 TH STREET & ROCKLEDGE ROAD / 21 ST STREET & IOWA STREET LAWRENCE, KANSAS TRAFFIC IMPACT STUDY FEBRUARY 214 OA Project No. 213-542 TABLE OF CONTENTS 1. INTRODUCTION...
INDUSTRIAL DEVELOPMENT
 INDUSTRIAL DEVELOPMENT Traffic Impact Study Plainfield, Illinois August 2018 Prepared for: Seefried Industrial Properties, Inc. TABLE OF CONTENTS Executive Summary 2 Introduction 3 Existing Conditions
MINERVA PARK SITE TRAFFIC IMPACT STUDY M/I HOMES. September 2, 2015
 5500 New Albany Road Columbus, Ohio 43054 Phone: 614.775.4500 Fax: 614.775.4800 Toll Free: 1-888-775-EMHT emht.com 2015-1008 MINERVA PARK SITE TRAFFIC IMPACT STUDY M/I HOMES September 2, 2015 Engineers
Traffic Engineering Study
 Traffic Engineering Study Bellaire Boulevard Prepared For: International Management District Technical Services, Inc. Texas Registered Engineering Firm F-3580 November 2009 Executive Summary has been requested
TRAFFIC IMPACT STUDY. USD #497 Warehouse and Bus Site
 TRAFFIC IMPACT STUDY for USD #497 Warehouse and Bus Site Prepared by: Jason Hoskinson, PE, PTOE BG Project No. 16-12L July 8, 216 145 Wakarusa Drive Lawrence, Kansas 6649 T: 785.749.4474 F: 785.749.734
King County Metro. Columbia Street Transit Priority Improvements Alternative Analysis. Downtown Southend Transit Study. May 2014.
 King County Metro Columbia Street Transit Priority Improvements Alternative Analysis Downtown Southend Transit Study May 2014 Parametrix Table of Contents Introduction... 1 Methodology... 1 Study Area...
TRAFFIC IMPACT ANALYSIS
 TRAFFIC IMPACT ANALYSIS Emerald Isle Commercial Development Prepared by SEPI Engineering & Construction Prepared for Ark Consulting Group, PLLC March 2016 I. Executive Summary A. Site Location The Emerald
Proposed location of Camp Parkway Commerce Center. Vicinity map of Camp Parkway Commerce Center Southampton County, VA
 Proposed location of Camp Parkway Commerce Center Vicinity map of Camp Parkway Commerce Center Southampton County, VA Camp Parkway Commerce Center is a proposed distribution and industrial center to be
To: File From: Adrian Soo, P. Eng. Markham, ON File: Date: August 18, 2015
 Memo To: From: Adrian Soo, P. Eng. Markham, ON : 165620021 Date: Reference: E.C. Row Expressway, Dominion Boulevard Interchange, Dougall Avenue Interchange, and Howard 1. Review of Interchange Geometry
V. DEVELOPMENT OF CONCEPTS
 Martin Luther King, Jr. Drive Extension FINAL Feasibility Study Page 9 V. DEVELOPMENT OF CONCEPTS Throughout the study process several alternative alignments were developed and eliminated. Initial discussion
Transit City Etobicoke - Finch West LRT
 Delcan Corporation Transit City Etobicoke - Finch West LRT APPENDIX D Microsimulation Traffic Modeling Report March 2010 March 2010 Appendix D CONTENTS 1.0 STUDY CONTEXT... 2 Figure 1 Study Limits... 2
King Soopers #116 Thornton, Colorado
 Traffic Impact Study King Soopers #116 Thornton, Colorado Prepared for: Galloway & Company, Inc. T R A F F I C I M P A C T S T U D Y King Soopers #116 Thornton, Colorado Prepared for Galloway & Company
Traffic Impact Analysis. Alliance Cole Avenue Residential Site Dallas, Texas. Kimley-Horn and Associates, Inc. Dallas, Texas.
 Traffic Impact Analysis Alliance Cole Avenue Residential Site Dallas, Texas February 15, 2018 Kimley-Horn and Associates, Inc. Dallas, Texas Project #064524900 Registered Firm F-928 Traffic Impact Analysis
RICHMOND OAKS HEALTH CENTRE 6265 PERTH STREET OTTAWA, ONTARIO TRANSPORTATION BRIEF. Prepared for: Guycoki (Eastern) Limited.
 Limited.") RICHMOND OAKS HEALTH CENTRE 6265 PERTH STREET OTTAWA, ONTARIO TRANSPORTATION BRIEF Prepared for: Guycoki (Eastern) Limited June 16, 2016 116-638 Brief_1.doc D. J. Halpenny & Associates Ltd. Consulting
RICHMOND OAKS HEALTH CENTRE 6265 PERTH STREET OTTAWA, ONTARIO TRANSPORTATION BRIEF Prepared for: Guycoki (Eastern) Limited June 16, 2016 116-638 Brief_1.doc D. J. Halpenny & Associates Ltd. Consulting
Traffic Impact Analysis West Street Garden Plots Improvements and DuPage River Park Garden Plots Development Naperville, Illinois
 Traffic Impact Analysis West Street Garden Plots Improvements and DuPage River Park Garden Plots Development Naperville, Illinois Submitted by April 9, 2009 Introduction Kenig, Lindgren, O Hara, Aboona,
HUMC/Mountainside Hospital Redevelopment Plan
 Traffic and Parking Analysis HUMC/Mountainside Hospital Redevelopment Plan in Glen Ridge Borough and Montclair Township PREPARED FOR H2M 119 Cherry Hill Road, Suite 110 Parsippany, NJ 07054 862.207.5900
BARRHAVEN FELLOWSHIP CRC 3058 JOCKVALE ROAD OTTAWA, ONTARIO TRANSPORTATION BRIEF. Prepared for:
 BARRHAVEN FELLOWSHIP CRC 3058 JOCKVALE ROAD OTTAWA, ONTARIO TRANSPORTATION BRIEF Prepared for: Barrhaven Fellowship CRC 3058 Jockvale Road Ottawa, ON K2J 2W7 December 7, 2016 116-649 Report_1.doc D. J.
PROJECT: Wilkinson Road Corridor Improvement Traffic Management Planning Project SUBJECT: Traffic Analysis
 TECHNICAL MEMORANDUM DATE: September 10, 2014 PROJECT 5861.03 NO: PROJECT: Wilkinson Road Corridor Improvement Traffic Management Planning Project SUBJECT: Traffic Analysis TO: Steve Holroyd - District
Craig Scheffler, P.E., PTOE HNTB North Carolina, P.C. HNTB Project File: Subject
 TECHNICAL MEMORANDUM To Kumar Neppalli Traffic Engineering Manager Town of Chapel Hill From Craig Scheffler, P.E., PTOE HNTB North Carolina, P.C. Cc HNTB Project File: 38435 Subject Obey Creek TIS 2022
Clean Harbors Canada, Inc.
 Clean Harbors Canada, Inc. Proposed Lambton Landfill Expansion Environmental Assessment Terms of Reference Transportation Assessment St. Clair Township, Ontario September 2009 itrans Consulting Inc. 260
RTE. 1 at RTE. 637 & RTE. 639
 INTERSECTION SAFETY STUDY Prepared for: Virginia Department of Transportation Central Region Operations Traffic Engineering (UPC #81378, TO 12-092) DAVENPORT Project Number: 13-368 / /2014 RTE. 1 at RTE.
THE CORNERSTONE APARTMENTS TRAFFIC IMPACT STUDY R&M PROJECT NO
 THE CORNERSTONE APARTMENTS SITUATED AT N/E/C OF STAUDERMAN AVENUE AND FOREST AVENUE VILLAGE OF LYNBROOK NASSAU COUNTY, NEW YORK TRAFFIC IMPACT STUDY R&M PROJECT NO. 2018-089 September 2018 50 Elm Street,
Date: February 7, 2017 John Doyle, Z-Best Products Robert Del Rio. T.E. Z-Best Traffic Operations and Site Access Analysis
 Memorandum Date: February 7, 07 To: From: Subject: John Doyle, Z-Best Products Robert Del Rio. T.E. Z-Best Traffic Operations and Site Access Analysis Introduction Hexagon Transportation Consultants, Inc.
TIMBERVINE TRANSPORTATION IMPACT STUDY FORT COLLINS, COLORADO JANUARY Prepared for:
 TIMBERVINE TRANSPORTATION IMPACT STUDY FORT COLLINS, COLORADO JANUARY 2014 Prepared for: Hartford Companies 1218 W. Ash Street Suite A Windsor, Co 80550 Prepared by: DELICH ASSOCIATES 2272 Glen Haven Drive
Alpine Highway to North County Boulevard Connector Study
 Alpine Highway to North County Boulevard Connector Study prepared by Avenue Consultants March 16, 2017 North County Boulevard Connector Study March 16, 2017 Table of Contents 1 Summary of Findings... 1
Traffic Impact Study Speedway Gas Station Redevelopment
 Traffic Impact Study Speedway Gas Station Redevelopment Warrenville, Illinois Prepared For: Prepared By: April 11, 2018 Table of Contents 1. Introduction... 1 2. Existing Conditions... 4 Site Location...
TRAFFIC DATA. Existing Derousse Ave./River Rd. AM LOS Analysis Existing Derousse Ave./River Rd. PM LOS Analysis
 Appendix E NJ TRANSIT Pennsauken Junction Transit Center and Park & Ride RiverLINE and Atlantic City Line Pennsauken Township, Camden County, New Jersey TRAFFIC DATA Background Traffic Information for
2.0 Development Driveways. Movin Out June 2017
 Movin Out June 2017 1.0 Introduction The proposed Movin Out development is a mixed use development in the northeast quadrant of the intersection of West Broadway and Fayette Avenue in the City of Madison.
APPENDIX E. Traffic Analysis Report
 APPENDIX E Traffic Analysis Report THIS PAGE INTENTIONALLY BLANK EAGLE RIVER TRAFFIC MITIGATION PHASE I OLD GLENN HIGHWAY/EAGLE RIVER ROAD INTERSECTION IMPROVEMENTS TRAFFIC ANALYSIS Eagle River, Alaska
Table of Contents INTRODUCTION... 3 PROJECT STUDY AREA Figure 1 Vicinity Map Study Area... 4 EXISTING CONDITIONS... 5 TRAFFIC OPERATIONS...
 Crosshaven Drive Corridor Study City of Vestavia Hills, Alabama Table of Contents INTRODUCTION... 3 PROJECT STUDY AREA... 3 Figure 1 Vicinity Map Study Area... 4 EXISTING CONDITIONS... 5 TRAFFIC OPERATIONS...
MERIVALE PRIORITY SQUARE 2852 MERIVALE ROAD CITY OF OTTAWA TRANSPORTATION BRIEF. Prepared for: ONT Inc. 25 Winding Way Nepean, Ontario K2C 3H1
 MERIVALE PRIORITY SQUARE 2852 MERIVALE ROAD CITY OF OTTAWA TRANSPORTATION BRIEF Prepared for: 2190986ONT Inc. 25 Winding Way Nepean, Ontario K2C 3H1 October 6, 2010 110-502 Report_1.doc D. J. Halpenny
Appendix H: Construction Impacts H-2 Transportation
 Appendix H: Construction Impacts H-2 Transportation \ AECOM 71 W. 23 rd Street New York, NY 10010 www.aecom.com 212 366 6200 tel 212 366 6214 fax Memorandum To CC Subject Robert Conway Donald Tone Construction
NEWCASTLE MIDDLE SCHOOL Traffic Impact Analysis
 Gibson Traffic Consultants 2802 Wetmore Avenue Suite 220 Everett, WA 98201 425.339.8266 NEWCASTLE MIDDLE SCHOOL Traffic Impact Analysis Prepared for: Renton School District Jurisdiction: City of Newcastle
MILLERSVILLE PARK TRAFFIC IMPACT ANALYSIS ANNE ARUNDEL COUNTY, MARYLAND
 MILLERSVILLE PARK TRAFFIC IMPACT ANALYSIS ANNE ARUNDEL COUNTY, MARYLAND Prepared for: Department of Public Works Anne Arundel County Prepared by: URS Corporation 4 North Park Drive, Suite 3 Hunt Valley,
DEVELOPMENT PROPERTY 1627 MAXIME STREET CITY OF OTTAWA TRANSPORTATION OVERVIEW. Prepared for: Subhas Bhargava. July 9, Overview_1.
 DEVELOPMENT PROPERTY 1627 MAXIME STREET CITY OF OTTAWA TRANSPORTATION OVERVIEW Prepared for: Subhas Bhargava July 9, 2015 115-620 Overview_1.doc D. J. Halpenny & Associates Ltd. Consulting Transportation
Interstate Operations Study: Fargo-Moorhead Metropolitan Area Simulation Results
 NDSU Dept #2880 PO Box 6050 Fargo, ND 58108-6050 Tel 701-231-8058 Fax 701-231-6265 www.ugpti.org www.atacenter.org Interstate Operations Study: Fargo-Moorhead Metropolitan Area 2025 Simulation Results
Traffic Impact Analysis 5742 BEACH BOULEVARD MIXED USE PROJECT
 Traffic Impact Analysis 5742 BEACH BOULEVARD MIXED USE PROJECT CITY OF BUENA PARK Prepared by Project No. 14139 000 April 17 th, 2015 DKS Associates Jeffrey Heald, P.E. Rohit Itadkar, T.E. 2677 North Main
Interstate Operations Study: Fargo-Moorhead Metropolitan Area Simulation Output
 NDSU Dept #2880 PO Box 6050 Fargo, ND 58108-6050 Tel 701-231-8058 Fax 701-231-6265 www.ugpti.org www.atacenter.org Interstate Operations Study: Fargo-Moorhead Metropolitan Area 2015 Simulation Output Technical
Transportation & Traffic Engineering
 Transportation & Traffic Engineering 1) Project Description This report presents a summary of findings for a Traffic Impact Analysis (TIA) performed by A+ Engineering, Inc. for the Hill Country Family
TRAFFIC SIGNAL DESIGN REPORT KING OF PRUSSIA ROAD & RAIDER ROAD RADNOR TOWNSHIP PENNSYLVANIA
 TRAFFIC SIGNAL DESIGN REPORT KING OF PRUSSIA ROAD & RAIDER ROAD RADNOR TOWNSHIP PENNSYLVANIA PREPARED FOR: UNIVERSITY OF PENNSYLVANIA HEALTH SYSTEM 34 CIVIC CENTER BOULEVARD PHILADELPHIA, PA 1987 (61)
The major roadways in the study area are State Route 166 and State Route 33, which are shown on Figure 1-1 and described below:
 3.5 TRAFFIC AND CIRCULATION 3.5.1 Existing Conditions 3.5.1.1 Street Network DRAFT ENVIRONMENTAL IMPACT REPORT The major roadways in the study area are State Route 166 and State Route 33, which are shown
Traffic Feasibility Study
 Traffic Feasibility Study Town Center South Robbinsville Township, Mercer County, New Jersey December 19, 2017 Prepared For Robbinsville Township Department of Community Development 2298 Route 33 Robbinsville,
Appendix C-5: Proposed Refinements Rail Operations and Maintenance Facility (ROMF) Traffic Impact Analysis. Durham-Orange Light Rail Transit Project
 Traffic Impact Analysis. Durham-Orange Light Rail Transit Project") Appendix C-5: Proposed Refinements Rail Operations and Maintenance Facility (ROMF) Traffic Impact Analysis Durham-Orange Light Rail Transit Project July 25, 218 ROMF Transportation Impact Analysis Version
Appendix C-5: Proposed Refinements Rail Operations and Maintenance Facility (ROMF) Traffic Impact Analysis Durham-Orange Light Rail Transit Project July 25, 218 ROMF Transportation Impact Analysis Version
IMPROVEMENT CONCEPTS
 IMPROVEMENT CONCEPTS for the South Novato Transit Hub Study Prepared by: January 11, 2010 DKS Associates With Wilbur Smith Associates IMPROVEMENT CONCEPTS Chapter 1: Introduction 1. INTRODUCTION The strategic
Traffic Impact Study for Proposed Olive Boulevard Development
 Traffic Impact Study for Proposed 11330 Olive Boulevard Development Creve Coeur, Missouri July 7, 2017 Prepared For: 11330 Olive Boulevard Development 11330 Olive Boulevard Creve Coeur, Missouri 63141
Vanier Parkway and Presland Road Residential Development Transportation Impact Study
 Vanier Parkway and Presland Road Residential Development Transportation Impact Study Final Report (Revised) March 2011 Submitted to: Groupe Lépine Ottawa Project No. 09-1613 Submitted by: Groupe Lépine
Traffic Impact Study for the proposed. Town of Allegany, New York. August Project No Prepared For:
 Appendix B SRF Traffic Study (Revised November 2005) Draft Environmental Impact Statement University Commons Town of Allegany, Cattaraugus County, NY December 2005 Traffic Impact Study for the proposed
TABLE OF CONTENTS 1.0 INTRODUCTION AND SUMMARY Purpose of Report and Study Objectives... 2
 TABLE OF CONTENTS 1.0 INTRODUCTION AND SUMMARY 1 1.1 Purpose of Report and Study Objectives... 2 1.2 Executive Summary... 3 1.2.1 Site Location and Study Area... 3 1.2.2 Development Description... 3 1.2.3
TRAFFIC IMPACT STUDY FOR SONIC DRIVE-IN RESTAURANT. Vallejo, CA. Prepared For:
 TRAFFIC IMPACT STUDY FOR SONIC DRIVE-IN RESTAURANT Vallejo, CA Prepared For: ELITE DRIVE-INS, INC. 2190 Meridian Park Blvd, Suite G Concord, CA 94520 Prepared By: KD Anderson & Associates 3853 Taylor Road,
Appendix 5. Haymeadow Interim Traffic Analysis
 Appendix 5 Haymeadow Interim Traffic Analysis 20 MEMORANDUM To: From: Rick Pylman Gary Brooks Bill Fox Date: September 15, 2016 Project: Subject: Haymeadow Evaluation of interim access configuration Currently
West Hills Shopping Centre Lowe s Expansion Traffic Impact Study
 West Hills Shopping Centre Lowe s Expansion Traffic Impact Study Prepared for: Armel Corporation January 2015 Paradigm Transportation Solutions Ltd. 22 King Street South, Suite 300 Waterloo ON N2J 1N8
BROWARD BOULEVARD CORRIDOR TRANSIT STUDY
 BROWARD BOULEVARD CORRIDOR TRANSIT STUDY FM # 42802411201 EXECUTIVE SUMMARY July 2012 GOBROWARD Broward Boulevard Corridor Transit Study FM # 42802411201 Executive Summary Prepared For: Ms. Khalilah Ffrench,
APPENDIX B Traffic Analysis
 APPENDIX B Traffic Analysis Rim of the World Unified School District Reconfiguration Prepared for: Rim of the World School District 27315 North Bay Road, Blue Jay, CA 92317 Prepared by: 400 Oceangate,
Bennett Pit. Traffic Impact Study. J&T Consulting, Inc. Weld County, Colorado. March 3, 2017
 Bennett Pit Traffic Impact Study J&T Consulting, Inc. Weld County, Colorado March 3, 217 Prepared By: Sustainable Traffic Solutions, Inc. http://www.sustainabletrafficsolutions.com/ Joseph L. Henderson,
Proposed Hotel and Restaurant Development
 Traffic Impact Study Proposed Hotel and Restaurant Development Marbledale Road Tuckahoe, NY PREPARED FOR BILLWIN DEVELOPMENT AFFILIATES, LLC 365 WHITE PLAINS ROAD EASTCHESTER, NY. 10709 PREPARED BY Engineering
Proposed Commercial Service at Paine Field Traffic Impact Analysis
 Gibson Traffic Consultants 80 Wetmore Avenue Suite 0 Everett, WA 980.9.86 Prepared for: Federal Aviation Administration July 0 GTC #09-07 TABLE OF CONTENTS. EXECUTIVE SUMMARY.... PROJECT IDENTIFICATION....
Volume 1 Traffic Impact Analysis Turtle Creek Boulevard Dallas, Texas. Kimley-Horn and Associates, Inc. Dallas, Texas.
 Volume 1 Traffic Impact Analysis 2727 Dallas, Texas June 18, 2018 Kimley-Horn and Associates, Inc. Dallas, Texas Project #064523000 Registered Firm F-928 Traffic Impact Analysis 2727 Dallas, Texas Prepared
BERKELEY DOWNTOWN AREA PLAN PROGRAM ENVIRONMENTAL IMPACT REPORT TRAFFIC IMPACT ANALYSIS
 BERKELEY DOWNTOWN AREA PLAN PROGRAM ENVIRONMENTAL IMPACT REPORT TRAFFIC IMPACT ANALYSIS Prepared for: City of Berkeley Prepared by: REVISED JANUARY 9, 2009 Berkeley Downtown Area Plan Program EIR Traffic
Traffic Analysis for Bon Air Bridge Mitigation Magnolia Storm Water Quality Project
 Memo To: Paul DiDonato, ATI Architects and Engineers From: David Parisi, PE and Ashley Tam, EIT Date: February 23, 216 Subject: Traffic Analysis for Bon Air Bridge Mitigation Magnolia Storm Water Quality
Lacey Gateway Residential Phase 1
 Lacey Gateway Residential Phase Transportation Impact Study April 23, 203 Prepared for: Gateway 850 LLC 5 Lake Bellevue Drive Suite 02 Bellevue, WA 98005 Prepared by: TENW Transportation Engineering West
Appendix C. Traffic Study
 Appendix C Traffic Study TABLE OF CONTENTS SECTION Executive Summary PAGE 1.0 Introduction... 1 1.1 Scope of Work... 1 1.2 Study Area... 2 2.0 Project Description... 3 2.1 Site Access... 4 2.2 Pedestrian
Oakbrook Village Plaza City of Laguna Hills
 Oakbrook Village Plaza City of Laguna Hills Traffic Impact Analysis Prepared by: HDR Engineering 3230 El Camino Real, Suite 200 Irvine, CA 92602 October 2012 Revision 3 D-1 Oakbrook Village Plaza Laguna
TRANSPORTATION TECHNICAL REPORT
 TRANSPORTATION TECHNICAL REPORT for Sunrise Elementary School Replacement PREPARED FOR: Puyallup School District PREPARED BY: 6544 NE 61 st Street, Seattle, WA 98115 ph: (26) 523-3939 fx: (26) 523-4949
Construction Realty Co.
 MEMORANDUM TO: FROM : Jeff Pickus Construction Realty Co. Luay R. Aboona, PE Principal 9575 West Higgins Road, Suite 400 Rosemont, Illinois 60018 p: 847-518-9990 f: 847-518-9987 DATE: May 22, 2014 SUBJECT:
TRANSPORTATION STUDY FOR THE 8899 BEVERLY BOULEVARD PROJECT
 DRAFT TRANSPORTATION STUDY FOR THE 8899 BEVERLY BOULEVARD PROJECT WEST HOLLYWOOD, CALIFORNIA NOVEMBER 2013 PREPARED FOR BEVERLY BOULEVARD ASSOCIATION PREPARED BY DRAFT TRANSPORTATION STUDY FOR THE 8899
Mineola Village Green
 Traffic Impact Analysis Report Mineola Village Green 199 2 nd Street Mineola, New York Prepared for Mineola Metro LLC c/o Lalezarian Properties 1999 Marcus Avenue, Suite 310 Lake Success, NY 11042 Prepared
TRANSPORTATION REVIEW
 TRANSPORTATION REVIEW - PROPOSED MIX OF LAND USES IS CONSISTENT WITH THE CITY S UNDER THE GRANVILLE BRIDGE POLICIES THAT AIM TO MEET NEIGHBOURING RESIDENTS SHOPPING NEEDS AND REDUCE RELIANCE ON AUTOMOBILE
Proposed Inn at Bellefield Traffic Impact Assessment
 Proposed Inn at Bellefield Traffic Impact Assessment Town of Hyde Park Dutchess County, New York Prepared for: T-Rex Hyde Park Owner LLC 500 Mamroneck Avenue, Suite 300 Harrison, NY 10528 June 21, 2017
Escondido Marriott Hotel and Mixed-Use Condominium Project TRAFFIC IMPACT ANALYSIS REPORT
 Escondido Marriott Hotel and Mixed-Use Condominium Project TRAFFIC IMPACT ANALYSIS REPORT Prepared for Phelps Program Management 420 Sixth Avenue, Greeley, CO 80632 Prepared by 5050 Avenida Encinas, Suite
Traffic Management Plan and Queuing Analysis Lakehill Preparatory School Z Hillside Drive, Dallas, TX October 27, 2015
 Traffic Management Plan and Queuing Analysis Lakehill Preparatory School Z145-235 2720 Hillside Drive, Dallas, TX October 27, 2015 Introduction: The Lakehill Preparatory School is located on the northeast
INTERSECTION ANALYSIS PARK AVENUE AND BRADDOCK ROAD (FROSTBURG, MD) FOR LENHART TRAFFIC CONSULTING, INC.
 FOR LENHART TRAFFIC CONSULTING, INC.") INTERSECTION ANALYSIS FOR PARK AVENUE AND BRADDOCK ROAD (FROSTBURG, MD) Prepared for: City of Frostburg, Maryland & Allegany County Commissioners Prepared by: LENHART TRAFFIC CONSULTING, INC. TRAFFIC ENGINEERING
INTERSECTION ANALYSIS FOR PARK AVENUE AND BRADDOCK ROAD (FROSTBURG, MD) Prepared for: City of Frostburg, Maryland & Allegany County Commissioners Prepared by: LENHART TRAFFIC CONSULTING, INC. TRAFFIC ENGINEERING
Table Existing Traffic Conditions for Arterial Segments along Construction Access Route. Daily
 5.8 TRAFFIC, ACCESS, AND CIRCULATION This section describes existing traffic conditions in the project area; summarizes applicable regulations; and analyzes the potential traffic, access, and circulation
Metropolitan Freeway System 2013 Congestion Report
 Metropolitan Freeway System 2013 Congestion Report Metro District Office of Operations and Maintenance Regional Transportation Management Center May 2014 Table of Contents PURPOSE AND NEED... 1 INTRODUCTION...
2016 Congestion Report
 2016 Congestion Report Metropolitan Freeway System May 2017 2016 Congestion Report 1 Table of Contents Purpose and Need...3 Introduction...3 Methodology...4 2016 Results...5 Explanation of Percentage Miles
Section 5.0 Traffic Information
 Section 5.0 Traffic Information 10.0 TRANSPORTATION MDM Transportation Consultants, Inc. (MDM) has prepared an evaluation of transportation impacts for the proposed evaluation for the expansion of the
TRAFFIC IMPACT ANALYSIS FOR. McDONALD S RESTAURANT IN CARMICAEL Sacramento County, CA. Prepared For:
 TRAFFIC IMPACT ANALYSIS FOR McDONALD S RESTAURANT IN CARMICAEL Sacramento County, CA Prepared For: McDonald s USA, LLC Pacific Sierra Region 2999 Oak Road, Suite 900 Walnut Creek, CA 94597 Prepared By:
MONTEREY BAY AQUARIUM RESEARCH INSTITUTE (MBARI) MASTER PLAN UPDATE MOSS LANDING, CALIFORNIA
 MASTER PLAN UPDATE MOSS LANDING, CALIFORNIA") MONTEREY BAY AQUARIUM RESEARCH INSTITUTE (MBARI) MASTER PLAN UPDATE MOSS LANDING, CALIFORNIA TRAFFIC IMPACT ANALYSIS Administrative Draft Report Prepared For Monterey Bay Aquarium Research Institute Moss
MONTEREY BAY AQUARIUM RESEARCH INSTITUTE (MBARI) MASTER PLAN UPDATE MOSS LANDING, CALIFORNIA TRAFFIC IMPACT ANALYSIS Administrative Draft Report Prepared For Monterey Bay Aquarium Research Institute Moss
TABLE OF CONTENTS SECTION PAGE. Executive Summary... xii
 TABLE OF CONTENTS SECTION PAGE Executive Summary... xii 1.0 Introduction... 1 1.1 Study Area... 2 1.2 Traffic Impact Analysis Scenarios... 4 1.3 Study Area - City of Orange... 4 2.0 Project Description
Subarea Study. Manning Avenue (CSAH 15) Corridor Management and Safety Improvement Project. Final Version 1. Washington County.
 Corridor Management and Safety Improvement Project. Final Version 1. Washington County.") Subarea Study Manning Avenue (CSAH 15) Corridor Management and Safety Improvement Project Final Version 1 Washington County June 12, 214 SRF No. 138141 Table of Contents Introduction... 1 Forecast Methodology
Subarea Study Manning Avenue (CSAH 15) Corridor Management and Safety Improvement Project Final Version 1 Washington County June 12, 214 SRF No. 138141 Table of Contents Introduction... 1 Forecast Methodology
Appendix J Traffic Impact Study
 MRI May 2012 Appendix J Traffic Impact Study Level 2 Traffic Assessment Limited Impact Review Appendix J [This page was left blank intentionally.] www.sgm-inc.com Figure 1. Site Driveway and Trail Crossing
LCPS Valley Service Center
 Traffic Impact Study LCPS Valley Service Center Loudoun County, Virginia November 4, 2015 Prepared For: Loudoun County Public Schools 21000 Education Court Ashburn, VA 20148 Prepared by: 1140 Connecticut
Traffic and Toll Revenue Estimates
 The results of WSA s assessment of traffic and toll revenue characteristics of the proposed LBJ (MLs) are presented in this chapter. As discussed in Chapter 1, Alternatives 2 and 6 were selected as the
Address Land Use Approximate GSF
 M E M O R A N D U M To: Kara Brewton, From: Nelson\Nygaard Date: March 26, 2014 Subject: Brookline Place Shared Parking Analysis- Final Memo This memorandum presents a comparative analysis of expected
Metropolitan Freeway System 2007 Congestion Report
 Metropolitan Freeway System 2007 Congestion Report Minnesota Department of Transportation Office of Traffic, Safety and Operations Freeway Operations Section Regional Transportation Management Center March
ZINFANDEL LANE / SILVERADO TRAIL INTERSECTION TRAFFIC ANALYSIS
 ZINFANDEL LANE / SILVERADO TRAIL INTERSECTION TRAFFIC ANALYSIS UPDATED TRAFFIC STUDY FOR THE PROPOSED RAYMOND VINEYARDS WINERY USE PERMIT MODIFICATION #P11-00156 AUGUST 5, 2014 PREPARED BY: OMNI-MEANS,
Existing Traffic Conditions
 May 14, 2014 Ms. Lorraine Weiss City of San Mateo 330 West 20 th Avenue San Mateo, CA 94403 Subject: Traffic Operational Study for the Proposed Tilton Avenue Residential Development in San Mateo, California
Introduction and Background Study Purpose
 Introduction and Background The Brent Spence Bridge on I-71/75 across the Ohio River is arguably the single most important piece of transportation infrastructure the Ohio-Kentucky-Indiana (OKI) region.
L1TILE BEARS DAY CARE TRANSPORTATION IMPACT STUDY FORT COLLINS, COLORADO MAY Prepared for:
 L1TILE BEARS DAY CARE TRANSPORTATION IMPACT STUDY FORT COLLINS, COLORADO MAY 2012 Prepared for: Hillside Construction, Inc. 216 Hemlock Street, Suite B Fort Collins, CO 80534 Prepared by: DELICH ASSOCIATES
2. Valley Circle Boulevard/Andora Avenue/Baden Avenue and Lassen Street
 IV.J TRANSPORTATION 1. INTRODUCTION This section presents an overview of the existing traffic and circulation system in and surrounding the project site. This section also discusses the potential impacts
TRAFFIC IMPACT ANALYSIS. for MILTON SQUARE
 TRAFFIC IMPACT ANALYSIS for MILTON SQUARE US Route 7 Milton, Vermont March 5, 2008 LAMOUREUX & DICKINSON 14 Morse Drive Essex Junction, Vermont 05452 (802) 878-4450 Traffic Impact Assessment EXECUTIVE
FIELD APPLICATIONS OF CORSIM: I-40 FREEWAY DESIGN EVALUATION, OKLAHOMA CITY, OK. Michelle Thomas
 Proceedings of the 1998 Winter Simulation Conference D.J. Medeiros, E.F. Watson, J.S. Carson and M.S. Manivannan, eds. FIELD APPLICATIONS OF CORSIM: I-40 FREEWAY DESIGN EVALUATION, OKLAHOMA CITY, OK Gene
MEMORANDUM. Figure 1. Roundabout Interchange under Alternative D
 MEMORANDUM Date: To: Liz Diamond, Dokken Engineering From: Subject: Dave Stanek, Fehr & Peers Western Placerville Interchanges 2045 Analysis RS08-2639 Fehr & Peers has completed a transportation analysis
Traffic Impact Statement (TIS)
") Traffic Impact Statement (TIS) Vincentian PUDA Collier County, FL 10/18/2013 Prepared for: Global Properties of Naples Prepared by: Trebilcock Consulting Solutions, PA 2614 Tamiami Trail N, Suite 615 1205
Traffic Impact Statement (TIS) Vincentian PUDA Collier County, FL 10/18/2013 Prepared for: Global Properties of Naples Prepared by: Trebilcock Consulting Solutions, PA 2614 Tamiami Trail N, Suite 615 1205
TRAFFIC IMPACT STUDY DERRY GREEN CORPORATE BUSINESS PARK MILTON SECONDARY PLAN MODIFICATION
 TRAFFIC IMPACT STUDY DERRY GREEN CORPORATE BUSINESS PARK MILTON SECONDARY PLAN MODIFICATION TRAFFIC IMPACT STUDY DERRY GREEN CORPORATE BUSINESS PARK MILTON SECONDARY PLAN MODIFICATION DECEMBER 24 UPDATED
105 Toronto Street South, Markdale Transportation Impact Study. Paradigm Transportation Solutions Limited
 105 Toronto Street South, Markdale Transportation Impact Study Paradigm Transportation Solutions Limited December 2016 Project Summary Project Number 162060 December 2016 Client Zelinka Priamo Ltd 318
This letter summarizes our observations, anticipated traffic changes, and conclusions.
 Mr. David Jorschumb Project Manager Boulder Valley School District Re: Review of proposed school access improvements at the Foothills Elementary School in Boulder Dear Mr. Jorschumb, At your request, the
The key roadways in the project vicinity are described below. Exhibit displays the existing number of lanes on the study roadways.
 4.2 TRAFFIC AND CIRCULATION This section presents the key assumptions, methods, and results of analysis for the transportation and circulation impacts of the proposed project. This section is based on
MEMO VIA . Ms. Amy Roth DPS Director, City of Three Rivers. To:
 MEMO To: Ms. Amy Roth DPS Director, City of Three Rivers VIA EMAIL From: Michael J. Labadie, PE Julie M. Kroll, PE, PTOE Brandon Hayes, PE, P.Eng. Fleis & VandenBrink Date: January 5, 2017 Re: Proposed