Bus Rapid Transit: Basic Design for Non-Transit Planners
|
|
|
- Piers Lucas
- 5 years ago
- Views:
Transcription


1 Bus Rapid Transit: Basic Design for Non-Transit Planners Paul Bignardi, AICP - Principal Planner San Francisco Municipal Transportation Agency Graham Carey, PE Principal careybrt Consulting Peter Gabancho, PE - Project Manager San Francisco Municipal Transportation Agency

2 Table of Contents 1. BRT in California 2. BRT Planning 3. BRT Tool Box Actions 4. Van Ness BRT Experience 5. Interactive Exercise Build Your Own BRT 2
3 BRT in California pbignardi photo BRT should play a role in the future development of cities throughout California 3


4 BRT in California Local Rail Service Transit = 9 systems Local Bus Service = 50+ systems 2015 Population = 38.9 million pubzi.com 25% increase 2050 Population = 49.8 million Not all of the additional people will drive cars or ride light rail trains... many will use buses 4

5 BRT in California Existing BRT or Near-BRT Service Cities / Areas with high potential for future BRT service 5

6 BRT in California Where BRT Works Best Bus speeds are significantly slower than average auto speeds Demand exists to attract riders by providing a more competitive travel time 6
7 BRT Planning START What you have crafted END Project Elements What conditions and elements you have as a starting point BRT Plans Local Transportation Conditions What tools are available to improve service Actions (Tool Box) Better Service Priorities What you want to achieve 7

 30%-40% Traffic")
8 BRT Planning Sources of Time Savings Traffic Signals 10%-15% Stations 10%-15% In Motion 50% Service Type & Bus Type (includes stop removal) 30%-40% Traffic Lanes 25%-33% 8
9 Faster & More Reliable Service BRT Planning General 1 Service Type (Reduce stops) & Bus Type 3 Traffic Lanes HOV Lanes / Semi-Exclusive Bus Lanes 2 Traffic Lanes Dedicated Exclusive Bus Lanes (red lanes) 4 Stations - Reduce Dwell Time - All Door Boarding - Prepaid Fare Media 5 Traffic Signal Priority 7 Frequent service balanced headways 6 Queue jump at traffic signals 8 Branding 9 Improved stop amenities - Shelters - Next Bus 10 Landscaping Attractive Street 9

10 BRT Tool Box Actions Value per dollar Costs of BRT elements of improvement vs. relative performance improvement 10

11 BRT Tool Box Actions Service Type & Bus Type Layered Service / Tiered Service (Local + BRT) Hybrid Service 40-foot low floor 60-foot low floor 3 door 60-foot low floor 5 door 42-foot double deck 11

12 BRT Tool Box Actions Service Type & Bus Type New York MTA example: BRT (named SBS in NY) has half the number of stops as local service. Local = 11 stations Limited = 7 stations BRT = 5 stations 12


13 BRT Tool Box Actions S e r v i c e T y p e & B u s T y p e 60-foot low floor 5 door 42-foot double deck 60-foot low floor 3 door 40-foot low floor 13

 Median (Full")
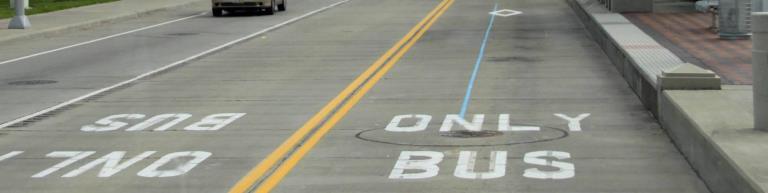
14 BRT Tool Box Actions Traffic Lanes Time Direction Space (Dynamic) Mixed Traffic Curbside (Semi Exclusive) Median (Full Exclusive) 14
15 BRT Tool Box Actions Traffic Lanes Location Degree of Exclusivity Median Exclusive Curbside Semi- Exclusive Separated Shared 15

16 BRT Tool Box Actions Traffic Lanes 16

17 BRT Tool Box Actions Traffic Lanes 17

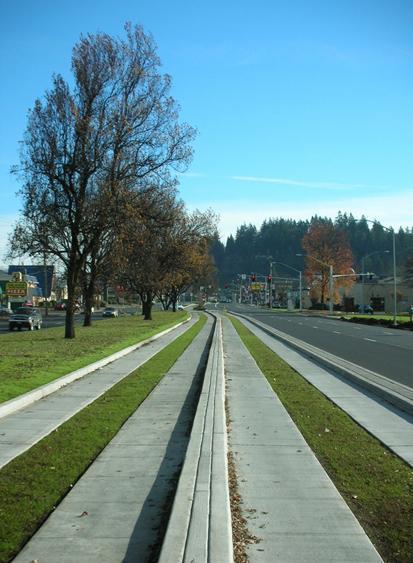
18 BRT Tool Box Actions Traffic Lanes Location Separated 18

19 BRT Tool Box Actions Traffic Lanes Location - Median 19
 20")
20 BRT Tool Box Actions Traffic Lanes Location Median - Reversed Flow (aka Contra-flow) 20
")
21 BRT Tool Box Actions Traffic Lanes Location Median - (shared left turns) 21

22 BRT Tool Box Actions Traffic Lanes Location Median - (Single Lane Two-way) 22

23 BRT Tool Box Actions Traffic Lanes Location Median - (Single Lane Two-way) 23


24 BRT Tool Box Actions Traffic Lanes Location Curbside - Business Access w/transit - (BAT) 24

 shared with")
25 BRT Tool Box Actions Traffic Lanes Location Curbside (BAT) shared with left turns 25
 (with")
26 BRT Tool Box Actions Traffic Lanes Location Curbside (BAT) (with parking) 26

27 BRT Tool Box Actions Traffic Lanes Location Curbside (Single lane - Two-way) 27


28 BRT Tool Box Actions Traffic Lanes Degree of Exclusivity (Exclusive) 28

 Time")
29 BRT Tool Box Actions Traffic Lanes Degree of Exclusivity (Semi-Exclusive) Time Direction Space (Dynamic) 29
 (Direction)")
30 BRT Tool Box Actions Traffic Lanes Degree of Exclusivity (Semi-Exclusive) (Direction) 30
 (Dynamic) Bus Lane Intermittent Priority")
31 BRT Tool Box Actions Traffic Lanes Degree of Exclusivity (Semi-Exclusive) (Dynamic) Bus Lane Intermittent Priority (BLIMP) 31


32 BRT Tool Box Actions Traffic Lanes Landscaping / Improved Stop Amenities / Branding pbignardiphoto pbignardiphoto pbignardiphoto 32

33 BRT Tool Box Actions Traffic Signals Queue Jump Transit Signal Priority 33

34 BRT Tool Box Actions Traffic Signals Queue Jump (with receiving bay) 34
 Need separate signal phase Delayed if bus approaches on green")
35 BRT Tool Box Actions Traffic Signals Queue Jump (without receiving bay) Need separate signal phase Delayed if bus approaches on green phase 35
36 BRT Tool Box Actions Traffic Signals Traffic Signal Priority (TSP) 36
 Transfers Location in route Mix of services (regular, connector, local & BRT, etc.")
37 BRT Tool Box Actions Stations Position (Far side / Near side / Mid-block) Open / Closed Platform height (vehicle floor & doors) Transfers Location in route Mix of services (regular, connector, local & BRT, etc.) 37


38 BRT Tool Box Actions Stations Position far side / near side Far side and near side station Far side stations 38


39 BRT Tool Box Actions Stations Design Open / Closed 39


40 BRT Tool Box Actions Stations Design Platform height (vehicle) Amenities (shelter, information, etc.) 40

41 BRT Tool Box Actions Stations Design Ticket machines / Pre-payment All-Door Boarding 41
42 Van Ness BRT Experience

 2 lanes of curb parking")
43 Van Ness BRT Experience 1940s 3 traffic lanes each direction 2 streetcar tracks (shared w/ traffic) 2 lanes of curb parking No median
 16,000 daily passengers 2 lanes of curb parking Extensive planted")
44 Van Ness BRT Experience Today 3 traffic lanes each direction 2 Muni transit routes / 8 Golden Gate Transit routes (mixed traffic + buses) 16,000 daily passengers 2 lanes of curb parking Extensive planted median

45 Van Ness BRT Experience Bring Van Ness into 21st Century - Modern transit corridor using BRT - Fast - Reliable - Affordable - Dependable - Attractive - San Francisco 2015 Population = 850,000 25% increase 2050 Population = 1,000,000+ Insert photo of SF skyline or city hall
46 Van Ness BRT Experience Long Range Planning Four Corridor Plan T-Third LRV Third St. LRV Central Subway Fisherman s Wharf Concept Study Van Ness BRT Geary BRT

47 Van Ness BRT Experience Service Type & Bus Type Layered Service / Tiered Service (Local + BRT) Hybrid Service 40-foot low floor 60-foot low floor 3 door 60-foot low floor 5 door 42-foot double deck 47


48 Van Ness BRT Experience Service Type & Bus Type Route 47 Caltrain - North Beach new 60-foot hybrid buses Route 49 City College Ft. Mason new 60-foot trolley buses

49 Van Ness BRT Experience Service Type & Bus Type Hybrid Service 1 15 bus stops stations


50 Van Ness BRT Experience Service Type & Bus Type 60-foot low floor 3 door 1 60 foot New Flyer Trolley Bus Route foot New Flyer Hybrid Diesel Route

 Median (Full")
51 Van Ness BRT Experience Traffic Lanes Time Direction Space (Dynamic) Mixed Traffic Curbside (Semi Exclusive) Median (Full Exclusive) 51
 Semi-Exclusive Lanes (right door loading - 3-door bus")
 Full Exclusive Center Lanes, Dual Medians (right door loading 3-door")
52 Van Ness BRT Experience T r a f f i c L a n e s Mixed Traffic 1 (right door loading - 3-door bus required) Semi-Exclusive Lanes (right door loading - 3-door bus required) 7 Full Exclusive Center Lanes, Single Median 9 10 (left / right door loading - 5-door bus required) Full Exclusive Center Lanes, Dual Medians (right door loading 3-door bus required)


53 Van Ness BRT Experience Landscaping / Improved Stop Amenities / Branding 53

54 Van Ness BRT Experience Traffic Signals Queue Jump Transit Signal Priority 54
55 Van Ness BRT Experience Traffic Signals Traffic Signal Priority (TSP) Traffic signal management is very challenging issue: major transit cross-town Muni routes - Golden Gate Transit routes - 200,000+ daily passengers 55
 Amenities Fare Collection (Regular vs.")
56 Van Ness BRT Experience Stations Position (Far side / Near side) Open / Closed Platform height (vehicle floor & doors) Amenities Fare Collection (Regular vs. All-Door Boarding) Mix of services (regular, connector, local & BRT, etc.) 56
 forced a change to all near-side")
57 Van Ness BRT Experience Stations Position (Far side / Near side) Truck turn impact on far-side station Truck turn impact on far-side station (truck runs over platform) forced a change to all near-side stations

58 Van Ness BRT Experience Stations Open / Closed Amenities (shelter, real-time bus information, etc.)

59 Van Ness BRT Experience Stations Platform height (vehicle) 1 Vehicle Docking Test conducted using 14 boxes to stand in for a proposed 3 14 boarding platform Minimum 4 gap distance achieved: 5 Maximum 5 ADA allowable gap distance: 3 14 platforms prevent the deployment of Muni wheelchair ramps
60 Van Ness BRT Experience Stations Ticket machines / Pre-payment All-Door Boarding 60

61 Van Ness BRT Experience Hypothetical Preview Enhanced Stations & Landscaping Transit Signal Priority Hybrid Service Reduced Number of Stations Full Exclusive Bus Lanes Off-board Fare Collection & All-Door Boarding

62 Van Ness BRT Experience Complete Design Plans Full exclusive red-colored transit lanes New traffic signals w/ Transit Signal Priority optimized for north-south traffic 60-foot low-floor buses and trolley buses and all-door boarding 4 5 Quality platforms and shelters at transit stations located at key transfer points, and improved landscaping along the corridor Safety enhancements for peds, including accessible countdown signals, curb bulbs, median refuges, nose cones, zebra-striped crosswalks and left turn restrictions
 / $44M Prop. K (S.F.) / $12M Central Fwy. / $ 5M CPMC Impact Fees / $44M SFPUC / $27M SFMTA Rev.")
63 Van Ness BRT Experience Basic Fact Sheet Cost - $159M (BRT components) / $260M (BRT + other infrastructure) Funding - $ 75M FTA Small Starts / $20M CMAQ / $24M FTA Sect / $ 7M SHOPP (Caltrans) / $44M Prop. K (S.F.) / $12M Central Fwy. / $ 5M CPMC Impact Fees / $44M SFPUC / $27M SFMTA Rev. Bonds Project components Transit lanes, overhead electric lines, light poles, landscaping, sewers, traffic signals w/ TSP and ped. countdown, stations (platforms / shelters), curb bulbs, water lines, ADA ped. upgrades, roadway repavement, green infrastructure, variable message signs (VMS) Time savings - (33% end to end within project area) (one-way peak period trip: reduced from 21 mins. to 14 mins.) Transit Equipment - Fleet of: 60 New Flyer hybrid buses & 60 trolley buses Ridership projections - 50% increase 24,000 daily passengers by 2035 in project area Opening Date - Spring 2019
64 Van Ness BRT Experience
65 Interactive Exercise Build Your Own BRT BRT Planning Worksheet APA - Oakland - October 6, 2015 BRT Session: Paul Bignardi, Graham Carey, Peter Gabancho Instructions: Use worksheet to select the items you want in your BRT concept for a fictional city in California. Mark the appropriate box with an 'X'. Items listed as REQUIRED mean you must select at least ONE item. Items listed as OPTIONAL means you select ONE item or NO items. Costs are approximate (emphasize Costs Social / Performance = 5 miles of Politica Minutes Saved Service bi-direction Select Action X l - Based on 60 Notes Improvements BRT Impact minute route (10 miles total) travel time Service Type & Bus Type REQUIRED - Select only ONE item from this group REQUIRED - Select only ONE item (calculate total and write in COSTS (Preliminary) column) from this group Sub-Total Layered Service (BRT route and Local route operate on the same street) 13 buses needed Hybrid Service (BRT & Local are combined into one hybrid route ) 13 buses needed 1 2 BRT every 12 minutes (5 buses per hr.) / 46 minutes to complete 10 mile route cycle (removal of 40 stops [1/2 of all stops] - large time savings) Local every 12 minutes (5 buses per hour) / 60 minutes to complete 10 mile route cycle (all 80 stops kept for local service - little or zero time savings) Buses every 6 minutes (10 buses per hour) / 53 minutes to complete 10 mile route cycle (removal of 20 stops [1/4 of all stops] - good time savings) No new buses - use available fleet FREE 1 0 Unknown - save capital $$, but performance characteristics =?? 40 foot low-floor bus ($500,000 each) $ 6,500, Basic bus - small to medium capacity 60 foot low-floor bus ($750,000 each) $ 9,750, Longer bus - medium to high capacity - (50% more than 40-foot bus) - loads / unloads faster than Double-Deck bus, not as stylish 60 foot low-floor bus - 5 door bus ($1,000,000 each) $ 13,000, Same as 60-foot bus, but with 2 added doors on left side so it can load from either side - like a light rail vehicle 42 foot low-floor double deck bus ($750,000 each) $ 9,750, Double Deck - medium to high capacity - (50% more than 40-foot bus), stylish, but loads and unloads slower than a 60-foot bus Add up costs / impacts / and time saved for the Service Type and Bus Type Section Select from options below in bus area $ 14 7 Traffic Lanes Select ONE of the three Traffic Lane options (A, B, or C), and then customize your selection. Leave the other two sections blank. --- and remember to include Landscaping Traffic Signals Stations A B C MIXED TRAFFIC REQUIRED - Select only ONE item from this group SEMI-EXCLUSIVE RIGHT LANE REQUIRED - Select only ONE item from this group OPTIONAL - select ONE item or NO items from this group REQUIRED - Select only ONE item from this group FULL EXCLUSIVE CENTER LANE REQUIRED - Select only ONE item from this group OPTIONAL OPTIONAL - select ONE item or NO items from this group OPTIONAL - select ONE item or NO items from this group REQUIRED - Select only ONE item from this group Sub-Total OPTIONAL - select ONE item or NO items from this group Sub-Total REQUIRED - Select only ONE item from this group REQUIRED - Select only ONE item from this group OPTIONAL OPTIONAL Buses operate in MIXED TRAFFIC Calculate below No special markings - buses operate in mixed traffic - same as current operations No landscaping improvements - not needed BRT lane is on side FREE 1 0 No improvements needed - BRT lane is on the side - landscaping should not be affected Modest landscaping improvements - desire to enhance the corridor $ 5,000, Although BRT lane is on the side - desire / community pressure to enhance the corridor = new trees, new greenery, new artwork, etc. Buses operate in a SEMI-EXCLUSIVE Right Lane Calculate below Special "transit only" markings (select below), but cars allowed to cross lanes to park on curb, and make right turns at intersections HOV Standard Markings $ 1,000, Basic white diamond and white street traffic markings Colored transit lanes $ 10,000, Salmon (red) thermoplastic treatment with white street traffic markings Keep 6 Traffic Lanes - Remove parking - replace ZERO with off street $ 500, Loss of 350 parking spaces per mile (bi-direction) - costs include replace ZERO parking with off street parking ($15k per space) Keep 6 Traffic Lanes - Remove parking - replace 1/2 with off street spaces $ 13,500, Loss of 350 parking spaces per mile (bi-direction) - costs include replace 1/2 parking with off street parking ($15k per space) Keep 6 Traffic Lanes - Remove parking - replace ALL with off street spaces $ 27,000, Loss of 350 parking spaces per mile (bi-direction)- costs include replace ALL parking with off street parking ($15k per space) No landscaping improvements FREE 2 0 No improvements needed - BRT lane is on the side - landscaping should not be affected Modest landscaping improvements $ 5,000, Although BRT lane is on the side - desire / community pressure to enhance the corridor = new trees, new greenery, new artwork, etc. Buses operate in a FULL EXCLUSIVE Center Lane Calculate below Special "transit only" markings, but complete separation from mixed traffic - improved performance vs. semi-exclusive lanes HOV Standard Markings $ 1,000, Basic white diamond and white street traffic markings Colored transit lanes $ 10,000, Salmon (red) thermo treatment with white street traffic markings Curb Separated BRT lanes $ 10,000, Low divider curb (6") to keep mixed traffic and BRT completely separate - helps to guarantee bus reliability Passing Lanes - Use ONLY with Layered Service allows BRT to pass Local $ 5,000, Loss of 270 parking spaces per mile (bi-direction) - allows BRT to pass Local w/o delay at "Local" stations - NO replacement parking in this option Passing Lanes - Use ONLY with Layered Service allows BRT to pass Local $ 25,000, Loss of 270 parking spaces per mile (bi-direction) - allows BRT to pass Local w/o delay at "Local" stations - costs include off-street replacement parking Keep 6 Traffic Lanes - Remove parking - replace ZERO with off street $ 500, Loss of 350 parking spaces per mile - costs include replace ZERO parking with off street parking ($15k per space + misc. expenses) Keep 6 Traffic Lanes - Remove parking - replace 1/2 with off street spaces $ 13,500, Loss of 350 parking spaces per mile - costs include replace 1/2 parking with off street parking ($15k per space + misc. expenses) Keep 6 Traffic Lanes - Remove parking - replace ALL with off street spaces $ 27,000, Loss of 350 parking spaces per mile - costs include replace ALL parking with off street parking ($15k per space + misc. expenses) No landscaping improvements Not Applicable 3 0 Only applicable if entire existing street is asphalt without any median - and hypothetical Route A plan view shows landscaped medians Modest landscaping improvements $ 12,500, Modest landscaping: new trees, new greenery, new artwork, etc., but because median significantly rebuilt, costs = 250% of side lane Extensive landscaping improvements $ 25,000, Extensive landscaping and rebuild of median after complete disruption to install BRT center exclusive lanes = 500% of side lane Add up costs / impacts / and time saved for the Traffic Lanes (and Landscaping) Section $ Queue Jump $ 5,000, For this exercise - assume modern signal controllers, hardware, etc. If not modern, this will cost up to 5X more Transit Signal Priority (TSP) $ 12,500, For this exercise - assume modern signal controllers, hardware, etc. If not modern, this will cost up to 3X more Add up costs / impacts / and time saved for the Traffic Signals Section $ No Change - continue to use old shelters with existing amenities FREE 1 0 Keep existing stop shelters / stations - make no changes Basic $ 5,000, New Basic shelter with seating, schedule holder, stop flag Enhanced $ 12,500, New solar powered shelter with lighting, seating, schedule holder, NextBus, iconic stop flag Custom Enhanced BRT & Local $ 30,000, New solar powered shelter with lighting, seating, artistic and branding images built into design, schedule holder, iconic stop flag Near Side Stations (station before intersection) Costs paid w/ 2 1 Stations located before traffic signals - advanced signal timing can allow for minimal delay, older signals = delay - assume newer signals Far Side Stations (station after intersection) station choice 2 2 Stations located on far side of intersection - after traffic signal - signal timing (basic or advanced) can get bus through to keep moving Ticket Vending Machines $ 4,000, Fare pre-payment utilizes stored value fare cards, but also allows for cash fare passengers to purchase a fare from a ticket machine at the station All Door Boarding $ 500, Allow boarding by prepaid passengers at all bus doors - cash pay fares only at front door Final Total Sub-Total Add up costs / impacts / and time saved for the Stations Section Add up costs / impacts / and time saved for the 4 sub-sections $ $
66 Bus Rapid Transit: Basic Design for Non-Transit Planners Thank You Paul Bignardi, AICP - Principal Planner San Francisco Municipal Transportation Agency Graham Carey, PE Principal careybrt Consulting Peter Gabancho, PE - Project Manager San Francisco Municipal Transportation Agency
67
Van Ness Transit Corridor Improvement Project. Engineering, Maintenance and Safety Committee March 25, 2015
 Van Ness Transit Corridor Improvement Project Engineering, Maintenance and Safety Committee March 25, 2015 Project Need 16,000 daily passenger boardings within the project corridor Average bus speed 8
VAN NESS AVENUE BUS RAPID TRANSIT
 VAN NESS AVENUE BUS RAPID TRANSIT Commission of the Environment Policy Committee May 22, 2014 Peter Gabancho Project Manager III Capital Programs & Construction SFMTA 1 Conceptual Visual Simulation Center-Running
VAN NESS AVENUE BUS RAPID TRANSIT
 VAN NESS AVENUE BUS RAPID TRANSIT Peter Gabancho Project Manager III Capital Programs & Construction SFMTA Shari Tavafrashti Principal Engineer SFCTA 1 Project Purpose and Need Improve transit reliability,
What IS BRT, Really? Not BRT and RNY
 What IS BRT, Really? 2007 Winter TexITE Meeting Presented by Jeff Arndt, TTI Not BRT and RNY 1 What is Bus Rapid Transit? A flexible, rubber-tired from of rapid transit that combines stations, vehicles,
Service Quality: Higher Ridership: Very Affordable: Image:
 Over the past decade, much attention has been placed on the development of Bus Rapid Transit (BRT) systems. These systems provide rail-like service, but with buses, and are typically less expensive to
Geary Corridor Bus Rapid Transit
 Geary Corridor Bus Rapid Transit Institute of Transportation Engineers Luncheon Meeting October 17, 2013 SAN FRANCISCO COUNTY TRANSPORTATION AUTHORITY SAN FRANCISCO MUNICIPAL TRANSPORTATION AGENCY Geary
State Avenue Corridor Bus Rapid Transit (BRT)
") State Avenue Corridor Bus Rapid Transit (BRT) Moving Forward Incrementally April 2010 State Ave. BRT Update Bus Rapid Transit Overview State Ave. Alternatives Analysis Results What s Coming Up Right Away!
State Avenue Corridor Bus Rapid Transit (BRT) Moving Forward Incrementally April 2010 State Ave. BRT Update Bus Rapid Transit Overview State Ave. Alternatives Analysis Results What s Coming Up Right Away!
EUGENE-SPRINGFIELD, OREGON EAST WEST PILOT BRT LANE TRANSIT DISTRICT
 EUGENE-SPRINGFIELD, OREGON EAST WEST PILOT BRT LANE TRANSIT DISTRICT (BRIEF) Table of Contents EUGENE-SPRINGFIELD, OREGON (USA)... 1 COUNTY CONTEXT AND SYSTEM DESCRIPTION... 1 SYSTEM OVERVIEW... 1 PLANNING
APPENDIX I: [FIXED-GUIDEWAY TRANSIT FEASIBILITY]
![APPENDIX I: [FIXED-GUIDEWAY TRANSIT FEASIBILITY]](/thumbs/83/87090921.jpg "APPENDIX I: [FIXED-GUIDEWAY TRANSIT FEASIBILITY]") APPENDIX I: [FIXED-GUIDEWAY TRANSIT FEASIBILITY] Jackson/Teton Integrated Transportation Plan 2015 Appendix I. Fixed-Guideway Transit Feasibility Jackson/Teton County Integrated Transportation Plan v2
APPENDIX I: [FIXED-GUIDEWAY TRANSIT FEASIBILITY] Jackson/Teton Integrated Transportation Plan 2015 Appendix I. Fixed-Guideway Transit Feasibility Jackson/Teton County Integrated Transportation Plan v2
Brian Pessaro, AICP National Bus Rapid Transit Institute
 Brian Pessaro, AICP National Bus Rapid Transit Institute Source: WCVB TV, Boston BRT is an enhanced bus system that operates on bus lanes or other transitways in order to combine the flexibility of buses
TRANSIT IDEA STRATEGIC INITIATIVE On BUS RAPID TRANSIT (BRT)
") TRANSIT IDEA STRATEGIC INITIATIVE On BUS RAPID TRANSIT (BRT) The panel for the Transit IDEA program has endorsed a Bus Rapid Transit (BRT) strategic initiative and focus area as part of the Transit IDEA
TRANSIT IDEA STRATEGIC INITIATIVE On BUS RAPID TRANSIT (BRT) The panel for the Transit IDEA program has endorsed a Bus Rapid Transit (BRT) strategic initiative and focus area as part of the Transit IDEA
HDR Engineering. HART North / South. Tampa Bay Applications Group Meeting May 14, 2009
 HDR Engineering HART North / South BRT Corridor PD&E Tampa Bay Applications Group Meeting May 14, 2009 1 Agenda Update on Project Development and Environment (PD&E) Study Project Overview System Branding
Waco Rapid Transit Corridor (RTC) Feasibility Study
 Feasibility Study") Waco Rapid Transit Corridor (RTC) Feasibility Study Chris Evilia, Director of Waco Metropolitan Planning Organization Allen Hunter, General Manager Waco Transit System Jimi Mitchell, Project Manager AECOM
Waco Rapid Transit Corridor (RTC) Feasibility Study Chris Evilia, Director of Waco Metropolitan Planning Organization Allen Hunter, General Manager Waco Transit System Jimi Mitchell, Project Manager AECOM
FACT SHEET. US 192 Alternatives Analysis Modal Technologies. Alternative Description/Overview
 FACT SHEET US 192 Alternatives Analysis Modal Technologies Bus Alternative Description/Overview Bus systems typically operate in mixed traffic and have minimal station infrastructure. Bus service typically
Where will. BRT run? BRT will serve 20 stations along the line, connecting to bus routes and serving major destinations. How often will service run?
 Where will 32 65 87 223 Rosedale Transit Center 225 227 264 801 ROSEVILLE 65 Snelling & County Road B BRT run? Snelling & Roselawn FALCON HEIGHTS BRT will serve 20 stations along the line, connecting to
San Francisco Municipal Transportation Agency Capital Programs and Construction Division
 A. Boarding Platform Height The level-boarding platform, which is 14 inches high, is considered the most desirable system in terms of passenger loading and unloading dwell times. This platform system is
ARTERIAL BRT OVERVIEW
 ARTERIAL BRT OVERVIEW Key Question: Could arterial Bus Rapid Transit (BRT) routes improve near-term mobility in the northwest area until rail can be built? Key Findings: 6 arterial BRT routes have been
SFMTA Energy Use by Vehicle Type: Transit Investments vs Life Cycle Costs
 SFMTA Energy Use by Vehicle Type: Transit Investments vs Life Cycle Costs Peter Brown Project Manager, Long Range Planning Sustainable Streets Division 10 17 2011 Lake Arrowhead, California Outline of
5. OPPORTUNITIES AND NEXT STEPS
 5. OPPORTUNITIES AND NEXT STEPS When the METRO Green Line LRT begins operating in mid-2014, a strong emphasis will be placed on providing frequent connecting bus service with Green Line trains. Bus hours
Public Meeting. June 15, :30 7:30 p.m.
 Public Meeting June 15, 2017 5:30 7:30 p.m. Welcome 2015 Naval Station Norfolk Transit Extension Study 2015 Naval Station Norfolk Transit Extension Study 2017 Norfolk Westside Transit Study HRT and the
Arterial Bus Rapid Transit. System Policy Oversight Committee April 7, 2014
 Arterial Bus Rapid Transit System Policy Oversight Committee April 7, 2014 1 Meeting Agenda Welcome and Introductions A Line - Project Status Shelter and Pylon Development Arterial BRT Branding Update
COMMUNITY REPORT FISCAL YEAR We are making progress, are you on board? GOLD COAST TRANSIT DISTRICT
 FISCAL YEAR 178 GOLD COAST TRANSIT DISTRICT COMMUNITY REPORT We are making progress, are you on board? OJAI OXNARD PORT HUENEME VENTURA COUNTY OF VENTURA GENERAL MANAGER S MESSAGE STEVEN P. BROWN DEAR
Memorandum. 1 Introduction. 2 O&M Cost Elements. 2.1 Service O&M Costs
 To Barrow Emerson, SamTrans Melissa Reggiardo, SamTrans Date 9/13/2014 Copies Reference number From Subject Corey Wong, Arup Steve Crosley, Fehr + Peers ECR BRT Phasing Plan File reference 1 Introduction
FREQUENTLY ASKED QUESTIONS
 FREQUENTLY ASKED QUESTIONS 2018 What is the More MARTA Atlanta program? The More MARTA Atlanta program is a collaborative partnership between MARTA and the City of Atlanta to develop and implement a program
COST ESTIMATES: Curb-Running
 COST ESTIMATES: Curb-Running PROJECT FEASIBILITY COST ESTIMATE SUMMARY Geary Bus Rapid Transit Study Alternative: Side Lane (Curb Running) Date: 4/12/07 Percent Cost Total Project Capital Outlay I- Roadway
UCLA Lake Arrowhead Conference. October 18, 2010
 BART Click to Capacity edit Master Overview title style for UCLA Lake Arrowhead Conference October 18, 2010 0 BART Basics 360,000 daily riders 104 miles 43 stations 1.3 billion annual passenger miles 1
UCLA Lake Arrowhead Conference. October 18, 2010
 BART Click to Capacity edit Master Overview title style for UCLA Lake Arrowhead Conference October 18, 2010 0 BART Basics 360,000 daily riders 104 miles 43 stations 1.3 billion annual passenger miles 1
Balancing the Transportation Needs of a Growing City
 Balancing the Transportation Needs of a Growing City FY 2019 and FY 2020 Capital Budget SFMTA Board Meeting Ed Reiskin, Director of Transportation April 3, 2018 1 FY 2019-23 Capital Improvement Program
Recommendation for 2017 PSRC Funding Transportation Policy Board - June 8, 2017
 Recommendation for 2017 PSRC Funding Transportation Policy Board - June 8, 2017 Background PSRC s 2017 funding: Rural Town Centers and Corridor program Regional FTA competition May - Board released projects
Tempe Streetcar. March 2, 2016
 Tempe Streetcar March 2, 2016 Tempe Profile 40 sq. miles, highest density in state University Town, center of region Imposed growth boundaries (density increase) Mixed use growth/intensifying land use
Appendix G: Rapid Transit Technology Backgrounder July 2017
 Appendix G: Rapid Transit Technology Backgrounder This appendix provides additional details regarding Bus Rapid Transit and Light Rail Transit technologies, with examples from other systems, including:
Downtown Transit Connector. Making Transit Work for Rhode Island
 Downtown Transit Connector Making Transit Work for Rhode Island 3.17.17 Project Evolution Transit 2020 (Stakeholders identify need for better transit) Providence Core Connector Study (Streetcar project
Preliminary Definition of Alternatives. 3.0 Preliminary Definition of Alternatives
 3.0 What preliminary alternatives are being evaluated? The alternatives for the East San Fernando Valley Transit Corridor project that were considered for screening include the No Build Alternative, Transportation
Community Outreach Meetings
 Community Outreach Meetings BCT At A Glance 410 square miles service area More than 41.5 million annual trips 327 fixed-route buses 44 bus routes 78 Community Buses in 19 Municipalities BCT At A Glance
Sustainability SFMTA Path to Platinum
 Sustainability SFMTA Path to Platinum Ed Reiskin San Francisco Municipal Transportation Agency, Director of Transportation San Francisco, CA Timothy Papandreou Deputy Director Strategic Planning & Policy
PUBLIC TRANSPORTATION
 PUBLIC TRANSPORTATION An Overview of the Industry, Key Federal Programs, and Legislative Processes American Public Transportation Association 1 The Public Transportation Industry: What is "public transportation"?
I-26 Fixed Guideway Alternatives Analysis
 I-26 Fixed Guideway Alternatives Analysis Public Meetings: North Charleston, January 25, 2016 Charleston: January 26, 2016 Summerville: January 28, 2016 Agenda I. Project Update II. III. IV. Screen Two
PUBLIC TRANSPORT MODAL CHARACTERISTICS AND ROLES
 PUBLIC TRANSPORT MODAL CHARACTERISTICS AND ROLES Outline 1. Range of Modes and Services 2. Modal Descriptions 3. Modal Comparisons and Performance Characteristics 4. Simple Capacity Analysis Nigel H.M.
More than $9 Million coming to Central Valley for transportation
 More than $9 Million coming to Central Valley for transportation From free bus service to electric buses Part of overall $97 Million awarded to public transportation projects A total of 152 local public
Public Meeting. City of Chicago Department of Transportation & Department of Housing and Economic Development
 Public Meeting City of Chicago Department of Transportation & Department of Housing and Economic Development Funded by Regional Transportation Authority September 12, 2011 In partnership with Presentation
UCLA Lake Arrowhead Conference. October 18, 2010
 BART Click to Capacity edit Master Overview title style for UCLA Lake Arrowhead Conference October 18, 2010 0 BART Basics 360,000 daily riders 104 miles 43 stations 1.3 billion annual passenger miles 1
Kendall Drive Premium Transit PD&E Study Project Kick-Off Meeting SR 94/Kendall Drive/SW 88 Street Project Development and Environment (PD&E) Study
 Study") Florida Department of Transportation District Six Kendall Drive Premium Transit PD&E Study Project Kick-Off Meeting SR 94/Kendall Drive/SW 88 Street Project Development and Environment (PD&E) Study What
Florida Department of Transportation District Six Kendall Drive Premium Transit PD&E Study Project Kick-Off Meeting SR 94/Kendall Drive/SW 88 Street Project Development and Environment (PD&E) Study What
East Bay Bus Rapid Transit Project. Downtown Oakland to San Leandro International Blvd to East 14 th St
 East Bay Bus Rapid Transit Project 1 AC Transit at a Glance EAST BAY AREA S LARGEST PUBLIC TRANSIT PROVIDER RIDERSHIP Daily (weekday) 178,851* Annual 54,987,132 Paratransit (daily) 1,994 ** * Includes
SERVICE DESIGN GUIDELINES
 VTA TRANSIT SUSTAINABILITY POLICY: APPENDIX A SERVICE DESIGN GUIDELINES Adopted February 2007 COMMUNITYBUS LOCALBUS EXPRESSBUS BUSRAPIDTRANSIT LIGHTRAILTRANSIT STATIONAREAS S A N T A C L A R A Valley Transportation
Northeast Corridor Alternatives Analysis. Public Involvement Round 2 Input on Alternatives for Further Study
 Northeast Corridor Alternatives Analysis Public Involvement Round 2 Input on Alternatives for Further Study Feb. 7-9, 2012 Agenda Review project background Progress summary Recommended alternatives for
Bus Rapid Transit. Jennifer Flynn and Cheryl Thole Senior Research Associates Commuter Choice Workshop January 2012 Tampa, FL
 Bus Rapid Transit Jennifer Flynn and Cheryl Thole Senior Research Associates Commuter Choice Workshop January 2012 Tampa, FL What is Bus Rapid Transit? BRT is an enhanced bus system that operates on bus
Greater Cleveland Regional Transit Authority. Joe Calabrese CEO/General Manager
 Greater Cleveland Regional Transit Authority Joe Calabrese CEO/General Manager Greater Cleveland RTA Overview Service Area Population of 1.5 million Customers Served 200,000 on a typical weekday 1.6 million
I-20 EAST TRANSIT INITIATIVE Tier 1 and Tier 2 Alternatives Screening Report EXECUTIVE SUMMARY
 EXECUTIVE SUMMARY The purpose of this report is to document the results of the Tier 1 and Tier 2 Screening of alternatives for the I-20 East Transit Initiative. The two-tier screening process presented
Snelling Bus Rapid Transit. May 13, 2013 Technical Advisory Committee Meeting #1
 Snelling Bus Rapid Transit May 13, 2013 Technical Advisory Committee Meeting #1 1 Today s meeting TAC Introductions Project Overview Arterial BRT Concept Background Snelling Corridor Plan, Funding & Schedule
East San Fernando Valley Transit Corridor. Information Session, October 10, 2017
 East San Fernando Valley Transit Corridor Information Session, October 10, 2017 1 Welcome and Meeting Purpose Introductions Metro Transit Corridors Planning Metro Real Estate Metro Community Relations
CTfastrak Expansion. Stakeholder Meeting #4 Manchester Town Hall June 3, 2016
 CTfastrak Expansion Stakeholder Meeting #4 Manchester Town Hall June 3, 2016 Today s Agenda Phase I Update 2016 Service Plan Implementation Schedule & Cost Update Phase II Services Timeline Market Analysis
BRT: What is it & Where Does it Fit? Sam Zimmerman
 BRT: What is it & Where Does it Fit? Sam Zimmerman 1 BRT: Bus Rapid Transit Flexible, permanently integrated, high performance system with a quality image and a strong ID Package of components appropriate
Unified Corridor Investment Study DRAFT Step 2 Scenario Analysis Report
 Unified Corridor Investment Study DRAFT Step 2 Scenario Analysis Report REVISIONS 1. Table 39: New Public Investments for Operation and Maintenance Costs 2. Appendix A-10: Passenger Rail Service - Operations
US 29 Bus Rapid Transit Planning Board Briefing. February 16, 2017
 US 29 Bus Rapid Transit Planning Board Briefing February 16, 2017 Project Goals Improve the quality of transit service Improve mobility opportunities and choices Enhance quality of life Support master
Troost Corridor Transit Study
 Troost Corridor Transit Study May 23, 2007 Kansas City Area Transportation Authority Agenda Welcome Troost Corridor Planning Study Public participation What is MAX? Survey of Troost Riders Proposed Transit
Regional Transportation Commission, Washoe County Lee Gibson, Executive Director Roger Hanson, Senior Planner
 Regional Transportation Commission, Washoe County Lee Gibson, Executive Director Roger Hanson, Senior Planner Presentation Outline Transit System Facts Economic Challenges in the Truckee Meadows RTC Transit
BUS STOP DESIGN & PLANNING GUIDE
 BUS STOP DESIGN & PLANNING GUIDE Prepared by the Operations and Planning Departments 2011 PURPOSE OF GUIDE The design of passenger waiting areas plays a significant role in a person s decision of whether
Streetcar and Light Rail Design Differences. March 2015
 Streetcar and Light Rail Design Differences March 2015 How Are Streetcar and Light Rail Different? The design differences between streetcar and light rail are tied to the distinctions in the markets served
1.0 Detailed Definition of Alternatives
 1.0 Detailed Definition of Alternatives 1.1 Introduction This chapter provides supplemental information on the four alternatives, including both physical and operational characteristics (e.g. service plans)
WELCOME. Transit Options Amherst - Buffalo Public Workshops
 WELCOME Transit Options Amherst - Buffalo Public Workshops Sponsored by Niagara Frontier Transportation Authority Greater Buffalo Niagara Regional Transportation Council Where do you live? Where do you
Greater Cleveland Regional Transit Authority. Joe Calabrese - General Manager
 Greater Cleveland Regional Transit Authority Joe Calabrese - General Manager RTA Ridership by Mode! 500 Buses - 75 %! 60 Heavy Rail Vehicles - 10%! 24 RTV s (BRT) - 8%! 48 Light Rail Vehicles - 6%! Paratransit
Transit on the New NY Bridge
 Transit on the New NY Bridge TZB Cross Section North bridge incorporating 12ft shared use path and space for future bus lane South bridge with space for a future bus lane Gap between the two decks for
I-10 West AA/EIS Pre-Screening and Tier 1 Analysis Results. Public Meeting. Wulf Grote, Director Project Development Rick Pilgrim, Project Manager
 I-10 West AA/EIS Pre-Screening and Tier 1 Analysis Results Public Meeting Wulf Grote, Director Project Development Rick Pilgrim, Project Manager March 4 & 5, 2008 Today s Agenda Overview of Alternatives
Transit on the SC Rail Corridor
 Transit on the SC Rail Corridor Framing the Debate Premature Question: Rail or BRT? Rather Transit or no Transit Rail AND BRT more likely Save the Rails becomes Save the ROW for now Unified Corridors Investment
Metro Transit Update. Christina Morrison, Senior Planner Metro Transit BRT/Small Starts Project Office. John Dillery, Senior Transit Planner
 Metro Transit Update Christina Morrison, Senior Planner Metro Transit BRT/Small Starts Project Office John Dillery, Senior Transit Planner Metro Transit Service Development May 16, 2013 1 Transit Planning
PAWG Meeting #3a Tier 1 Evaluation
 PAWG Meeting #3a Tier 1 Evaluation August 2, 2017 LYNX Central Station Open Area 1 Modes Screening 2 Trunk vs Feeder Trunk Modes High peak capacity Direct routes Feeder Modes Routing may be flexible Serve
San Francisco Transportation Plan Update
 San Francisco Transportation Plan Update SPUR August 1, 2011 www.sfcta.org/movesmartsf twitter.com/sanfranciscota www.facebook.com/movesmartsf How does the RTP relate to the SFTP? Regional Transportation
Orange Line Bus Rapid Transit (BRT) Improvements San Fernando Valley Service Council April 3, 2019
 Improvements San Fernando Valley Service Council April 3, 2019") Orange Line Bus Rapid Transit (BRT) Improvements San Fernando Valley Service Council April 3, 2019 1 Measure M Transit Projects in San Fernando Valley 2 1 2 Measure M Transit Projects Schedule Project
Orange Line Bus Rapid Transit (BRT) Improvements San Fernando Valley Service Council April 3, 2019 1 Measure M Transit Projects in San Fernando Valley 2 1 2 Measure M Transit Projects Schedule Project
TBARTA USF to Wesley Chapel Express Bus Service Operating Plan. Draft 3/25/2014
 TBARTA USF to Wesley Chapel Express Bus Service Operating Plan Draft 3/25/2014 March 2014 Table of Contents 1.0 Introduction... 1 2.0 Study Area... 1 3.0 Existing Available Service... 3 4.0 Proposed Service...
Colorado Association of Ski Towns August 26, 2016
 Colorado Association of Ski Towns August 26, 2016 1 Presentation RFTA Overview Long Range Forecast Integrated Transportation System Plan Questions Roaring Fork Transportation Authority (RFTA) RFTA Overview
Proposed FY Capital Improvement Program (CIP) March 5, 2018 Capital Planning Committee 1
 March 5, 2018 Capital Planning Committee 1") Proposed FY 2019-2023 Capital Improvement Program (CIP) March 5, 2018 Capital Planning Committee 1 The Capital Improvement Program is: A fiscally constrained, 5-year program of capital projects An implementation
Proposed FY 2019-2023 Capital Improvement Program (CIP) March 5, 2018 Capital Planning Committee 1 The Capital Improvement Program is: A fiscally constrained, 5-year program of capital projects An implementation
KEY BUS ROUTE IMPROVEMENT PROJECT ROUTE 23 AGENDA
 KEY BUS ROUTE IMPROVEMENT PROJECT ROUTE 23 December 9, 2009 Codman Tech 450 Washington Street AGENDA Introduction Key Bus Routes Program Route 23 Challenges Proposed Improvement Plan Next Steps Question
T-THIRD PHASE 3 CONCEPT STUDY C: DETAILED DESCRIPTIONS OF CONCEPT ALIGNMENTS D: CONSTRUCTABILITY ANALYSIS AND COST ESTIMATES (HNTB CONSULTANTS)
") A: 2014 SFMTA TRANSIT SERVICE INFORMATION B: SFMTA TRAFFIC COUNT DATA C: DETAILED DESCRIPTIONS OF CONCEPT ALIGNMENTS D: CONSTRUCTABILITY ANALYSIS AND COST ESTIMATES (HNTB CONSULTANTS) E: LAND USE AND VALUE
A: 2014 SFMTA TRANSIT SERVICE INFORMATION B: SFMTA TRAFFIC COUNT DATA C: DETAILED DESCRIPTIONS OF CONCEPT ALIGNMENTS D: CONSTRUCTABILITY ANALYSIS AND COST ESTIMATES (HNTB CONSULTANTS) E: LAND USE AND VALUE
Measure R Funded Transit Projects
 Measure R Funded ransit Projects Crenshaw/LAX ransit Corridor New Potential LAWA erminal & Ground Access Facilities ypes of Connections Direct Light Rail ransit (LR) Branch Metro goes to the airport Metro
San Francisco Transportation Plan
 San Francisco Transportation Plan Overview and Findings to Date November 13, 2012 www.sfcta.org/movesmartsf twitter.com/sanfranciscota www.facebook.com/movesmartsf Purpose of the SFTP San Francisco s long-range
REPORT CARD FOR CALIFORNIA S INFRASTRUCTURE WHAT YOU SHOULD KNOW ABOUT CALIFORNIA S TRANSIT FACILITIES
 TRANSIT GRADE: C- WHAT YOU SHOULD KNOW ABOUT TRANSIT FACILITIES California needs robust, flexible and reliable transit systems to reduce peak congestion on our highways, provide options for citizens who
RECOMMENDED ALTERNATIVE REPORT
 DRAFT METROCENTER CORRIDOR STUDY RECOMMENDED ALTERNATIVE REPORT JULY 12, 2005 TABLE OF CONTENTS SECTION PAGE 1.0 INTRODUCTION... 1 2.0 TIER 1 ALTERNATIVES EVALUATION... 1 3.0 TIER 2 ALTERNATIVES EVALUATION...
Treasure Island Mobility Management Program
 Treasure Island Mobility Management Program Preliminary Toll Policy Recommendations For Buildout Year (2030) Draft SAN FRANCISCO COUNTY TRANSPORTATION AUTHORITY May 20, 2015 About the Treasure Island Mobility
3.15 SAFETY AND SECURITY
 3.15 SAFETY AND SECURITY Introduction This section describes the environmental setting and potential effects of the alternatives analyzed in this EIR with regard to safety and security in the SantaClara-Alum
Streetcar Level Boarding Background Memo
 Level Boarding Background Memo Introduction This memo has been prepared by the and the Community Coalition to facilitate industry discussion on the application of level boarding concepts to US modern streetcar
V03. APTA Multimodal Operations Planning Workshop August Green Line LRT
 V03 APTA Multimodal Operations Planning Workshop August 2016 Green Line LRT 2 Presentation Outline Past Present Future 3 16/03/2016 RouteAhead Update 4 4 16/03/2016 RouteAhead Update 5 5 16/03/2016 6 6
Toolbox Transit Presentation Professors Joseph DiJohn and Siim Sööt University of Illinois at Chicago
 Toolbox Transit Presentation Professors Joseph DiJohn and Siim Sööt University of Illinois at Chicago Brief History of the RTA Early years Private operators CTA formed in 1946 1974 Referendum to create
Treasure Island Mobility Management Program
 Treasure Island Mobility Management Program Preliminary Toll Policy Recommendations For Buildout Year (2030) Draft TIDA CAB June 2, 2015 About the Treasure Island Mobility Management Program 2003 2008
Electric Multiple Unit Procurement Update
 Electric Multiple Unit Procurement Update Public Meetings September 2014 Caltrain Today 2 1 Key Facts Diesel commuter rail system SF to SJ area 77 mile corridor, 32 stations 92 trains / weekday Ridership:
HOT Lanes: Congestion Relief and Better Transit
 HOT Lanes: Congestion Relief and Better Transit Robert W. Poole, Jr. Director of Transportation Studies Reason Foundation www.reason.org/transportation Basic Thesis: Current Transportation Plans Need Rethinking
Arterial BRT Quarterly Update
 Arterial BRT Quarterly Update Transportation Committee June 24, 2013 Katie Roth, AICP Senior Planner, BRT/Small Starts 612-349-7772 Charles Carlson Senior Manager, BRT/Small Starts 612-349-7639 1 Arterial
Draft Results and Recommendations
 Waco Rapid Transit Corridor (RTC) Feasibility Study Draft Results and Recommendations Chris Evilia, Director of Waco Metropolitan Planning Organization Allen Hunter, General Manager Waco Transit System
Metropolitan Council Budget Overview SFY
 Metropolitan Council Budget Overview SFY 2016-2017 H T t ti C itt House Transportation Committee February 4, 2015 Transit connects us to the places that matter Transportation Needs Grow as the Region Grows
Santa Clara-Alum Rock Bus Rapid Transit (BRT) Project. Project Update July 2014
 Project. Project Update July 2014") Santa Clara-Alum Rock Bus Rapid Transit (BRT) Project Project Update July 2014 Today Overview of Santa Clara-Alum Rock Bus Rapid Transit and update on Construction Shelter Design Updates Construction Mitigation
Santa Clara-Alum Rock Bus Rapid Transit (BRT) Project Project Update July 2014 Today Overview of Santa Clara-Alum Rock Bus Rapid Transit and update on Construction Shelter Design Updates Construction Mitigation
CEDAR AVENUE TRANSITWAY Implementation Plan Update
 CEDAR AVENUE TRANSITWAY Implementation Plan Update EECUTIVE SUMMARY DECEMBER 2015 Executive Summary In 2013, the Twin Cities metropolitan area s first bus rapid transit (BRT) line, the METRO Red Line,
Application of IVI Technologies for Bus Rapid Transit Systems
 Application of IVI Technologies for Bus Rapid Transit Systems Authors: Matthew Hardy Lead Transportation Engineer Mitretek Systems 600 Maryland Ave., SW Suite 755 Washington, DC 20024 (202) 863-2982 matthew.hardy@mitretek.org
TORONTO TRANSIT COMMISSION REPORT NO.
 Revised: March/13 TORONTO TRANSIT COMMISSION REPORT NO. MEETING DATE: June 24, 2013 SUBJECT: NEW STREETCAR IMPLEMENTATION PLAN INFORMATION ITEM RECOMMENDATION It is recommended that the Board receive the
Presentation Overview. Stop, Station, and Terminal Capacity
 Stop, Station, and Terminal Capacity Mark Walker Parsons Brinckerhoff Presentation Overview Brief introduction to the project Station types & configurations Passenger circulation and level of service Station
6.0 Transit Technology Assessment
 6.0 Transit Technology Assessment 6.1 Introduction One of the first steps in the Southeast Corridor High Performance Transit Alternatives Study was to create a summary of the many different types of transit
A Transit Plan for the Future. Draft Network Plan
 A Transit Plan for the Future Draft Network Plan Project Overview and Status Completed Market Analysis and Service Evaluation. Developed Plan Framework and Guiding Principles. Developed a draft Five Year
THE WILSHIRE CORRIDOR: RAIL AND ITS ALTERNATIVES. Prepared By: Jacki Murdock Transportation and Environmental Planner
 THE WILSHIRE CORRIDOR: RAIL AND ITS ALTERNATIVES Prepared By: Jacki Murdock Transportation and Environmental Planner December 13 th, 2012 Overview Characteristics of Wilshire Boulevard Overview of the
Transportation 2030 Total (projected 15 year total) BETTER ROADS
 BETTER ROADS") 2 TRANSPORTATION 2030 EXECUTIVE SUMMARY WHAT IS TRANSPORTATION 2030? In November 2013, Mayor Ed Lee accepted the Transportation Task Force recommendations to pursue new resources for San Francisco s transportation
2 TRANSPORTATION 2030 EXECUTIVE SUMMARY WHAT IS TRANSPORTATION 2030? In November 2013, Mayor Ed Lee accepted the Transportation Task Force recommendations to pursue new resources for San Francisco s transportation
Draft Results and Open House
 Waco Rapid Transit Corridor (RTC) Feasibility Study Draft Results and Open House Chris Evilia, Director of Waco Metropolitan Planning Organization Allen Hunter, General Manager Waco Transit System Jimi
IMPROVEMENT CONCEPTS
 IMPROVEMENT CONCEPTS for the South Novato Transit Hub Study Prepared by: January 11, 2010 DKS Associates With Wilbur Smith Associates IMPROVEMENT CONCEPTS Chapter 1: Introduction 1. INTRODUCTION The strategic
Opportunities for Improved Bus Service on Finch Avenue 27 April 2011
 Opportunities for Improved Bus Service on Finch Avenue 27 April 2011 Background The inclusion of Finch Avenue as one of the higher-priority applications of light rail transit (LRT) service embodied in