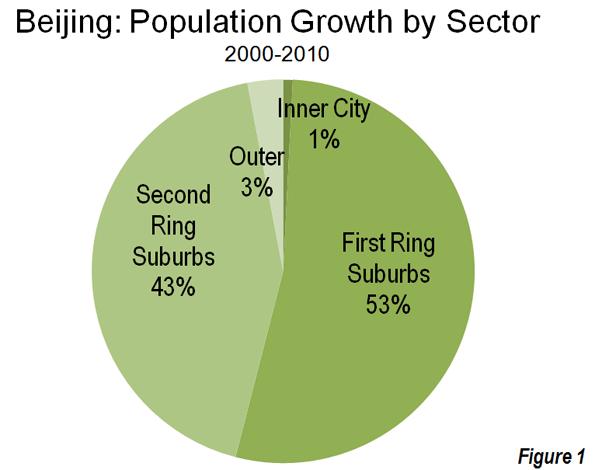
Interaction between Land Use and Urban Transport
|
|
|
- Clementine Hicks
- 5 years ago
- Views:
Transcription


1 Interaction between Land Use and Urban Transport Addis Abeba (SW) 27 October 2012 Wendell Cox Demographia
2 OUTLINE Perspective The Evolving Urban Form Transport and the City Realities and Challenges


3 Los Angeles
4

5 Chongqing PERSPECTIVE & RESOURCES
6
7 RESOURCES DEMOGRAPHIA WORLD URBAN AREAS (9 TH EDITION 2013) THE EVOLVING URBAN FORM THE NEW GEOGRAPHY DEMOGRAPHIA INTERNATIONAL HOUSING AFFORDABILITY SURVEY (9 TH EDITION 2013) WEBSITE
8 History of Humanity ETHIOPIA: BIRTHPLACE OF LUCY Economist Steven Landsburg (2007): Modern humans first emerged about 100,000 years ago. For the next 99,800 years or so, nothing happened. Well, not quite nothing. There were wars, political intrigue, the invention or agriculture but none of that stuff had much effect on the quality of people s lives. Almost everyone lived on the modern equivalent of $400 to $600 a year, just above the subsistence level. True there were always aristocracies who lived far better, but numerically, they were quite insignificant.
9 GDP/Capita: Richest Nation: 2000$ Highest National GDPs: $45,000 $40,000 $35,000 $30,000 $25,000 $20,000 $15,000 $10,000 $5,000 $0 650 BC TO PRESENT PRINCIPAL MODE From Maddison (OECD) Walking Mass Transit Auto Figure 9
10 World s Largest Cities (Urban Areas) 650 BC TO PRESENT Population (Millions) BC From Chandler 400BC 200BC 100AD Year: (Irregular Scale) Figure 10
11
12 Urban Areas: Densities from 17 th Century PARIS, LONDON, NEW YORK & LOS ANGELES 70,000 Population per Square Kilometer 60,000 50,000 40,000 30,000 20,000 Paris London New York Data Points 2000, 1950,1900, 1850, 1800 London 1700 (1680), Paris ,000 Los Angeles

13 Dubai THE PURPOSE OF CITIES


14 Why Cities (Urban Areas) Exist THE PURPOSE OF CITIES Urban areas exist because of the economic opportunities they provide. The purpose of urban areas is to improve the affluence of their residents

15 Purpose of Cities is Economic PEOPLE MOVE THERE FOR BETTER LIVES Shanghai
16 Why Cities Grow (Their Purpose) ALAIN BERTUAD, FORMER WORLD BANK PLANNER The raison d être of large cities is the increasing return to scale inherent to large labor markets. The cities economic efficiency requires, therefore, avoiding any spatial fragmentation of labor markets.

17 Global Scaling Research Double city size, 15% productivity improvement
18 Chennonceaux Aspiration

19 Shenyang THE EVOLVING URBAN FORM
20 City (Urban Organism) Metropolitan Area or Labor Market (Functional Expanse) Urban Area or Agglomeration (Physical Expanse)
 PARIS URBAN AREA PARIS METROPOLITAN AREA Exurban Area")
21 Definition of Urban Terms PARIS METROPOLITAN AREA (AIRE URBAINE) PARIS URBAN AREA PARIS METROPOLITAN AREA Exurban Area (Rural)
22
23 Tokyo-Yokohama Jakarta Seoul-Incheon Delhi, DL-HR-UP Shanghai, SHG Manila New York, NY-NJ-CT Sao Paulo Karachi Mexico City Beijing, BJ Guangzhou-Foshan, GD Osaka-Kobe-Kyoto Mumbai, MAH Moscow Los Angeles, CA Cairo Dhaka Kolkota, WB Buenos Aires Largest Urban Areas in the World POPULATION: Millions
24 Largest 10 Year Historical Growth Rates WORLD METROPOLITAN REGIONS Beijing: Delhi: Dhaka: Jakarta: Karachi: Manila: Adjusted to 10 Year Rate Mumbai: Shanghai: Shenzhen: Tokyo: Population Change in Millions Figure 24
25
26 Dhaka, Bangladesh Chittagong, Bangladesh Most Dense World Urban Areas OVER 2.5 MILLION POPULATION: 2012 Mumbai, India Surat, India Hong Kong, China Ahmadabad, India Bogota, Colombia Medellin, Colombia Jaipur, India Metric Measure Karachi, Pakistan 0 7,500 15,000 22,500 30,000 37,500 45,000 Population per Square Kilometer Figure 26
27 Urban Area Average Population Densities DHAKA & SELECTED (METRIC MEASURE) Dhaka Mumbai Karachi Hong Kong Manila Seoul Jakarta Paris Vancouver Portland Atlanta Less Developed World More Developed World 0 10,000 20,000 30,000 40,000 50,000 Population per Square Kilometer Figure 27

28 Density Profiles at the Same Scale 7 METROPOLITAN AREAS: BERTAUD, 2003
29 Neighborhood Densities: Examples (WITHIN CITIES) 2,000,000 1,750,000 Population per KM 2 1,500,000 1,250,000 1,000, , , ,000 0 Kowloon Walled City 1990 Dhaka-Ward 28 Hong Kong: Tsueng Wan Centre New York: Highest 1910 Mumbai Marine Lines Paris 11 Arr.

30 Kowloon Walled City (Hong Kong)

31 Dhaka picture Slum (Dhaka)
32 Average Population Densities: 2012 URBAN AREAS OVER 2.5 MILLION: SUB-SAHARAN AFRICA Less Developed World More Developed World India Developing Africa China Japan Western Europe Canada Calculated from data in Demographia World Urban Areas 0 3,000 6,000 9,000 12,000 15,000 Average Population per Square Kilometer Figure 32
33 India Africa China Latin America Eastern Europe United Kingdom Japan Russia Western Europe New Zealand Canada Australia United States Urban Areas 500,000+: Density AVERAGE URBAN DENSITY (REGIONAL): ,000 6,000 9,000 12,000 15,000 Population per Square Kilometer

34 Coming to Terms with Global Urban Expansion
35 As Cities Become Larger They Become Less Dense

36 Addis Abeba Urban Area: Evolution
37

38 Cairo Urban Area: Evolution
39 Cairo Population by Governate: CAIRO METROPOLITAN AREA Population in Millions Kalyoubia Giza 5 Cairo Figure 39

40 Guangzhou-Foshan Dongguan Jiangmen Zhongshan Shenzhen Hong Kong Figure 40 Zhuhai Macau Pearl River Delta Urban Areas
41 Guangzhou-Foshan Pre-Lehman Brothers Population Losses : BY SHARE MARKET OF METROPOLITAN CLASSIFICATION GROWTH Outer Suburbs & Exurbs 38% Core Districts 23% Inner Suburbs 39% Figure 41
42 Population Increase in Millions Shanghai Population by Sector CHANGE: Source: Census of India Inner Core Outer Core Suburban Figure 42
43 Shanghai Population Density by Sector CHANGE: ,000 Population per Square KM 60,000 50,000 40,000 30,000 20,000 10, Inner Core Outer Core Suburban Figure 43
44
45 Shenzhen Inner & Outer Area Population Population in Millions OUTER DISTRICTS 2 CORE DISTRICTS Figure 45
46 30 Jakarta: Population: CORE & SUBURBAN POPULATION Population in Millions Inner suburb data not available before 2000 SUBURBS & EXURBS OUTER SUBURBS & EXURBS INNER SUBURBS 5 JAKARTA (CORE) Figure 46
47 Pre-Lehman Jakarta: Growth Brothers by Sector Losses BY MARKET CLASSIFICATION Jakarta 16% Outer Suburbs & Exurbs 53% Inner Suburbs 31% Figure 47
48 Population Increase in Millions Delhi Urban Area Population by Sector CHANGE: Source: Census of India 0.0 Inner NCT Balance Outside NCT Figure 48
49 Population Increase in Millions Delhi Urban Area Population by Sector CHANGE: Source: Census of India 0.0 Inner NCT Balance Outside NCT Figure 49
50 Population by District: MUMBAI METROPOLITAN REGION 30,000,000 25,000,000 RAIGAHR 20,000,000 15,000,000 THANE 10,000,000 5,000,000 OUTER MUMBAI 0 INNER MUMBAI
51 16 Kolkata Urban Area: CORE & SUBURBAN POPULATION 14 Population in Millions SUBURBS 2 KOLKATA (CORE) Figure 51
52 Core & Suburban Population: MANILA URBAN AREA Population in Millions SUBURBS MANILA (CORE) Figure 52
53 Manila Pre-Lehman Urban Area Brothers Population Losses by Sector BY MARKET ESTIMATED CLASSIFICATION : 2010 Outer Suburbs 41% Manila 8% Inner Suburbs 51% Figure 53
54 Moscow Pre-Lehman Area Population Brothers Growth Losses by Sector BY MARKET CLASSIFICATION Suburban 27% Inner Moscow 3% Outer Moscow 70% Figure 54
55 Ho Chi Minh City Population by Sector Source: Derived from Asian Development Bank data PAST AND PROJECTED Outside Ho Chi Minh City Millions Urban Fringe Suburban Inner Core Outer Core
56 12 Sao Paulo Urban Area Population : CORE CITY AND SUBURBS 10 8 Millions Figure 56


57 Istanbul Urban Area: Figure 57
58 8 7 6 Istanbul: Population by Sector 1985, 2000 & Millions Core Inner Suburbs Outer Suburbs Exurbs Figure 58
59
60 In Situ Urbanisation


61 High Income World: 1960s-2000s NEARLY ALL URBAN GROWTH IN SUBURBS: 35+YEARS 114% 97% 94% 93% 92% Australia Canada United States Western Europe Japan Moscow
62 New York Urban Area Expansion POPULATION & URBAN LAND AREA % 180% 160% 140% 120% 100% 80% 60% Urban Land Area 40% 20% Population 0% Figure 62
63 New York Urban Area Population Growth Population in Millions SUBURBS CITY OF NEW YORK Figure 63
64 Seattle Metropolitan Region: ,500,000 4,000,000 POPULATION (COMBINED STATISTICAL AREA) 3,500,000 3,000,000 2,500,000 2,000,000 1,500,000 Data from US Census Bureau Exurban Outer Suburbs 1,000, ,000 City of Seattle Inner Suburbs Figure 64

65 Paris Urban Area Expansion
66 Paris Urban Area Population Growth Population in Millions SUBURBS 2 VILLE DE PARIS Figure 66
67 450,000 Barcelona: Growth By Sector , ,000 Population Growth 300, , , , , , ,000 50, ,000 0 City of Barcelona Balance of Urban Area Balance of Metropolitan Area Figure 67
68 25,000,000 Seoul Metropolitan Area: POPULATION BY PROVINCIAL LEVEL JURISDICTION 20,000,000 METROPOLITAN AREA 15,000,000 10,000,000 MUNICIPALITY OF SEOUL GYEONGGI 5,000,000 0 MUNICIPALITY OF INCHEON
69 Tokyo Core & Suburban Population ,000,000 25,000,000 20,000,000 Data: Japan Statistics Bureau 23-Wards (Core) Suburban Population 15,000,000 10,000,000 5,000, Figure 69
70 % of Housing Detached Tokyo: Detached Housing Share: 2006 BY DISTANCE FROM CENTRAL TOKYO: % 80% 70% 60% 50% 40% 30% 20% 10% Data: Japan Statistics Bureau Detached Housing 44.3% (Region) 0% Distance from Central Tokyo (Kilometers) Figure 70
71 8,000,000 7,000,000 6,000,000 Hong Kong Population by Sector New Territories Kowloon Hong Kong Island Population by Sector 5,000,000 4,000,000 3,000,000 2,000,000 1,000, Figure 71
72 1,400,000 1,200,000 1,000, , , , ,000 Zürich Urban Area Population Growth CITY & SUBURBAN RINGS: Source: Statistik Stadt Zürich & FSO Suburban Rings 4-6 ( ) Suburban Rings 1-3 ( ) City Figure 72
73 Why Urban Expansion Happens Natural growth & migration Migrants are lower income Price of land on periphery is less Transport improvements
74 Population, Households & Employment 160% U.S. CHANGE: % Households 120% 100% Employment 80% 60% 40% Population 20% 0%
75 US: Age in 2000: Change by 2010 MAJOR METROPOLITAN AREAS: CORE & SUBURBAN 15.0% 10.0% Change in Population: % 0.0% -5.0% -10.0% -15.0% Historic Core Cities Suburbs Population in 2010 Compared to in 2000 Source: US Census Data -20.0%
76 US: Age in 2000: Change by 2010 MAJOR METROPOLITAN AREAS: CORE & SUBURBAN 0.0% -2.0% Historic Core Cities Suburbs Other Change in Population: % -6.0% -8.0% -10.0% -12.0% Population in 2010 Compared to in 2000 Source: US Census Data -14.0%
 Downtown Toronto: 325,000-6")
77 Largest Employment Centre in Canada Chicago? Pearson picture PEARSON AIRPORT AREA 355,000 Employees, 120 KM 2 (<10% Transit) Downtown Toronto: 325,000-6 KM 2 (67% Transit) Downtown Montreal 240,000-5 KM 2 (59% Transit)

78 Difficult for Public Transport To Compete With Auto To Such Locations Luis Berini Center (Peripheral Center)

79 Cairo TRANSPORT AND THE CITY

80 Democratization of Prosperity ASSOCIATION BETWEEN MOBILITY & AFFLUENCE Chicago Time is Money Reduced Minority Unemployment With Cars U. of California PRUD HOMME Mobility Improves Productivity U. Of Paris HARTGEN-FIELDS Mobility Improves Productivity
81 Daily Motorized Trips & GDP/Capita 1995 DATA $40,000 $35,000 $30,000 $25,000 $20,000 $15,000 $10,000 $5,000 $0 1995$ (OECD) R 2 = 0.71 (1% Conf. Level) Africa Japan High-Income Asia Low Income Asia Western Europe Latin America Canada United States Eastern Europe Middle-Income Asia Australia-NZ Daily Trips
82 Mass Transit Service Densities MILLENNIUM CITIES DATABASE: 1995 Manila Hong Kong Dakar Singapore Zurich Vienna Tokyo Paris Toronto New York Vancouver Denver Calculated from data in Millennium Cities Database (UITP) Vehicle Kilometers per Square Kilometers Figure 82

83 Why are all these people in cars? Toronto
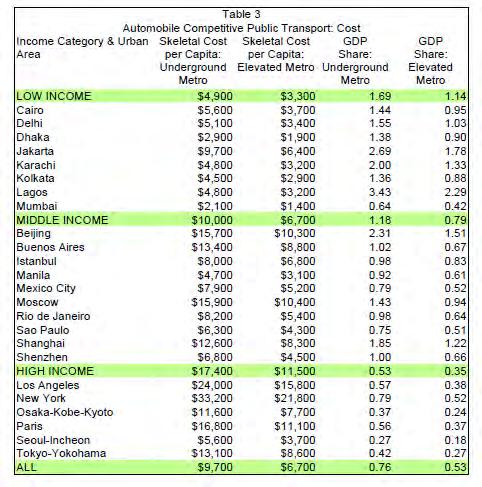
84 Transit: Strong Downtown: Weak Elsewhere SEATTLE URBAN AREA: 2000 EMPLOYMENT # OF TRANSIT COMMUTERS Elsewhere 87% Downtown 13% Elsewhere 43% Downtown 57%


85 Transit & Auto Access: 30 Minutes FROM CENTRAL VANCOUVER TRANSIT AUTO
86 Travel by Transit Takes Longer 6 MAJOR METROPOLITAN AREAS: CANADA One Way Work Trip Minutes All Car Transit
87

88 Perth Western Europe, United States & the West There is no practical mass transit for most trips
89 Capability of Transit: 45 Minute Job Access METROPOLITAN AREAS OVER 2,000,000: 2008 Atlanta Baltimore Boston Chicago Cincinnati Cleveland Dallas-Fort Worth Denver Detroit Houston Kansas City Los Angeles Miami Minneapolis-St. Paul New York Orlando Philadelphia Phoenix Pittsburgh Portland Riverside-San Bernardino Sacramento San Antonio San Diego San Francisco Seattle St. Louis Tampa-St. Petersburg Washington Accessible by Transit Not Accessible by Transit Average Transit Job Access: 5.6% (NYC: 9.8%) 0% 10% 20% 30% 40% 50% 60% 70% 80% 90% 100%
90 100% Public Transport: 7 US Largest Markets ACCESS TO TRANSIT STOPS/ACCESS TO JOBS 90% 80% 70% 60% 50% 40% 30% 20% 10% 0% 90.3% Public Transport within Walking Distance NY, CHI, LA, WDC, SF, BOS, PHI Average work trip travel time: Car alone: 24.0 minutes Public transport: 47.4 minutes 8.1% 45 Minute Job Access
91 Paris Suburbs: Cars Provide Quicker Travel FROM MAJOR SUBURBAN RAIL STATIONS: 1 HR TO JOBS Paris Jobs Accessible 84% Auto 16% Not Accessible Transit 59% Not Accessible Jobs Accessible 41%

92 Public Transport & Auto Market Shares Paris Metropolitan Area Car Public Transport
93 Transit s Last Kilometer Problem ELSEWHERE TRANSIT IS SLOWER FOR MORE TRIPS Annual Cost: More than gross annual income of metropolitan area An auto competitive system for Portland? 800 Meter Metro Grid Required
94
95 Ho Chi Minh City Area: Travel Share 2007 Source: Derived from Asian Development Bank data Transit 8% Automobile 1% Motorcycle 91%
96 Density & Roadway Travel ROAD VEHICLES: MAJOR METROPOLITAN COUNTIES Daily Vehicle Travel (KMs) per Square KM 450, , , , , , , ,000 50,000 R 2 = % confidence level 422 Counties in 51 Metropolitan Areas Over 1,000,000 y = x R² = ,000 10,000 15,000 20,000 25,000 30,000 Population Density (Population per Square KM):

97 3,500 3,000 2,500 2,000 1,500 Higher Density Means More Traffic Congestion DENSITY & TRAFFIC VOLUMES: INTERNATIONAL Vehicle Hours/KM 2. R² = , Population/ KM 2 Hong Kong 0 2,000 4,000 6,000 8,000
98 3.5 Density & Traffic Congestion UNITED STATES, CANADA & EUROPE Index USA Canada Europe 0.0 Average Urban Density Traffic Congestion (Excess Travel Time) Figure 98

99 Automobile Market Penetration 0.75 AUTOS PER HOUSEHOLD
100 Comparing Toronto & Dallas-Fort Worth URBAN AREAS COMPARED (2010 & 2011) Toronto Dallas-Ft. Worth Toronto/ DFW Population (Population Centre/Urban Area) 5,132,794 5,121, % Land Area (KM 2 ) 1,751 4, % Density 2,931 1, % One Way Work Trip % Reach Work in 30 Minutes 48% 59% -18.6% Median Multiple (House Price/Household Income % Transit Work Trip Share 21% 2% 935.0%
101 100% 90% 80% 70% 60% 50% 40% 30% 20% 10% 0% Hong Kong & Atlanta: Motorized Travel MASS TRANSIT & AUTO MARKET SHARE Hong Kong Cars (& Motorcycles) Mass Transit Atlanta Figure 101
")
102 A well governed city delivers: Mobility & economic growth Lower cost of living (housing affordability) Shenzhen
 Kolkata")
103 REALITY & CHALLENGES (CONCLUSION) Kolkata

104 $50,000 $45,000 $40,000 $35,000 $30,000 $25,000 $20,000 $15,000 $10,000 $5,000 $0 Manila Prosperity is not Guaranteed ECONOMIC POLICIES MATTER Japan United States Germany Argentina


105 Chennonceaux Aspiration

106 Bucharest Increasing Motorization


107 Evolution of Urban Growth Curitiba and Metropolitan Region YEAR POPULATION


108 ECONOMIC GROWTH: REQUIRED FOR SOCIAL COHESION
PHILADELPHIA SUBURBAN RAIL SUMMARY (COMMUTER RAIL, REGIONAL RAIL)
") PHILADELPHIA SUBURBAN RAIL SUMMARY (COMMUTER RAIL, REGIONAL RAIL) October 2003 The Philadelphia commuter rail service area consists of 5.1 million people, spread over 1,800 square miles at an average population
PHILADELPHIA SUBURBAN RAIL SUMMARY (COMMUTER RAIL, REGIONAL RAIL) October 2003 The Philadelphia commuter rail service area consists of 5.1 million people, spread over 1,800 square miles at an average population
Reducing Vehicle Use in Megacities Johanna Partin, N. America Regional Director Transportation and Energy Conference August 8, 2013
 Reducing Vehicle Use in Megacities Johanna Partin, N. America Regional Director Transportation and Energy Conference August 8, 2013 1 1 Megacities and Climate Change 2 C40 Cities Climate Leadership Group
NEW YORK SUBURBAN RAIL SUMMARY (COMMUTER RAIL, REGIONAL RAIL)
") NEW YORK SUBURBAN RAIL SUMMARY (COMMUTER RAIL, REGIONAL RAIL) October 2003 New York: The New York commuter rail service area consists of 20.3 million people, spread over 4,700 square miles at an average
NEW YORK SUBURBAN RAIL SUMMARY (COMMUTER RAIL, REGIONAL RAIL) October 2003 New York: The New York commuter rail service area consists of 20.3 million people, spread over 4,700 square miles at an average
PROMETHEE-compatible presentations of multicriteria evaluation tables
 PROMETHEE-compatible presentations of multicriteria evaluation tables Karim Lidouh, Anh Vu Doan*, Yves De Smet CoDE-SMG, Université libre de Bruxelles 2nd International MCDA Workshop on PROMETHEE: Research
Shifting Modes and Reducing Travel for Energy Conservation: Evidence from North America
 Shifting Modes and Reducing Travel for Energy Conservation: Evidence from North America Asia Pacific Energy Research Center Annual Conference 26 February 2013 Dr. Craig Townsend, Concordia University Montreal,
The Green Dividend. Cities facilitate less driving, saving money and stimulating the local economy. Joseph Cortright, Impresa September 2007
 The Green Dividend Cities facilitate less driving, saving money and stimulating the local economy Joseph Cortright, Impresa September 2007 Does being green pay? Is conservation just noble self-sacrifice;
Urban Transportation in the United States: A Time for Leadership
 Urban Transportation in the United States: A Time for Leadership Presentation by Wendell Cox Preserving the American Dream Conference Raleigh-Durham 10 January 2003 American Urban Areas: Transport Crisis
Measuring Accessibility. Andrew Owen Director, Accessibility Observatory May 17, 2017
 Measuring Accessibility Andrew Owen Director, Accessibility Observatory May 17, 2017 1. Overview 2. Methodology 3. Reporting Accessibility 4. Policy Implications 1. Overview What is Accessibility? Accessibility
C40 CITIES AS CHAMPIONS FOR COLLABORATIVE CHANGE
 C40 CITIES AS CHAMPIONS FOR COLLABORATIVE CHANGE THIS IS C40 83 members megacities & innovators Accra Addis Ababa Amman Amsterdam Athens Auckland Austin Bangkok Barcelona Basel Beijing Bengaluru Berlin
Emerging international best practices to promote electric vehicles
 Emerging international best practices to promote electric vehicles Nic Lutsey AVERE E-mobility Conference Amsterdam, Netherlands April 13, 2016 Global electric vehicle sales since 2009 Sales of electric
GROWTH & DEVELOPMENT. Residents enjoying the newly opened Brickell City Centre on Nov. 3, 2016.
 GROWTH & DEVELOPMENT Residents enjoying the newly opened Brickell City Centre on Nov. 3, 2016. 20 Growth & Development Overview With over 450,000 residents, the City of Miami is at the heart of one of
Modal Choice for Mass Rapid Transit
 Modal Choice for Mass Rapid Transit Session 1: Public Transport Beyond BRT - Light Rail Transit or Metro Niklas Sieber (PhD) and Olaf Scholz-Knobloch Transport Training Initiative TTi International Urban
2013 Study Tour. Density, Integrated Transport Networks, Affordable Housing & Urban Renewal
 Presentation to Department of Transport by Marion Fulker September 2013 2013 Study Tour Density, Integrated Transport Networks, Affordable Housing & Urban Renewal About us Purpose The Committee for Perth
Vehicle Miles Traveled in Massachusetts: Who is driving and where are they going?
 Vehicle Miles Traveled in Massachusetts: Who is driving and where are they going? A presentation to the House Committee on Global Warming and Climate Change Representative Frank Smizik, Chair April 13,
WORLD METRO FIGURES 2018
 STATISTICS BRIEF WORLD METRO FIGURES 8 INTRODUCTION Metros are of critical importance for mobility, as societies are becoming ever more urbanised. At the end of 7, there were metros in 82 cities in 56
BLACK KNIGHT HPI REPORT
 CONTENTS 1 OVERVIEW 2 NATIONAL OVERVIEW 3 LARGEST STATES AND METROS 4 MARCH S BIGGEST MOVERS 5 20 LARGEST STATES 6 40 LARGEST METROS 7 ADDITIONAL INFORMATION OVERVIEW Each month, the Data & Analytics division
Chapter 2 How Transportation Technology Has Shaped Urban Travel Patterns
 Chapter 2 How Transportation Technology Has Shaped Urban Travel Patterns 2.1 Introduction The primary functions of transportation are to facilitate the movement of people and goods and to provide access
An Overview of Rapid Transit Typical Characteristics. Date April 30, 2009
 An Overview of Rapid Transit Typical Characteristics Date April 30, 2009 Land Use and Transportation Is there a link? Streetcar Suburbs were the result of land developers creating streetcar lines in order
Transaction Trend. United States. Report Q LE s Real Estate Intelligence is Your Strategic Advantage
 Sa m pl e Q4 2016 United States Transaction Trend Report LE s Real Estate Intelligence is Your Strategic Advantage Lodging Econometrics 500 Market Street, Suite 13 Portsmouth, NH 03801-3481 USA +1 603.427.9542
India s Petrochemical Vision 2030 Opportunities and Challenges
 6 th Petrochemical Conclave India s Petrochemical Vision 2030 Opportunities and Challenges July 29, 2017 Vikas Kaushal Managing Director and Country Head A.T. Kearney, India Indian Petrochemical Sector
Economy Class 1-to-Go Promotion
 : on/before 11Oct13 : on/after 10Nov13 to on/before 15Dec13 Economy Class (E81SG) Outbound alid Inbound alid taxes Bangkok SQ974/ SQ976/ SQ978 SQ975/ SQ977/ SQ981 3 Days 7 Days 125 E81SG 298 Not 3 Days
Overview of Regional Commuter Rail Webinar: Phoenix, Arizona December 18, 2013
 Overview of Regional Commuter Rail Webinar: Phoenix, Arizona December 18, 2013 2013, All Rights Reserved. 1 The Maricopa Association of Governments (MAG) is the designated metropolitan planning organization
Changing Behavior and Achieving Mode Shi2 Goals
 Changing Behavior and Achieving Mode Shi2 Goals Tim Papandreou - Director Strategic Planning & Policy, San Francisco Municipal TransporaBon Agency Michael KeaBng - Founder & CEO, Scoot Networks Mike Mikos
UTA Transportation Equity Study and Staff Analysis. Board Workshop January 6, 2018
 UTA Transportation Equity Study and Staff Analysis Board Workshop January 6, 2018 1 Executive Summary UTA ranks DART 6 th out of top 20 Transit Agencies in the country for ridership. UTA Study confirms
Before the OFFICE OF THE SECRETARY OF TRANSPORTATION Washington, D.C
 Before the OFFICE OF THE SECRETARY OF TRANSPORTATION Washington, D.C. 20590 In the Matter of ) ) Request for Comments on the Scope of ) Docket No. DOT-OST-2018-0150 the Study on the Impact of Automated
Urban Mobility and Energy Trends in Istanbul
 Round Table National experiences in control of the energy on the sector of building» Event Energaia, December 10-12, 2008 Urban Mobility and Energy Trends in Istanbul Haluk GERÇEK (PhD), Istanbul Technical
The Escalation Roller Coaster and What You Can Do About It
 Since 1972 The Escalation Roller Coaster and What You Can Do About It Richard Vermeulen, Chief Estimator, Lead Economist Vermeulens.com GoToWebinar - Housekeeping: Time For Questions YOUR PARTICIPATION
Key Issue Four: Why do suburbs have distinctive problems? CHAPTER 13
 Key Issue Four: Why do suburbs have distinctive problems? CHAPTER 13 KEY ISSUE 4: PROBLEMS OF SUBURBS The peripheral model Density gradient Cost of suburban sprawl Suburban segregation Transportation and
Sustainable Urban Transport Index (SUTI)
") Sustainable Urban Transport Index (SUTI) City Comparisons & Way Forward PROF. H.M SHIVANAND SWAMY, CEPT UNIVERSITY DHAKA SEPTEMBER 12, 2018 Purpose Discussion of Results from 5 Cities Reflections on the
Sustainable Urban Transport Index (SUTI) City Comparisons & Way Forward PROF. H.M SHIVANAND SWAMY, CEPT UNIVERSITY DHAKA SEPTEMBER 12, 2018 Purpose Discussion of Results from 5 Cities Reflections on the
Information Technology and Economic Development: An Introduction to the Research Issues
 November 1998 Working Papers No. 153 Information Technology and Economic Development: An Introduction to the Research Issues TABLE 1 WORLD-WIDE INFORMATION TECHNOLOGY MARKET BREAKDOWN, 1995
Road Map for Sustainable Transport Strategy for Colombo Metropolitan Region with Cleaner Air, through Experience
 Workshop on Air Quality and Environmentally Sustainable Transport April 28 th 2011 Don S. Jayaweera Road Map for Sustainable Transport Strategy for Colombo Metropolitan Region with Cleaner Air, through
Arcadis on Smart CITIES
 Arcadis on Smart CITIES Erik van Jaarsveld 26 th October 2017 PROPOSITIONS GEOGRAPHY* Arcadis at a glance Program & Project Management Business Advisory Master Planning & Architecture Design & Engineering
Regional Integration of Public Transit - From the Perspective of a Transit Company. April 2019 Thomas Werner MVG Munich
 Regional Integration of Public Transit - From the Perspective of a Transit Company April 2019 Thomas Werner MVG Munich Facts about Munich Capital of the State of Bavaria Population: City ca. 1.5 million
Back to the Future? Land Use, Mobility & Accessibility in Metropolitan China Day 23 C. Zegras. Contents
 Back to the Future? Land Use, Mobility & Accessibility in Metropolitan China 11.953 Day 23 C. Zegras Contents Remember the Developing World..? Motorization! China: Motorization and its Challenges Land
TRANSPORT INFRASTRUCTURE
 TRANSPORT INFRASTRUCTURE Road Area & Traffic Index Traffic inefficiency Index 6 5 4 3 2 1 One-way traffic Time (minutes)-lhs Traffic Inefficiency Index-RHS 4 35 3 25 2 15 1 5 HCMC traffic index is still
Urban Mass Transit Goes Driverless
 Urban Mass Transit Goes Driverless Dr Gerard Yelloz Siemens Tansportation Systems Presentation APM 07 Siemens Urban Mass Transit Goes Driverless - Definitions MASS Transit = Light and Heavy metros greater
REDEFINING OPPORTUNITY A Strategic Connection to One of the World s Best Airports
 REDEFINING OPPORTUNITY A Strategic Connection to One of the World s Best Airports GLOBALLY CENTERED REAL ESTATE With approximately 16,000 of commercial development land, DEN Real Estate s Strategic Development
Building on our strong position in China
 KONE CMD 2018 Building on our strong position in China WILLIAM B. JOHNSON, EXECUTIVE VICE PRESIDENT, GREATER CHINA SEPTEMBER 25, 2018 NAVIGATING IN A CHANGING MARKET ENVIRONMENT CAPTURING THE OPPORTUNITIES
NRG evgo. Arun Banskota President NRG evgo
 NRG evgo Arun Banskota President NRG evgo evgo: Why? evgo will be the national, interoperable, EV charging network Electric Vehicles are here to stay evgo value will multiply exponentially Auto OEMs have
Electrifying shared mobility!
 Electrifying shared mobility! Pete Slowik! Roadmap 11! June 19 th, 2018! Global electric vehicle sales!! Through 2017, cumulative global light-duty EV sales passed 3.2 million"! Mostly the sales are in
Reducing Energy Consumption and Emissions Through Congestion Management
 Reducing Energy Consumption and Emissions Through Congestion Management Kanok Boriboonsomsin University of California Riverside The Transportation - Land Use - Environment Connection UCLA Conference Center
Planning of the HSR Network
 Engineering Services Department A Global Solution in Public Works Project China s High Speed Rail Network Susan Pan, P.E., Manager of Engineering County of Ventura, Planning of the HSR Network Planning
STATISTICS. Economic Research and Regional Cooperation Department. Core Indicators. Development Economics and Indicators Division
 Total Average Annual Growth Proportion of below $1.90 Purchasing Power Parity (PPP) a Day CORE INDICATORS Proportion of Living below the National Poverty Line Annual Growth Per Capita of Gross Gross National
Kenosha-Racine-Milwaukee (KRM)
") Kenosha-Racine-Milwaukee (KRM) Commuter Rail #147925 November 6, 2009 1 Guidance of KRM Commuter Rail Studies Intergovernmental Partnership Technical Steering Committee Temporary and Limited Authority
Kenosha-Racine-Milwaukee (KRM) Commuter Rail #147925 November 6, 2009 1 Guidance of KRM Commuter Rail Studies Intergovernmental Partnership Technical Steering Committee Temporary and Limited Authority
(annual average compound growth rate)
") Table 3-1. 3KDVHVRI*URZWKE\0DMRU5HJLRQ (annual average compound growth rate) 1820-70 1870-1913 1913-50 1950-73 1973-92 1820-1992 GDP Western Europe 1.7 2.1 1.4 4.7 2.2 2.2 Western Offshoots 4.3 3.9 2.8
Table 3-1. 3KDVHVRI*URZWKE\0DMRU5HJLRQ (annual average compound growth rate) 1820-70 1870-1913 1913-50 1950-73 1973-92 1820-1992 GDP Western Europe 1.7 2.1 1.4 4.7 2.2 2.2 Western Offshoots 4.3 3.9 2.8
Comparison of 2013 VMT Fatality Rates in the States and in High-Income Countries
 Comparison of 2013 VMT Fatality Rates in the States and in High-Income Countries Transportation Research Board 96th Annual Meeting Session 536 Analysis of International Road Safety Data January 10, 2017
Breakout Session. The Mobility Challenges of Our Growing & Sprawling Upstate
 Breakout Session The Mobility Challenges of Our Growing & Sprawling Upstate The Mobility Challenges of Our Growing & Sprawling Upstate Why is our suburban and sprawling development pattern a challenge
Our Topics. Urban mobility = automobiles! Urban mobility Future of Mobility 3.0 Models for change
 Urban Mobility Our Topics Urban mobility = automobiles! Urban mobility Future of Mobility 3.0 Models for change Urban mobility = automobiles! Urban mobility Urban mobility considers the ease/difficulty
Caltrain Downtown Extension Study Ridership Forecast Summary
 Caltrain Downtown Extension Study Ridership Forecast Summary presented to Transbay Joint Powers Authority presented by Cambridge Systematics date: March 12, 2009 Transportation leadership you can trust.
THE GROWTH OF HSR NETWORKS AROUND THE WORLD
 THE GROWTH OF HSR NETWORKS AROUND THE WORLD Frank Hanna 1, Jeremy Kaufmann 2 1 Associate Professor, Civil Engineering Technology, Environmental Management & Safety, Rochester Institute of Technology, Rochester,
Benchmarking Efficiency for MTA Services. Citizens Budget Commission April 6 th 2011
 Benchmarking Efficiency for MTA Services Citizens Budget Commission April 6 th 2011 In a 2006, the CBC recommended using unit cost measures and developing comparative measures, or benchmarking, as a tool
2017 EV Taiwan Marketing & Publicity Campaign Plans
 2017 EV Taiwan Marketing & Publicity Campaign Plans To speed up the development of EV industry, the Taiwan government is providing vast marketing-boosting opportunities. With Taiwan s well-established
Item
 Key Indicators for Asia and the Pacific 2010 POPULATION a Total population million; as of 1 July 18.17 18.55 18.93 19.33 19.73 20.14 20.56 20.99 21.42 21.87 22.32 22.79 23.30 23.82 24.36 24.91 25.47 26.04
P anorama 12 Brazil automotive Guide 2008
 Panorama 12 Brazil Automotive Guide 2008 Although consolidated, and prominent amongst the largest global producers, the Brazilian automotive industry wants more: to be even better. The automotive industry
Light rail, Is New Zealand Ready for Light Rail? What is Needed in Terms of Patronage, Density and Urban Form.
 Light rail, Is New Zealand Ready for Light Rail? What is Needed in Terms of Patronage, Density and Urban Form. THE PROBLEM LIGHT RAIL THE SOLUTION? INTRODUCTION Light rail transit (LRT) provides the opportunity
Leveraging Land Use Changes through Transportation Funding
 Leveraging Land Use Changes through Transportation Funding Railvolution 2005 September 10, 2005 James Corless Senior Planner What is the MTC region? 9 7 101 26 San Francisco Bay Area counties Million people;
Economy. 38% of GDP in 1970; 33% of GDP in 1998 Most significant decline in Manufacturing 47% to 29%
 Economy MCMA as important, but declining, force in national economy 38% of GDP in 1970; 33% of GDP in 1998 Most significant decline in Manufacturing 47% to 29% Relatively constant contribution of Financial
Top50. Passenger Rail Projects for 2007 THE U.S. AND CANADA S JUNE 2007 METRO MAGAZINE 21
 Top50 Passenger Rail Projects for 2007 JUNE 2007 METRO MAGAZINE 21 FUNDINGGLITCHE$ Impact Top Rail Projects While some agencies are hitting funding snags, Dallas Area Rapid Transit continues to move along
OPTIMAL POLICIES FOR TRANSIT INFRASTRUCTURE
 OPTIMAL POLICIES FOR TRANSIT INFRASTRUCTURE Presentation by Richard Gilbert At a conference entitled What is Good Public Policy in Canadian Municipalities? Ottawa, October 28-29, 2004 Enquiries to: richardgilbert1@csi.com
Q U.S. INDUSTRIAL & LOGISTICS FIGURES
 Q2 2018 U.S. INDUSTRIAL & LOGISTICS FIGURES Q2 2018 U.S. INDUSTRIAL & LOGISTICS FIGURES EXECUTIVE SUMMARY DEMAND AGAIN OUTSTRIPS NEW SUPPLY, RENTS TICK UP FURTHER Availability Rate 7.2% Vacancy Rate 4.4%
2018 ESCAP population data sheet
 2018 ESCAP data sheet Population and Development Indicators for Asia and the, 2018 Region, subregion, country, territory or area Population at mid-year Population growth 1 2 3 4 5 6 7 8 9 10 11 12 13 14
APPLICATION OF A PARCEL-BASED SUSTAINABILITY TOOL TO ANALYZE GHG EMISSIONS
 APPLICATION OF A PARCEL-BASED SUSTAINABILITY TOOL TO ANALYZE GHG EMISSIONS Jung Seo, Hsi-Hwa Hu, Frank Wen, Simon Choi, Cheol-Ho Lee Research & Analysis Southern California Association of Governments 2012
Global transport outlook to 2050 Targets and scenarios for a low-carbon transport sector
 OECD/IEA 2012 Global transport outlook to 2050 Targets and scenarios for a low-carbon transport sector John Dulac Energy Analyst, Energy Technology Policy Division International Energy Agency Content IEA
Thermal Coal Market Presentation to UNECE Ad Hoc Group of Experts on Coal in Sustainable Development December 7, 2004
 Thermal Coal Market Presentation to UNECE Ad Hoc Group of Experts on Coal in Sustainable Development December 7, 2004 Barlow Jonker Pty Ltd Commercial in Confidence 1 Presentation Outline 1. Barlow Jonker
Aerotropolises & Airport Cities State of the Industry and Best Practices Survey of 182 Aerotropolis and Airport City Locations
 Aerotropolises & Airport Cities State of the Industry and Best Practices Survey of 182 Aerotropolis and Airport City Locations The Big Idea Global Markets Regional Initiatives 2 1 How True is the Big Idea?
DAVID DAVID BURNS BURNS RAILROAD RAILROAD INDUSTRIAL INDUSTRIAL ENGINEERING ENGINEERING CONSULTANT CONSULTAN CHICAGO CHICAGO, USA, USA
 Does the Passenger Train have a Future? DAVID BURNS RAILROAD INDUSTRIAL ENGINEERING CONSULTANT CHICAGO, USA 1 The Answer! YES NO MAYBE It depends on where it is 2 2 Types of Passenger Trains People want
Sponsored by. The U.S. and Canada s
 Sponsored by The U.S. and Canada s Passenger Rail Projects for 2006 TOP Holding Steady with $60 BILLION Total Project Purse New Mexico s Rail Runner Express service is a new addition to this year s Top
HOT Lanes: Congestion Relief and Better Transit
 HOT Lanes: Congestion Relief and Better Transit Robert W. Poole, Jr. Director of Transportation Studies Reason Foundation www.reason.org/transportation Basic Thesis: Current Transportation Plans Need Rethinking
2020 and Beyond: Transport in Asia and the Pacific. 6th Regional EST Forum in Asia. United Nations Centre for Regional Development
 2020 and Beyond: TheGreen EconomyTransition for Transport in Asia and the Pacific 6th Regional EST Forum in Asia United Nations Centre for Regional Development Delhi, India Lloyd Wright 4 December 2011
TRANSIT DEMAND IN RURAL DOUGLAS COUNTY: PRELIMINARY BACKGROUND DATA
 TRANSIT DEMAND IN RURAL DOUGLAS COUNTY: PRELIMINARY BACKGROUND DATA Lawrence-Douglas County MPO Regional Transit Advisory Committee Lawrence, Kans. Tuesday October 31, 2017 Chris Zeilinger Assistant Director
MAGAZINE S. The U.S. and. Canada s. Top 50. Passenger Rail Projects for 2003
 MAGAZINE S The U.S. and Top 50 Canada s Passenger Rail Projects for 2003 Rail Projects Total $58 Billion intop 50 As the costs of war skyrocket, so do the costs of rail projects. Despite the waning economy,
Textile Per Capita Consumption
 November 2017 Textile Per Capita Consumption 2005-2022 Part 1: Lower middle income countries CHF300.- Table of Contents Preface... 4 Sources... 5 Definitions... 6 Charts... 7 Executive Summary... 9 Country
Table B1. Advanced Economies: Unemployment, Employment, and Real per Capita GDP (Percent)
") Statistical Appendix Table B1. Advanced Economies: Unemployment, Employment, and Real per Capita GDP (Percent) Unemployment Rate 2 Averages 1 1993 2002 2003 12 Advanced Economies 6.8 6.9 6.7 6.5 6.3 5.8
Statistical Appendix Table B1. Advanced Economies: Unemployment, Employment, and Real per Capita GDP (Percent) Unemployment Rate 2 Averages 1 1993 2002 2003 12 Advanced Economies 6.8 6.9 6.7 6.5 6.3 5.8
Primary energy. 8 Consumption 9 Consumption by fuel. 67 th edition
 Primary energy 8 Consumption 9 Consumption by fuel 67 th edition Primary energy Consumption* Growth rate per annum Million tonnes oil equivalent 27 28 29 2 211 212 213 214 215 216 217 217 26-16 Share 217
Management Strategy and Cases of Chinese Urban Mobility. Gong Liyuan Jinan Transport Research Center
 Management Strategy and Cases of Chinese Urban Mobility Gong Liyuan Jinan Transport Research Center April, 2014 Contents Ⅰ Background Ⅱ China is seeking for solutions to the problems Ⅲ Cases of urban traffic
SUSTAINABLE CITIES MOBILITY INDEX 2017 BOLD MOVES NORTH AMERICA EDITION
 SUSTAINABLE CITIES MOBILITY INDEX 2017 BOLD MOVES NORTH AMERICA EDITION 1.0 Foreword 2.0 Executive Summary 3.0 Sustainable Cities Mobility Index 3.1 THE IMPORTANCE OF SUSTAINABLE URBAN MOBILITY 3.2 OUR
Transit Benchmarking. October 1, 2012 APTA Annual Meeting. Transit Benchmarking
 October 1, 2012 APTA Annual Meeting Presentation Structure 1. Benchmarking and the RTSC at Imperial College London 2. Introduction to the Benchmarking Groups 3. Overview of the Benchmarking Process and
MOBILITY Moving towards a connected sustainable future
 CHASING URBAN MOBILITY Moving towards a connected sustainable future Arcadis Sustainable Cities Mobility Index 2017 Australia Pacific CONTENTS 1.0 Foreword 2.0 Executive Summary 3.0 Sustainable Cities
The USDOT Congestion Pricing Program: A New Era for Congestion Management
 The USDOT Congestion Pricing Program: A New Era for Congestion Management Patrick DeCorla-Souza, AICP Federal Highway Administration Presentation at Congestion Pricing Discovery Workshop Los Angeles, CA
Urban Transport systems in major cities in China. Sun Kechao Senior Engineer China Academy of Transportation Sciences, Beijing, China
 Urban Transport systems in major cities in China Sun Kechao Senior Engineer China Academy of Transportation Sciences, Beijing, China Part 1 Part 2 Part 3 Part 4 Introduction Urban transport policies Urban
BP Statistical Review of World Energy June 2017
 BP Statistical Review of World Energy June 217 Primary energy 8 Consumption 8 Consumption by fuel 9 66 th edition Primary energy Consumption* Growth rate per annum Million tonnes oil equivalent 26 27 28
2 VALUE PROPOSITION VALUE PROPOSITION DEVELOPMENT
 2 VALUE PROPOSITION The purpose of the Value Proposition is to define a number of metrics or interesting facts that clearly demonstrate the value of the existing Xpress system to external audiences including
Annual Report on National Accounts for 2015 (Benchmark Year Revision of 2011) Summary (Flow Accounts)
 Summary (Flow Accounts)") Annual Report on National Accounts for 2015 (Benchmark Year Revision of 2011) Summary (Flow Accounts) I. Overview of Benchmark Year Revision of 2011 P 2 II. Expenditure Series P 3 III. Income Series P
Annual Report on National Accounts for 2015 (Benchmark Year Revision of 2011) Summary (Flow Accounts) I. Overview of Benchmark Year Revision of 2011 P 2 II. Expenditure Series P 3 III. Income Series P
The Built Environment and Motor Vehicle Ownership & Use. Outline
 The Built Environment and Motor Vehicle Ownership & Use Evidence from Santiago de Chile Chris Zegras Assistant Professor Dept. of Urban Studies and Planning MIT czegras@mit.edu Outline Built Environment
Sustainable Railway Solutions
 Siemens Ltd., China Infrastructure & Cities Sector Rail Systems Head Office Beijing 7, Wangjing Zhonghuan Nanlu, Chaoyang District, 100102, Beijing Tel.: +86 10 6476 8888 Fax: +86 10 6476 4890 Branch Office
The Environmental Benefits and Opportunity of Shared Mobility
 The Environmental Benefits and Opportunity of Shared Mobility Sharon Feigon Executive Director November 17, 2014 SUMC: Our Mission and Founders 2 Mission: Scale the Benefits of Shared Mobility for Everyone
Clean Transportation. Clean. Progress for Better Air Quality. Progress for Better Air Quality. Thailand and Other Asia. Fuel Sulfur Reduction
 Clean Transportation Elements of a Comprehensive Vehicle Pollution Control Strategy Thailand and Other Asia An Update on Progress, Obstacles, Opportunities, and the Role for ICCT By Dr. Supat Wangwongwatana
World Geographic Shares
 World Geographic Shares North America South America Europe Africa Asia Australia/ Oceania 18% 13% 7% 22% 33% 6% World Population Shares North America South America Europe Africa Asia Australia/ Oceania
Performance Measure Summary - New York-Newark NY-NJ-CT. Performance Measures and Definition of Terms
 Performance Measure Summary - New York-Newark NY-NJ-CT There are several inventory and performance measures listed in the pages of this Urban Area Report for the years from 1982 to 2014. There is no single
6/6/2018. June 7, Item #1 CITIZENS PARTICIPATION
 June 7, 2018 Item #1 CITIZENS PARTICIPATION 1 Item #2 APPROVAL OF MINUTES Item #3 TRAC GOALS, FRAMEWORK & AGENDA REVIEW 2 COMMITTEE GOALS Learn about Southern Nevada s mobility challenges, new developments
Advantages of public transport
 Reading Practice Advantages of public transport A new study conducted for the World Bank by Murdoch University's Institute for Science and Technology Policy (ISTP) has demonstrated that public transport
2017 Asia s Best Motorcycle Sourcing Show for Customized and Quality Products
 2017 Asia s Best Motorcycle Sourcing Show for Customized and Quality Products As a land with the honor history for motorcycle industry, the motorcycle industry in Taiwan has seen robust development, and
TRAVEL DEMAND FORECASTS
 Jiangxi Ji an Sustainable Urban Transport Project (RRP PRC 45022) TRAVEL DEMAND FORECASTS A. Introduction 1. The purpose of the travel demand forecasts is to assess the impact of the project components
Small Vehicles for Sustainable Mobility
 Small Vehicles for Sustainable Mobility Günther Brauner Hybrid and electric vehicles, energy storage technologies and control systems National and international R&D-projects, research institutions and
Emerging Technologies & Autonomous Vehicle Readiness Planning. Georgia Planning Association Conference Jekyll Island, GA September 5, 2018
 Emerging Technologies & Autonomous Vehicle Readiness Planning Georgia Planning Association Conference Jekyll Island, GA September 5, 2018 Agenda 1 U.S. Context 2 U.S. Survey on Emerging Technologies &
The Century of Cities
 The Century of Cities 80% of the world economic output is concentrated in cities. Until 2025, the share of urban population will increase from 50% to 60%. Economic growth and urban sprawl mean more and
European Hotel Review
 United Kingdom United States Blue Fin Building 735 East Main Street 110 Southwark Street Hendersonville London SE1 0TA TN 37075 Phone: +44 (0)20 7922 1930 Phone: +1 (615) 824 8664 Fax: +44 (0)20 7922 1931
THE WILSHIRE CORRIDOR: RAIL AND ITS ALTERNATIVES. Prepared By: Jacki Murdock Transportation and Environmental Planner
 THE WILSHIRE CORRIDOR: RAIL AND ITS ALTERNATIVES Prepared By: Jacki Murdock Transportation and Environmental Planner December 13 th, 2012 Overview Characteristics of Wilshire Boulevard Overview of the
Sustainable Urban Traffic in Vietnam
 Sustainable Urban Traffic in Vietnam 1. Change of traffic guidelines and visions 2. Some facts about traffic in Vietnam 3. Observation of traffic situations and of traffic behavior 4. Lack of implementation
Q4,2012. Overseas Marketing Dept
 1.7% of all vehicle in the whole country is public transportation. Vehicle Public Transportation 25% of global primary energy used by transportation 30% of all energy- related emissions comes from transportation