The Screening and Selection of Regionally Significant Projects
|
|
|
- Evan Park
- 5 years ago
- Views:
Transcription
1 The Screening and Selection of Regionally Significant Projects UTC 2018 Seminar Series March 15, 2018 Claire Bozic Martin Menninger


2 ON TO 2050 CMAP is the Region s MPO, seven county region Land use and transportation plan every 4 yrs. ON TO 2050 will build on GO TO 2040 Draft in June 2018, Final in October 2018


3 Regionally Significant Projects Called Major Capital Projects new name reflects redefinition - Transit capacity projects (if $100 m and have separate ROW or priority over other traffic) Evaluation with travel demand model and select other methods - State of good repair / system preservation ($250 m or more) Document need for project, mostly qualitatively Evaluating - 65 transit projects - 23 expressway - 19 arterial projects

4 GO TO 2040 ON TO 2050 has built on the concepts and recommendations of GO TO 2040

5 A collaborative process Initially proposed 20 transit measures 6 measures were removed and 4 were added based on feedback from RTA and service boards
6 Parallel Modeling Processes CMAP Regional Transportation Authority Software CMAP Trip Based Model (Fortan, Emme, Python, ArcGis) STOPS and Access Tool (FTA Simplified Trips-on-Project, ArcGis) Projects Highway Transit
7 ON TO 2050 Transit Measures Increased from measures 11 in GO TO 2040 to 18 measures for ON TO 2050 Somewhat analogues to highway projects Incorporate new tools and data that have been developed Capture data related to policy goals Four categories - Capital and Operating Cost - Existing Needs - Travel Benefits - Planning Priorities


8 Transit Existing Needs GO TO 2040 Initial List Final List Asset condition - TERM scale Capacity constraint Reliability impact Address an existing ADA deficiency Asset condition - COST tool Capacity constraint Reliability impact Address an existing ADA deficiency
 Corridor congested VHT (daily) Project ridership (daily) Change in regional ridership (daily) Work trip travel time by transit (minutes) Project user work trip travel time")
9 Transit Travel Benefits GO TO 2040 Initial List Final List Regional congested VHT (daily) Corridor congested VHT (daily) Transit trips (daily) Work trip travel time by transit (minutes) Regional congested VHT (daily) Corridor congested VHT (daily) Project ridership (daily) Change in regional ridership (daily) Work trip travel time by transit (minutes) Project user work trip travel time Change in VMT (daily) Project ridership (daily) Change in regional ridership (daily) Absolute change in avg. work trip transit travel time Number of jobs accessible within 75 minutes by transit Number of jobs accessible within 75 minutes by transit Jobs accessible within 90/60-minutes for average resident

")
 Percent of trip origins within")
 Transit access score Economic impact from improved")
 Fraction of riders from")


10 Transit Planning Priorities GO TO 2040 Initial List Final List Percent of trip origins within current municipal borders New impervious surface in project corridor (acres) Number of households located in Green Infrastructure Vision areas Gross regional product ($ millions annually) TREDIS Percent change in job accessibility in environmental justice areas Carbon dioxide emissions (tons/year) Percent of trip origins within current municipal borders Local planning support Access to transit impact (CMAP developed index) Transit access score Economic impact from improved market access Residents within 90- minutes of access to an average key industry job Customer experience (qualitative) Fraction of riders from excluded communities Change in number of jobs accessible within 75 minutes for excluded communities Green house gas emissions Infill support Economic impact from improved market access Fraction of riders from Economically Disconnected Areas Low barrier jobs to excluded comm. 90/60 min Green house gas emissions Safety
11 Results DRAFT Project ID Name Implementer Submitter 94.94% x x 19 Status Asset condition Capacity constraint (1 = Capacity Need Current Reliability Reliability Impact Addresses existing ADA NEEDS ANALYSIS Project capital cost ($M) Capital Cost Year Construction Year Pct. Of Capital Cost for New Capacity Capital reinvestment Annual Incremental operating cost ($) Risk assessment CAPITAL AND OPERATING Project ridership (daily) Change in regional ridership (daily) Change in VMT (daily) Absolute change in avg. work trip transit travel time Wrk_time_diff (project users only) Jobs accessible within 90- minutes for average resident (#) (%) Jobs accessible within 60- minutes for average resident (#) 57 Red Line South Ext. CTA CTA 100% N/A 6 Medium 98.1 Low No 100% 2,300 $ YOE % x $18,977,890 Low 100% 28,525 6,338 (78,989) (0.0782) (6.8490) 1,048,852 7, % 431,857 4, % 100% 31,222 7,193 (89,859) (0.0678) (6.9855) 1,227,663 11, % 505,189 6, % 100% 60.44% , % 39, % Urban (20,280) 100% 61% 71 3,627,787 $ Urb (23,070) 100% 58 RPM Phase 2 CTA CTA 100% High 94.4 Medium Yes 100% 4,200 $ % x $10,265,128 Low 100% 368,591 17,960 (170,174) (0.6107) (1.9442) 1,054,681 7, % 438,674 7, % 100% 626,686 27,268 (274,788) (0.6035) (1.8341) 1,231,776 9, % 512,200 9, % 100% 37.58% , % 39, % Urban (43,690) 100% 42% 75 62,900,556 $ Urb (70,549) 100% 59 Blue Line West Extension CTA CTA 100% N/A - N/A N/A N/A No 100% 2,573 $ % x $7,451,546 Medium100% 8,204 3,850 (43,541) ( ) 1,046,433 4, % 434,575 7, % 100% 12,338 5,682 (66,217) (0.0088) ( ) 1,222,024 5, % 506,862 8, % 100% , % 39, % Urban (11,179) 100% 28% 86 3,188,101 $ Urb (17,001) 100% 60 Brown Line Extension CTA CTA 100% N/A 8 High N/A N/A No 100% 4,139 $ % x $5,973,286 Medium100% 14,771 3,082 (23,166) (0.0446) (5.3246) 1,044,639 3, % 429,608 2, % 100% 16,563 3,241 (25,150) (0.0440) (5.5151) 1,219,649 3, % 501,457 2, % 100% 45.49% , % 39, % Urban (5,948) 100% 46% 74 4,140,430 $ Urb (6,457) 100% 61 Circle Line South (Phase II) CTA CTA 43% N/A 3 Low N/A N/A No 100% 1,000 $ % x $15,000,000 Medium100% 0% 0% Urban - 20% Urb - 40% 62 Circle Line North (Phase III) CTA CTA 43% N/A 3 Low N/A N/A No 100% 2,237 $ % x $7,000,000 Medium100% 0% 0% Urban - 20% Urb - 40% 63 Orange Line Extension CTA CTA 100% N/A - N/A N/A N/A No 100% 498 $ % x $1,083,179 Low 100% 9,337 1,999 (20,597) (0.0209) (7.2014) 1,047,382 5, % 434,141 7, % 100% 10,244 2,265 (23,548) (0.0189) (7.1389) 1,223,252 6, % 506,634 7, % 100% 43.45% , % 39, % Urban (5,288) 100% 44% 78 2,063,812 $ Urb (6,046) 100% 64 Yellow Line Enhancements acta CTA 100% N/A - N/A N/A N/A No 100% 294 $ % x $824,152 Low 100% 3,566 1,163 (13,002) (0.0117) (7.7201) 1,042,718 1, % 428,969 1, % 100% 5,753 1,584 (18,965) (0.0128) (7.7662) 1,217,755 1, % 500,862 2, % 100% 23.32% , % 39, % Urban (3,338) 100% 27% 75 1,410,058 $ Urb (4,869) 100% 66 UP NW Extension Metra Metra 100% N/A 5 Medium 96.3 Low No 100% 703 $ % x $2,843,192 Medium100% 41,171 2,683 (89,040) (0.0530) (4.4661) 1,044,624 3, % 428,663 1, % 100% 41,171 2,683 (89,040) (0.0509) (4.4046) 1,219,626 3, % 500,586 1, % 100% 5.29% , % 39, % Subur (19,591) 100% 5% 36 9,793,394 $ Sub (19,591) 100% 67 SWS Improvements / 75th StMetra Metra 100% N/A 8 High 95.2 High No 100% 1,669 $ % x ($1,844,472) Low 100% 23,629 5,386 (104,733) (0.1838) ( ) 1,052,960 11, ,082 1, % 100% 27,712 6,235 (127,167) (0.1743) ( ) 1,230,837 14, % 500,933 2, % 100% 15.48% , % 39, % Subur (23,043) 100% 14% 51 15,291,261 $ Sub (27,979) 100% 68 UP-N Improvements Metra Metra 100% Medium 97.8 Medium No 100% 961 $ % x $8,633,896 Low 100% 38,567 3,138 (64,563) (0.0144) (4.3226) 1,043,699 2, % 427, % 100% 58,614 4,154 (85,910) (0.0291) (4.6886) 1,218,816 2, % 499, % 100% 22.63% , % 39, % Subur (14,205) 100% 21% 58 9,699,751 $ Sub (18,902) 100% 69 UP-W Upgrade Metra Metra 100% Low 95.1 Medium No 100% 385 $ % x $1,205,456 Low 100% 36,933 6,128 (134,967) (0.1644) ( ) 1,055,462 13, % 435,913 8, % 100% 44,507 7,393 (163,483) (0.1727) ( ) 1,231,782 15, % 508,414 9, % 100% 13.91% , % 39, % Subur (29,695) 100% 13% 42 14,947,146 $ Sub (35,970) 100% 70 RI Improvements Metra Metra 100% Low 96.1 High No 100% 563 $ % x $3,587,088 Low 100% 28, (25,430) (2.6791) 1,052,105 10, % 432,346 5, % 100% 35,932 1,222 (34,398) (2.8840) 1,229,263 12, % 504,894 6, % 100% 25.39% , % 39, % Subur (5,595) 100% 22% 51 2,793,651 $ Sub (7,568) 100% 71 BNSF Extension-Oswego/Pla Metra Metra 100% N/A - N/A N/A N/A No 100% 439 $ % x $979,116 Medium100% 2, (45,220) (9.0366) 1,041, % 426, % 100% 11,531 2,007 (166,727) (8.7069) 1,216, % 498, % 100% 11.99% , % 39, % Subur (9,949) 100% 8% 14 1,573,341 $ Sub (36,683) 100% 72 BNSF Improvements Metra Metra 100% N/A 8 High 93.1 Medium No 100% 268 $ % x ($682,510) Low 100% 61,085 6,432 (141,100) (0.0428) (9.0514) 1,044,914 3, % 427, % 100% 77,357 8,047 (182,922) (0.0608) (9.1463) 1,220,729 4, % 498, % 100% 10.37% , % 39, % Subur (31,045) 100% 10% 57 3,769,492 $ Sub (40,246) 100% 73 HC Improvements Metra Metra 100% N/A 94.2 High No 100% 271 $ % x $11,086,991 Low 100% 6,691 2,010 (43,246) - ( ) 1,047,857 6, % 427, % 100% 8,612 2,528 (55,223) (0.0022) ( ) 1,223,799 7, % 499, % 100% 13.55% , % 39, % Subur (9,515) 100% 12% 49 2,847,284 $ Sub (12,150) 100% 74 ME Improvements Metra Metra 43% N/A 97.6 Medium No 100% 447 $ % x $2,000,000 Low 100% 0% 0% Subur - 20% Sub - 40% 75 ME Extension Metra Metra 100% N/A - N/A N/A N/A No 100% 1,153 $ % x $12,444,402 Medium100% 709 1,406 (33,801) (1.0813) 1,042,781 1, % 427, % 100% 4,220 3,869 (106,878) (2.5679) 1,218,111 1, % 499, % 100% 5.49% , % 39, % Subur (7,437) 100% 3% 5 138,976 $ Sub (23,515) 100% 76 MD-N Extension-WadsworthMetra Metra 100% N/A - N/A N/A N/A No 100% 457 $ % x $4,832,175 Medium100% 1, (8,955) ( ) 1,043,329 1, % 428,935 1, % 100% 1, (9,101) ( ) 1,218,298 1, % 500,765 2, % 100% 28.94% , % 39, % Subur (1,970) 100% 27% ,411 $ Sub (2,002) 100% 77 MD-N Improvements Metra Metra 100% N/A 94.6 Medium No 100% 681 $ % x $6,518,165 Low 100% 23, (7,698) (0.0516) (2.2215) 1,044,637 3, % 429,053 1, % 100% 33, (11,574) (0.0629) (2.2994) 1,219,982 3, % 500,868 2, % 100% 14.93% , % 39, % Subur (1,694) 100% 13% 47 5,453,269 $ Sub (2,547) 100% 78 MD-W Extension-Marengo Metra Metra 100% N/A - N/A N/A N/A No 100% 660 $ % x $1,816,637 Medium100% 946 (62) (3,854) ,041, % 427, % 100% 3, (51,753) ,216, % 498, % 100% 0.02% , % 39, % Subur (848) 100% 0% 8 271,190 $ Sub (11,387) 100% 79 MD-W Improvements Metra Metra 100% Low 94.9 Medium No 100% 629 $ % x $2,031,932 Low 100% 23, (27,979) (0.0135) (3.1192) 1,049,698 8, % 429,228 2, % 100% 28,461 1,136 (33,181) (0.0193) (3.1590) 1,225,167 8, % 501,119 2, % 100% 26.07% , % 39, % Subur (6,156) 100% 26% 53 3,433,480 $ Sub (7,300) 100% 80 NCS Improvements Metra Metra 100% N/A - N/A 94.5 Medium No 100% 501 $ % x $15,960,115 Low 100% 9,914 1,303 (32,239) (0.0086) (8.7675) 1,042, % 427, % 100% 13,475 1,674 (43,454) (0.0094) (8.5018) 1,217,531 1, % 499, % 100% 13.85% , % 39, % Subur (7,093) 100% 13% ,927 $ Sub (9,561) 100% 81 RI Extension Metra Metra 100% N/A - N/A N/A N/A No 100% 487 $ % x ($200,271) Medium100% (17,111) (6.5799) 1,041, % 427, % 100% 3,216 2,785 (102,838) (6.8487) 1,216, % 498, % 100% 0.37% , % 39, % Subur (3,765) 100% 0% 11 60,520 $ Sub (22,626) 100% 82 Southeast Service Metra Metra 100% N/A - N/A N/A N/A No 100% 4,887 $ % x $8,111,979 Medium100% 8,783 4,860 (73,434) (9.5708) 1,043,360 1, % 428,835 1, % 100% 22,323 8,046 (169,652) (9.7728) 1,218,779 2, % 500,994 2, % 100% 56.21% , % 39, % Subur (16,157) 100% 55% 26 2,400,284 $ Sub (37,327) 100% 84 STAR Line Metra Metra 100% N/A - N/A N/A N/A No 100% 3,071 $ % x $33,076,344 Medium100% 14,479 11,187 (218,219) ( ) 1,053,460 11, % 430,975 3, % 100% 27,804 20,503 (484,967) (0.0079) ( ) 1,230,269 13, % 503,131 4, % 100% 19.48% , % 39, % Subur (48,013) 100% 19% 43 22,140,619 $ Sub (106,702) 100% 85 West Loop TC Phase I CDOT CDOT 100% N/A 8 High N/A Low Yes 100% 600 $ % x $1,000,000 Low 100% x x x x x x x x x x x 100% x x x x x x x x x x x 100% x x x x x x x x Urban #VALUE! 100% x x x x x 100% 87 Mid-City Transitway (Rail) CDOT CDOT 100% N/A - N/A N/A N/A No 100% 6,600 $ % x $30,713,080 High 100% 33,149 11,845 (121,420) (0.0937) (8.7357) 1,069,795 28, % 438,205 11, % 100% 37,795 13,490 (139,129) (0.0958) (8.8398) 1,247,776 31, % 511,194 12, % 100% 77.15% ,321 2, % 40,565 1, % Urban (31,173) 100% 77% 76 6,332,179 $ Urb (35,720) 100% 88 West Loop TC Phase II CDOT CDOT 100% N/A 6 Medium N/A N/A No 100% 2,000 $ % x $5,000,000 High 100% x x x x x x x x x x x 100% x x x x x x x x x x x 100% x x x x x x x x Urban #VALUE! 100% x x x Urb #VALUE! 100% 93 Forest Park Recons. CTA CTA 100% Medium 96.2 Medium Yes 100% 1,700 $ % x ($6,192,211) Low 100% 60,451 3,596 (28,735) (0.1189) (2.9099) 1,045,939 4, % 430,664 3, % 100% 71,809 4,222 (33,216) (0.1150) (2.8562) 1,221,344 5, % 502,925 4, % 100% 59.27% , % 39, % Urban (7,377) 100% 58% 73 15,763,100 $ Urb (8,528) 100% 94 Brown Line Capacity Expans CTA CTA 100% N/A 8 High 97.5 Low No 100% 1,500 $ % x $1,225,728 Low 100% 109,102 3,048 (26,893) (0.1000) (0.7561) 1,042, % 427, % 100% 176,067 4,996 (47,624) (0.1075) (0.7838) 1,217,428 1, % 499, % 100% 23.02% , % 39, % Urban (6,905) 100% 24% 69 9,474,813 $ Urb (12,227) 100% 98 A-2 Crossing Rebuild Metra Metra 100% N/A 3 Low 94.8 High No 100% 703 $ % x ($4,991,300) Low 100% 85,286 3,157 (79,340) (0.1890) (2.4179) 1,050,713 9, % 432,112 5, % 100% 108,798 3,892 (112,302) (0.2080) (2.4146) 1,226,473 10, % 504,152 5, % 100% 17.10% , % 39, % Subur (17,456) 100% 16% 47 14,952,946 $ Sub (24,709) 100% 102 Pulse Pulse ART Routes Pace Pace 100% N/A x x x High x 100% 937 $ 2016 Varies 75% x $176,400,000 Low 100% x x x x x x x x x x x 100% x x x x x x x x x x x 100% x x x x x x x x x x 100% x x x x x 100% 102A Pace Short Term ART Pace Pace 100% N/A - N/A 70.4 High No 100% 119 $ 2016 Varies 75% x $27,000,000 Low 100% 41,264 9,996 (109,632) (0.0768) (9.0793) 1,053,909 12, % 430,549 3, % 100% 45,362 10,887 (121,057) (0.0721) (9.0141) 1,230,237 13, % 502,646 3, % 100% 35.06% , % 39, % Subur (24,121) 100% 35% 78 38,002,718 $ Sub (26,635) 100% 102B Pace Mid Term ART Pace Pace 100% N/A - N/A 70.4 Medium No 100% 246 $ 2016 Varies 75% x $50,000,000 Medium100% 44,556 15,096 (184,220) (0.0252) ( ) 1,091,758 37, % 440,687 10, % 100% 68,938 21,433 (301,477) (0.0450) ( ) 1,274,684 44, % 514,315 11, % 100% 27.56% ,188 2, % 40, % Subur (40,532) 100% 29% 62 45,133,478 $ Sub (66,331) 100% 102C Pace Long Term ART Pace Pace 72% N/A - N/A N/A Medium No 100% 572 $ 2016 Varies 100% x $99,400,000 Medium100% 39,157 20,749 (249,976) ( ) 45% 51,830 25,159 (351,461) ( ) 45% 26.80% Subur (55,000) 40% 23% 53 46,543,394 $ Sub (77,328) 100% 103 River North-Streeterville Tra CDOT CDOT 100% N/A - N/A 54.0 High No 100% 400 $ % x $10,672,014 Low 100% 19,592 4,840 (15,513) (0.0642) (1.4594) 1,042, % 427, % 100% 32,954 7,737 (30,929) (0.0743) (1.4950) 1,217,348 1, % 499, % 100% 11.46% , % 39, % Urban (3,983) 100% 15% 54 26,913,124 $ Urb (7,941) 100% 104 South Lakefront-Museum Ca CDOT CDOT 100% N/A - N/A 57.9 High No 100% 400 $ % x $2,330,896 Low 100% 78,765 7,044 (66,619) (0.1650) (3.5274) 1,044,022 2, % 428,964 1, % 100% 80,853 5,971 (68,857) (0.1640) (3.9758) 1,217,348 1, % 501,123 2, % 100% 56.50% , % 39, % Urban (17,104) 100% 55% 66 10,692,471 $ Urb (17,678) 100% 105 Express Bus Expansion Pace Pace 43% N/A - N/A N/A High No 100% 1,775 $ 2016 Varies 100% x $57,000,000 Low 100% 0% 0% Subur - 20% Sub - 40% 106 Ashland Ave BRT CTA CTA 100% N/A - N/A 54.0 High No 100% 160 $ % x $1,088,758 Medium100% 38,237 3,528 (42,714) (0.1087) (3.4819) 1,052,991 11, % 434,590 7, % 100% 58,961 11,757 (106,501) (0.1226) (3.5389) 1,229,218 12, % 507,273 8, % 100% 57.79% , % 39, % Urban (10,966) 100% 59% 59 11,044,771 $ Urb (27,343) 100% 107 Green Line Extension CTA CTA 100% N/A - N/A N/A N/A No 100% 1,000 $ % x $847,820 Medium100% 2, (2,771) (0.0037) (1.4266) 1,041, % 427, % 100% 3, (3,115) (0.0034) (1.4345) 1,216, % 498, % 100% 70.70% , % 39, % Urban (712) 100% 70% ,538 $ Urb (800) 100% 108 South Halsted BRT CTA CTA 100% N/A - N/A 71.0 High No 100% 144 $ % x $1,199,788 Low 100% 6, (5,948) (0.0063) (3.9890) 1,041, % 427, % 100% 6, (6,087) (0.0060) (3.9097) 1,216, % 499, % 100% 71.22% , % 39, % Urban (1,527) 100% 71% ,492 $ Urb (1,563) 100% 115 BNSF Extension-Sugar GroveMetra Metra 100% N/A - N/A N/A N/A No 100% 368 $ % x $1,243,206 Medium100% 2, (32,822) (7.5999) 1,041, % 426, % 100% 9,243 1,150 (108,944) (7.0117) 1,216, % 498, % 100% 12.88% , % 39, % Subur (7,221) 100% 9% ,690 $ Sub (23,970) 100% 116 HC Extension Metra Metra 100% N/A - N/A N/A N/A No 100% 168 $ % x $521,643 Medium100% (7,440) (8.5722) 1,041, % 427, % 100% 1,151 1,148 (58,064) (8.5722) 1,216, % 498, % 100% 0.03% , % 39, % Subur (1,637) 100% 0% 8 164,531 $ Sub (12,775) 100% 117 MD-N Extension-Richmond Metra Metra 100% N/A - N/A N/A N/A No 100% 358 $ % x $243,509 Medium100% (22,883) (3.5314) 1,041, % 427, % 100% 2, (32,070) (3.4845) 1,216, % 498, % 100% 0.00% , % 39, % Subur (5,035) 100% 0% 10 16,203 $ Sub (7,056) 100% 118 MD-W Extension-HampshireMetra Metra 100% N/A - N/A N/A N/A No 100% 436 $ % x $5,494,443 Medium100% (4,721) ,041, % 427, % 100% (9,282) ,216, % 498, % 100% 0.04% , % 39, % Subur (1,039) 100% 0% 2 142,492 $ Sub (2,042) 100% 119 STAR Line Eastern Segment Metra Metra 100% N/A - N/A N/A N/A No 100% 1,691 $ % x $17,220,232 High 100% 1,892 2,052 (24,698) (7.5525) 1,042,725 1, % 427, % 100% 3,407 3,422 (63,856) (0.8779) 1,218,130 1, % 499, % 100% 38.76% , % 39, % Subur (5,434) 100% 24% 33 1,991,773 $ Sub (14,050) 100% 120 STAR Line Northern Segment Metra Metra 100% N/A - N/A N/A N/A No 100% 1,378 $ % x $16,223,193 High 100% 2,476 2,106 (40,731) ( ) 1,046,356 4, % 427, % 100% 2,870 2,598 (51,071) ( ) 1,220,892 4, % 499, % 100% 27.24% , % 39, % Subur (8,962) 100% 26% 50 4,657,460 $ Sub (11,237) 100% 121 Rock Island RER Service Metra Public 100% Low 97.1 Low Yes 100% 550 $ % x $33,821,827 Medium100% 35,015 1,573 (26,932) (4.3859) 1,052,105 10, % 432,346 5, % 100% 42,293 1,970 (34,233) (4.5000) 1,229,263 12, % 504,894 6, % 100% 30.80% , % 39, % Subur (5,926) 100% 29% 55 1,929,339 $ Sub (7,532) 100% 122 UP North RER Service Metra Public 100% Medium 97.5 Low Yes 100% 1,803 $ % x $52,245,738 Medium100% 51,199 7,548 (162,964) (0.0414) (8.4839) 1,056,316 14, % 431,898 4, % 100% 70,827 10,306 (223,191) (0.0589) (8.8874) 1,232,536 16, % 504,188 5, % 100% 22.18% , % 39, % Subur (35,855) 100% 20% 59 9,798,161 $ Sub (49,106) 100% 123 UP Northwest RER Service Metra Public 100% Medium 96.2 Low Yes 100% 2,208 $ % x $42,952,314 Medium100% 50,156 7,321 (196,665) (0.1152) (8.8917) 1,080,801 39, % 440,963 13, % 100% 68,907 9,913 (287,035) (0.1569) (9.3558) 1,261,898 45, % 514,453 15, % 100% 6.34% ,080 1, % 39, % Subur (43,270) 100% 6% 37 12,261,691 $ Sub (63,153) 100% 124 CrossRail Chicago Metra Public 100% N/A 1 Low No N/A Yes 100% 3,904 $ % x $54,008,522 Medium100% 15,342 2,671 (52,864) (0.0274) (9.3370) 1,049,411 7, % 432,889 5, % 100% 19,201 3,362 (69,696) (0.0289) (9.7298) 1,227,524 11, % 505,355 6, % 100% 38.18% , % 39, % Subur (11,631) 100% 36% 33 5,043,403 $ Sub (15,335) 100% 125 North Lakefront Light Rail Li CDOT Public 100% N/A 6 Medium N/A N/A No 100% 534 $ % x ($15,272,810) High 100% 42,552 (4,161) 64, (1.0536) 1,041, % 427, % 100% 42,552 (4,161) (64,040) (0.9748) 1,216, % 499, % 100% 11.03% , % 39, % Urban 16, % 10% 56 19,143,234 $ Urb (16,442) 100% 126 South Lakefront Light Rail Li CDOT Public 100% N/A - N/A N/A N/A No 100% 788 $ % x $13,185,108 High 100% 40,855 5,436 (16,902) (0.1135) (1.8386) 1,042, % 427, % 100% 61,557 7,603 (30,430) (0.1106) (1.9403) 1,217, % 499, % 100% 19.28% , % 39, % Urban (4,339) 100% 24% 59 19,487,937 $ Urb (7,812) 100% 127 Superloop Light Rail Line CDOT Public 100% N/A - N/A N/A N/A No 100% 482 $ % x $11,433,865 High 100% 43,852 8,198 (112,843) (3.1759) 1,050,490 8, % 430,324 3, % 100% 54,024 9,852 (141,045) (3.1780) 1,227,233 10, % 502,672 3, % 100% 23.35% , % 39, % Urban (28,971) 100% 22% 47 38,462,571 $ Urb (36,212) 100% 128 Madison Street and JacksonCDOT Public 100% N/A - N/A N/A N/A No 100% 248 $ % x $10,984,891 High 100% 16,776 3,540 (57,178) (1.6323) 1,043,777 2, % 428,479 1, % 100% 20,421 4,189 (73,024) (1.6660) 1,218,847 2, % 500,197 1, % 100% 21.92% , % 39, % Urban (14,680) 100% 21% 45 9,580,492 $ Urb (18,748) 100% 129 Clark Street Light Rail Line CDOT Public 100% N/A 6 Medium N/A N/A No 100% 431 $ % x $8,728,061 High 100% 47,343 2,264 (4,977) (0.1399) (2.1452) 1,042,823 1, % 428,453 1, % 100% 55,924 2,593 (6,122) (0.1377) (2.1807) 1,217,820 1, % 500,208 1, % 100% 7.13% , % 39, % Urban (1,278) 100% 6% 59 19,915,685 $ Urb (1,572) 100% 130 Downtown Ring Light Rail Li CDOT Public 100% N/A - N/A N/A N/A No 100% 650 $ % x $17,072,631 High 100% 11,724 2,469 (7,063) (0.0289) (1.3010) 1,042, % 427, % 100% 17,777 3,301 (9,957) (0.0311) (1.2962) 1,217,412 1, % 499, % 100% 36.72% , % 39, % Urban (1,813) 100% 39% 78 2,777,264 $ Urb (2,556) 100% 131 The Burnham Ring Light Rail CDOT Public 100% N/A - N/A N/A N/A No 100% 1,606 $ % x $37,314,433 High 100% 15,214 3,608 (19,525) (0.0387) (2.1452) 1,041, % 427, % 100% 23,178 5,419 (34,925) (0.0416) (0.5126) 1,216, % 499, % 100% 63.82% , % 39, % Urban (5,013) 100% 65% 58 1,386,732 $ Urb (8,967) 100% 132 Milwaukee Avenue Streetcar CDOT Public 100% N/A 6 Medium N/A N/A No 100% 657 $ % x $9,042,562 High 100% 24,833 (4,977) (9,323) (0.1491) ,054,463 12, % 436,190 9, % 100% 24,833 (4,977) (9,323) (0.1454) ,231,602 15, % 509,103 10, % 100% 39.17% ,824 1, % 39, % Urban (2,394) 100% 37% 58 5,730,800 $ Urb (2,394) 100% 134 Crosstown Tollway CTA LineCTA/IDOT 87% N/A - - N/A N/A No 100% 10,000 $ % x $37,248,240 High 100% 1,069,662 28, % 438,657 11, % 55% 49,579 16,103 (169,400) (0.4610) (8.6218) 1,247,588 31, % 511,760 13, % 100% 72,273 2, % 40,577 1, % Urban 70% 78% 79 6,077,000 $ Urb (43,492) 100% 143 Modern Metra Electric Metra Cook 100% N/A 97.6 Low No 100% 1,000 $ % x $71,502,655 Medium100% 59,391 4,893 8, (1.2393) 1,034,770-6, % 425,855-1, % 100% 135,430 11,558 (41,577) (0.7216) 1,206,387-9, % 497,603-1, % 100% 54.17% , % 38, % Subur 1, % 57% 35 8,596,590 $ Sub (9,148) 100% 144 S.M.A.R.T. - Suburban Metro NEEDS ANALYSIS CAPITAL AND OPERATING COSTS 2015 TRAVEL BENEFITS 2050 TRAVEL BENEFITS 2015 PLANNING PRIORITIES 2050 PLANNING PRIORITIES (%) 2015 TRAVEL BENEFITS RTA Public 100% N/A - N/A N/A N/A No 100% 15,000 $ % x $32,601,717 High 100% 40,202 21,935 (278,494) ( ) 1,094,754 53, % 437,724 10, % 100% 46,311 25,288 (332,096) ( ) 1,275,072 58, % 510,294 11, % 100% 29.22% ,184 2, % 39, % Subur (61,274) 100% 28% 52 38,839,667 $ Sub (73,068) 100% 147 Blue Line Capacity - O'Hare CTA CTA 43% Medium 96.2 Low No 100% 1,100 $ % x ($500,000) Low 100% 0% 0% Urban - 20% Urb - 40% Project ridership (daily) Change in regional ridership (daily) Change in VMT (daily) Absolute change in avg. work trip transit travel time Wrk_time_diff (project users only) Jobs accessible within 90- minutes for average resident (#) (%) Jobs accessible within 60- minutes for average resident (#) (%) 2050 TRAVEL BENEFITS EJ Share Infill score Low barrier jobs to excluded comm. 90 min (#) (%) Low barrier jobs to excluded comm. 60 min (#) (%) GHG Type GHG emissions 2015 PLANNING PRIORITIES EJ Share Infill Score Economic impact from improved market access ($ / yr) GHG Type GHG emissions 2050 PLANNING PRIORITIES
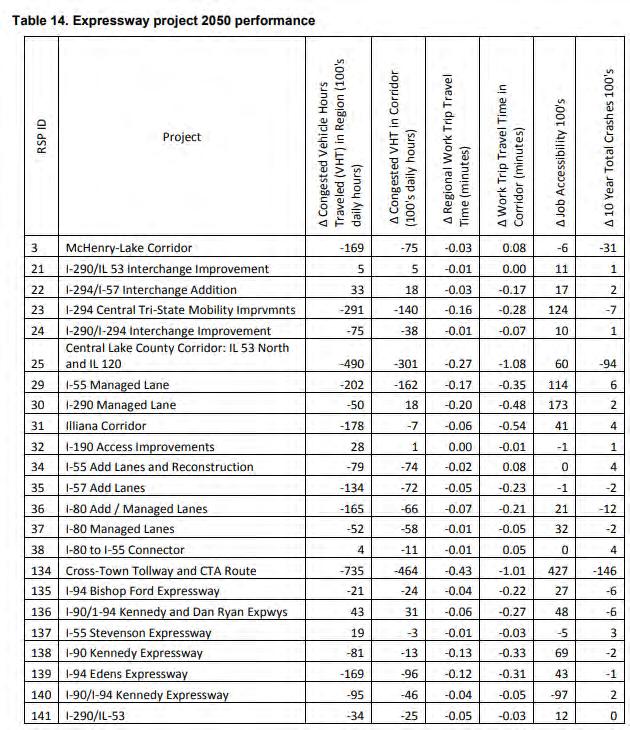
12 Highway Measures Today s Needs observed condition safety mobility reliability freight benefits 2040 Performance modeled regional & corridor total CVHT regional and corridor commute time job access expected crashes regional and corridor truck CVHT Planning Priorities modeled greenhouse gas emissions development pressure in sensitive areas new impervious acres EJ job access economic impacts support infill development transit boardings
13 Tradeoffs

14 Data becomes information
15 Data becomes Scheduleinformation Report is being revised CMAP meets with agencies to discuss results & projects Draft list of staff recommended projects to Planning Committee in April 2018 List released for public comment in June along with draft plan The list becomes final upon plan adoption, October 2018
16 Questions? Claire Bozic Martin Menninger
Public Meeting. City of Chicago Department of Transportation & Department of Housing and Economic Development
 Public Meeting City of Chicago Department of Transportation & Department of Housing and Economic Development Funded by Regional Transportation Authority September 12, 2011 In partnership with Presentation
Technology Evaluation Scorecard Suitability
 Technology Evaluation Scorecard Suitability Does the mode meet the MOE? Measure of Effectiveness Length of Typical Station Operating Technology Commute Spacing Speed Automated Guideway Bus Rapid Commuter
5. OPPORTUNITIES AND NEXT STEPS
 5. OPPORTUNITIES AND NEXT STEPS When the METRO Green Line LRT begins operating in mid-2014, a strong emphasis will be placed on providing frequent connecting bus service with Green Line trains. Bus hours
Chapter 4 : THEME 2. Transportation
 Chapter 4 : THEME 2 Strengthen connections to keep the Central Area easy to reach and get around 55 Figure 4.2.1 Promote region-wide transit investments. Metra commuter rail provides service to the east,
SERVICE IMPROVEMENT GUIDE
 SOUTH COOK COUNTY / WILL COUNTY RESTRUCTURING INITIATIVE SERVICE IMPROVEMENT GUIDE Working to Improve Your Commute Change has arrived for residents of south and southwest Cook County, in the form of improved
6/6/2018. June 7, Item #1 CITIZENS PARTICIPATION
 June 7, 2018 Item #1 CITIZENS PARTICIPATION 1 Item #2 APPROVAL OF MINUTES Item #3 TRAC GOALS, FRAMEWORK & AGENDA REVIEW 2 COMMITTEE GOALS Learn about Southern Nevada s mobility challenges, new developments
10/4/2016. October 6, Item #1 CITIZENS PARTICIPATION
 October 6, 2016 Item #1 CITIZENS PARTICIPATION 1 Item #2 APPROVAL OF MINUTES Item #3 WELCOME 2 Item #4 TRAC ROADWAY RECOMMENDATIONS UPDATE Item #4 Completed Jurisdiction Presentations Boulder City August
Kenosha-Racine-Milwaukee (KRM)
") Kenosha-Racine-Milwaukee (KRM) Commuter Rail #147925 November 6, 2009 1 Guidance of KRM Commuter Rail Studies Intergovernmental Partnership Technical Steering Committee Temporary and Limited Authority
Kenosha-Racine-Milwaukee (KRM) Commuter Rail #147925 November 6, 2009 1 Guidance of KRM Commuter Rail Studies Intergovernmental Partnership Technical Steering Committee Temporary and Limited Authority
Corridor Management Committee. March 7, 2012
 Corridor Management Committee March 7, 2012 2 Today s Topics SWLRT Project Office Update Engineering Services Procurement Update Legislative Leadership Tour Annual New Starts Report Update on Proposed
Michigan/Grand River Avenue Transportation Study TECHNICAL MEMORANDUM #18 PROJECTED CARBON DIOXIDE (CO 2 ) EMISSIONS
 EMISSIONS") TECHNICAL MEMORANDUM #18 PROJECTED CARBON DIOXIDE (CO 2 ) EMISSIONS Michigan / Grand River Avenue TECHNICAL MEMORANDUM #18 From: URS Consultant Team To: CATA Project Staff and Technical Committee Topic:
TECHNICAL MEMORANDUM #18 PROJECTED CARBON DIOXIDE (CO 2 ) EMISSIONS Michigan / Grand River Avenue TECHNICAL MEMORANDUM #18 From: URS Consultant Team To: CATA Project Staff and Technical Committee Topic:
UNION STATION MASTER PLAN STUDY
 UNION STATION MASTER PLAN STUDY The Chicago Department of Transportation has begun a comprehensive study of issues related to Chicago s Union Station, the Union Station Master Plan. Opened in 1925, Union
Kendall Drive Premium Transit PD&E Study Project Kick-Off Meeting SR 94/Kendall Drive/SW 88 Street Project Development and Environment (PD&E) Study
 Study") Florida Department of Transportation District Six Kendall Drive Premium Transit PD&E Study Project Kick-Off Meeting SR 94/Kendall Drive/SW 88 Street Project Development and Environment (PD&E) Study What
Florida Department of Transportation District Six Kendall Drive Premium Transit PD&E Study Project Kick-Off Meeting SR 94/Kendall Drive/SW 88 Street Project Development and Environment (PD&E) Study What
Chicago Milwaukee Intercity Passenger Rail Corridor
 Chicago Milwaukee Intercity Passenger Rail Corridor Past, Present, and Future Arun Rao, Passenger Rail Manager Wisconsin Department of Transportation Elliot Ramos, Passenger Rail Engineer Illinois Department
Overview of Transit Funding and Planning in the PACTS Region
 Overview of Transit Funding and Planning in the PACTS Region Presentation to PACTS Transit Committee and Federal Transit Administration Representatives February 8, 2018 Transit Agencies Agency Communities
Metra seeks your feedback!
 Metra seeks your feedback! New Ticket - Day Pass Discounts - Off-Peak Times Zone fixes Tell us what you think: www.surveymonkey.com/r/metrafares or by e-mail metrafarestudy@metrarr.com. Attend a public
Metropolitan Council Budget Overview SFY
 Metropolitan Council Budget Overview SFY 2016-2017 H T t ti C itt House Transportation Committee February 4, 2015 Transit connects us to the places that matter Transportation Needs Grow as the Region Grows
RTSP Phase II Update
 Washington Metropolitan Area Transit Authority RTSP Phase II Update Presentation to the Technical Advisory Group July 18, 2013 Meeting 1 Presentation Outline RTSP Integration with Momentum RTSP Process
Waco Rapid Transit Corridor (RTC) Feasibility Study
 Feasibility Study") Waco Rapid Transit Corridor (RTC) Feasibility Study Chris Evilia, Director of Waco Metropolitan Planning Organization Allen Hunter, General Manager Waco Transit System Jimi Mitchell, Project Manager AECOM
Waco Rapid Transit Corridor (RTC) Feasibility Study Chris Evilia, Director of Waco Metropolitan Planning Organization Allen Hunter, General Manager Waco Transit System Jimi Mitchell, Project Manager AECOM
Executive Summary. Treasure Valley High Capacity Transit Study Priority Corridor Phase 1 Alternatives Analysis October 13, 2009.
 Treasure Valley High Capacity Transit Study Priority Corridor Phase 1 Alternatives Analysis October 13, 2009 Background As the Treasure Valley continues to grow, high-quality transportation connections
DRAFT Evaluation Scores. Transit
 DRAFT Evaluation s The criteria for evaluating applications for new funding commitments are used to measure how well they advance the six goals identified for the MTP. Through transportation: Reduce per
Hillsborough County MPO Transit Study. Transit Concept for 2050 October 17, 2007
 Hillsborough County MPO Transit Study Transit Concept for 2050 October 17, 2007 Transit Technologies Technologies Considered Bus Light Rail Commuter Rail Bus Standard or articulated high-capacity vehicles
MPO Transit Study. Transit Concept for 2050 November 5, Transit Technologies
 Hillsborough County MPO Transit Study Transit Concept for 2050 November 5, 2007 Transit Technologies 1 Technologies Considered Bus Light Rail Commuter Rail Bus Standard or articulated high-capacity vehicles
Feasibility Study. Community Meeting March, North-South Commuter Rail Feasibility Study
 Feasibility Study Community Meeting March, 2017 1 Agenda 1. Welcome / Introductions 2. Background / Meeting Purpose 3. Progress to Date Options Evaluated Capital/Operating Costs Ridership 4. Financial
Planning for Tomorrow
 1 Regional Growth Planning for Tomorrow City of Des Moines Transportation Master Plan Connect Downtown What did Des Moines residents have to say? 4 Non-rider survey feedback Is public transit important
West Broadway Transit Study. Community Advisory Committee September 17, 2015
 West Broadway Transit Study Community Advisory Committee September 17, 2015 Introductions Community Engagement Summer Outreach Fall Outreach Technical Analysis Process Update Alternatives Review Economic
Charlotte-Mecklenburg Region Rapid Transit and Land-Use Integration
 Charlotte-Mecklenburg Region Rapid Transit and Land-Use Integration Legislative Committee on Urban Growth and Infrastructure Carolyn Flowers CEO Charlotte Area Transit System March 23, 2010 Charlotte Region
METRO Orange Line BRT American Boulevard Station Options
 METRO Orange Line BRT American Boulevard Station Options Bloomington City Council Work Session November 18, 2013 Christina Morrison BRT/Small Starts Project Office Coordinating Planning and Design AMERICAN
Community Advisory Committee. October 5, 2015
 Community Advisory Committee October 5, 2015 1 Today s Topics Hennepin County Community Works Update Project Ridership Estimates Technical Issue #4:Golden Valley Rd and Plymouth Ave Stations Technical
Central Loop Bus Rapid Transit
 Central Loop Bus Rapid Transit Transportation Goals of the Chicago Central Area ACTION Plan, page 2-6 Central Area Plan Improve Transit in Central Area Improve Pedestrian Environment Manage Traffic Circulation
Midtown Corridor Alternatives Analysis. Policy Advisory Committee Meeting February 12, 2014
 Midtown Corridor Alternatives Analysis Policy Advisory Committee Meeting February 12, 2014 Today s Agenda Introductions Outreach efforts and survey results Other updates since last meeting Evaluation results
UTA Transportation Equity Study and Staff Analysis. Board Workshop January 6, 2018
 UTA Transportation Equity Study and Staff Analysis Board Workshop January 6, 2018 1 Executive Summary UTA ranks DART 6 th out of top 20 Transit Agencies in the country for ridership. UTA Study confirms
TORONTO TRANSIT COMMISSION REPORT NO.
 Form Revised: February 2005 TORONTO TRANSIT COMMISSION REPORT NO. MEETING DATE: October 24, 2012 SUBJECT: DOWNTOWN RAPID TRANSIT EXPANSION STUDY (DRTES) PHASE 1 STRATEGIC PLAN ACTION ITEM RECOMMENDATIONS
Executive Summary. Draft Environmental Impact Statement/Environmental Impact Report ES-1
 Executive Summary Introduction The Eastside Transit Corridor Phase 2 Project is a vital public transit infrastructure investment that would provide a transit connection to the existing Metro Gold Line
CLRP. Performance Analysis of The Draft 2014 CLRP. Long-Range Transportation Plan For the National Capital Region
 NATIONAL CAPITAL REGION TRANSPORTATION PLANNING BOARD Item 12 CLRP Financially Constrained Long-Range Transportation Plan For the National Capital Region 2014 Performance Analysis of The Draft 2014 CLRP
Rapid Transit and Land-Use Integration a Reality
 City of Charlotte Rapid Transit and Land-Use Integration a Reality Transportation Oversight Committee Carolyn Flowers CEO Charlotte Area Transit System April 29, 2010 Charlotte Region Statistics Mecklenburg
A Transit Plan for the Future. Draft Network Plan
 A Transit Plan for the Future Draft Network Plan Project Overview and Status Completed Market Analysis and Service Evaluation. Developed Plan Framework and Guiding Principles. Developed a draft Five Year
Help shape your community investment in Wake Transit. Fiscal Year 2019 Draft Work Plan Summary
 Help shape your community investment in Wake Transit Fiscal Year 2019 Draft Work Plan Summary Wake County, growth and transit The Triangle is one of the fastest-growing regions in the nation. Wake County
6/11/2018. June 7, Item #1 CITIZENS PARTICIPATION
 June 7, 2018 Item #1 CITIZENS PARTICIPATION 1 Item #2 APPROVAL OF MINUTES Item #3 TRAC GOALS, FRAMEWORK & AGENDA REVIEW 2 COMMITTEE GOALS Learn about Southern Nevada s mobility challenges, new developments
Dismantling the Streetcar System:
 Dismantling the Streetcar System: What Have We Learned? By John Hillegass 42 Line - Courtesy of National Capital Trolley Museum Historic Context DC Streetcar System Agenda Analysis Plan to Convert to Buses
Needs and Community Characteristics
 Needs and Community Characteristics Anticipate Population and Job Growth in the City Strongest density of population and jobs in Ann Arbor are within the Study Area Population expected to grow 8.4% by
MetroExpress Improvements
 Improvements Enhancements Short-term improvements to keep Austin moving. Investments Long-term projects to support our future. Mobility Hubs MetroRapid MetroRail Commuters Connectors Circulators Project
CITY OF LONDON STRATEGIC MULTI-YEAR BUDGET ADDITIONAL INVESTMENTS BUSINESS CASE # 6
 2016 2019 CITY OF LONDON STRATEGIC MULTI-YEAR BUDGET ADDITIONAL INVESTMENTS BUSINESS CASE # 6 STRATEGIC AREA OF FOCUS: SUB-PRIORITY: STRATEGY: INITIATIVE: INITIATIVE LEAD(S): BUILDING A SUSTAINABLE CITY
Leveraging Land Use Changes through Transportation Funding
 Leveraging Land Use Changes through Transportation Funding Railvolution 2005 September 10, 2005 James Corless Senior Planner What is the MTC region? 9 7 101 26 San Francisco Bay Area counties Million people;
APPENDIX I: [FIXED-GUIDEWAY TRANSIT FEASIBILITY]
![APPENDIX I: [FIXED-GUIDEWAY TRANSIT FEASIBILITY]](/thumbs/83/87090921.jpg "APPENDIX I: [FIXED-GUIDEWAY TRANSIT FEASIBILITY]") APPENDIX I: [FIXED-GUIDEWAY TRANSIT FEASIBILITY] Jackson/Teton Integrated Transportation Plan 2015 Appendix I. Fixed-Guideway Transit Feasibility Jackson/Teton County Integrated Transportation Plan v2
APPENDIX I: [FIXED-GUIDEWAY TRANSIT FEASIBILITY] Jackson/Teton Integrated Transportation Plan 2015 Appendix I. Fixed-Guideway Transit Feasibility Jackson/Teton County Integrated Transportation Plan v2
Bi-County Transitway/ Bethesda Station Access Demand Analysis
 Bi-County Transitway/ Bethesda Station Access Demand Analysis Prepared for: Washington Metropolitan Area Transit Authority Office of Planning and Project Development May 2005 Prepared by: in conjunction
Green Line Long-Term Investments
 Enhancements Short-term improvements to keep Austin moving. Investments Long-term projects to support our future. Mobility Hubs MetroRapid MetroRail MetroExpress Connectors Circulators Project Connect
BROWARD BOULEVARD CORRIDOR TRANSIT STUDY
 BROWARD BOULEVARD CORRIDOR TRANSIT STUDY FM # 42802411201 EXECUTIVE SUMMARY July 2012 GOBROWARD Broward Boulevard Corridor Transit Study FM # 42802411201 Executive Summary Prepared For: Ms. Khalilah Ffrench,
V03. APTA Multimodal Operations Planning Workshop August Green Line LRT
 V03 APTA Multimodal Operations Planning Workshop August 2016 Green Line LRT 2 Presentation Outline Past Present Future 3 16/03/2016 RouteAhead Update 4 4 16/03/2016 RouteAhead Update 5 5 16/03/2016 6 6
RIDERSHIP TRENDS. March 2017
 RIDERSHIP TRENDS March 2017 Prepared by the Division of Strategic Capital Planning May 2017 Table of Contents Executive Summary...1 Ridership...3 Estimated Passenger Trips by Line...3 Estimated Passenger
Shuttle Bug: Linking Workers to Public Transportation in Northern Cook and Southern Lake Counties University of Illinois- Chicago Urban
 Shuttle Bug: Linking Workers to Public Transportation in Northern Cook and Southern Lake Counties University of Illinois- Chicago Urban Transportation Center- 2016 Seminar Series November 17,2016 About
Locally Preferred Alternative Report
 METRA UP-NW LINE Cook, Lake, and McHenry Counties Illinois s Analysis Study Locally Preferred Report Document #9 Final Report October 12, 2007 Prepared by DMJM Harris Documents submitted in association
North Shore Alternatives Analysis. May 2012
 North Shore Alternatives Analysis May 2012 Agenda Study Process and Progress to Date Short List Alternatives Screening Traffic Analysis Conceptual Engineering Ridership Forecasts Refinement of Service
Alternatives Analysis Findings Report
 6.0 This chapter presents estimates of the potential capital, operations and maintenance costs associated with the alternatives carried forward for detailed evaluation. The methodology used to develop
STH 60 Northern Reliever Route Feasibility Study Report
 #233087 v3 STH 60 Northern Reliever Route Feasibility Study Report Washington County Public Works Committee Meeting September 28, 2016 1 STH 60 Northern Reliever Route Feasibility Study Hartford Area Development
Scarborough Transit Planning
 Scarborough Transit Planning April 23, 2016 Transportation Planning Section City Planning Division Overview 1. Developing Toronto s Transit Network Plan 2. Scarborough Transit Planning 1. Minutes of last
Metro Transit Update. Christina Morrison, Senior Planner Metro Transit BRT/Small Starts Project Office. John Dillery, Senior Transit Planner
 Metro Transit Update Christina Morrison, Senior Planner Metro Transit BRT/Small Starts Project Office John Dillery, Senior Transit Planner Metro Transit Service Development May 16, 2013 1 Transit Planning
FREQUENTLY ASKED QUESTIONS
 FREQUENTLY ASKED QUESTIONS 2018 What is the More MARTA Atlanta program? The More MARTA Atlanta program is a collaborative partnership between MARTA and the City of Atlanta to develop and implement a program
2019 New Transit Service Plan
 Agenda Item 7.2 2019 New Transit Service Plan Draft Proposal VTA Board of Directors January 2019 Background: Next Network Plan and Today s Plan Early 2016 Transit Choices report and the ridership-coverage
PARTIAL PROGRAM OF PROJECTS FFY
 PARTIAL PROGRAM OF PROJECTS FFY 2016-17 The proposed Partial Program of Projects for FFY 2016-17 is attached. The proposed Partial Program of Projects was introduced at the SCTA Board at its meeting on
Transit Access Study
 West of Hudson Regional Transit Access Study Open House presentation July 20, 2010 1 Agenda Progress To date Summary of Level 2 Alternatives and Screening Service Plans Bus and Rail Operating and Capital
2030 Multimodal Transportation Study
 2030 Multimodal Transportation Study City of Jacksonville Planning and Development Department Prepared by Ghyabi & Associates April 29,2010 Introduction Presentation Components 1. Study Basis 2. Study
CTA Orange Line Extension Alternatives Analysis. Locally Preferred Alternative Report. August 2009
 CTA Orange Line Extension Alternatives Analysis Locally Preferred Alternative Report August 2009 Table of Contents Table of Contents List of Tables... iii List of Figures... iv Acronyms Used in this Document...
Develop ground transportation improvements to make the Airport a multi-modal regional
 Project Overview TRANSPORTATION IMPROVEMENTS WHAT ARE THE PROJECT GOALS? Transportation transportation hub. Develop ground transportation improvements to make the Airport a multi-modal regional Land Use
NICTI Alternatives Analysis
 EXECUTIVE SUMMARY Development of Detailed Alternatives Report Prepared for: Northern Illinois Commuter Transportation Initiative City of Rockford, Illinois Prepared by: 222 South Riverside Plaza, Suite
METRO Light Rail Update
 American Society of Highway Engineers METRO Light Rail Update Brian Buchanan Director, Design and Construction October 13, 2009 1 High Capacity Transit System 2 20-Mile Light Rail Line 3 Operations Operations
Transit in Bay Area Blueprint
 Rail~Volution 2010 Click to edit Master title style Transit in Bay Area Blueprint October 21, 2010 0 Bottom Line State-of-Good Repair essential for reliable transit service large funding shortfalls BART
Multnomah County Commission December 15, 2016
 Powell-Division Transit and Development Project Multnomah County Commission December 15, 2016 POWELL-DIVISION TRANSIT AND DEVELOPMENT PROJECT A partnership of Metro, TriMet, the cities of Portland and
TIER TWO SCREENING REPORT
 TIER TWO SCREENING REPORT November 2012 Parsons Brinckerhoff DRAFT November 2012 1 Parsons Brinckerhoff DRAFT November 2012-2 TABLE OF CONTENTS Table of Contents...3 List of Tables...4 List of Figures...5
Finding Ways out of Congestion for the Chicago Loop. - - A Micro-simulation Approach
 Finding Ways out of Congestion for the Chicago Loop - - A Micro-simulation Approach By Shan Jiang Master of Science in Transportation and Master in City Planning Candidate Massachusetts Institute of Technology
CTA Blue Line Study Area
 CTA Blue Line Study Area HISTORY OF THE CTA BLUE LINE / I-290 SYSTEM Blue Line / I-290 infrastructure is 55 years old First integrated transit / highway facility in the U.S. PROJECT STUDY AREA EXISTING
NEW YORK SUBURBAN RAIL SUMMARY (COMMUTER RAIL, REGIONAL RAIL)
") NEW YORK SUBURBAN RAIL SUMMARY (COMMUTER RAIL, REGIONAL RAIL) October 2003 New York: The New York commuter rail service area consists of 20.3 million people, spread over 4,700 square miles at an average
NEW YORK SUBURBAN RAIL SUMMARY (COMMUTER RAIL, REGIONAL RAIL) October 2003 New York: The New York commuter rail service area consists of 20.3 million people, spread over 4,700 square miles at an average
STRATEGIC PRIORITIES AND POLICY COMMITTEE MAY 5, 2016
 STRATEGIC PRIORITIES AND POLICY COMMITTEE MAY 5, 2016 Shift Rapid Transit Initiative Largest infrastructure project in the city s history. Rapid Transit initiative will transform London s public transit
Pacific Electric Right-of-Way / West Santa Ana Branch Corridor Alternatives Analysis
 Pacific Electric Right-of-Way / West Santa Ana Branch Corridor Alternatives Analysis Transit Coalition September 26, 2012 2 Study Area Pacific Electric Rightof-Way/West Santa Ana Branch (PEROW/ WSAB) extends
Restoration of Historic Streetcar Services in Downtown Los Angeles
 Restoration of Historic Streetcar Services in Downtown Los Angeles Early Scoping Meeting for Alternatives Analysis (AA) May 17, 2011 Introduction Key players Local lead agency: Metro Federal lead agency:
PHILADELPHIA SUBURBAN RAIL SUMMARY (COMMUTER RAIL, REGIONAL RAIL)
") PHILADELPHIA SUBURBAN RAIL SUMMARY (COMMUTER RAIL, REGIONAL RAIL) October 2003 The Philadelphia commuter rail service area consists of 5.1 million people, spread over 1,800 square miles at an average population
PHILADELPHIA SUBURBAN RAIL SUMMARY (COMMUTER RAIL, REGIONAL RAIL) October 2003 The Philadelphia commuter rail service area consists of 5.1 million people, spread over 1,800 square miles at an average population
2/1/2018. February 1, Item #1 CITIZENS PARTICIPATION
 February 1, 2018 Item #1 CITIZENS PARTICIPATION 1 Item #2 APPROVAL OF MINUTES Item #3 TRAC GOALS, FRAMEWORK & AGENDA REVIEW 2 COMMITTEE GOALS Learn about Southern Nevada s mobility challenges, new developments
DART Priorities Overview
 City of Dallas Transportation and Trinity River Project Committee DART Priorities Overview Gary C. Thomas President/Executive Director August 10, 2015 City of Dallas Transportation & Trinity River Committee
SUPPORTING TOD IN METRO CHICAGO
 www.rtachicago.org SUPPORTING TOD IN METRO CHICAGO Tuesdays at APA November 18, 2014 OVERVIEW OF RTA 2 11/18/2014 Tuesdays at APA: Supporting TOD in Metro Chicago RTA Region 8.5 million people 3,700 square
US 29 Bus Rapid Transit Planning Board Briefing. February 16, 2017
 US 29 Bus Rapid Transit Planning Board Briefing February 16, 2017 Project Goals Improve the quality of transit service Improve mobility opportunities and choices Enhance quality of life Support master
ITEM 9 Information October 19, Briefing on the Performance Analysis of the Draft 2016 CLRP Amendment
 ITEM 9 Information October 19, 2016 Briefing on the Performance Analysis of the Draft 2016 CLRP Amendment Staff Recommendation: Issues: Background: Receive briefing None The board will be briefed on a
Art Griffith, Capital Projects Manager, ,
 Part 1 Base Information 1. Project Title Broadway & Highlands Ranch Pkwy. Intersection Capacity and Safety Improvement Project 2. Project Start/End points or Geographic Area Provide a map with submittal,
EUGENE-SPRINGFIELD, OREGON EAST WEST PILOT BRT LANE TRANSIT DISTRICT
 EUGENE-SPRINGFIELD, OREGON EAST WEST PILOT BRT LANE TRANSIT DISTRICT (BRIEF) Table of Contents EUGENE-SPRINGFIELD, OREGON (USA)... 1 COUNTY CONTEXT AND SYSTEM DESCRIPTION... 1 SYSTEM OVERVIEW... 1 PLANNING
Recommended Vision for the Downtown Rapid Transit Network
 Recommended Vision for the Downtown Rapid Transit Network April 2008 Presentation Overview Context Transit options Assessment of options Recommended network Building the network 2 1 Rapid Our Vision Reliable
State Avenue Corridor Bus Rapid Transit (BRT)
") State Avenue Corridor Bus Rapid Transit (BRT) Moving Forward Incrementally April 2010 State Ave. BRT Update Bus Rapid Transit Overview State Ave. Alternatives Analysis Results What s Coming Up Right Away!
State Avenue Corridor Bus Rapid Transit (BRT) Moving Forward Incrementally April 2010 State Ave. BRT Update Bus Rapid Transit Overview State Ave. Alternatives Analysis Results What s Coming Up Right Away!
Chapter 7: Travel Demand Analysis. Chapter 8. Plan Scenarios. LaSalle Community Center. Image Credit: Town of LaSalle
 Chapter 7: Travel Demand Analysis Chapter 8 Plan Scenarios LaSalle Community Center. Image Credit: Town of LaSalle 164 Chapter 8: Plan Scenarios Moving Ahead for Progress in the 21 st Century Act (MAP
Maryland Gets to Work
 I-695/Leeds Avenue Interchange Reconstruction Baltimore County Reconstruction of the I-695/Leeds Avenue interchange including replacing the I-695 Inner Loop bridges over Benson Avenue, Amtrak s Northeast
Welcome. Green Line in Your Community
 Welcome Green Line in Your Community Today's session will provide you with information about Administration's recommendation for connecting the Green Line in the Beltline to Victoria Park and Inglewood/Ramsay
Valley Metro Overview. ITE/IMSA Spring Conference March 6, 2014
 Valley Metro Overview ITE/IMSA Spring Conference March 6, 2014 Valley Metro Who Are We? Operate Regional Transit Services Valley Metro and Phoenix are region s primary service providers Light Rail and
Scope of Services January 26, Project Development and Conceptual Engineering for City of Lake Forest Amtrak Station
 203 North LaSalle Street, Suite 2100 Chicago, IL 60601 (312) 558-1345 Fax: (312) 346-9603 E-Mail: cquandel@quandelconsultants.com www.quandel.com Scope of Services January 26, 2010 Project Development
Ohio Passenger Rail Development. Northwest Ohio Passenger Rail Association
 Ohio Passenger Rail Development Northwest Ohio Passenger Rail Association Ohio Rail Development Commission June 11, 2010 Ohio Strategy Establish the Market Grow the Market Capture the Value of the Market
7 COMPARATIVE EVALUATION OF ALTERNATIVES
 7 COMPARATIVE EVALUATION OF ALTERNATIVES 7.1 INTRODUCTION This chapter presents the comparative analysis of the four Level 2 build alternatives along with a discussion of the relative performance of the
Program. presented by: September 22, 2010
 Minnesota s s High Speed Passenger Rail Program presented by: Minnesota Department of Transportation September 22, 2010 Presentation Overview State Rail Plan National High Speed Rail Initiatives Passenger
I-35W & Lake Street Station
 I-35W & Lake Street Station 2017 CMAQ Funding Proposal April 16, 2014 Charles Carlson Metro Transit BRT/Small Starts Project Office www.metrotransit.org/orangeline Addressing Corridor Challenges 7+ Hours/day
CHICAGO TRANSIT AUTHORITY
 CHICAGO TRANSIT AUTHORITY Blue Line Extension to Schaumburg RTA Northwest Corridor Phase II Alternatives Analysis May 8, 2003 Project Overview In June 2002 RTA requested that CTA, Pace, Metra and ISTHA,
CEDAR AVENUE TRANSITWAY Implementation Plan Update
 CEDAR AVENUE TRANSITWAY Implementation Plan Update EECUTIVE SUMMARY DECEMBER 2015 Executive Summary In 2013, the Twin Cities metropolitan area s first bus rapid transit (BRT) line, the METRO Red Line,
West Broadway Reconstruction/LRT Design. March 19, 2015
 West Broadway Reconstruction/LRT Design March 19, 2015 1 Meeting Agenda 6:05 6:30 PM Brief presentation What we heard Project overview 6:30 8:00 PM Visit Six Topic Areas Road and LRT design elements Pedestrian
RIDERSHIP TRENDS. July 2018
 RIDERSHIP TRENDS July Prepared by the Division of Strategic Capital Planning September Table of Contents Executive Summary...1 Ridership...3 Estimated Passenger Trips by Line...3 Estimated Passenger Trips
I-35W Past, Present, and Future: METRO Orange Line
 I-35W Past, Present, and Future: METRO Orange Line 2018 State Public Transportation Partnerships Conference Charles Carlson Director, BRT Projects Metro Transit Charles.Carlson@metrotransit.org Metro Transit:
ANDERSON PROPERTY SITE ANALYSIS
 ANDERSON PROPERTY SITE ANALYSIS Introduction The Montgomery County Department of Transportation (MCDOT) initiated a feasibility study in the fall of 2012 to evaluate the need for transit service expansion
Subarea Study. Manning Avenue (CSAH 15) Corridor Management and Safety Improvement Project. Final Version 1. Washington County.
 Corridor Management and Safety Improvement Project. Final Version 1. Washington County.") Subarea Study Manning Avenue (CSAH 15) Corridor Management and Safety Improvement Project Final Version 1 Washington County June 12, 214 SRF No. 138141 Table of Contents Introduction... 1 Forecast Methodology
Subarea Study Manning Avenue (CSAH 15) Corridor Management and Safety Improvement Project Final Version 1 Washington County June 12, 214 SRF No. 138141 Table of Contents Introduction... 1 Forecast Methodology