Regional Transportation Investments a Vision for Metro Vancouver APPENDICES
|
|
|
- Hubert Jenkins
- 5 years ago
- Views:
Transcription
1 Regional Transportation Investments a Vision for Metro Vancouver APPENDICES
2 Table of Contents Appendix A: Actions to Invest...A1-A70 Appendix B: Actions to Manage.....B1-B11 Appendix C: Outcomes..C1-C10 Appendix D: Letter to Mayors Council from the Minister of Transportation and Infrastructure....D1-D5 Appendix E: Detailed Financial Tables.... E1-E5 Appendix F: How to Fund. F1-F16
3 REGIONAL TRANSPORTATION INVESTMENTS A VISION FOR METRO VANCOUVER APPENDIX A APPENDIX A Actions to Invest 40
4 Table of Contents Introduction... 3 Maintain Service and System... 5 Overview... 5 Maintain Service and System Investments by Mode... 5 Roads... 9 Program: Allowance for MRN Additions (OMR) Program: Capital for Minor MRN Upgrades Project: Replacement of Pattullo Bridge Transit: Transit Facilities Programs Program: Transit Facilities Upgrades / Expansion and New Facilities Project: Lonsdale Quay Upgrade Transit: Upgrades to Existing Rail Program: Expo Line Upgrades Program: Millennium Line Upgrades Program: Canada Line Upgrades Program: West Coast Express Upgrades Transit: B-Line or Better Investments Project: Extend 96 B-Line to White Rock Centre via King George Boulevard and 152 nd Street Project: New B-Line - Surrey Centre to Langley via Fraser Highway Project: New B-Line - Downtown Vancouver to SFU Burnaby via Hastings Street Project: New B-Line - Downtown Vancouver to SE Marine Drive via Victoria Drive / Commercial Drive Project: New B-Line - Dundarave to Phibbs Exchange via Marine Drive / 3 rd Street Project: New B-Line - Metrotown to Capilano University via Willingdon Avenue Project: New B-Line - Scott Road Station to Newton Exchange via Scott Road and 72 nd Avenue Project: New B-Line - Richmond-Brighouse Station to Metrotown via Knight Street, Bridgeport Road and Garden City Project: New B-Line - Joyce-Collingwood to UBC via 41 st Avenue Project: New B-Line - Lynn Valley Centre to Downtown Vancouver via 29 th Street, Lonsdale Ave and Marine Drive Project: New B-Line Coquitlam Centre to Maple Ridge via Lougheed Highway and Dewdney Trunk Road Project: New B-Line Coquitlam Centre to Langley via Lougheed Highway and 200 th Street Transit: Investments in Transit Service Program: Improve and Expand Frequent All-Day Service A-1
5 Project: SeaBus Service Improvements Program: Improve and Expand Frequent Peak Service Program: Expand Basic Coverage Network Program: Increase Frequency and Span of Service on NightBus Network Program: Increase Custom Transit Service and Resources Project: Broadway Corridor Rapid Transit Project: Rapid Transit in Surrey Cycling & Walking Access to Transit Program: Investment in Bikeways Program: Investments in Secure Bicycle Parking Project: Walking Access to Transit A-2
6 INTRODUCTION DOCUMENT OVERVIEW The following document provides an overview of investment programs and projects under consideration within the Mayors Council Subcommittee s Regional Transportation Investments: a Vision for Metro Vancouver effort. The summary for each program and project includes a project overview, description of objectives and need, specific project/program scope, summary of operating and capital costs, and a summary of the project/program outcomes and evaluation results. OVERVIEW OF INVESTMENT FRAMEWORK The Regional Transportation Investments: a Vision for Metro Vancouver examines options and provides a proposed program of funding for regional transportation at two levels: Maintain Service and System (MSS) is a set of investments targeted at addressing the most basic needs for regional transportation to aim to keep up with growth in population and employment. This level of investment does not help the region to meet its transportation goals. Maintain Service and System is targeted at achieving the following: o Bus: Add sufficient service to keep overcrowding from getting worse in peak periods o Existing Rail: Increase service, within the capacity of existing maintenance and storage facilities o Roads (MRN): Add funding to meet current standards o Cycling: Restore funding to historical levels to implement regional cycling investments (costshared with municipalities) Expansion programs provide additional funding for transportation infrastructure and services to help move the region closer toward transportation goals. MSS is the starting point for investment, a set of first priorities within the overall expansion program, recognizing that the highest priority for investment is maintaining the current system. The projects and programs described in this document describe the investments in each mode category for both MSS and Expansion combined. The specific investments that comprise MSS are described in the Overview of Maintain Service and System section of this document. EVALUATION METHODOLOGY Each project or investment was evaluated based on how well it advances regional goals. This framework for evaluating projects was used to facilitate decision-making, and the criteria and methodology for evaluating projects was designed in collaboration between TransLink and municipal staff. ASSESSMENT OF CANDIDATE PROJECTS The Regional Growth Strategy and the Regional Transportation Strategy articulate regional goals around a sustainable economy, healthy people and communities and a clean environment. From a transportation perspective, achieving these goals depends largely on ensuring good regional access to jobs, reduced driving distances and more walking, cycling, and transit trips. While these three metrics don t capture everything that this region might care about (e.g. placemaking, security), they substantially drive progress towards most regional goals. A-3
7 For example, reducing Vehicle Kilometres Traveled (VKT) results in less congestion, increased travel reliability, safer streets with fewer traffic fatalities, less fossil fuel use, less air pollution, and lower GHG emissions. Increasing walking, cycling, and transit mode share helps reduce VKT (and so achieve the benefits above) as well as improve physical activity and public health, improve placemaking and reduce crime. Increasing regional accessibility to jobs and markets for people and goods is one of the fundamental tasks of the transportation system and critical to supporting a sustainable economy. To simplify the evaluation and to avoid any weighting of the criteria (that would require value judgments best made by decision-makers rather than technical staff), each of the projects was assessed against these three key metrics: 1. Access In 2030, how many more jobs will the average person in the region be able to access within 30 minutes as a result of this project? 2. Mode Share In 2030, how much higher will the regional walk/bike/transit mode share be as a result of this project? 3. VKT In 2030, what change to regional VKT will result from this project? The performance metrics shown in the following project descriptions indicate the Access, Mode Share and VKT changes that are expected (in 2030) as a result of that project. The scores were assessed using benchmark forecasting for a representative sampling of the projects along with existing studies and other supporting data. A detailed explanation of the criteria and methodology used to evaluate projects, along with the outcomes of investment scenarios, is presented in Appendix C. COST-EFFECTIVENESS SCORE The cost-effectiveness score is calculated by dividing each metric by the total annual average cost of the project to government (net of fare revenues). The resulting figures were then indexed on a scale to facilitate easy comparisons (with 0 representing the least cost-effective and 100 representing the most cost-effective project on the list). A-4
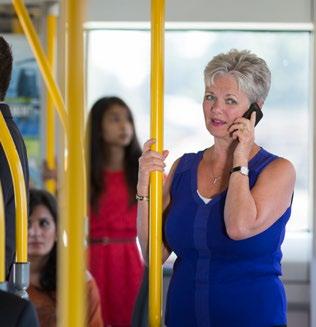
8 MAINTAIN SERVICE AND SYSTEM OVERVIEW The Metro Vancouver region is expected to add more than a million people over the next thirty years. Maintain Service and System (MSS) is a package of investments aimed at addressing the most basic needs for enhancements to the regional transportation network to keep up with growth in population and employment and to maintain the region s existing transportation network. Specific MSS investments are targeted at addressing the following needs: Bus: Add sufficient service to keep overcrowding from getting worse than current conditions in peak periods. Existing Rail: Increase service, within the capacity of existing maintenance and storage facilities. Roads (MRN): Add funding to meet current standards for the region s Major Road Network. Cycling: Restore funding to historical levels to implement highest-priority regional cycling investments (cost-shared with municipalities). MSS provides a basic level of investment, which is built upon further with Expansion funding. The combined investment of both layers of funding is described in this Appendix. Notably, MSS does not help the region move substantially toward meeting regional targets for reduced Vehicle Kilometres Traveled (VKT) and walk/bike/transit mode share. MAINTAIN SERVICE AND SYSTEM INVESTMENTS BY MODE BUS SERVICE Sufficient capacity in the current bus system exists to accommodate expected population and employment growth on many corridors and in many communities. Persistent overcrowding and pass-ups are currently limited to a select number of corridors and times of day. Transit service investments would increase bus service by 6% over the ten-year plan period, a total increase of about 310,000 annual service hours. A 6% increase in bus service hours by Year 10 would provide sufficient resources to maintain bus service quality, as measured by percentage/number of trips operating at overcrowded conditions during the peak periods, a at current levels, except on some very high demand corridors such as Broadway in Vancouver, where overcrowding would nevertheless worsen. Investments would focus, as a first priority, on enhancing service on corridors where persistent overcrowding already occurs and where and when ridership demand is expected to increase the most. In general, network design and structure would remain largely the same as today. Example bus service investments would include: Some expansion of All-Day Frequent bus services to new corridors (5,000 annual service hours by 2024) Intensification of All-Day Frequent bus services on existing corridors (161,000 annual service hours by 2024) Some expansion and intensification of frequent service in peak periods (Peak Frequent) (131,000 annual service hours by 2024) Expansion of Custom Transit (HandyDART) service (38,000 annual service hours by 2024) Additional vehicles needed to support expanded service described above (including conventional buses, community shuttles, and Custom Transit vehicles) A-5
9 The MSS bus service scenario assumes an increase in annual bus service hours of 310,000 hours by Year 10. SeaBus service would be increased by 2,400 hours beginning in Year 1, which would provide service at 15-minute frequencies throughout the day using existing fleet. A 6% increase in Custom Transit service is also assumed. Transit investments would not include expansion of basic coverage services to new and growing areas. New vehicles would also be procured to support this transit service expansion, including 72 conventional buses and 16 Community Shuttles. Costs: MSS Bus Service Increase (including SeaBus) 10-Year Capital Cost (2015$) Year 10 Operating Cost (2015$) $51.9 million $35.5 million RAIL UPGRADES In the case of existing rail services, the level of investment needed to fully address population and employment growth (to keep overcrowding constant compared with current levels by Year 10) would require the addition of more rail vehicles than are able to be accommodated by existing storage and maintenance facilities. To keep expenditure increases within Maintain Service and System relatively modest, rail upgrades in MSS would be limited to investment levels which would not trigger the need to build additional rail car storage and maintenance. Persistent overcrowding and pass-up conditions on the rail system during peak times would remain, and would worsen over time. Crowding on trains travelling during non-peak times or directions would increase. Specific rail upgrades include: Expo Line: 28 additional vehicles to deliver an 11% service increase on the SkyTrain system. (Note that this amount is additional to new vehicles put into service as part of the Evergreen Line project.) Canada Line: 6% increase in service utilizing spare vehicles West Coast Express: 2% increase in service utilizing spare vehicles Costs: MSS Rail Upgrades Area 10-Year Capital Cost (2015$) Year 10 Operating Cost (2015$) Expo Line $87.4 million $10.3 million Canada Line $ -- $1.7 million West Coast Express $ -- $0.5 million Total $87.4 million $12.5 million CYCLING Cycling programs are funded as a cost-share program with municipalities. MSS would add $4.45 million per year to the current bicycle funding program to achieve $6.0 million per year in total capital-cost sharing funding. MSS also includes funding to increase resources available for TransLink-owned bicycle assets, specifically parking improvements at TransLink facilities, such as stations; this funding would be an additional $1.0 million per year (capital) and $0.3m (operating) above base levels. Costs are shown in the below table with amounts incremental to Base Plan levels. A-6
10 Costs: MSS Cycling Area 10-Year Capital Cost (2015$) Year 10 Operating Cost (2015$) Regional Cost-Sharing $44.5 million $ -- TransLink-Owned Assets $9.5 million $0.3 million Total $54.0 million $0.3 million ROADS MSS would increase funding to Major Road Network in a variety of areas. MSS includes annual capital funding to address seismic safety investment needs on the MRN (e.g. bridges and culverts), and funding to support minor capital upgrades to the MRN network, in partnership with municipalities. TransLink funding to support additional MRN Pavement Rehabilitation and MRN Operations and Maintenance is also included, which would allow for annual increases of 1%, as well as an additional one-time 10% increase, for Pavement Rehabilitation. Costs are shown in the table below with amounts incremental to Base Plan levels. Costs: MSS Major Road Network Area 10-Year Capital Cost (2015$) Year 10 Operating Cost (2015$) MRN Minor Upgrades $100 million $ -- MRN Structural Rehab $130 million $ -- MRN Pavement Rehab $26.3 million $ -- MRN Operations & Maintenance $ -- $1.6 million Total $256 million $1.6 million STATE OF GOOD REPAIR MSS would also provide for capital investments to maintain TransLink s existing asset base, to maintain state of good repair, and to maintain the system s existing capacity (e.g. fleet replacements). OTHER INVESTMENT CATEGORIES No system or service expansion investments in the following categories over and above the 2014 Base Plan are included in MSS: Transit Facilities Expanded B-Line service System Management Walking Access to Transit Major Investments Funding for investments in these categories is included in the Expansion funding envelope, described elsewhere in this document. The 2014 Base Plan includes a $300 million funding envelope to provide interim rehabilitation investments for the Pattullo Bridge. The envelope would mitigate seismic risk and address the condition of the bridge deck in order to maintain the structural integrity of the Pattullo Bridge (per the 2014 Base Plan). This has been retained in MSS. Some of these costs would be avoided if a long-term solution for the Bridge is identified in the near future. A-7
11 FIGURE 1 OVERVIEW OF INVESTMENTS IN MAINTAIN SERVICE AND SYSTEM, 2015 THROUGH % Increase in Bus Service (including Custom Transit) 72 Conventional Vehicles 16 Community Shuttles 16 Custom Transit vehicles Expanded Frequent All-Day Network, for example: Nanaimo Street West 4 th Avenue to UBC SeaBus Increase in Rail Service Expo Line: additional 28* cars, 11.5% service increase on the SkyTrain system Expanded Frequent Peak network, for example: Coast Meridian Ave./David Ave. (Coq./Port Coq.) Big Bend/Glenylon (Burnaby) 6 th Ave. (New West.) 108 th Street/160 th Street (Surrey) Bridgeport Road (Richmond) Westwood Plateau (Coq.) Canada Line: 6.4% service increase (utilize spare vehicles) Cycling Add $4.45m/year to achieve $6m/year total capital-cost sharing funding Add $1.0m/year (capital) and $0.3m/year (operating) for bicycle parking investments Roads Modest funding increases for cost-sharing municipally-owned regional road assets o MRNB Capital Upgrade program $10 million per year o MRN Structures rehab $13 million per year o MRN Operations and Maintenance 1% network growth per year West Coast Express: 2.2% service increase (utilize spares) State of Good Repair Increased funding to maintain TransLink assets in a state of good repair, to reduce the deferred maintenance backlog over time, and maintain existing system capacity (e.g. fleet replacements) * in addition to new SkyTrain vehicles to be put in service as part of the Evergreen Line project A-8
12 ROADS Funding for Roads programming focuses on investing to maintain and expand the region s Major Road Network, which currently includes more than 2,300 lane-kilometers of municipally-owned regionally significant roadways. The MRN carries people, goods and services by foot, bicycle, bus, car and truck. TransLink provides overall coordination, planning and funding for the MRN. The programs described in this section would increase the level of funding available for operations, maintenance, rehabilitation and upgrades to the Major Road Network (MRN) and MRN structures, and expand the amount of roadway that is within the MRN. The priorities for roads, as set out in the Regional Transportation Strategy Strategic Framework, are investment and ongoing maintenance to improve safety, increasing local connectivity, and improving goods movement, and the following funding programs would contribute to projects that are in line with these overarching policy goals. No major capital projects have been identified in this investment area; however as a consideration for the year horizon, the RTS Strategic Framework identified the need for a long-term solution to address goods movement along the north shore of the Fraser River. PROGRAM COSTS (INCREMENTAL TO BASE PLAN) Capital for Minor MRN Upgrades [$20 million capital per annum for 10 years] Operation, Maintenance, and Rehabilitation (OMR) on MRN [one time 10% increase and annual 1% increases] Capital for Structural Rehabilitation on MRN [$13 million capital per annum for 10 years] 10-Year Capital Cost (2015$) Year 10 Operating Cost (2015$) $200 million $ -- $26.3 million $4.7 million/year $130 million The above figures are inclusive of costs for Roads investments described in the Maintain Service and System investments section, which have 10-year capital cost (2015 $) of $256 million and Year 10 operating cost (2015 $) of $1.6 million. PROGRAM EVALUATION Evaluation of the two Roads programs is combined, as shown below. Access (Additional jobs accessible by the average person in the region) Performance Criteria Non-Auto Access (Additional jobs accessible by walk, cycle and transit by the average person in the region) $ -- Mode Share (One onehundredths of a percent (1/100 s %)) Daily Vehicle Kilometers Travelled Change from 2030 Base Case ,543 Cost-Effectiveness Score (0-100) Observations Investing in the MRN is necessary to improve safety and local access and to support efficient goods movement, but will not move us towards the achievement of our mode share and VKT targets Investing in new MRN capacity and/or connections will reduce travel times over the short to medium term, thus increasing the number of accessible jobs; however, without concurrent mobility pricing on the roadway network, this benefit is likely to be reduced over time as induced travel will increase daily VKT and thus increase congestion. A-9
13 PROGRAM: ALLOWANCE FOR MRN ADDITIONS (OMR) PROGRAM DESCRIPTION This program would increase the MRN operating and maintenance (OMR) budget to support and maintain additions of new roads or existing roads to the MRN. The program allows for a one-time expansion of 10%, as well as annual increases of 1%. In order to be added to the MRN, roads must undergo an evaluation process as well as meet the priorities for roads, as set out in the Regional Transportation Strategy Strategic Framework: improve safety, increase local and regional connectivity, and improve goods movement. PROGRAM OBJECTIVES This program s objectives are to ensure that the MRN can be expanded to support regional needs in terms of facilitating increased access, goods movement, and safety for all modes. PROGRAM SCOPE Roads are added to the MRN based on an evaluation process undertaken by TransLink and the municipality/municipalities where the road is located. Under current requirements, to qualify for MRN inclusion, roads must meet strategic priorities, provide access to significant regional destinations, and: A minimum of 70% of trips along the segment must be longer than 10 km in the peak hour and peak direction, and total peak hour, peak direction traffic volume is greater than 800 vehicles per hour; OR A minimum of 10 through buses in the peak hour and peak direction, or the segment carries a minimum of 800 trucks per day. 1 Expansion investment would include an initial 10% increase in funding for MRN operations, maintenance and rehabilitation to accommodate MRN additions, and a 1% increase per year thereafter. COSTS 10-Year Capital Year 10 Operating Cost (2015$) Cost (2015$) $26.3 million $4.7 million/year The above figures are inclusive of costs for investments described in the Maintain Service and System investments section, which have 10-year capital cost (2015 $) of $26.3 million and Year 10 operating cost (2015 $) of $1.6 million. OUTCOMES AND EVALUATION RESULTS See section cover page. 1 Approved by the Board on December 9, 1998 as part of the report titled, Establishment of the Major Road Network: Recommended Guidelines and Network. A-10

14 PROGRAM: CAPITAL FOR MINOR MRN UPGRADES PROGRAM DESCRIPTION This program would increase funding to deliver minor capital (under $10m) upgrades on the MRN. Types of minor capital upgrades considered would include: corridor improvements, intersection improvements, new traffic control signals, and pedestrian and cycling projects. Funding would be committed on a competitive basis according to consistency with the priorities for roads, as set out in the Regional Transportation Strategy Strategic Framework: improve safety, increase local and regional connectivity, and improve goods movement. PROGRAM OBJECTIVES This program would fund projects that improve local access, goods movement and safety for all modes. Projects funded under this program would also be smaller projects that improve the overall functional efficiency of the road network and are intended to postpone the need for larger capital project investments. PROGRAM SCOPE This program would continue the current practice of providing a 50% cost share for appropriate MRN upgrade projects under $10m. COSTS 10-Year Capital Year 10 Operating Cost (2015$) Cost (2015$) $200 million $ -- The above figures are inclusive of costs for investments described in the Maintain Service and System investments section, which have 10-year capital cost (2015 $) of $100 million. OUTCOMES AND EVALUATION RESULTS See section cover page. A-11

15 PROJECT: REPLACEMENT OF PATTULLO BRIDGE PROJECT DESCRIPTION The Pattullo Bridge is an important element of the region s Major Road Network. Connecting the City of Surrey and City of New Westminster, the bridge carries, on average, over 75,000 vehicles per weekday, almost 10% of which are trucks. The bridge, maintained by TransLink, requires replacement due primarily to age and safety concerns. This project would replace the Pattullo Bridge with a new, fourlane bridge funded primarily by user pricing. The replacement bridge will be designed in a manner so as not to foreclose the consideration of a potential future expansion to six lanes, subject to an all-party agreement and Mayors Council approval. PROJECT OBJECTIVES The Pattullo Bridge provides a critical connection between Surrey and New Westminster, a link that is also important to neighboring municipalities. Yet the 76-year-old structure is in considerably worse condition than was indicated when it was passed from the Province to TransLink in 1999: subsequent investigation revealed that it is at risk in the event of a moderate earthquake or ship collision, the piers are being undermined by river scour and many components have surpassed their useful lives. Accordingly, TransLink has been working with the Province and with the cities of Surrey and New Westminster since 2012 on a potential solution, including the full bridge replacement, which will reduce the need for, and scale of, urgent seismic and deck upgrading on the existing bridge, assuming a funded solution can be advanced in the immediate future. Other objectives for a replacement facility include addressing other issues with the current crossing: 1. The Pattullo Bridge does not meet current roadway design guidelines, including lane widths and curvature, potentially contributing to collisions. 2. Pattullo Bridge facilities, such as sidewalks and barriers, and connections for pedestrians and cyclists, are inadequate and do not provide sufficient protection from traffic. 3. During rush hours, travel demand on the roads leading to the Pattullo Bridge results in queuing and unreliable travel times for the movement of people, goods and services. 4. Current traffic (including truck) volumes affect the livability of adjacent communities due to air quality, noise and health impacts, as well as due to neighbourhood traffic infiltration. PROJECT SCOPE This Vision proposes to replace the Pattullo as soon as possible, with a four-lane bridge, with user pricing to fund the majority of its cost. Pricing can take several forms; see the Advance Mobility Pricing section in the main document for more detail. A-12
16 A new bridge, with modern lane widths, better connections, a centre barrier and high quality cycling and pedestrian facilities, would improve traffic flow, enhance safety and satisfy demand (for drivers and goods movers) for the foreseeable future. A resilient four-lane option would minimize the immediate cost (freeing up resources for other urgent transportation investments). The bridge would be designed such that it would not foreclose the possibility of future expansion to six lanes. This possible expansion may be considered if need arises, for example if demand increases beyond forecasts and/or the surrounding network changes. We recognize that finding a solution for improving goods movement on the north side of the Fraser River continues to be a regional priority; the Pattullo Bridge currently serves approximately one-third of the East West truck traffic in the corridor. Future consideration of expansion would require all-party agreement and Mayors Council approval. The Provincial government has pledged a contribution towards the replacement of the Pattullo Bridge and to seek Federal support on behalf of the region. As a priced facility, this Vision contemplates a modest contribution to the costs of a new facility, as well as participation in funding of the costly work to keep the existing structure in a state of good repair until a new bridge is completed. This full bridge replacement will significantly reduce the need for much of the costly rehabilitation work underway on the existing bridge. To ensure that public dollars are not wasted, TransLink will move to implement a new bridge funded by user pricing at the earliest possible date. Most of our residents feel that the current tolling reality in the region is not fair. It is essential that the Province of BC addresses this by bringing in a consistent approach to tolling across the region that is fair and efficient. The Province of BC has indicated openness to revisiting its tolling policy. We are asking them to complete this work immediately as it will be an essential step in developing a rational and fair system for paying for infrastructure and managing the network. This work is particularly important as we work together on implementing region-wide distance-based mobility pricing which would reduce or restructure the toll rates on regional facilities and support demand management on the Pattullo Bridge and other parts of the regional road network. Key Assumptions: The utilization of user pricing to finance the majority of the bridge has significant impacts on performance expectations for this design, including peak hour reductions in demand on the facility of 15-50%, due to changes in trip choices by residents. During project development, further consideration will be given to how to most cost-effectively deliver this solution such as the design of the approaches, infrastructure sizing, and preservation of corridor property while not foreclosing future options. Current cost estimates include roadway connections similar to today on the North Side with some significant modifications to the connecting roadway infrastructure on the south side of the Bridge. During project development, more detailed consideration will be given by stakeholders to what connections and modifications will best serve stated project objectives. A-13
17 COSTS 2 10-Year Capital Cost (2015 $) $978 million Year 10 Operating Cost (2015 $) (no net new operating costs assumed) OUTCOMES AND EVALUATION RESULTS Performance Criteria Access Non-Auto Access Mode Share (Additional jobs accessible by the average person in the region) (Additional jobs accessible by walk, cycle and transit by the average person in the region) (One onehundredths of a percent (1/100 s %)) Daily Vehicle Kilometers Travelled Change from 2030 Base Case 0 0 ~0 1,493 Cost-Effectiveness Score (0-100) The project cost for the Pattullo Bridge replacement project has been refined since preliminary cost estimates were developed including those provided in the Pattullo Bridge Strategic Review Discussion Guide. Cost estimates have been updated to reflect the most recent planning assumptions. The updated estimated cost of a new Pattullo Bridge reflects inclusion of project development costs and costs of interest during construction; presentation of project costs in 2015 dollars; and approximately $25 million in capital cost for a design approach that would not preclude the future possibility of expanding the bridge to six lanes (at further cost at such a time). Cost estimates will continue to be refined as the project partners better define the design, including scope, construction approach, phasing, connections, right-of-way requirements, and so forth. A-14

18 TRANSIT: TRANSIT FACILITIES PROGRAMS OVERVIEW This program would fund new and expanded stations, exchanges or other transit facilities and improve the performance of existing facilities. Upgrades would focus on enabling facilities to meet increasing passenger demand and facilitate improved transit operations, as well as enhance community integration or address deficiencies in amenities including lighting, weather protection, furniture, and landscaping. Specific scopes would be confirmed through additional planning and coordination with project partners. Concurrent with these upgrades and new facilities, TransLink may partner with local jurisdictions to prepare area plans and identify opportunities to improve access and make land uses more transit-supportive in the station or exchange vicinity. Some project elements may be funded by other entities. This category includes the following investment programs and projects: Transit Facilities Upgrades / Expansion and New Facilities Program Lonsdale Quay Upgrade A-15

19 PROGRAM: TRANSIT FACILITIES UPGRADES / EXPANSION AND NEW FACILITIES PROGRAM DESCRIPTION This program would fund the expansion, upgrade or reconfiguration of transit facilities and design and construction of new bus transit facilities across the region. Program envelopes within this category include: Transit Facilities: Projects with priority for completion in first 5 years (6 facilities) Transit Facilities: Projects with priority for completion in years 5-10 (6 facilities) PROGRAM OBJECTIVES This program would provide funding to upgrade regional bus transit facilities. New and improved facilities support the goal to increase transit mode share, and provide the necessary capacity to meet demand associated with increasing service levels as the system grows. Upgrades would focus on enabling facilities to meet increasing passenger demand and facilitating improved transit operations. Upgrades may also enhance community integration, address deficiencies in amenities, and improve the accessibility of the waiting and connecting environment for users, contributing to growth in mode share. PROGRAM SCOPE This program would enable the expansion and/or reconfiguration of existing passenger facilities or construction of new facilities to accommodate increases in customer demand and transit service levels. The program would also allow for improvements to community integration and customer experience through enhanced wayfinding and amenities, including lighting, weather protection, furniture, and landscaping. The specific scopes of individual projects would be confirmed through additional planning and coordination with project partners. Plans would be made within the context of TransLink s Transit Passenger Facility Design Guidelines. The recent Newton Exchange project provides an example of the type of upgrades this program would support. The project expanded the existing exchange while addressing a number of deficiencies, including passenger comfort, safety and accessibility, operational efficiency and capacity. As an example of a future project, at the new Downtown Langley Exchange, a larger facility will support future transit expansion in the South of Fraser. The new exchange, located adjacent to a mixed-use, transit-oriented development, will include a transit plaza to provide waiting space and amenities for passengers including weather protection, seating, and bicycle storage. This program has two funding envelopes: PROJECTS WITH PRIORITY FOR COMPLETION IN FIRST 5 YEARS (6 FACILITIES) Phibbs Exchange Reconfigure and expand to address growing demand, improve accessibility, amenity and neighbourhood integration Surrey Central Exchange and off-street bus layover facility Reconfigure and expand to facilitate municipal redevelopment plans and address growing demand A-16
20 SFU Exchange Reconfigure and expand to address growing demand, improve accessibility, amenity and neighbourhood integration Langley Exchange Relocate and expand to address growing demand, improve accessibility, amenity and neighbourhood integration Willowbrook Exchange New facility to address growing demand, improve accessibility, amenity and neighbourhood integration Coquitlam Central Exchange and park and ride facility Reconfigure to allow transit oriented development on the site PROJECTS WITH PRIORITY FOR COMPLETION IN YEARS 6-10 (6 FACILITIES) Port Coquitlam Station bus exchange Upgrade to improve accessibility, and customer amenities Highway 99 at Steveston Highway and Highway 17A New Rapid Bus stations coordinated with the Massey Tunnel replacement/hwy 99 project to provide transfer opportunities to routes serving Richmond, South Surrey, Ladner, Tsawwassen, and Tilbury Industrial Park South Delta Exchange and Park and Ride Relocate and expand to respond to changing development, improve accessibility, amenity and neighbourhood integration Steveston New off-street bus layover facility to accommodate increased transit service levels and improve operational efficiency Downtown Vancouver New bus layover facility or facilities to accommodate increased transit service levels and improve operational efficiency As needs shift, other facilities upgrades may be identified as priorities and may be implemented in advance of those listed above. COSTS Investment Facilities: Year 1-5 Priorities (Upgrade 6 Facilities) [$5.2m/year capital for Years 1-5] Facilities: Year 6-10 Priorities (Upgrade 6 Additional Facilities) [$5.2m/year capital for Years 6-10] OUTCOMES AND EVALUATION RESULTS 10-Year Capital Cost (2015$) Year 10 Operating Cost (2015$) $52.0 million $1.1 million $52.0 million $1.1 million Performance Criteria Transit Facilities Programs (1-5 years) Access (Additional jobs accessible by the average person in the region) Non-Auto Access (Additional jobs accessible by walk, cycle and transit by the average person in the region) Mode Share (One onehundredths of a percent (1/100 s %)) Daily Vehicle Kilometers Travelled Change from 2030 Base Case ,643 Cost-Effectiveness Score (0-100) A-17
21 Performance Criteria Transit Facilities Programs (6-10 years) Access (Additional jobs accessible by the average person in the region) Non-Auto Access (Additional jobs accessible by walk, cycle and transit by the average person in the region) Mode Share (One onehundredths of a percent (1/100 s %)) Daily Vehicle Kilometers Travelled Change from 2030 Base Case ,338 Cost-Effectiveness Score (0-100) Observations: This program is designed to both increase capacity and operational efficiency of bus exchanges and to make the transit system more attractive by improving passenger comfort and amenities at these facilities. These improvements can encourage increased transit use, which can help reduce VKT and road congestion, thereby improving travel speeds and accessibility for both transit and auto users. Investing in new and ongoing maintenance and upgrades of transit facilities will improve the safety and security of staff and customers. Transit facilities are key connection points for many customers. Ensuring they will be able to handle future demand growth is essential for ensuring that the transit system remains an effective and attractive travel option for customers. Relatively more cost-effective at reducing VKT compared to other projects since trip distances by transit are high for riders using these transit facilities. The performance of the projects in years 6-10 is slightly lower than the projects in years 1-5 primarily because there are fewer projects and the number of customers they impact is lower. A-18
22 PROJECT: LONSDALE QUAY UPGRADE PROJECT DESCRIPTION This project would upgrade the Lonsdale Quay floating SeaBus terminal and adjacent bus exchange. PROJECT OBJECTIVES Upgrades are proposed to the floating SeaBus terminal and adjacent bus exchange to improve passenger and operational safety, upgrade the passenger experience, and improve transit vehicle circulation. This project was proposed in the 2012 Moving Forward plan to address passenger and operational safety concerns and improve facility attractiveness. The project was identified as a priority in subsequent Base Plans with implementation on hold pending availability of funding. The project would support the goal to increase transit mode share by improving transit operations and increasing facility attractiveness for users. PROJECT SCOPE Schematic design to detail the station upgrades was completed in The project would include interior refurbishment of the floating SeaBus terminal, replacement or upgrade of the existing canopy above the walkway between the SeaBus terminal and bus exchange, replacement of ceiling panels above the bus passenger island, improved illumination, expanded seating options and new site furnishings, relocated security kiosk, painting, and enhanced wayfinding. Opportunities to accommodate additional retail and bike storage at the facility would be explored. COSTS 10-Year Capital Cost Year 10 Operating Cost (2015$) (2015$) $10.4 million $0.2 million OUTCOMES AND EVALUATION RESULTS Performance Criteria Access (Additional jobs accessible by the average person in the region) Non-Auto Access (Additional jobs accessible by walk, cycle and transit by the average person in the region) Mode Share (One onehundredths of a percent (1/100 s %)) Daily Vehicle Kilometers Travelled Change from 2030 Base Case Cost-Effectiveness Score (0-100) , Observations: This project is designed to both increase capacity and operational efficiency of Lonsdale Exchange and to make the transit system more attractive by improving passenger comfort and amenities at this facility. These improvements can encourage increased transit use, which can help reduce VKT and road congestion, thereby improving travel speeds and accessibility for both transit and auto users. Investing in maintenance and upgrades of Lonsdale Quay will ensure that the facility will remain safe and secure for staff and customers. A-19
23 Lonsdale Quay will remain a key connection point for many customers travelling between downtown Vancouver, North Vancouver and beyond. Ensuring it will be able to handle future demand growth is essential for ensuring that the transit system remains an effective and attractive travel option for customers. The cost-effectiveness scores are slightly lower than other transit facilities likely due to the higher costs for Lonsdale (due to floating SeaBus terminal) compared to the other transit facility investments Relatively high cost-effectiveness for VKT since trip distances by Lonsdale Quay users are generally higher than other transit services and has a high number of projected additional boardings A-20
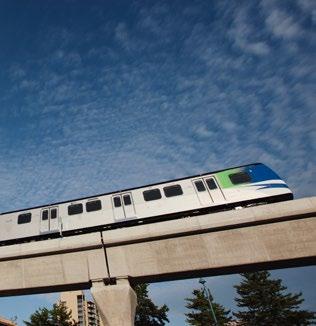
24 TRANSIT: UPGRADES TO EXISTING RAIL Metro Vancouver s rail rapid transit network moved over 120 million people in 2013 (34% of system-wide boardings). The following programs would fund upgrades and expansions in fleet, facilities and stations to increase capacity on existing rail lines in order to accommodate future growth, address projected future overcrowding, and facilitate increased transit mode share. Each rail upgrade program includes a phased plan of enhancements over the 10-year plan period and, in some cases, assumes upgrades in subsequent years. PROGRAM COSTING 10-Year Capital Cost (2015$) Year 10 Operating Cost (2015$) Expo Line Upgrades (Years 1-10) $588 million $36.5 million Millennium Line Upgrades (Years 1-10) $177 million $17.0 million Canada Line Upgrades (Years 1-10) $52 million $16.2 million West Coast Express Upgrades $36 million $5.0 million Note: The above figures are inclusive of costs for investments described in the Maintain Service and System investments section, which have 10-year capital cost (2015 $) of $87 million and Year 10 operating cost (2015 $) of $12.5 million. A-21
25 PROGRAM: EXPO LINE UPGRADES PROGRAM DESCRIPTION This program would upgrade the capacity of the Expo Line through procurement of additional fleet vehicles, expansion of fleet storage, operations and maintenance facilities, and upgrades to station houses and platforms. The program would work toward implementation of the recommendations of the Expo Line Upgrade Strategy (2010). The Expo Line is part of the Frequent Transit Network. PROGRAM OBJECTIVES Upgrades to Expo Line are needed to increase capacity of the line to meet projected demand and to support the goal of doubling the capacity of the line by 2020, as articulated in the Provincial Transit Plan (2008). Without investment, delays and overcrowding will increase in the future as ridership growth exceeds capacity, particularly at the peak load point between Commercial-Broadway and Main Street Science World Stations. The objectives of this program are to: Enable a greater regional share of trips to be made by transit by meeting current and future ridership demand on the Expo Line. Ensure all subsystems are upgraded to support the increase in system capacity and an expanded fleet. Improve station infrastructure to make them more accessible and ensure unimpeded and safe passenger flows. PROGRAM SCOPE The Expo Line is the backbone of Metro Vancouver s rail rapid transit network, connecting Surrey, New Westminster, Burnaby and Vancouver. Expo Line ridership is forecast to reach 23,000 to 26,000 people per hour per direction (pphpd) at the peak point by Current peak capacity on the Expo Line is estimated at 15,400 pphpd. Through this program, the system would be upgraded to provide a peak capacity of 25,700 pphpd by 2041 through the exclusive operation of 5-car Mark II/III trains, which provide the largest passenger capacity per train. In recent years, TransLink has made station upgrades on the Expo Line to improve capacity, accessibility, customer amenities, and to install fare gates. Funding is already secured to upgrade Main Street-Science World, Scott Road, New Westminster, Commercial-Broadway, Metrotown, Joyce-Collingwood and Surrey Central Stations. This program would enable similar improvements at additional stations, for example Burrard, Edmonds, Waterfront, and others. Upgrades may include expanded or reconfigured platforms, and reconfigured passenger circulation, including entries and exits. Specific scopes of individual station upgrade projects would be confirmed through additional planning and coordination with project partners. Plans would be developed within the context of TransLink s Transit Passenger Facility Design Guidelines. Waterfront Station, for example, could undergo a range of potential upgrades, including structural and seismic upgrades, reconfiguration of platforms, additional entry/exit points and vertical circulation elements, integration with a refurbished SeaBus terminal, and a potential off-street bus layover facility. Improvements may be achieved through minor station upgrades or more broadly as part of a redevelopment of major hubs in partnership with the City of Vancouver and local landowners. The program, phased over the 10-year plan period, would include: Procurement of additional Mark III fleet, increasing Expo Line capacity to roughly 21,700 pphpd by Increasing operation of five-car Mark II/III trains (compared with current trains which operate in a 2-car or 4-car configuration). A-22
26 Capacity upgrades to the SkyTrain Operations and Maintenance Centre (OMC) to accommodate the additional and longer trains. Propulsion Power System upgrade (stage 3). An expanded program of station upgrades, including extension of station platforms to accommodate longer trains, and enhancement of stations to accommodate greater passenger volumes, including improved circulation, additional faregates, escalators, and emergency exits. Upgrades would be phased between 2015 and 2024 as follows: Phase Timeframe Program description Fleet: 60 additional cars in service by 2019 (inclusive of 28 cars as part of Maintain Service and System). Facilities: expansion of Operations and Maintenance Centre and Heavy Maintenance Centre, and upgrades to Propulsion Power System in to accommodate the new fleet. Stations: upgrades to improve passenger access and circulation at five stations, and minor capacity / platform upgrades at 15 stations Fleet: 18 additional cars in service in Stations: access, safety/security, and circulation upgrades at additional stations Fleet: 21 additional cars in service in These investments include the procurement of 28 Mark II cars in 2017 assumed as part of Maintain Service and System needed to provide sufficient capacity on the Expo Line to meet near-term demand. Beyond the 10-year horizon of the implementation plan, further investment will be needed to address growing capacity and access needs on the Expo Line. Investments would include 27 additional fleet cars procured between 2025 and These upgrades are not included in costing shown in the table below. Additionally, options to alleviate capacity needs on the Expo Line may be explored; for example, extensions of the Millennium Line have the potential to reduce demand on the Expo Line. If it is decided to not extend the Millennium Line westward on the Broadway corridor, extending the Millennium Line to downtown Vancouver could be considered to reduce demand on the peak link. COSTS 10-Year Capital Cost (2015$) Year 10 Operating Cost (2015$) $588 million $36.5 million Note: The above figures are inclusive of costs for investments described in the Maintain Service and System investments section, which have 10-year capital cost (2015 $) of $87 million (2015 $) and Year 10 operating cost of $10.3 million (2015 $). A-23
27 OUTCOMES AND EVALUATION RESULTS Performance Criteria Access (Additional jobs accessible by the average person in the region) Non-Auto Access (Additional jobs accessible by walk, cycle and transit by the average person in the region) Mode Share (One onehundredths of a percent (1/100 s %)) Daily Vehicle Kilometers Travelled Change from 2030 Base Case 1,006 2, ,603 Cost-Effectiveness Score (0-100) Observations: Without upgrades to the Expo Line, overcrowding on this portion of the network would prevent the full benefits of system expansion from being realized. The Expo Line is nearing 30 years of age and requires investment to remain a safe, accessible and attractive transportation choice. While this project has high costs, it is an important investment to ensure that there is sufficient capacity to meet future demand. If conditions on the service deteriorate, it will deter many people from using transit and will have a compounding effect on the achievement of transportation goals and targets. Investing in the Expo Line has particular significance because of the role it plays in the Regional Growth Strategy; an efficient transportation system is a key element of encouraging density and development around stations and along the Expo Line. Due to limitations in the regional transportation model, the above figures should be interpreted with caution. It is likely that the actual benefit of this upgrade project is greater than shown here. A-24

28 PROGRAM: MILLENNIUM LINE UPGRADES PROGRAM DESCRIPTION This program would upgrade the capacity of the Millennium Line through procurement of additional fleet vehicles, expansion of fleet storage facilities and upgrades to stations. The Millennium Line is part of the Frequent Transit Network. PROGRAM OBJECTIVES The objective of the program is to ensure the successful long-term integration of the Evergreen Line with the current SkyTrain network when it opens in 2016, and provision of sufficient capacity to meet demand. This program would address capacity issues, support future ridership growth and shift more trips to transit by alleviating overcrowding as demand increases over time. PROGRAM SCOPE In 2016, the Evergreen Line will commence operation as an extension of the current Millennium Line, connecting Coquitlam and Port Moody to Vancouver and the SkyTrain network. Funding for the required 28 new SkyTrain cars has already been committed (within the 2014 Base Plan) as part of the Evergreen Line expansion of the SkyTrain network and would go into service on opening day; however, more fleet will be needed to meet all of the growth in demand anticipated along the Millennium Line during the plan period. This program would provide funding for infrastructure upgrades on the Millennium Line (including the Evergreen Line extension) needed to meet demand over the 10-year plan period, including: Procurement of additional Mark III fleet, increasing Millennium/Evergreen Line capacity to roughly 8,000 pphpd. Increasing line capacity by operating the 4-car Mark II/III configuration (compared with opening-day trains which will operate in a 2-car configuration). Capacity upgrades to the Coquitlam Vehicle Storage Facility to accommodate additional and longer trains. Station upgrades to accommodate greater passenger volumes, including improved circulation, additional faregates, escalators, and emergency exits. Upgrades would be phased between 2015 and 2024 as follows: Phase # Timeframe Scope Facilities: first phase of capacity expansions at the Coquitlam Vehicle Storage Facility to accommodate the new fleet. Stations: minor platform upgrades at all 13 Millennium Line stations Fleet: 46 additional cars. Facilities: second phase of capacity expansions at Coquitlam Vehicle Storage Facility to accommodate the new fleet. A-25
29 COSTS 10-Year Capital Cost (2015$) Year 10 Operating Cost (2015$) $177 million $17.0 million OUTCOMES AND EVALUATION RESULTS Performance Criteria Access (Additional jobs accessible by the average person in the region) Non-Auto Access (Additional jobs accessible by walk, cycle and transit by the average person in the region) Mode Share (One onehundredths of a percent (1/100 s %)) Daily Vehicle Kilometers Travelled Change from 2030 Base Case 1,074 2, ,463 Cost-Effectiveness Score (0-100) Observations: Without upgrades to the Evergreen/Millennium Line, overcrowding on this portion of the network would prevent the full benefits of system expansion from being realized. While this project has high costs, it is an important investment to ensure that there is sufficient capacity to meet future demand. If conditions on the service deteriorate, it will deter many people from using transit and will have a compounding effect on the achievement of our goals and targets. Investing in the Millennium/Evergreen Line has particular significance because of the role it plays in the Regional Growth Strategy; an efficient transportation system is a key element of encouraging density and development around stations and along the Millennium/Evergreen Line. A-26

30 PROGRAM: CANADA LINE UPGRADES PROGRAM DESCRIPTION This program would upgrade the capacity of the Canada Line through procurement of additional fleet vehicles, expansion of fleet storage facilities and upgrades to stations. The Canada Line is part of the Frequent Transit Network. PROGRAM OBJECTIVES Currently, passenger volumes exceed available vehicle capacity at the peak point between Oakridge and King Edward Stations during the AM peak period (7:30-8:30AM), resulting in crowding and passups. By 2045, ridership demand is expected to grow by 73-85% from current levels. Meeting the increased demand requires additional fleet and upgrades to infrastructure, including stations and the fleet storage facility. The objectives of this program are to: Meet future travel demand and maintain Canada Line as an attractive travel option for customers. Support transit-oriented developments and maintain the effectiveness of the regional transit network. PROGRAM SCOPE Ridership demand on the Canada Line has grown steadily since the line commenced service in TransLink is currently undertaking a review of the Canada Line to assess ridership demand in the 30-year horizon and the corresponding need for service and infrastructure. Forecasts suggest that significant ridership growth is expected in the next 30 years, and additional infrastructure and fleet will be needed to accommodate the increase in demand. This program would allocate funding for the Canada Line service and infrastructure upgrades needed in the next ten years to begin to meet demand in the medium to long-term, including: Procurement and operation of additional fleet. Capacity upgrades to the Canada Line Operations and Maintenance Centre to accommodate additional vehicles. Extension of station platforms from 40m to 50m to permit operation of 3-car trains when warranted by demand, and enhancement of stations to accommodate greater passenger volumes, including improved circulation, additional faregates, escalators, and emergency exits. Upgrades anticipated to take place between 2015 and 2024 would include: A-27 Service: The Canada Line can currently carry 6,100 passengers per hour per day (pphpd), and service investments would increase capacity by up to 2,000 pphpd during the peak periods. (Of this amount, MSS service increases would increase capacity by about 700 pphpd.) Fleet: 12 additional cars in service in (An additional 8 cars would be procured in 2024 for revenue service beginning in 2025.)
31 Facilities: capacity expansion at the Canada Line Operations and Maintenance Centre to accommodate new fleet. Stations: passenger access and circulation upgrades at 3 stations, major platform capacity upgrades at 12 stations to finish or extend platforms from 40 to 50 m, and emergency exiting capacity upgrades at 4 stations. Additionally, beyond the 10-year horizon, it is anticipated that between 2025 and 2030 the program would extend to fund acquisition of eight additional cars. Program extension beyond the 10-year horizon is not included in costing. COSTS Total Capital Cost (2015$) Annual Operating Cost (2015$)* $52M $16.2M *Annual operating cost reflects annual cost following deployment of vehicles procured in Note: The above figures are inclusive of costs for investments described in the Maintain Service and System investments section, which have no capital costs and annual operating cost of $1.7 million (2015 $). OUTCOMES AND EVALUATION RESULTS Performance Criteria Access (Additional jobs accessible by the average person in the region) Non-Auto Access (Additional jobs accessible by walk, cycle and transit by the average person in the region) Mode Share (One onehundredths of a percent (1/100 s %)) Daily Vehicle Kilometers Travelled Change from 2030 Base Case 623 1, ,009 Cost-Effectiveness Score (0-100) Observations: Without upgrade to the Canada Line, overcrowding on this portion of the network would prevent the full benefits of system expansion from being realized. There are portions of the service that already exceed capacity, and demand is only expected to grow. While this project has substantial costs, it is an important investment to ensure that there is sufficient capacity to meet future demand. If service conditions deteriorate, it will deter many people from using transit and will have a compounding effect on the achievement of our goals and targets. Investing in the Canada Line has particular significance because of the role it plays in the Regional Growth Strategy; an efficient transportation system is a key element of encouraging density and development around stations and along the Canada Line. A-28

32 PROGRAM: WEST COAST EXPRESS UPGRADES PROGRAM DESCRIPTION Population in the WCE service area is estimated to grow by 62% by Ridership demand for WCE service is forecast to grow even with the introduction of the Evergreen Line in WCE service levels have changed very little in almost 20 years and peak hour trains are over-capacity during AM peak hour and near capacity during PM peak hour. Current West Coast Express service levels are not adequate to meet the future level of anticipated demand, and the busiest trains have reached the maximum length (10 cars) that can be accommodated by existing platforms and hauled by the current locomotives. This program would upgrade the capacity of the West Coast Express (WCE) service through the addition of passenger cars and a locomotive to meet growing demand over the plan period. PROGRAM OBJECTIVES The primary objective of this program is to address capacity constraints on West Coast Express. PROGRAM SCOPE As part of Maintain Service and System, one additional rail car (from TransLink s existing set of vehicle assets) would be added to one existing AM inbound trip and one existing PM outbound trip. Additionally, this program would introduce an additional train to meet near-term demand during the peak hour and support future expansion through additional procurement of passenger cars. The introduction of the new train will lead to temporarily shorter trains, but these will need to be lengthened in the medium term to meet demand. Upgrades to West Coast Express have also been identified to meet future demand; these upgrade needs will be reviewed once the Evergreen Line opens in 2016 and there is a better understanding of the relationship between demand on these two services. The scope of the program from 2015 to 2024 is as follows: Phase # Timeframe Description Fleet: 5 additional cars and 1 new locomotive. MSS would add one additional rail car (from TransLink s existing set of vehicle assets) to one existing AM inbound trip and one existing PM outbound trip Fleet: 5 additional cars. Additional WCE station upgrades and community integration improvements are anticipated beyond 2024 and have not been included in the costs below. A-29
33 COSTS Total Capital Cost (2015$) Annual Operating Cost (2015$) $36M $5.0M Note: The above figures are inclusive of costs for investments described in the Maintain Service and System investments section, which have no capital cost and annual operating cost of $0.5 million (2015 $). OUTCOMES AND EVALUATION RESULTS Performance Criteria Access (Additional jobs accessible by the average person in the region) Non-Auto Access (Additional jobs accessible by walk, cycle and transit by the average person in the region) Mode Share (One onehundredths of a percent (1/100 s %)) Daily Vehicle Kilometers Travelled Change from 2030 Base Case ,783 Cost-Effectiveness Score (0-100) Observations: The West Coast Express provides a regular commuter service and is a key link between Port Moody and Vancouver. It is already over-capacity during the morning peak hour, and demand is expected to continue to grow. Low density around the West Coast Express corridor, limited service and a high cost per unit of service have an impact on the performance of the upgrades. A-30

34 TRANSIT: B-LINE OR BETTER INVESTMENTS OVERVIEW The following projects involve investments in new or extended fast, frequent, and direct B-Line or Better bus routes. A funding program is also included to support investments in transit priority measures on B-Line corridors to improve speed and reliability. These projects would implement B-Line service, which is a limited-stop type of bus service that operates every 15 minutes or better, all-day, seven days a week. B-Line corridors are part of the Frequent Transit Network. Factors that contributed to the selection of the specific set of B-Lines prioritized for investment within the first ten years includes contribution to performance outcomes (including estimation of ridership), and whether the project linked regional Urban Centres. Specific routings, stop locations, and initial service levels (e.g. peak frequency and span of service) for each route would be confirmed through performance-based evaluation and detailed service design. These investments would amount to over 193km of new B-Line service across the region and would require 452,000 net new annual service hours. In addition, as described further in Appendix B, select B-Line corridors would receive investment in transit priority measures to further improve speed and reliability. Transit priority enhancements could be applied to new B-Lines or existing B-Lines, including the portion of Vancouver s Broadway corridor between Arbutus and UBC, which will not have rapid transit in the first phase. Transit priority measures could include: signal priority, queue jumpers or bus lanes. In some cases B-Lines may be improved to Bus Rapid Transit (BRT) levels through the introduction of a fully separated right of way along all or a portion of the route. Specific transit priority enhancements would be determined through further study and collaboration with the local municipality. See the System Management section for further detail. Investment Levels Net New Annual Service Hours by 2024 New B-Lines introduced by 2024 KM of B-Line introduced by 2024 Additional Vehicles on the Road in ,000 hours 11 B-Lines 193 Km 159 buses A-31
35 List of B-Lines for Implementation in 10 Year Timeframe 10-Year Capital Cost (2015$) Year 10 Operating Cost (2015$) Extend 96 B-Line to White Rock Centre via King George Boulevard Years 6-10 and 152 nd $3.7M $1.9M Street New B-Line - Surrey Centre to Langley via Fraser Highway $11.9M $6.1M Years 0-5 New B-Line - Downtown Vancouver to SFU Burnaby via Hastings Years 0-5 $4.4M $2.1M Street New B-Line - Downtown Vancouver to SE Marine Drive via Victoria Years 6-10 $7.5M $3.9M Drive / Commercial Drive New B-Line - Dundarave to Phibbs Exchange via Marine Drive / 3 rd Years 0-5 $9.4M $4.6M Street New B-Line - Metrotown to Capilano University via Willingdon Years 6-10 $11.2M $5.8M Avenue New B-Line - Scott Road Station to Newton Exchange via Scott Road Years 0-5 and 72 nd $8.7M $4.4M Avenue New B-Line - Richmond-Brighouse Station to Metrotown via Knight Years 0-5 $3.1M $1.7M Street, Bridgeport Road and Garden City New B-Line - Joyce-Collingwood to UBC via 41 st Avenue $10.0M $5.1M Years 0-5 New B-Line - Lynn Valley Centre to Downtown Vancouver via 29 th Years 6-10 $12.5M $6.3M Street, Lonsdale Ave and Marine Drive New B-Line - Coquitlam Centre to Maple Ridge via Lougheed Years 6-10 $8.1M $4.1M Highway and Dewdney Trunk Road* New B-Line - Coquitlam Centre to Langley via Lougheed Highway Years 6-10 and 200 th $10.6M $5.6M Street* Total $93M $47M *Initial implementation of only one of these two options is assumed. In the primary document Regional Transportation Investments: a Vision for Metro Vancouver, the costs for these two routes are reflected in total costs by averaging. Note: where B-Line service would replace some or all existing service, costs reflect net increases in capital and operating expenditure. In addition to the routes shown above, an additional set of routes was considered but has been deferred for potential future consideration/implementation. This includes: New B-Line Metrotown to New Westminster via Kingsway, Edmonds Street and 6th Street New B-Line Marine Drive Station to 22nd Street Station via SW/SE Marine Drive New B-Line Downtown Vancouver to SE Marine Drive via Fraser Street New B-Line Coquitlam Centre to Surrey via Lougheed Highway and Highway 1 Timing Assumption A-32
36 PROJECT: EXTEND 96 B-LINE TO WHITE ROCK CENTRE VIA KING GEORGE BOULEVARD AND 152 ND STREET PROJECT DESCRIPTION This project would extend the existing 96 B-Line from Newton Exchange to White Rock Centre via King George Boulevard and 152 Street. PROJECT OBJECTIVES This project would complete the full King George Boulevard B-Line project as proposed in the 2012 Moving Forward plan. The project is intended to serve growing demand and build ridership in the corridor as a precursor to potential rapid transit. B-Line service on King George Boulevard was identified in the 2007 South of Fraser Area Transit Plan and in the 2008 Provincial Transit Plan as a precursor to potential rapid transit. The project would attract more riders to transit, which would support regional mode share goals and reduce Vehicle Kilometres Traveled (VKT). PROJECT SCOPE An extended 96 B-line would provide limited-stop bus service from White Rock Centre to Newton, Surrey and Guildford via King George Boulevard and 152 Street. The service would continue to connect with Expo Line at Surrey Central and King George stations. The route would represent an additional 15km of B-Line or Better bus service and an investment of approximately 18,000 net annual service hours. Key Assumptions: Existing underlying peak-only express bus service (394) would be discontinued. Upon introduction of rapid transit on this corridor, the B-Line would be discontinued. COSTS 10-Year Capital Cost (2015$) $3.7M Year 10 Operating Cost (2015$) $1.9M OUTCOMES AND EVALUATION RESULTS Performance Criteria Access (Additional jobs accessible by the average person in the region) Non-Auto Access (Additional jobs accessible by walk, cycle and transit by the average person in the region) Mode Share (One onehundredths of a percent (1/100 s %)) Daily Vehicle Kilometers Travelled Change from 2030 Base Case ,131 Cost-Effectiveness Score (0-100) Observations: The performance of this B-Line is affected by the following factors: It has only one employment centre anchor on the route There is low population density and pedestrian facilities along the route; investing in this B-Line extension, however, is intended to build demand along the corridor by attracting development and investment. This B-Line extension would provide a key high-capacity link between White Rock, Surrey and beyond. Although this B-Line would likely serve longer distance trips, the VKT reduction potential is overall relatively low. A-33
37 PROJECT: NEW B-LINE - SURREY CENTRE TO LANGLEY VIA FRASER HIGHWAY PROJECT DESCRIPTION This project would introduce a new B-Line on Fraser Highway between Surrey Central and Langley Centre. PROJECT OBJECTIVES The project is intended to serve growing demand and build ridership in the corridor as a precursor to potential rapid transit. The project would attract more riders to transit, which would support regional mode share goals and reduce Vehicle Kilometres Traveled (VKT). B-Line service on Fraser Highway was identified in the 2007 South of Fraser Area Transit Plan and in the 2008 Provincial Transit Plan as a precursor to potential rapid transit. PROJECT SCOPE A new B-Line would be introduced to provide limited-stop bus service along Fraser Highway between Langley Centre, Clayton, Fleetwood, and Surrey Central including connections with Expo Line at Surrey Central and King George stations. This route would represent an additional 20km of B-Line or Better bus service and an investment of approximately 59,000 net annual service hours. Key Assumptions: Existing underlying local bus service (502) would be retained with appropriate frequency adjustments. Upon introduction of rapid transit on this corridor, the B-Line would be discontinued. COSTS 10-Year Capital Cost (2015$) $11.9M Year 10 Operating Cost (2015$) $6.1M OUTCOMES AND EVALUATION RESULTS Performance Criteria Access (Additional jobs accessible by the average person in the region) Non-Auto Access (Additional jobs accessible by walk, cycle and transit by the average person in the region) Mode Share (One onehundredths of a percent (1/100 s %)) Daily Vehicle Kilometers Travelled Change from 2030 Base Case 459 1, ,007 Cost-Effectiveness Score (0-100) Observations: The performance of this B-Line is affected by the following factors: It has two strong employment anchors at each end of the route It would significantly improve travel speed on the corridor It would significantly reduce overcrowding on transit service in the corridor It has the potential to entice many longer-distance auto trips onto transit, thus reducing VKT It is on the higher cost end of the proposed B-Lines, but high performance results in medium-high costeffectiveness scores A-34
38 PROJECT: NEW B-LINE - DOWNTOWN VANCOUVER TO SFU BURNABY VIA HASTINGS STREET PROJECT DESCRIPTION This project would introduce a new B-Line along the full length of Hastings Street between Downtown Vancouver and SFU Burnaby. PROJECT OBJECTIVES The project is intended to serve growing demand and contribute to a grid of fast, frequent and reliable B-Line services that complement the rapid transit network. B-Line service on this corridor was identified in the 2005 Vancouver/UBC Area Transit Plan as an upgrade to existing local/express service of the 135. The project would attract more riders to transit, which would support regional mode share goals and reduce Vehicle Kilometres Traveled (VKT). PROJECT SCOPE A new B-Line would be introduced to provide limited-stop bus service between SFU and Downtown Vancouver via Hastings Street. The service would connect with SeaBus, as well as the Expo, Millennium and Canada Lines at Waterfront Station. This route would represent an additional 22km of B-Line or Better bus service and an investment of approximately 20,000 net annual service hours. Key Assumptions: Existing underlying express bus service (135) would be discontinued, while local service on Hastings would be maintained with appropriate frequency adjustments. COSTS 10-Year Capital Cost (2015$) $4.4M Year 10 Operating Cost (2015$) $2.1M OUTCOMES AND EVALUATION RESULTS Performance Criteria Access (Additional jobs accessible by the average person in the region) Non-Auto Access (Additional jobs accessible by walk, cycle and transit by the average person in the region) Mode Share (One onehundredths of a percent (1/100 s %)) Daily Vehicle Kilometers Travelled Change from 2030 Base Case ,519 Cost-Effectiveness Score (0-100) Observations: The performance of this B-Line is affected by the following factors: It has at least two strong employment centre anchors on the route that both have high parking costs, which could entice drivers onto transit There is high population density along the route and built environment supports pedestrian activity and transit ridership A-35
39 It would significantly reduce overcrowding on transit service in the corridor, making transit more attractive to existing and potential customers Would likely not result in significant travel time savings since there is already an existing service this is already largely limited stop, nor would it likely result in a significant number of additional people taking transit instead of driving There are expected to be significant cost savings associated with replacing the existing frequent transit service on the corridor, thus the overall cost of implementation of the B-Line would be relatively low, making the costeffectiveness scores higher than average. A-36
40 PROJECT: NEW B-LINE - DOWNTOWN VANCOUVER TO SE MARINE DRIVE VIA VICTORIA DRIVE / COMMERCIAL DRIVE PROJECT DESCRIPTION This project would introduce a new B-Line along the full length of Victoria Drive and Commercial Drive and into Downtown Vancouver via Hastings Street. PROJECT OBJECTIVES The project is intended to serve growing demand and contribute to a grid of fast, frequent and reliable B-Line services that complement the rapid transit network on an existing high-demand corridor. B-Line service on this corridor was envisioned in the City of Vancouver s 2012 Transportation 2040 plan. The project would attract more riders to transit, which would support regional mode share goals and reduce Vehicle Kilometres Traveled (VKT). PROJECT SCOPE A new B-Line would be introduced to provide limited-stop bus service between SE Marine Drive and Downtown Vancouver via Victoria Drive, Commercial Drive and Hastings Street. The service would connect with Expo and Millennium Lines at Commercial-Broadway Station and SeaBus, Expo, Millennium and Canada Lines at Waterfront Station. This route would represent an additional 14km of B-Line or Better bus service and an investment of approximately 38,000 net annual service hours. Key Assumptions: Existing underlying local bus service (20) would be retained with appropriate frequency adjustments. COSTS 10-Year Capital Cost (2015$) $7.5M Year 10 Operating Cost (2015$) $3.9M OUTCOMES AND EVALUATION RESULTS Performance Criteria Access (Additional jobs accessible by the average person in the region) Non-Auto Access (Additional jobs accessible by walk, cycle and transit by the average person in the region) Mode Share (One onehundredths of a percent (1/100 s %)) Daily Vehicle Kilometers Travelled Change from 2030 Base Case 268 1, ,574 Cost-Effectiveness Score (0-100) Observations: The performance of this B-Line is affected by the following factors: It has only one major employment centre anchor It will have only minimal travel time improvements on an existing frequent transit corridor Access to the service is supported by high population density and a pedestrian-friendly built environment along the route, making transit travel more attractive It serves a destination with high parking costs, thus providing an attractive alternative for auto users It will likely serve shorter length urban trips, thus will have minimal impact on reducing VKT A-37
41 PROJECT: NEW B-LINE - DUNDARAVE TO PHIBBS EXCHANGE VIA MARINE DRIVE / 3 RD STREET PROJECT DESCRIPTION This project would introduce a new B-Line between Dundarave in West Vancouver and Phibbs Exchange in the District of North Vancouver via Lower Lonsdale along Marine Drive and 3 rd Street. PROJECT OBJECTIVES The project is intended to serve growing demand and improve transit connections to major destinations along this important east-west corridor on the north shore. B-Line service on this corridor was identified in the long-term vision of the 2012 North Shore Area Transit Plan. The project would attract more riders to transit, which would support regional mode share goals and reduce Vehicle Kilometres Traveled (VKT). PROJECT SCOPE A new B-Line would be introduced to provide limited-stop bus service along Marine Drive and 3 Street between Dundarave, Park Royal, Lower Lonsdale, and Phibbs Exchange. The service would connect with SeaBus at Lonsdale Quay. This route would represent an additional 14km of B-Line or Better bus service and an investment of approximately 45,000 net annual service hours. Key Assumptions: Existing underlying local bus service (239) would be retained with appropriate frequency reductions. COSTS 10-Year Capital Cost (2015$) $9.4M Year 10 Operating Cost (2015$) $4.6M OUTCOMES AND EVALUATION RESULTS Performance Criteria NEW B-LINE: MARINE DR/3 ST (NORTH SHORE) Access (Additional jobs accessible by the average person in the region) Non-Auto Access (Additional jobs accessible by walk, cycle and transit by the average person in the region) Mode Share (One onehundredths of a percent (1/100 s %)) Daily Vehicle Kilometers Travelled Change from 2030 Base Case 346 1, ,369 Cost-Effectiveness Score (0-100) Observations: The performance of this B-Line is affected by the following factors: It has one major employment centre anchor and substantial employment and retail along the corridor It would provide some travel time improvements over the existing frequent transit service, but more importantly would significantly reduce overcrowding on transit service in the corridor, which would make transit travel more attractive It has high population density along the route While the built environment along some parts of the route is not very pedestrian friendly, making it more difficult to get to and from transit, it also passes through some highly pedestrian friendly areas. Potential VKT reduction as a result of the potential B-Line is reasonably high. A-38
42 PROJECT: NEW B-LINE - METROTOWN TO CAPILANO UNIVERSITY VIA WILLINGDON AVENUE PROJECT DESCRIPTION This project would introduce a new B-Line between Metrotown and Capilano University via Willingdon Avenue, Hastings Street, and the Ironworkers Memorial Bridge. PROJECT OBJECTIVES The project is intended to serve growing demand and contribute to a grid of fast, frequent and reliable B-Line services that complement the rapid transit network. B-Line service on this corridor was identified in the long-term vision of the 2012 North Shore Area Transit Plan. The project would attract more riders to transit, which would support regional mode share goals and reduce Vehicle Kilometres Traveled (VKT). PROJECT SCOPE A new B-Line would be introduced to provide limited-stop bus service between Metrotown and Capilano University along Willingdon Avenue, Hastings Street and the Ironworkers Memorial Bridge via BCIT, Brentwood Town Centre, Burnaby Heights, and Phibbs Exchange. The service would connect with Expo Line at Metrotown Station and Millennium Line and Evergreen Line at Brentwood Station. This route would represent an additional 17km of B-Line or Better bus service and an investment of approximately 56,000 net annual service hours. Key Assumptions: Existing underlying local bus service (130) would be retained with appropriate frequency adjustments. COSTS 10-Year Capital Cost (2015$) $11.2M Year 10 Operating Cost (2015$) $5.8M OUTCOMES AND EVALUATION RESULTS Performance Criteria Access (Additional jobs accessible by the average person in the region) Non-Auto Access (Additional jobs accessible by walk, cycle and transit by the average person in the region) Mode Share (One onehundredths of a percent (1/100 s %)) Daily Vehicle Kilometers Travelled Change from 2030 Base Case 403 1, ,467 Cost-Effectiveness Score (0-100) Observations: The performance of this B-Line is affected by the following factors: There is a major employment centre anchor on one end, a major educational institution on the other end and another along the way. The travel time savings are expected to be minimal over existing frequent transit service Except for at Metrotown, there is low to medium population density along the corridor. The built environment is generally less pedestrian friendly, making it more difficult to get to and from transit Potential VKT reduction as a result of the potential B-Line is reasonably high A-39
43 PROJECT: NEW B-LINE - SCOTT ROAD STATION TO NEWTON EXCHANGE VIA SCOTT ROAD AND 72 ND AVENUE PROJECT DESCRIPTION This project would introduce a new B-Line between Scott Road Station and Newton Exchange via Scott Road and 72 Avenue in Surrey. PROJECT OBJECTIVES The project is intended to serve growing demand and contribute to a grid of fast, frequent and reliable B-Line services that complement the rapid transit network on an existing high-demand corridor. Frequent bus service on this corridor was identified in the 2007 South of Fraser Area Transit Plan. The project would attract more riders to transit, which would support regional mode share goals and reduce Vehicle Kilometres Traveled (VKT). PROJECT SCOPE A new B-Line would be introduced to provide limited-stop bus service along Scott Road and 72 Avenue between Scott Road Station, Scottsdale Exchange, and Newton Exchange including connections with Expo Line at Scott Road Station and potential rapid transit on King George Boulevard at Newton Exchange. This route would represent an additional 13km of B-Line or Better bus service and an investment of approximately 43,000 net annual service hours. Key Assumptions: Existing underlying local bus service (319) would be retained with appropriate frequency adjustments. COSTS 10-Year Capital Cost (2015$) $8.7M Year 10 Operating Cost (2015$) $4.4M OUTCOMES AND EVALUATION RESULTS Performance Criteria Access (Additional jobs accessible by the average person in the region) Non-Auto Access (Additional jobs accessible by walk, cycle and transit by the average person in the region) Mode Share (One onehundredths of a percent (1/100 s %)) Daily Vehicle Kilometers Travelled Change from 2030 Base Case 320 1, ,293 Cost-Effectiveness Score (0-100) Observations: The performance of this B-Line is affected by the following factors: Has one employment centre anchor It would significantly reduce overcrowding on transit service in the corridor Will have minimal travel time savings over existing FTN service Has low population density and minimal pedestrian facilities along the corridor A-40
44 PROJECT: NEW B-LINE - RICHMOND-BRIGHOUSE STATION TO METROTOWN VIA KNIGHT STREET, BRIDGEPORT ROAD AND GARDEN CITY PROJECT DESCRIPTION This project would introduce a new B-Line between Metrotown and Richmond-Brighouse via 49 th Avenue, Knight Street, Bridgeport Road and Garden City Road. PROJECT OBJECTIVES The project is intended to serve growing demand and contribute to a grid of fast, frequent and reliable B-Line services that complement the rapid transit network and connect Regional City Centres. PROJECT SCOPE A new B-Line would be introduced to provide limited-stop bus service along 49 Avenue, Knight Street, Bridgeport Road and Garden City Road between Metrotown and Richmond-Brighouse. The service would connect with the Expo Line at Metrotown Station, and with the Canada Line at Bridgeport and Richmond-Brighouse Stations. This route would represent an additional 17km of B-Line or Better bus service and an investment of approximately 16,000 net annual service hours. Key Assumptions: Existing underlying limited stop bus service (430) would be discontinued as it duplicates other local services. COSTS 10-Year Capital Cost (2015$) $3.1M Year 10 Operating Cost (2015$) $1.7M OUTCOMES AND EVALUATION RESULTS Performance Criteria Access (Additional jobs accessible by the average person in the region) Non-Auto Access (Additional jobs accessible by walk, cycle and transit by the average person in the region) Mode Share (One onehundredths of a percent (1/100 s %)) Daily Vehicle Kilometers Travelled Change from 2030 Base Case ,645 Cost-Effectiveness Score (0-100) Observations: The performance of this B-Line is affected by the following factors: The route has two employment centres as anchors A B-Line service would provide some travel time savings over the existing FTN service There is significant existing and expected population density along the corridor, but the current built environment is not very pedestrian friendly A-41
45 PROJECT: NEW B-LINE - JOYCE-COLLINGWOOD TO UBC VIA 41 ST AVENUE PROJECT DESCRIPTION This project would introduce a new B-Line between Joyce-Collingwood and UBC via 41 Avenue and SW Marine Drive. PROJECT OBJECTIVES The project is intended to serve growing demand and contribute to a grid of fast, frequent and reliable B-Line services that complement the rapid transit network. B-Line service on this corridor was identified in the 2005 Vancouver/UBC Area Transit Plan as an upgrade to existing peak-only, limited-stop service of the 43, and was envisioned in the City of Vancouver s Transportation 2040 plan. The project would attract more riders to transit, which would support regional mode share goals and reduce Vehicle Kilometres Traveled (VKT). PROJECT SCOPE A new B-Line would be introduced to provide limited-stop bus service along 41 Avenue and SW Marine Drive connecting Joyce-Collingwood, Oakridge, Dunbar, and UBC. The service would connect with the Expo Line at Joyce- Collingwood Station and with the Canada Line at Oakridge-41 st Avenue Station. This route would represent an additional 19km of B-Line or Better bus service and an investment of approximately 49,000 net annual service hours. Key Assumptions: Existing underlying peak-only limited-stop bus service (43) would be discontinued. Existing underlying local bus service (41) would be retained with appropriate frequency adjustments. COSTS 10-Year Capital Cost (2015$) $10.0M Year 10 Operating Cost (2015$) $5.1M OUTCOMES AND EVALUATION RESULTS Performance Criteria Access (Additional jobs accessible by the average person in the region) Non-Auto Access (Additional jobs accessible by walk, cycle and transit by the average person in the region) Mode Share (One onehundredths of a percent (1/100 s %)) Daily Vehicle Kilometers Travelled Change from 2030 Base Case 351 1, ,432 Cost-Effectiveness Score (0-100) Observations: The performance of this B-Line is affected by the following factors: It has one employment centre anchor It would not provide significant travel time savings over existing FTN services There is high population density and good pedestrian facilities along the corridor It serves a destination with high parking costs It is not expected to entice many additional auto users to transit, thus having a minimal impact on VKT A-42
46 PROJECT: NEW B-LINE - LYNN VALLEY CENTRE TO DOWNTOWN VANCOUVER VIA 29 TH STREET, LONSDALE AVE AND MARINE DRIVE PROJECT DESCRIPTION This project would introduce a new B-Line between Lynn Valley Centre, Lonsdale Quay and Downtown Vancouver via 29 Street, Lonsdale Ave, Marine Drive and the Lions Gate Bridge. PROJECT OBJECTIVES The project is intended to serve growing demand and contribute to a grid of fast, frequent and reliable B-Line services that complement the rapid transit network. B-Line service on this corridor was identified in the long-term vision of the 2012 North Shore Area Transit Plan. The project would attract more riders to transit, which would support regional mode share goals and reduce Vehicle Kilometres Traveled (VKT). PROJECT SCOPE A new B-Line would be introduced to provide limited-stop bus service between Lynn Valley Centre and Downtown Vancouver via 29 Street, Lonsdale Avenue, Marine Drive and the Lions Gate Bridge. The service would connect with SeaBus at Lonsdale Quay, with Expo and Millennium Lines at Burrard, Granville, and Stadium Stations, and with the Canada Line at Vancouver City Centre. This route would represent an additional 16km of B-Line or Better bus service and an investment of approximately 61,000 net annual service hours. Key Assumptions: Existing underlying local bus service (229) would be retained with appropriate frequency adjustments. COSTS 10-Year Capital Cost (2015$) $12.5M Year 10 Operating Cost (2015$) $6.3M OUTCOMES AND EVALUATION RESULTS Performance Criteria Access (Additional jobs accessible by the average person in the region) Non-Auto Access (Additional jobs accessible by walk, cycle and transit by the average person in the region) Mode Share (One onehundredths of a percent (1/100 s %)) Daily Vehicle Kilometers Travelled Change from 2030 Base Case 408 1, ,070 Cost-Effectiveness Score (1-100) Observations: The performance of this B-Line is affected by the following factors: There is one major employment centre as an anchor It is not expected to significantly reduce travel times There is high population density, but only moderate pedestrian facilities along the corridor This would provide an alternative to longer auto trips, but there is low incentive for auto users to switch to transit A-43
47 PROJECT: NEW B-LINE COQUITLAM CENTRE TO MAPLE RIDGE VIA LOUGHEED HIGHWAY AND DEWDNEY TRUNK ROAD PROJECT DESCRIPTION This project would introduce a new B-Line between Coquitlam Station, Port Coquitlam, Pitt Meadows and Maple Ridge City Centre / Haney Place via Lougheed Highway and Dewdney Trunk Road. PROJECT OBJECTIVES The project is intended to serve growing demand and contribute to a grid of fast, frequent and reliable B-Line services that complement the rapid transit network, connecting Regional City Centres. B-Line service along a portion of this corridor is an emerging concept of the 2014 North-East Sector Area Transit Plan, and was identified in the 2008 Provincial Transit Plan. The project would attract more riders to transit, which would support regional mode share goals and reduce Vehicle Kilometres Traveled (VKT). PROJECT SCOPE A new B-Line would be introduced to provide limited-stop bus service connecting Coquitlam Centre, Port Coquitlam Centre, Pitt Meadows, and Maple Ridge, via Lougheed Highway and Dewdney Trunk Road, including connections with Millennium/Evergreen Line at Coquitlam Centre Station and West Coast Express at Port Coquitlam, Pitt Meadows, and Maple Meadows Stations. This route would represent an additional 20km of B-Line or Better bus service and an investment of approximately 40,000 net annual service hours. Key Assumptions: Existing underlying local bus services (701) would be retained with appropriate frequency adjustments. Project would not be introduced if new B-Line Coquitlam-Langley via Lougheed/200 Street is introduced. COSTS 10-Year Capital Cost Year 10 Operating Cost (2015$) (2015$) $8.1M $4.1M Note: It is assumed that only one of this and the following B-Line option ( New B-Line Coquitlam Centre to Langley via Lougheed Highway and 200th Street ) would be implemented. OUTCOMES AND EVALUATION RESULTS Performance Criteria Access (Additional jobs accessible by the average person in the region) Non-Auto Access (Additional jobs accessible by walk, cycle and transit by the average person in the region) Mode Share (One onehundredths of a percent (1/100 s %)) Daily Vehicle Kilometers Travelled Change from 2030 Base Case 261 1, ,068 Cost-Effectiveness Score (0-100) Observations: The performance of this B-Line is affected by the following factors: There is one employment centre anchor A-44
48 It would not have significant travel time impacts over existing FTN service There is low population density and minimal pedestrian facilities along the route It does provide an alternative to a tolled auto trip, but is not expected to entice many additional auto users onto transit A-45
49 PROJECT: NEW B-LINE COQUITLAM CENTRE TO LANGLEY VIA LOUGHEED HIGHWAY AND 200 TH STREET PROJECT DESCRIPTION This project would introduce a new B-Line between Coquitlam Station, Port Coquitlam, Pitt Meadows and Langley Centre via Lougheed Highway, the Golden Ears Bridge and 200 Street in Langley. PROJECT OBJECTIVES The project is intended to serve growing demand and contribute to a grid of fast, frequent and reliable B-Line services that complement the rapid transit network, connecting Regional City Centres. B-Line service along a portion of this corridor is an emerging concept in the long-term vision of the 2014 North-East Sector Area Transit Plan and was identified as part of the 2020 RapidBus network of the 2008 Provincial Transit Plan. The project would attract more riders to transit, which would support regional mode share goals and reduce Vehicle Kilometres Traveled (VKT). PROJECT SCOPE A new B-Line would be introduced to provide limited-stop bus service connecting Coquitlam Centre, Port Coquitlam Centre, Pitt Meadows, Walnut Grove, Willowbrook and Langley Centre via Lougheed Highway and 200 Street. The service would connect with Millennium/Evergreen Line at Coquitlam Centre Station and with potential rapid transit on Fraser Highway at Langley Centre. This route would represent an additional 32km of B-Line or Better bus service and an investment of approximately 54,000 net annual service hours. Key Assumptions: Existing underlying local bus services (595 and 701) would be retained with appropriate frequency adjustments. Project would not be introduced if new B-Line Coquitlam Station - Maple Ridge City Centre is introduced. COSTS 10-Year Capital Cost Year 10 Operating Cost (2015$) (2015$) $10.6M $5.6 M Note: It is assumed that only one of this and the previous B-Line option ( New B-Line Coquitlam Centre to Langley via Lougheed Highway and 200th Street ) would be implemented. OUTCOMES AND EVALUATION RESULTS Access (Additional jobs accessible by the average person in the region) Performance Criteria Non-Auto Access (Additional jobs accessible by walk, cycle and transit by the average person in the region) Mode Share (One onehundredths of a percent (1/100 s %)) Daily Vehicle Kilometers Travelled Change from 2030 Base Case 364 1, ,987 Cost-Effectiveness Score (0-100) Observations: The performance of this B-Line is affected by the following factors: Has one employment centre anchor A-46
50 Would not have a significant impact on travel time over existing FTN service There is low population density and minimal pedestrian facilities along the route It does provide an alternative to a tolled auto trip but, given the land use context, is not expected to shift substantial additional auto users onto transit A-47
.")
51 TRANSIT: INVESTMENTS IN TRANSIT SERVICE OVERVIEW The following programs would fund investments in the regional bus network, including improvements to Frequent All-Day, Frequent Peak, and Basic Coverage services as well as targeted investments in the SeaBus, NightBus network and custom transit service (HandyDART). Frequent services operate sufficiently frequently that customers do not need to refer to a schedule, while Basic Coverage service provides service coverage at lower frequencies to provide basic access to transit service. For the purposes of this plan, bus services have been categorized into three mutually supportive networks: Frequent All-Day Service Where service runs at least every 15 minutes in both directions throughout the day and into the evening, every day of the week. Frequent Peak Service Where service runs at least every 15 minutes during highestdemand time periods and directions. Basic Coverage Service Where a basic level of service is provided in areas where demand is sufficient to warrant some level of service, but cannot support operation at higher frequencies, even during peak periods. Frequency improvements would be focused where sufficient demand exists already and/or where there is a reasonable level of certainty that demand is predicted to grow in the future based on committed plans and growth projections. Investments would be prioritized along the highest demand corridors to help improve service levels and reduce overcrowding. Overview of Bus and SeaBus Service Investments Level of Investment New Annual Service Hours* by million service hours Percentage increase in bus service by 2024 compared to today 25% New KM of Frequent All-Day Service (FTN) corridors by km New KM of Frequent Peak Service corridors by km New Areas served by Basic Coverage Service by new areas Note: The above figures include bus and SeaBus service hours, and are incremental to Base. Figures are inclusive of Maintain Service and System service investments, including an increase in annual bus service hours of 310,000 hours by Year 10 and an increase in SeaBus service of 2,400 hours beginning in Year 1. MSS also includes new vehicles to provide this service, including 72 conventional buses and 16 Community Shuttles. A-48
52 COSTS Investments 10-Year Capital Cost (2015$) Year 10 Operating Cost (2015$) All-Day Frequent Network $84.9M $43.6M SeaBus $31.2M $4.7M Peak Frequent Network $44.7M $23.6M Coverage Network $7.2M $4.4M NightBus Network $ - $2.1M HandyDART Service $19.9M $14.7M Additional Bus Depot $150M $15.9M Total $338M $109M Note: The above figures are inclusive of funding for investments described in the Maintain Service and System investments section, which have 10-year capital cost (2015 $) of $52 million and Year 10 operating cost of $35.5 million. A-49

53 PROGRAM: IMPROVE AND EXPAND FREQUENT ALL-DAY SERVICE PROGRAM DESCRIPTION Frequent All-Day service refers to corridors where transit service runs at least every 15 minutes in both directions throughout the day and into the evening, every day of the week. These corridors are part of the Frequent Transit Network. This program would support investments in (1) higher all-day frequencies on existing Frequent All-Day corridors, and (2) expansion of the Frequent All- Day network into new areas along select corridors. PROGRAM OBJECTIVES An improved and expanded Frequent All-Day network would help meet expected transit demand and reduce overcrowding, attract new transit riders, and serve growing markets. This program would increase service levels along already high-demand corridors, building system ridership and reducing overcrowding. This would help achieve regional mode share targets for transit and support municipal and regional land use efforts to focus growth and development along frequent transit corridors. PROGRAM SCOPE Frequent All-Day service refers to corridors where service runs every 15 minutes or better until 9 pm every day, starting at 6 am on weekdays, 7 am on Saturdays and 8 am on Sundays. This program has two core components: (1) intensify existing Frequent All-Day service, and (2) Expand Frequent All-Day service to new corridors. Resources would be allocated based on demonstrated and/or projected demand. 1. Intensify existing Frequent All-Day service to meet expected demand Under the Vision, 304,000 annual service hours would be allocated over the ten-year plan period to increase service frequencies on existing Frequent All-Day corridors. This program would invest additional resources as indicated in the table below to further intensify existing Frequent All-Day corridors. Example corridors, to be selected through more detailed planning, include: Broadway (Vancouver), Fraser Highway (Surrey/Langley), Hastings Street (Vancouver/Burnaby), Marine Drive/3 Street (North Shore), King George Boulevard (Surrey/White Rock), Willingdon Avenue (Burnaby), Lougheed Highway (Port Coquitlam/Pitt Meadows/Maple Ridge), 41 Avenue (Vancouver), 49 Avenue (Vancouver), Scott Road (Delta/Surrey), Cambie Road (Richmond), Highway 99 (Delta/White Rock), Lonsdale Avenue (North Vancouver), Main Street (Vancouver), Railway Avenue (Richmond), 6 Street (New Westminster), and others. 2. Expand Frequent All-Day service to new corridors across region Under the Vision, 118,000 annual service hours would be allocated over the ten-year plan period to expand the Frequent All-Day network along select corridors by increasing service frequencies to meet this service definition. This program would invest additional resources as indicated in the table below to further expand the network of Frequent All-Day service. Corridors would be identified on the basis of observed demand or A-50
54 where there is a reasonable level of certainty that demand is predicted to grow in the future based on committed plans and growth projections. Example corridors, to be selected through more detailed planning, include: Boundary Road (Vancouver/Burnaby), 8 Avenue (New Westminster), Highway 17/Highway 99 (Delta), Mountain Highway (North Vancouver), 29 Street/Queens Road/Capilano Road (West Vancouver), Pinetree Way/David Avenue/Coast Meridian Road (Coquitlam/Port Coquitlam), No. 1 Road/Garden City Road (Richmond), No. 3 Rd (Richmond), Bridgeport Road/Knight Street (Richmond), Highway 91/91A (Surrey/Delta/ Richmond/New Westminster), 64 Avenue (Surrey/Langley), 88 Avenue (Surrey/Langley), 200 Street (Langley), Golden Ears Way (Langley/Maple Ridge), Rupert Street (Vancouver), 16 Avenue/33 Avenue (Vancouver), and others. Program element Level of Investment 1. Intensify existing Frequent All-Day Service 304,000 annual service hours 2. Expand Frequent All-Day Service along new corridors 118,000 annual service hours * Service hours are incremental to service assumed in the 2014 Base Plan. COSTS Total Capital Cost Annual Operating (2015$) Cost (2015$) $84.9M $43.6M Note: The above figures are inclusive of costs for investments described in the Maintain Service and System investments section. OUTCOMES AND EVALUATION RESULTS Intensify Existing All-Day Frequent Service: Years 1-10 Performance Criteria Access Non-Auto Access Mode Share (Additional jobs accessible by the average person in the region) (Additional jobs accessible by walk, cycle and transit by the average person in the region) (One onehundredths of a percent (1/100 s %)) Daily Vehicle Kilometers Travelled Change from 2030 Base Case 2,645 12, ,549 Cost-Effectiveness Score (0-100) Observations: All-Day Frequent Services generally operate in areas with higher population and employment density, better pedestrian facilities, and more expensive auto parking charges. As a result, investing in additional service hours in these areas will generate good returns in terms of mode share and VKT. Expand All-Day Frequent Service: Years 1-10 Performance Criteria Access Non-Auto Access Mode Share (Additional jobs accessible by the average person in the region) (Additional jobs accessible by walk, cycle and transit by the average person in the region) (One onehundredths of a percent (1/100 s %)) Daily Vehicle Kilometers Travelled Change from 2030 Base Case 1,529 7, ,855 Cost-Effectiveness Score (0-100) A-51
55 Observations: All-Day Frequent Services are generally in areas with higher population and employment density, better pedestrian facilities, and more expensive auto parking charges. As a result, investing in additional service hours in these areas will generate good returns in terms of mode share and VKT. A-52

56 PROJECT: SEABUS SERVICE IMPROVEMENTS PROJECT DESCRIPTION This project would increase peak frequencies on the SeaBus connecting Waterfront Station with Lonsdale Quay to meet Frequent Transit Network guidelines operating at least every 15 minutes all day and to increase service to operate every 10 minutes during AM and PM peak periods. SeaBus service would become part of the Frequent Transit Network. PROJECT OBJECTIVES More frequent SeaBus service would attract new transit riders and reduce strain on North Shore to Downtown bus routes, particularly during peak hours. PROJECT SCOPE The SeaBus currently operates every 15 minutes during peak periods using two in-service vessels, connecting Waterfront Station with Lonsdale Quay. Funding for SeaBus service improvements would provide an additional 5,200 annual service hours, and would increase service to every 10 minutes in both directions from approximately 6:00-9:00am and approximately 3:00-6:00pm Monday to Friday, and every 15 minutes off-peak throughout the year. Within the Maintain Service and System funding envelope, 2,400 annual SeaBus service hours would be allocated to increase SeaBus service to every 15 minutes all day, seven days per week, which meets the requirement for classification as part of the Frequent Transit Network. In addition to the MSS level of investment, this project would also layer in an additional 2,800 annual SeaBus service hours and introduce a third SeaBus vessel into operation during peak periods to provide 10 minute service during weekday peak periods. Replacement of one existing SeaBus vessel will be required during the plan period to maintain the current fleet size, which will be necessary to operate 10-minute peak service and maintain 15-minute service during other times of the day into the future. COSTS Total Capital Cost (2015$) $31.2M Annual Operating Cost (2015$) $4.7M Note: The above figures are inclusive of funding for investments described in the Maintain Service and System investments section. A-53
57 OUTCOMES AND EVALUATION RESULTS Performance Criteria Access Non-Auto Access Mode Share (Additional jobs accessible by the average person in the region) (Additional jobs accessible by walk, cycle and transit by the average person in the region) (One onehundredths of a percent (1/100 s %)) Daily Vehicle Kilometers Travelled Change from 2030 Base Case 206 1, ,973 Cost-Effectiveness Score (0-100) Observations: The SeaBus is an important link between North Vancouver and downtown Vancouver. While this project has high costs, it is an important investment to ensure that there is sufficient capacity to meet future demand. If conditions on the service deteriorate, it will deter many people from using transit and will have a compounding effect on the achievement of our goals and targets. A-54
58 PROGRAM: IMPROVE AND EXPAND FREQUENT PEAK SERVICE PROGRAM DESCRIPTION Frequent Peak service refers to corridors where transit service runs at least every 15 minutes during peak-demand time periods or directions, but do not meet the definition of Frequent throughout the day. This program would support investments in: (1) higher peak frequencies on existing Frequent Peak corridors, and (2) expansion of the Frequent Peak network along new corridors. PROGRAM OBJECTIVES An improved and expanded network of Frequent Peak service would help meet expected demand, attract new transit riders, and serve growing markets. This program would increase service levels during already high-demand time periods, building system ridership and reducing overcrowding. This would help achieve regional mode share targets for transit. PROGRAM SCOPE This program has two core components: (1) intensify existing Frequent Peak service, and (2) Expand Frequent Peak service to new corridors. Resources would be allocated based on demonstrated and/or projected demand. 1. Intensify existing Frequent Peak service to meet expected demand Under the Vision, 117,000 annual service hours would be allocated over the ten-year plan period to increase frequencies on Frequent Peak services during their busiest time periods (e.g. AM and PM peaks) and/or directions. This program would invest additional resources as indicated in the table below to further intensify existing Frequent Peak service. Corridors would be identified on the basis of observed demand or where demand is predicted with a reasonable level of certainty to grow in the future based on committed plans. Example corridors, to be selected through more detailed planning, include: Austin Avenue (Coquitlam), Mount Seymour Parkway (North Shore), 108 Avenue (Surrey), Crescent Road (White Rock), No. 2 Road (Richmond), Burnaby Lake area/government Road (Burnaby), 12 Street (New Westminster), South Delta/Arthur Drive (Delta), and others. 2. Expand Frequent Peak service along new corridors across region Under the Vision, 173,000 annual service hours would be allocated over the ten-year plan period to expand the network of Frequent Peak services along select corridors by increasing service frequencies during their busiest time periods (e.g. AM and PM peaks) and/or directions to every 15 minutes or less. This program would invest additional resources as indicated in the table below to further expand the network of Frequent Peak service. Corridors would be identified on the basis of observed demand or where demand is predicted to grow in the future based on committed plans and a reasonable level of certainty. Example corridors, to be selected through more detailed planning, include: School House/Brunette (Coquitlam), Capilano Road (North Shore), 112 Street (Surrey), 152 Street (Surrey), 24 Avenue/32 Avenue (Surrey/Langley), Hwy 17 (Delta), and others. Program element Level of Investment 1. Intensify existing Frequent Peak Service 117,000 annual service hours 2. Expand Frequent Peak Service along new corridors 173,000 annual service hours * Service hours are incremental to service assumed in the 2014 Base Plan. A-55
59 COSTS Total Capital Cost (2015$) $44.7M Annual Operating Cost (2015$) $23.3M Note: The above figures are inclusive of costs for investments described in the Maintain Service and System investments section. OUTCOMES AND EVALUATION RESULTS Performance Criteria Access Non-Auto Access Mode Share Intensify Existing Frequent-Peak Service to Meet Expected Demand: Years 1-10 (Additional jobs accessible by the average person in the region) (Additional jobs accessible by walk, cycle and transit by the average person in the region) (One onehundredths of a percent (1/100 s %)) Daily Vehicle Kilometers Travelled Change from 2030 Base Case 1,112 5, ,622 Cost-Effectiveness Score (0-100) Observations: Peak Frequent Services are generally in areas with medium population density and longer auto commute trips. As a result, investing in additional service hours in these areas will generate good returns in terms of reducing VKT. Performance Criteria Access Non-Auto Access Mode Share Expand Frequent-Peak Network Across the Region: Years 1-10 (Additional jobs accessible by the average person in the region) (Additional jobs accessible by walk, cycle and transit by the average person in the region) (One onehundredths of a percent (1/100 s %)) Daily Vehicle Kilometers Travelled Change from 2030 Base Case 444 3, ,661 Cost-Effectiveness Score (0-100) Observations: Peak Frequent Services are generally in areas with medium population density and longer auto commute trips. As a result, investing in additional service hours in these areas will generate good returns in terms of reducing VKT. Increase peak service in areas currently with low transit service levels generates high ridership per incremental hour, however market saturation is expected to occur with relatively few hours (so these outcomes are not scalable) A-56

60 PROGRAM: EXPAND BASIC COVERAGE NETWORK PROGRAM DESCRIPTION Basic Coverage service refers to bus services providing a basic level of service coverage to areas where demand is sufficient to warrant some level of service, but cannot support operation at higher frequencies, even during peak periods. This program would allocate resources to introduce basic coverage services in new areas. PROGRAM OBJECTIVES This program would improve transit access in currently underserved areas, which would provide increased choice for people with few mobility options. PROGRAM SCOPE Through this program, funding would be provided to introduce up to an additional 57,000 annual service hours of basic coverage service across the region and up to an additional 15,000 for enhancement of service in existing basic coverage service areas in the region. This may be achieved through extensions or redesigns of existing basic coverage services or introduction of new routes. Examples of expansion areas include: Burke Mountain/Partington Creek in Coquitlam Four areas in Surrey (Clayton, Morgan Creek and Anniedale) Two areas in Langley (Willoughby, and Brookswood) Two areas in Maple Ridge (Silver Valley, and Albion/Thornhill) In some cases these services would be expected to advance to Peak Frequent service when demand warrants. Program element Level of Investment Intensify existing Basic Coverage Service 15,000 annual service hours Expand Basic Coverage Service in new areas 57,000 annual service hours * Service hours are incremental to service assumed in the 2014 Base Plan. COSTS Total Capital Cost (2015$) $7.2M Annual Operating Cost (2015$) $4.4M Note: The above figures are inclusive of funding for investments described in the Maintain Service and System investments section. A-57
61 OUTCOMES AND EVALUATION RESULTS Performance Criteria Access Non-Auto Access Mode Share (Additional jobs accessible by the average person in the region) (Additional jobs accessible by walk, cycle and transit by the average person in the region) (One onehundredths of a percent (1/100 s %)) Daily Vehicle Kilometers Travelled Change from 2030 Base Case -33 1, ,091 Cost-Effectiveness Score (0-100) Observations: New service in areas currently without transit service generates high ridership per incremental hour, however market saturation expected to occur with relatively few hours (so these outcomes are not scalable). Distance from population centres and introduced bus traffic drive low accessibility scores. A-58

62 PROGRAM: INCREASE FREQUENCY AND SPAN OF SERVICE ON NIGHTBUS NETWORK PROGRAM DESCRIPTION The NightBus network provides late-night service on select corridors, primarily in and out of Downtown Vancouver. This program would invest in increased service frequency and extended span of service on high demand NightBus services. PROGRAM OBJECTIVES Higher frequency NightBus service operating for a longer span of service would reduce overcrowding and risk of pass-ups on high demand NightBus routes. Extended span of service would provide new mobility options for late evening and early morning travel. PROGRAM SCOPE Under this program, funding would be provided to approximately double the amount of service hours available for NightBus service (20,000 new annual service hours). This investment would allow for frequency increases and extended span of service on high demand NightBus routes such as the N9, N17, N19, and N20; there is also the potential that additional new NightBus routes and/or later hours could also be considered. Resources would be allocated on the basis of observed demand and overcrowding. COSTS Total Capital Cost Annual Operating (2015$) Cost (2015$) $ - $2.1M OUTCOMES AND EVALUATION RESULTS Performance Criteria Access Non-Auto Access Mode Share (Additional jobs accessible by the average person in the region) (Additional jobs accessible by walk, cycle and transit by the average person in the region) (One onehundredths of a percent (1/100 s %)) Daily Vehicle Kilometers Travelled Change from 2030 Base Case ,030 Cost-Effectiveness Score (0-100) Observations: Low productivity time period results in relatively low performance. The Nightbus service provides an important connection for shift workers and expansion of service could provide more employment options to some residents. A-59

63 PROGRAM: INCREASE CUSTOM TRANSIT SERVICE AND RESOURCES PROGRAM DESCRIPTION Custom Transit is the region s door-to-door shared ride service for persons with physical or cognitive disabilities who are unable to use some or all of conventional transit without assistance, and is branded as HandyDART. Service is integrated with the region s 100% wheelchair accessible conventional transit service. This program would increase the service and resources available for Custom Transit accessible transit services to help keep pace with population growth and an aging population. PROGRAM OBJECTIVES Custom transit services provide affordable and accessible travel options for persons with disabilities. An expanded Custom Transit program would support increased availability of transit services for people who need them. PROGRAM SCOPE Under the Vision, 190,000 annual service hours would be allocated over the ten-year plan period to expand services offered through the Custom Transit program. This program would allocate up to an additional 190,000 annual service hours to the Custom Transit program, a total increase of approximately 24% over today s service levels. These funds would support increased service availability, reduced wait times and trip denials, and faster travel times. Given the proportion of Custom Transit trips that are focused on health care and social services, we feel that this type of service should be delivered in a 50/50 cost-sharing partnership with the provincial government. This partnership approach will be pursued as part of this Vision. Program element Increase Custom Transit Service and Resources Level of Investment 190,000 annual service hours Total increase over today s service levels 30% * Service hours are incremental to those assumed under the 2014 Base Plan COSTS Total Capital Cost (2015$) $19.9M Annual Operating Cost (2015$) $14.7M Note: The above figures are inclusive of funding for investments described in the Maintain Service and System investments section. OUTCOMES AND EVALUATION RESULTS Project not evaluated. A-60
64 PROJECT: BROADWAY CORRIDOR RAPID TRANSIT PROJECT DESCRIPTION This Vision calls for rapid transit between Commercial Drive and the University of British Columbia. The first 10 years of the Vision targets implementing the first phase; extending the Millennium Line westward from its current terminus at VCC-Clark to Arbutus, with frequent B-Line bus connections continuing to UBC from Arbutus. This project will also result in greater frequency on the Millennium and Evergreen Line (2016), which will benefit riders from across the region. This corridor would be part of the Frequent Transit Network. PROJECT OBJECTIVES Broadway is one of the region s busiest transit corridors and features major population, job and institutional centres. Rapid transit will help to support this regional economic centre, and improve capacity and transportation reliability both along this corridor and on the connecting regional network. It will give all users more choices and will clear road space for more efficient use by automobiles and cyclists. Extending rapid transit along the corridor would address capacity and reliability needs of the corridor, which would increase transit trips and mode share, and reduce vehicle kilometres travelled (VKT) and emissions. This project aims to efficiently serve growing demand in the corridor, while balancing regional investment priorities. PROJECT SCOPE In 2012, TransLink and the Province concluded the UBC Line Rapid Transit Study, in partnership with the City of Vancouver, UBC and Metro Vancouver. This study identified a shortlist of rapid transit options that could meet the long-term needs of the Broadway corridor between Commercial-Broadway station and UBC: SkyTrain to UBC, a combination of SkyTrain and LRT or a fully LRT based solution. This Vision has determined that the first phase of rapid transit will extend the Millennium line from its current terminus at VCC-Clark west along Broadway to Arbutus, providing a connection with the Canada Line at Broadway- City Hall. Eventually rail based rapid transit is required all the way to UBC from Arbutus. This connection could be completed either through a further extension of SkyTrain or with a Light Rail solution as identified in the UBC Line Study. During the approval process for the first phase, the stakeholders will work together to conclude how and when to complete the next phase of rail to the UBC campus. This line will bring provincial, regional and local value. The region is committed to constructing and operating the extension as a tunneled alignment along Broadway, contingent upon a Partnership Agreement being established with the City of Vancouver. The City of Vancouver will be responsible for the incremental cost associated with any additional tunneling beyond where technically or functionally required, consistent with operational capacity for other rapid transit systems within TransLink. The calculation of this portion of the Partnership Agreement will require more design development and will also consider the net costs to the project as well as other factors. The Partnership section of the Vision outlines the basis by which the region and municipalities will formalize these partnerships. This Agreement will outline the reciprocal commitments by TransLink and the City of Vancouver in respect to land use assumptions and actions, investment in connecting municipal infrastructure and direct financial contributions. This project also depends upon funding partnerships from other governments and the private sector. This funding will also be pursued as a matter of priority to ensure early implementation can occur. A-61
65 Key Assumptions: B-Line services (99) on the segment between Commercial Drive and Arbutus would be discontinued upon introduction of rapid transit. B-Line service from Arbutus to UBC would be retained until full build-out of rail to UBC. At Arbutus, a facility accommodating about two thirds of the current layover space at Commercial-Broadway would be required. Enhancements to the B-Line services between Arbutus and UBC will also be pursued to ensure efficient transit operations until the rapid transit is implemented to UBC. There are options for how rapid transit is completed between Arbutus and UBC in the second phase, as identified in the UBC Line rapid transit study: either by a Light Rail connection or a continuation of SkyTrain. If SkyTrain is eventually extended to UBC, there will be additional costs associated with the first phase, in order to build track west of Arbutus to allow for the UBC extension without impacting operations. This additional cost is estimated at $100 million and has not been included in cost estimates. COSTS* 10-Year Capital Cost (2015 $) Year 10 Operating Cost (2015 $) $1,980 million $23.2 million/year A-62
66 PROJECT: RAPID TRANSIT IN SURREY PROJECT DESCRIPTION This Vision would introduce light rail transit (LRT) on three corridors: 104th Avenue, King George Boulevard and Fraser Highway. These corridors would be part of the Frequent Transit Network. PROJECT OBJECTIVES The City of Surrey and surrounding communities are among the fastest growing parts of the region, forecast to attract more than 25% of new residents and jobs over the next 30 years. The objectives of these lines are to shape land use; shape travel demand; increase ridership; and reduce emissions. PROJECT SCOPE Identification of this project was informed by the Surrey Rapid Transit Study, which was led by TransLink and the Government of B.C., in partnership with the City of Surrey, the City of Langley and Metro Vancouver. This study identified a shortlist of rapid transit options that could meet the long-term needs of Surrey and surrounding communities; these options included BRT on all three corridors, LRT on all three corridors and two combinations that would have BRT on 104 th and King George with LRT or SkyTrain on Fraser Highway. This Vision would implement one of the short-listed alternatives, introducing LRT on Fraser Highway and on 104 Avenue and King George Boulevard south to Newton with B-line service continuing to White Rock. It provides the greatest extent of rail transit service of the short-listed alternatives and is the most consistent with the City of Surrey s urban development aspirations. It includes: 19 LRT stations and 6 B-Line stations A total of 26.8 kilometres of Light Rail Transit corridor length While detailed design work is needed to determine optimal alignments and station locations and funding approach, the objective is to complete construction on the first two lines 104th Avenue and King George Boulevard within the first 7 years of the Vision. Design and construction on the Fraser Highway line will commence within the first 10 years and will be completed within the first 12 years. The business case depends upon the concurrent implementation of land-use policies, and other supporting actions such as transit priority measures, parking management and walking and cycling investments that optimize the potential for the lines success. Achieving these objectives requires partnerships. The Partner section in the Vision document outlines the basis by which the region and municipalities will formalize Partnership Agreements. The Mayors Council is committed to work with municipalities to have the Agreements on the land use assumptions and actions, investment in connecting municipal infrastructure and direct financial contributions in place as these projects are approved and rolled out in future 10-Year Investment Plans. The project scope assumes that B-Line services on the respective corridors would be discontinued as new LRT service commences. COSTS* Capital Cost (2015 $) Operating Cost (2015 $) $2,440 million (12-year total) $22.3 million per year (by Year 12) A-63
67 CYCLING & WALKING ACCESS TO TRANSIT As the regional authority responsible for providing a transportation system that moves people and goods in support of regional and provincial objectives, TransLink s mandate is broad and multi-modal and includes walking and cycling. One of the headline targets of the RTS is to make it possible for people to make 50% of all trips by walking, cycling and transit within 30 years. Transit investments are a significant focus of regional dialogue largely because the investments required are so significant; however, walking and cycling which already accommodate more trips every day than transit will need to play an even bigger role if we are going to reach our targets in a way that is affordable to the region. Transit will play a critical role in supporting those longer distance trips but transit on its own won t get us to that 50% target the capacity is simply too expensive to build. Walking and cycling are inexpensive, energy and space efficient, health-promoting, climate friendly, time competitive for short urban trips and most importantly have significant untapped potential. About half of all trips in this region under 2km are currently made by auto. If even a fraction of these short auto trips were made by walking and cycling, significant amounts of auto traffic could be shifted from streets and substantial amounts of money could be saved in maintaining roads and building expensive parking structures. Conditions that support walking and cycling are also critical to help fully leverage investments in transit by enabling transit stops and stations to maximize their catchment area and reach the widest possible market. Improving walking and cycling facilities is more cost-effective than providing feeder bus services especially in denser urban areas where service needs are highest. And, investment in walking and cycling access has benefits for transit operations: it reduces road congestion in dense, urban areas with large volumes of bus service hours, and increases safety on the roads for bus operators, car drivers, cyclists and pedestrians alike. Every transit trip starts and ends with a walking trip. Currently, about 1/4 of the streets in Urban Centres and along the Frequent Transit Network (FTN) have no sidewalks, and an additional 1/3 have sidewalks only on one side of the street. In these areas and elsewhere, poor walking conditions and a lack of sidewalks and safe crossings mean that some people who would otherwise choose to take transit don t. Likewise, about 40% of Metro Vancouver residents who don t currently cycle would actually like to do so at least some of the time but don t because of fear and stress associated with riding mixed with high speed motor vehicle traffic. To unlock this potential, a focused program of investment to ensure safe walking conditions to transit and safe, traffic-protected bikeways is needed, and is called for in the Regional Cycling Strategy 3. As the authorities responsible for most streets and roads in the region, municipalities play the primary role constructing bikeways and walkways. TransLink plays an important catalytic and coordination role in helping to plan and fund facilities and programs across the region, including bicycle parking, local bikeways, development of a Major Bikeway Network, and walking and cycling connections to transit. For cycling investments, the priority will be on cost-sharing traffic-protected facilities in Urban Centres, Frequent Transit Development Areas and other high cycling potential areas. 3 In addition to constructing new cycling routes and facilities, the Regional Cycling Strategy identifies cycling programs, such as cycling education and Safe Routes to Transit, as being fundamental components of encouraging a wide range of people to take up cycling. These multi-modal programs are addressed under the sections for Mobility Management (Appendix B) and Walking (Appendix A). A-64
68 COSTS 10-Year Capital Cost (2015$) Year 10 Operating Cost (2015$) Cycling $131M $1.5M Regional Cycling Routes (not $96.7M $ -- TransLink-Owned) ($11.9M/year by year 6) TransLink-Owned Routes and Parking at TransLink Facilities ($4.6M/year by year 6) $34.4M $1.5M Walking Access to Transit Total $35.0M ($5.0M capital year by year 6) $ -- Note: The Cycling investment figures are inclusive of Maintain Service and System. MSS includes investment incremental to Base Plan in the amounts of $44.5 million (2015 $) in total capital for investment in Regional Cycling Routes (not TransLink-owned); and $9.5 million (2015 $) in total capital and $0.3 million (2015 $) operating per year for TransLink-owned Bicycle Investments, including Bicycle Parking. No funding for Walking Access to Transit is included within Maintain Service and System investments. OUTCOMES AND EVALUATION RESULTS Performance Criteria Access Non-Auto Access Mode Share (Additional jobs accessible by the average person in the region) (Additional jobs accessible by walk, cycle and transit by the average person in the region) (One onehundredths of a percent (1/100 s %)) Daily Vehicle Kilometers Travelled CYCLING Change from 2030 Base Case 2,984 1, ,728 Cost-Effectiveness Score (0-100) WALKING ACCESS TO TRANSIT Change from 2030 Base Case ,737 Cost-Effectiveness Score (0-100) Observations: The typical distance people are willing to walk is under 2km; currently the mode share for trips under 2km is 48% walking and 45% by auto. There is good opportunity to shift some of these short auto trips to walking especially in Urban Centres. The typical distance people are willing to cycle is up to 8km; the current mode share for trips under 8km is 65% auto, 21% walking and only 3% cycling. There is significant opportunity to shift some of these short auto trips to cycling which provide time-competitive way to travel in urban areas for short to medium length trips; Increasing the amount of high-quality, traffic-protected bikeways in Urban Centres and other high cycling potential areas, as proposed in this Vision, is the key step to attract a significant number of new users who currently do not feel safe or secure bicycling mixed in with high-speed motor vehicle traffic. A-65
69 PROGRAM: INVESTMENT IN BIKEWAYS PROGRAM DESCRIPTION This program would provide funding and cost-sharing to support complete the region s bikeway network as envisioned in the Regional Cycling Strategy over a time frame of about 20 years. In the first 10 years, this program would add to the existing bikeway network up to: 300 km of traffic-protected bikeways on major streets in Urban Centres, such as on-street cycle tracks with physical separation from traffic or off-street paths; 2,400 km of designated bikeways, such as marked bike lanes or neighbourhood street bikeways with bicycle-permeable traffic calming. One of the actions identified in the Regional Cycling Strategy is to define and implement the Major Bikeway Network (MBN) of high quality regionally significant routes that parallel and connect to the rapid transit system and regional gateways. These routes should be traffic-protected to the extent possible. Examples of specific projects that could be designated as part of the MBN are outlined below, including upgrading the BC Parkway and completing the Central Valley Greenway, North Shore Spirit Trail, Evergreen Bikeway, and routes South of Fraser to parallel future rapid transit lines. PROGRAM SCOPE This program would augment the existing Bicycle Infrastructure Capital-Cost Sharing (BICCS) program to provide cost-share funding to support an additional 300 km of traffic-protected bikeways and 2,400 of designated bikeways throughout the region, as identified by municipal transportation and cycling plans. Facilities would generally be constructed on a cost share basis with municipalities, but the cost share amount may vary depending on facility type and regional priority. Cost share funding would be ramped up over the first 5 years of the plan to ensure sufficient time to build matching funds into municipal capital plans. TransLink-owned assets would be funded at 100%. Regional priorities such as traffic-protected bikeways in Urban Centres and key links on the MBN would be cost-shared at up to 75%. All other municipal bikeways would be eligible for cost-sharing at 50%. COSTS AND EVALUATION RESULTS See section cover page. EXAMPLES OF POTENTIAL PROJECTS In addition to focusing on traffic-protected bikeways in Urban Centres, Frequent Transit Development Areas and other areas of high cycling potential, the following are examples of Major Bikeway Network projects which could be cost-share funded under this program: A-66

70 BC PARKWAY COMPLETION & UPGRADES (PARALLELING EXPO LINE) The BC Parkway is a 26 km cycle route connecting False Creek in Vancouver to Gateway Station in Surrey, paralleling the Expo Line. It is primarily a traffic-protected paved multi-use path, with some sections of designated on-street routes. About 50% of it is a TransLink asset: a 12 km portion of the route is owned by BC Hydro and managed by TransLink, and the remaining 14 km is owned and managed by the respective municipalities. This project would provide funding for upgrades to the TransLinkmanaged portion and, as a cost share, to the municipally-owned portions of the BC Parkway to enhance safety, functionality for cyclists and pedestrians, security and user amenities. This project would include extensive street crossing improvements, enhancements to the definition and condition of the separated cycling and pedestrian facilities, and overpasses at major arterial crossings. The identified upgrades would also improve pedestrian and cyclist access to the Expo Line. CENTRAL VALLEY GREENWAY COMPLETION & UPGRADES (PARALLELING MILLENNIUM LINE) The Central Valley Greenway (CVG), originally opened in 2009, is a 24 km multi-use regional route that parallels the Millennium Line, running from VCC-Clark Station in Vancouver through Burnaby to New Westminster Quay. It is a mix of unpaved multi-use trails, paved multi-use trails, on-street designated cycling routes with accompanying sidewalks, and on-street traffic-protected routes. Portions of the CVG remain gravel trails and long sections are not traffic-protected. This project would complete the Central Valley Greenway and address deficiencies identified since its opening, by focusing on creating traffic-protection on the portion of the CVG that runs along Winston Street in Burnaby, improving the New Westminster low level route, and providing a bridge over False Creek Flats in Vancouver. Completing the CVG would also improve access to transit for both cyclists and pedestrians. NORTH SHORE SPIRIT TRAIL COMPLETION (CONNECTING NORTH SHORE URBAN CENTRES) The North Shore Spirit Trail is a 35 km multi-use trail running from Horseshoe Bay to Deep Cove, connecting the District of West Vancouver, the District of North Vancouver, the City of North Vancouver, and the Squamish Nation. Initially envisioned in 2007, several portions have already been constructed by the local authorities, including significant portions from West Vancouver Civic Centre to the Second Narrows Bridge. The Spirit Trail currently has a mix of path types, including unpaved multi-use paths, paved multi-use paths, and designated onstreet routes. This project would contribute funding on a cost share basis to help the local authorities complete the North Shore Spirit Trail. This project would improve connections between communities on the North Shore to each other and to the rest of the region through connections to the SeaBus, Lion s Gate Bridge, and Second Narrows Bridge. EVERGREEN LINE BIKEWAY (PARALLELING EVERGREEN LINE) When completed in 2016, the Evergreen Line will extend the SkyTrain for 11 km from Lougheed Station in Burnaby into the region s Northeast Sector to Lafarge Lake and Douglas College in Coquitlam. It will add two new SkyTrain stations in Port Moody and four in Coquitlam. To support multi-modal access to the new line and to improve A-67
71 cycling connectivity in general, TransLink and the municipal partners have identified the alignment of a parallel multi-use path and on street bike facilities: both opening day and future ( ultimate ) path alignments have been identified. This project would complete the opening day Evergreen Line bikeway and make progress towards completing a portion of the ultimate alignments. CANADA LINE BIKEWAY This project would support increased traffic-protection to the bikeways paralleling the Canada Line. SOUTH OF FRASER BIKEWAYS (PARALLELING FUTURE RAPID TRANSIT) This project would support traffic-protected bikeways alongside future rapid transit on 104 Ave, King George Boulevard, and Fraser Highway. BROADWAY CORRIDOR BIKEWAY (PARALLELING FUTURE RAPID TRANSIT) This project would support a traffic-protected bikeway alongside future rapid transit on the Broadway corridor. A-68

72 PROGRAM: INVESTMENTS IN SECURE BICYCLE PARKING PROGRAM DESCRIPTION This program would fully fund investments to increase the bicycle parking supply at TransLink facilities region-wide, with a particular emphasis on installing secure, long-term bicycle parking. Secure long-term bicycle parking would take the form of shared parking areas accessible only to registered keycard holders, similar to the facility currently under construction at Main Street-Science World SkyTrain Station. PROGRAM OBJECTIVES Investing in secure bike parking at transit facilities would encourage passengers to access transit by bike. TransLink s research shows that the risk of theft is a deterrent to cycling in Metro Vancouver, and this is particularly pronounced when users leave their bikes unattended for many hours in the day, such as commuters leaving their bikes at transit facilities. Providing secure bicycle parking would make best use of transit infrastructure by ensuring convenient and safe access to transit facilities. PROGRAM SCOPE This program would build upon TransLink s existing Regional Secure Bicycle Parking Plan to install secure bike parking at rapid transit stations and major bus exchanges. Secure bike parking will be integrated into the Expo Line station upgrades at Main Street-Science World, Joyce-Collingwood, Metrotown, and Commercial-Broadway Stations, and will be installed as standalone structures at King George Station, Carvolth Park Ride lot, and other locations to be determined. These secure bike parking facilities will replace the bike lockers in some areas, and complement them in others. This program would provide funding to assure that secure bike parking is available at a variety of rapid transit stations and exchanges throughout the region. COSTS AND EVALUATION RESULTS See section cover page. A-69

73 PROJECT: WALKING ACCESS TO TRANSIT PROJECT DESCRIPTION In partnership with municipalities, TransLink will pursue a program of pedestrian infrastructure and amenity improvements focusing on the areas within walking distance to transit stops and stations. PROJECT OBJECTIVES The objective of this program is to create high pedestrian amenity areas with supporting land use that promotes walkability and maximizes transit ridership. The program will help to realize the full potential of transit investments by ensuring that a poor walking environment is not a barrier to transit use, as it currently is across much of the transit network where a lack of sidewalks and safe crossings rule out transit as a viable option for many people. TransLink will work with municipalities to define the area programs and identify infrastructure priorities and station area plans as warranted by adjacent development, planned station retrofits and municipal/community support. PROJECT SCOPE This program includes cost-sharing for: Minor improvements (under $500,000) to pedestrian access and amenity in the immediate vicinity of transit stops and stations (e.g. new or widened sidewalks and crossings); and Major improvements (over $500,000) including cost-sharing for more comprehensive land use, station area and corridor plans required to confirm more significant improvements to walkability in the neighbourhoods around transit stops and stations, especially frequent transit. TransLink will work with municipalities to identify where plans and investment are needed as warranted by adjacent development, planned transit investments and facility upgrades and community support. The program will support improvements to the following areas, prioritizing highest transit ridership (or potential future ridership) locations within each category: Within 800m of a rapid transit station or West Coast Express station Within 400m of existing or potential future bus stops, especially on the FTN Within 400m of MRN corridors Within Regional Growth Strategy designated Urban Centres and FTDAs COSTS AND EVALUATION RESULTS See section cover page. A-70
74 REGIONAL TRANSPORTATION INVESTMENTS A VISION FOR METRO VANCOUVER APPENDIX B APPENDIX B Actions to Manage 41
75 INTRODUCTION In addition to investing in the transportation system, we can make great progress towards regional goals by managing the system to be more efficient and user-focused. We can make the multi-modal transportation system work better through technology, like signal priority for transit vehicles, and changes to the way we use infrastructure, such as designating bus-only lanes or queue jumper lanes. We can also make the system work better through mobility pricing, transit customer amenity improvements, rewards and incentives to encourage travel that makes efficient use of the network, trip-making information covering all modes, marketing, support programs, and regulations all aimed at making travel easier for the user and more efficient for the system as a whole. These efficiency gains are achieved by gently nudging users who have some flexibility to spread their travel to less busy times, routes and modes resulting in better use of existing capacity and resources. By encouraging travelers to shift travel times, routes, modes, and behaviours, the actual demand for transportation service and infrastructure especially during the busiest peak periods becomes much clearer, and TransLink may be able to defer the need for some kinds of new investments. The funds saved on projects that can be deferred can be used to pay for other investments elsewhere in the transportation system or reduce costs to the user. To optimize the impact of these management initiatives, they need to be combined with a competitive range of travel options so that each user has real choices available to them in terms of mode, route, and time. This section describes the system management projects and policies that are priorities for near-term implementation in the 10-Year Plan: mobility pricing development, a mobility management program that can integrate payment, information and incentives, implementation of transit priority on key transit corridors, and a goods movement management program.

76 Appendix B: Actions to Manage PROJECT: INTEGRATED MOBILITY PRICING DEVELOPMENT (INCLUDING FIELD STUDY) PROJECT DESCRIPTION The Vision identifies integrated mobility pricing as a key action to implement before the end of the 10-year period. Pricing is a powerful tool to more efficiently manage the transportation system by influencing the choices people make: how they travel; how far they travel; the route and the time. A more consistent approach to pricing across the entire transportation system, including transit and roads, is also fairer as people pay more directly for what they actually use. Even if such a pricing regime was revenue neutral and raised no additional funds, these efficiency and fairness gains are the most important reasons to price transportation. There are opportunities to use the funds raised from pricing to reduce existing fees and taxes (such as the fuel sales tax) and also to return to investments in maintaining and expanding the transportation system. A basic level of mobility pricing is already in place in Metro Vancouver in the form of transit fares and parking fees. Aside from some limited facility-specific bridge tolls, though, mobility pricing on the road system is not well developed in this region. Fuel tax acts as a form of mobility pricing but has a number of challenges. While it may influence the amount of travel, it has no influence on time or location of travel, and as a revenue source it is challenged by increases in vehicle efficiency. An effective mobility pricing approach on the transit and road systems will improve fairness and efficiency, while also raising new revenues to help fund the existing transportation system and the investments outlined in the Vision. We still need to do a lot of work to figure out exactly what mobility pricing would look like on the ground in Metro Vancouver. On both the road and transit networks, a more effective approach to pricing could include a distance-based charge that varies based on time of day or level of congestion or crowding. In order to progress a mobility pricing strategy, it is important to bring together a range of key stakeholders to look at pricing strategies for both transit and roads, including implementation approaches, potential impacts on people and businesses, and ways to mitigate any negative impacts. A Mobility Pricing Field Study will be commissioned in order to bring together the required technical and communications work. PROJECT OBJECTIVES The objectives of the Mobility Pricing Field Study could include: Determine existing attitudes and acceptability towards transport user charges, and explore the factors that drive the level of acceptance; Test behavioral responses to different mobility pricing signals on roads and transit; Explore the policy and technical implementation feasibility of applying user charges to different parts of the transportation system; and B-2
77 Appendix B: Actions to Manage Raise public and stakeholder awareness of applying mobility pricing concepts to the transportation system. PROJECT SCOPE A consistent and principled approach to pricing roads and transit is desirable. The Mobility Pricing Field Study will include a review of the current transit fare structure and leverage Compass Card data to understand how the transit system could be better priced for fairness, system efficiency and revenue. Given that issues around pricing the road system are much less understood, the bulk of the project resources will go into testing and evaluating different road pricing approaches. While TransLink has undertaken preliminary scoping of the Mobility Pricing Field Study based on lessons from pilots and research in other jurisdictions, the exact scope of the Study will only be clear once the project team, including partners and stakeholders, has been established. Key tasks to be undertaken in the Mobility Pricing Field Study could include: Planning and undertaking market research and stated preference surveys to inform the study itself; Designing a field study and procuring the necessary services and technology; Identifying and recruiting study participants; Pre test monitoring and surveying; Monitoring travel behaviour under certain pricing structures; and Post test survey and reporting. In parallel to the above tasks would be: review of policy, legislative, and technical implications and requirements; and communications strategy which aims to raise awareness and further explore issues related to mobility pricing with the general public. COSTS Costs are to be determined and will be dependent on the scope of the study and the role of partners. B-3

78 Appendix B: Actions to Manage PROJECT: MOBILITY MANAGEMENT: INTEGRATED PAYMENT, INFORMATION & INCENTIVES PROJECT DESCRIPTION Urban mobility needs are evolving and new services such as carsharing and new technology such as smartphone trip planning apps and smartcards - are emerging to fill these needs This mobility management program offers a new, more integrated, more customer-focused approach to delivering and managing the transportation system. Mobility management harnesses technological advancements and partnerships with other public and private sector transport providers (like taxis and car-sharing) in order to create new and innovative user-focused products and services to travelers in Metro Vancouver. This program will focus on building and maintaining the infrastructure such as one-stop-shop integrated payment and customer information systems - that allow for a more seamlessly integrated transportation system across all jurisdictions and agencies and modes. The program will also focus on leveraging these integrated systems to develop targeted incentives programs for different types of customers. This program is in line with recent recognition by the Canadian Urban Transit Association (CUTA) that integrated mobility is the key goal to guide Canadian transportation agencies As a region, we stand to benefit most from this type of program if it is coordinated although not necessarily delivered - by the public sector. As the regional transportation authority, TransLink is the best candidate for this task. If we, as a region, don t step up, these needs will inevitably be filled by a hodge-podge of private sector providers making it more confusing for customers and less likely to achieve regional objectives. Travel Planning & Incentives Program Personal travel planning is a technique that delivers information, incentives, rewards, and motivation directly to individuals to help them voluntarily make travel choices that are both better for them and for the system as a whole. This technique helps users make connections between their travel needs and available transportation options, ensuring the regional transportation system is used to its full potential, opening up new possibilities for TransLink to build relationships with customers and partners, and potentially to realize new revenue streams. This particular project would deliver information and incentives through a variety of channels including in-person consultation (at the household, neighbourhood, school or workplace level) and targeted social marketing as per the existing TravelSmart program but with a substantially enhanced reach. The project would also include specific transit advertising to market new and existing services to people and businesses that may not be aware of the options available to them. The investment will build on the current offerings of the TravelSmart program. Integrated Information & Payment Systems New transport business models are emerging from companies such as Google, Daimler, and Nokia that could affect the revenue potential and impact TransLink s ability to achieve policy objectives. It is therefore critical that TransLink defines a role in how it enables and manages mobility options. This project would use advances in B-4
79 Appendix B: Actions to Manage technology to provide real-time, dynamic, and targeted travel information across all modes targeted to each individual user based on their needs and their travel patterns including interactive smart-phone apps, integrated real-time customer information, and programs and services to accompany and enhance Compass Card functionality and experience. The project will also work towards a single integrated payment platform based on Compass Card across all modes of transportation including services not delivered by TransLink such as carsharing, bicycle-sharing, taxis, ferries, neighbouring transit services, auto and bicycle parking, and road user charges. Funding for both projects will support: A significantly expanded customer information system Development of an integrated payment system for elements of the mobility pricing system A significantly expanded TravelSmart program including personalized travel consulting at schools, workplaces, and neighbourhoods New functional group within TransLink drawn from different disciplines (planning, marketing, IT, business development, etc) to develop new programs, products, and services Core technology investments required to enable the development and delivery of above products and services: o Content Management Systems (with Membership Accounts Services, Third-Party Content Management and Internal Content Management); o Customer Relationship Management (CMS) Systems; and Additional functionality for the Compass Card System including integrating payment systems across multiple agencies and businesses PROJECT OBJECTIVES Leveraging the significant investments in Compass Card, advances in mobile computing and communications technology, and the existing TravelSmart program and brand, the two projects will substantially enhance TransLink s ability to manage the transportation system at a much finer grained level while simultaneously increasing the quality of the customer experience. The two projects will help the region to: Optimize the benefit from existing and future transportation investments by encouraging users to select a mode for their trip that works best for both them and the transportation network spreading demand to less busy and less costly times, routes, and modes where possible. Improve the customer experience by developing products or services that directly respond to the unique needs of different market segments. PROJECT SCOPE Travel Planning & Incentives Program This project will broaden and enhance the existing TravelSmart program to: Personalize transportation information and marketing. o Develop nuanced understanding of different travel markets, what they value, and the most effective incentives and disincentives for them based on data collection. B-5
80 Appendix B: Actions to Manage o o Grow the reach and influence of the existing TravelSmart program including expanded school programs; outreach to businesses; municipal partnerships; and online trip planning. Develop technology-based products and tools tailored to different market segments aimed at improving the customer experience and nudging behaviour to support system efficiency. Speculative examples of these tailored products could include: i. See More a smartphone application and Compass Card add-on to encourage convention attendees and other business visitors to participate in more recreational tourism activities and boost transit use (particularly during off-peak periods) through personalized incentives and rewards. ii. Cycle Track an initiative that provides individuals with positive reinforcement and encouragement for cycling. Users would be given RFID tags (linked to their Compass account) that can be attached to their bicycles allowing personalized, real-time information to be sent to the user such as distance travelled, modal integration information such as real-time transit departures and cycle locker availability from nearby stops and stations. iii. Map Your Move a web-based calculator tool for people moving house into or within Metro Vancouver. Building on existing products such as Transit Score and Walk Score, this presents a wide range of information and data including commute times and cost to prospective house buyers. Map Your Move would focus on the integration of lifestyle needs and mobility choices by allowing users to explore their travel options and helping them to plan their transport needs in relation to the locations of their daily activities. Integrated Information & Payment Systems This project will use technology, personalized service, and the development of new partnerships to: Provide consolidated transportation information, payment and partnerships. o Information: Integrate all customer travel information in the region, irrespective of mode or operating agency, into a single portal delivered across multiple channels: online, mobile phone, telephone. o Payment: Work towards using Compass Card to integrate all transportation payment processes across all modes of transportation - including services not delivered by TransLink such as carsharing, bicycle-sharing, taxis, ferries, neighboring transit services, auto and bicycle parking, road tolls etc. o Partnerships: work with existing and new partners to deliver cutting edge programs and platforms to help travelers make smarter choices, ideally incorporating all transportation options, including taxis, ferries, YVR, coaches, van pools and car sharing. COSTS The combined costs for the two projects are as follows: 10-Year Capital Cost (2015$) Year 10 Operating Cost (2015$) $28.6 million $8.7 million These are up-front costs to deliver approximately five information-based products or services, in addition to the extension of the existing TravelSmart program. These services will have the potential to generate revenue (e.g. via co-branded offers, advertising and subscription fees) which is not considered above. These programs will also B-6
81 Appendix B: Actions to Manage support increased ridership and fare revenue. These incremental revenues are not calculated into the costs of the program but are instead assumed in the business casing and financials of the investment plan assume increases in these types of management programs. Without these kinds of expanded efforts, ridership revenue is unlikely to meet forecasts. OUTCOMES AND EVALUATION RESULTS Performance Criteria Access Non-Auto Access Mode Share (Additional jobs accessible by the average person in the region) (Additional jobs accessible by walk, cycle and transit by the average person in the region) (One onehundredths of a percent (1/100 s %)) Daily Vehicle Kilometers Travelled Change from 2030 Base Case 6,728 3, ,019,548 Cost-Effectiveness Score (1-100) Observations: While investment is a necessary condition, it is not sufficient on its own to make substantial progress on mode-share and VKT reduction targets. Meaningful progress requires implementing demand management measures (especially mobility pricing). The demand-management initiative described here (personalized travel planning and incentives) has been shown to achieve reductions in daily Vehicle-Kilometers Travelled (VKT) that are 1-2 orders of magnitude greater than almost every other project put forward in this plan, for relatively little cost. For example, the TravelSmart Urban Transportation Showcase pilot conducted in this region resulted in an average 8% decrease in VKT in the pilot neighbourhoods; this initiative was by far the most cost-effective and hence established the upper end of the cost-effectiveness index for all metrics. B-7

82 Appendix B: Actions to Manage PROJECT: GOODS MOVEMENT MANAGEMENT PROGRAM PROJECT DESCRIPTION Regional economic prosperity depends on the efficient movement of goods within the region an objective which TransLink has a clear mandate to support. However, to date the region has lacked a cohesive goods movement strategy largely because of the complexities and shared responsibilities of freight-related planning and governance. TransLink is currently working with partners and stakeholders to develop and adopt that long-overdue strategy. It should be noted that this region also plays an important role in national and international goods movement as a trans-shipment gateway between Canada and Asia-Pacific where goods are loaded and unloaded between ships, planes, trains and trucks. This trans-shipment of goods between the Port and intermodal facilities, accounting for approximately 36% of heavy truck movements in the region, is the responsibility of the Provincial and Federal governments and should occur primarily on Provincial highways to minimize negative impacts on local communities. TransLink and local governments will continue to coordinate under senior government leadership on these issues. Even within the domain of local serving goods movement, TransLink has limited authority and so, to make progress, increased collaboration with partners is required. To support goods movement this Vision includes a range of investments and actions described elsewhere in this document, including: investments in connectivity and safety improvements for trucks, including addressing rail crossings, Major Road Network (MRN) connections, replacing the Pattullo Bridge, identifying a solution for improving goods movement on the north shore of the Fraser River and introducing Intelligent Transportation System technology to better manage road traffic (described in Roads Investment section); actions designed to free up space on the region s roadways for higher value commercial trips such as investments in walking, cycling and transit (described in Investment section) and introducing comprehensive region-wide mobility pricing (described in Manage section); and In addition to the actions identified in the above program areas described elsewhere in this document, TransLink also has a role to play as a convener and coordinator of regional goods movement planning. The project described here captures the latter role an ongoing program of Goods Movement Management focused on building partnerships to streamline and harmonize policy and regulations, data collection and analysis, and planning. B-8
83 Appendix B: Actions to Manage PROJECT OBJECTIVES This program will help the region to: Coordinate projects and actions that help facilitate the efficient movement of region-serving goods in support of regional transportation and economic development objectives; Improve service to the goods movement community by providing more and better information to increase safety, reliability, operations and travel decisions; Increase awareness of goods movement benefits, needs and challenges in local communities; and Encourage collaboration and integration between land use and transportation planning for more efficient goods movement. PROJECT SCOPE In addition to the other goods movement supportive investment and management actions already described in other project sheets, this program commits to: Streamlining and harmonizing freight-related regulations and policies across the region including truck route designation, truck permitting and enforcement, truck size/weight/noise regulations, and the collection and analysis of goods movement data; Managing and utilizing the existing infrastructure and systems that serve the movement of goods, including transportation demand management (TDM), Intelligent Transportation System (ITS), and other operations management initiatives (e.g. encouraging flexible and extended freight delivery times); Pursuing and facilitating a data-driven and outcome-based approach to goods movement planning, decision making and project/investment evaluation (e.g. the continued participation in the Applied Freight Research Initiative (AFRI) Program along with the partner agencies, Transport Canada and MoTI). Convene a regional forum or task force to bring together representation from the goods movement sector, municipalities, and the region to discuss, coordinate and collaborate on issues of joint concern. The Program includes: A significantly expanded freight data collection and analytics system Convening and managing a Regional Goods Movement Forum Planning resources to manage the program B-9

84 Appendix B: Actions to Manage PROGRAM: INVESTMENT IN TRANSIT PRIORITY ON TRANSIT CORRIDORS PROGRAM DESCRIPTION This program would introduce funding to support transit-supportive signalization, dedicated transit lanes, queue jumpers and other measures to give traffic priority to transit vehicles on transit corridors. In some cases transit corridors may be improved to Bus Rapid Transit (BRT) levels through the introduction of a fully separated right of way along all or a portion of the route. These measures would reduce transit vehicle delays and increase operating speed. PROGRAM OBJECTIVES This program would improve the efficiency, speed and reliability of transit services, which would increase their attractiveness and grow the transit mode share. This program could also benefit other road users by shifting more trips to transit, getting buses out of mixed traffic, and reducing roadway conflicts PROGRAM SCOPE Funding would be provided to implement transit priority investments along existing or planned B-Line and other transit corridors, in partnership with municipalities. Funds may also be allocated to transit priority interventions on Frequent Transit Network (FTN) and Major Road Network (MRN) corridors in the interest of improving reliability and reducing emissions on these heavily used bus and goods movement corridors. Corridors and specific transit priority interventions would be identified for funding based on expected operational improvements to reliability and speed of service. TransLink estimates that the proposed program budget would support transit priority improvements on 1-2 transit corridors per year. The full extent (Tier 2) of the program would introduce approximately 60 km of separated bus lanes and over 220 km of other transit priority measures. Program element New separated bus lanes introduced by 2024 New transit priority measures introduced by 2024 Level of Investment Approximately 40 lane km Approximately 155 lane km COSTS 10-Year Capital Cost (2015$) Year 10 Operating Cost (2015$) Investments in Transit Priority $193M $ - B-10
85 Appendix B: Actions to Manage OUTCOMES AND EVALUATION RESULTS Performance Criteria Access Non-Auto Access Mode Share (Additional jobs accessible by the average person in the region) (Additional jobs accessible by walk, cycle and transit by the average person in the region) (One onehundredths of a percent (1/100 s %)) Daily Vehicle Kilometers Travelled Change from 2030 Base Case 561 2, ,408 Cost-Effectiveness Score (1-100) B-11
86 REGIONAL TRANSPORTATION INVESTMENTS A VISION FOR METRO VANCOUVER APPENDIX C APPENDIX C Outcomes 42
87 Appendix C: Outcomes DETAILED PLAN OUTCOMES CONTEXT As the regional authority for transportation planning and service delivery, TransLink is required to prepare a Regional Transportation Strategy (RTS) that outlines the region s 30-Year Vision for transportation in support of the Regional Growth Strategy and Provincial and regional economic and environmental objectives. The Metro Vancouver Board of Directors and the Mayors Council received the most recent Regional Transportation Strategy in The Regional Transportation Strategy 30-Year Vision includes 5 goals: 1. Provide sustainable transportation choices 2. Support a compact urban area 3. Foster safe, healthy and complete communities 4. Enable a sustainable economy; and 5. Protect the environment As a region, we can best achieve these goals by designing our communities and transportation system in a way that increases access to jobs while making it possible to reduce driving distances (Vehicle Kilometers Travelled or VKT) and make more trips by walking, cycling, and transit. To this end, our first headline target is to make it possible for people to make 50% of all trips by walking, cycling, and transit. Our second headline target is to make it possible to reduce the distances that people drive by 33% from 2011 levels. In order to work towards these targets, each of the projects considered in this process was assessed against its ability to perform in terms of reducing VKT and increasing walking, cycling, and transit mode share. We also considered a third metric - concerned with improving access to jobs and markets to ensure that we achieve our headline targets in a way that supports a competitive and sustainable economy. Taken together, these three metrics do a good job of capturing the region s transportation goals and aspirations: Improve Access: Ensuring good access to jobs and markets for both people and goods is a critical requirement for a sustainable economy. Reduce Vehicle-Kilometres Travelled: If we can achieve this improved access while still reducing driving distances we can reduce congestion, making travel time more predictable and reducing traffic collisions (saving money and lives). We also reduce fossil fuel use, air pollution, and greenhouse gas emissions. Increase Walking, Cycling, and Transit Mode Share: Increasing the share of trips that people make by walking, cycling, and transit, in addition to reducing congestion, collisions, and emissions, also increases physical activity, improves public health, and improves what planners call placemaking the creation of great livable spaces with thriving local businesses and lower crime rates. The complete package was also assessed against a more complete set of outcome indicators, as shown in the table below. These outcome indicators include: the need to own a car, roadway congestion, transit overcrowding, travel time reliability for people and goods, access to jobs and services for people without a car, public health and safety including air pollution, traffic collisions and physical activity, greenhouse gas emissions and land consumption. C-1
88 Appendix C: Outcomes METHODOLOGY In order to estimate the benefits of the 10 Year Vision, we estimated conditions in 2030 under two scenarios: the Vision scenario, where the investments and policies outlined in this document are in place, and the No Action scenario, where transportation pricing structures remain as they are today, no new transportation funding sources are implemented, and minimal investment in transportation is possible. In order to get a clear sense of the impacts that result from this Vision, as distinct from the changes that would have happened even if we had done nothing, we looked at the difference between the 2030 No Action and 2030 Vision scenarios. We know that some of the investments and actions in this Vision will only come online in Years and so their impacts won t be fully realized by We also expect that after the first 10 years of this Vision is implemented, continued investment will occur, including completing rapid transit to UBC and continued growth in bus service, that road tolls will increase and that the region will continue to grow and densify according to the Regional Growth Strategy. In order to understand whether the Vision investments and actions set us on a trajectory to achieve our 2045 mode share and VKT goals, we also estimated conditions in 2045, assuming that this 10 Year Vision is implemented and that these additional investments are made in the subsequent decades. The following table describes the performance indicators estimated for each scenario, and the goals to which they relate. C-2
89 Appendix C: Outcomes Targets Outcome Criteria Goal Objective Metric Calculation and Rationale Provide Calculated as per Access to Jobs, below i. Reflects the ability of Metro Vancouver Improve regional accessibility Access Sustainable residents to travel to their desired destinations. Transportation Total vehicles estimated to be owned by residents of Metro Vancouver. Reflects Choices Reduce the need to own a car Auto Ownership the availability and attractiveness of non-auto options, and is an important driver of both VKT and bike/walk/transit mode share. Total vehicle-kilometres generated by personal travel in the region (i.e. excluding Reduce distance travelled VKT per capita goods movement), divided by the number of residents. VKT reduction helps achieve progress in many of the Economy, People and Environment outcomes below. Economy People Increase walking, cycling, and transit use Support RGS growth targets Improve access to jobs Ensure efficient goods movement Ensure efficient movement of people Ensure reliable goods movement Ensure reliable movement of people Increase resilience to fossil fuel shortages and price shocks Improve access to communities Mode Share (Walk + Bike + Transit) Percent of new dwellings in Urban Centres Percent of new jobs in Urban Centres Access to Jobs Congestion (goods) Congestion (passenger) Overcrowding on Transit Reliability (goods) Reliability (passenger) Fossil Fuel Consumption per Capita Access to Community The proportion of travel made by cycling, walking, or transit. More people using these modes helps achieve progress in many of the Economy, People and Environment outcomes below. The proportion of new dwellings/jobs located in designated Urban Centres. Denser development results in both shorter trips and higher rates of cycling, walking and transit use. The average accessibility across the region, where accessibility is calculated as the sum of all jobs in the region, weighted by the travel time to get to each job. Jobs that take longer to get to count less towards the score than jobs within easy reach ii. Higher accessibility means greater ability for employees and employers to find suitable jobs/labour. The proportion of peak-hour truck/passenger VKT that occurs on congested corridors ( congested is defined as having a volume-over-capacity ratio of 0.8 or greater, above which travel speeds are severely impacted). Congestion results in wasted time, resources and money for travelers and businesses. The proportion of transit boardings during the peak-hour that occur on overcrowded vehicles. Overcrowded here refers to vehicles with passenger volumes in excess TransLink s Transit Service Guidelines. Traveling on overcrowded vehicles is unpleasant for customers and discourages transit use. The proportion of peak-hour truck/passenger VKT that occurs on unreliable corridors ( unreliable is defined as having a volume-over-capacity ratio of 1.2 or greater, above which travel speeds are severely impacted and travel times are difficult to estimate reliably). Unreliability results in wasted time, resources and money for travelers and businesses, because travelers will budget more time for trips than necessary. Total estimated fuel consumed by vehicle travel in Metro Vancouver. Less reliance on fossil fuels means that the region s economy is less vulnerable to fluctuations in oil prices. Calculated as per Access to Jobs, above, but using a subset of jobs that represent shopping, education, and other services ii. Better access to these opportunities means greater ability for individuals to engage with their communities. C-3
90 Appendix C: Outcomes Environment Improve non-auto access to jobs Ensure transport safety Non-auto access to jobs Value of collisions per-capita Ensure transport security Crime Not measured Reduce contribution to respiratory illness Improve cardiovascular health Reduce contribution to climate change Support a compact urban form within the Urban Containment Boundary Minimize encroachment on designated conservation, recreation, agricultural, and rural lands. CAC Emissions Walk and Bike Mode Share GHG Emissions Green-space conversion index Remaining capacity for singledetached homes within UCB Calculated as per Access to Jobs, above, but excluding the auto mode ii. Better Non- Auto Access to Jobs means greater ability for residents without access to a car to get to jobs. The estimated dollar-value of the monetary and non-monetary costs of collisions, divided by the total population. Fewer injuries and lives lost, and fewer dollars spent repairing or replacing damaged property is good for everyone. Estimated tonnes of criteria air contaminants emitted by vehicles. Reduced exposure to CACs results in lower rates of respiratory disease and associated health care costs. Estimated proportion of trips that are made by walking or cycling. Higher rates of active transportation results in improved cardiovascular health and reduced health care costs. Estimated tonnes of greenhouse gas emissions by vehicles. Fewer GHGs means lesser contribution to global climate change. An index representing the conversion of greenspace to developed land (more negative numbers represent higher rates of conversion). Less consumption of greenspace means more land retained as habitat and to support natural ecosystem processes. The estimated capacity (in number of dwelling units) remaining with the Urban Containment Boundary for the development of single-detached homes. Conservation of this capacity means less likelihood of dispersed development beyond the UCB. Various approaches were used to estimate these outcomes. One of the key analysis tools is the regional transportation model. This model projects future transportation conditions in the region based on inputs describing the distribution of homes and jobs throughout the region, the roads and transit services available, and the time and dollar costs of using each mode. The model projects the amount of travel that would occur by auto, transit, walking and cycling, and the location of this travel (i.e. from where to where, along which corridor). A variety of other models and tools iii were used to both generate and validate our estimates. Ultimately, it is important to emphasize that these models are simply tools to help us assess the relative impacts of different options. While our models are quite sophisticated they are still ultimately just depictions of reality our best guesses of what we think might happen. We can never accurately predict the future there are just too many external variables that we can t possibly predict in advance. C-4


91 Appendix C: Outcomes RESULTS SUMMARY FIGURE 1 Steady Progress Towards Reducing per Capita Vehicle Kilometres Traveled (VKT) By 2045, we estimate that the actions in this Vision and continued investment beyond 2030 could reduce the distances that people drive by about a quarter substantially advancing us towards our target of a one-third reduction. This progress comes partly through the investment in alternatives to driving, but most of that progress is from demand management initiatives in particular mobility pricing on the road network. Clearly, to make further progress on this target, pricing will need to play a pivotal role. We should note that, although the amount driven per person is going down, we re still adding more than a million people to the region over the next 30 years. As a result, the total amount of driving will still increase somewhat but not by nearly as much as it would have if we had taken no action. FIGURE 2 Steady Progress Towards our Walk, Bike and Transit Mode Share Target C-5
92 Appendix C: Outcomes By 2045, we estimate that the actions in this Vision and continued investment beyond 2030 will bring the walking, cycling and transit mode share from 25% to over 35% - representing more than 1 million new trips by these modes and about half of the way to our target of 50%. iv With fewer cars, less driving, and more walking, cycling and transit this Vision will generate a host of other benefits. With more affordable travel choices, we ll save money and time. By 2030 these savings will amount to about $500 per average household per year in out-of-pocket expenses and time savings v. Some households will save much more than this. For example, those that are able to get rid of that second car because of much improved transportation choices will be able to save upwards of $10,000 per year. vi With 10% less congestion on the roads and coming close to eliminating the problem of leaving people behind on the curb by buses that are too full to pick up any more passengers we ll all have faster and more reliable trips. These transportation improvements provide strong support for the economy, as people gain new access to tens of thousands of jobs and businesses gain new access to tens of thousands of new workers. We ll make progress on Provincial and regional climate protection targets keeping transportation emissions at today s levels even as we grow by more than a million people. We ll also see major health improvements we estimate about 200 lives saved every year due to the health benefits of more walking and cycling and fewer traffic fatalities as a result of less driving. These substantial public health, safety and wellness benefits are not only good for people but will also save the health care system millions of dollars every year. Thus, this plan constitutes a significant advance toward our collectively held regional goals, resulting in positive outcomes that we can continue to build upon later by completing projects we cannot afford in the first 10 years and, critically, by continuing to manage and price the system for efficiency and fairness, and working closely with our partners to support the creation of compact, transit-oriented communities that support efficient and sustainable travel choices. RESULTS DETAILED The following table and charts describe performance of the Vision in 2030 and 2045 against each of the targets and outcome criteria. Performance of the No Action scenario is also presented, along with target values and hypothetical maxima. Targets exist for two of the transportation metrics (VKT and mode share). The hypothetical maximum for a given criteria represents the performance expected to be achieved if regional investment and policy decisions were made solely to maximize performance on that specific criteria, without regard for cost or other impacts. It is not expected that performance would approach the hypothetical maximum for any of the criteria. In fact, achieving such a condition would be suboptimal, since performance on other criteria, including cost, may be compromised. The charts on Page C-8 visually illustrate the data presented in table form on Page C-8. In each graph, higher position on the y axis indicates better performance. The green line represents either the target or the hypothetical maximum (the best we could hope to achieve if we put all available resources and actions into maximizing just that one performance indicator) and the red line represents what would likely happen if we took No Action. The blue line shows where we think this Vision will likely get us. In all cases, we see a marked improvement over the No Action scenario. C-6
93 Appendix C: Outcomes Targets Outcome Criteria Goal Objective Metric No Action Vision Target / Hypothetical Maximum vii No Action Vision Target / Hypothetical Maximum Provide Improve regional accessibility Access 628, , , , ,757 Sustainable Transportation Reduce the need to own a car Auto Ownership 1,254,000 1,535,596 1,512,025 1,713,000 1,675,289 Choices Reduce distance travelled VKT per capita 6,376 5,957 5,422 4,251 5,746 4,871 4,251 Increase walking, cycling, and Mode Share (Walk + Bike transit use + Transit) 25.1% 25.6% 31.3% 50.0% 26.9% 35.5% 50.0% Percent of dwellings in Support RGS growth targets Urban Centres Implementing the Vision contributes to focusing growth in Urban Centres as Percent of jobs in Urban designated by the Regional Growth Strategy viii. Centres Economy Improve access to jobs Access to Jobs 628, , , , , , ,619 Ensure efficient goods movement Congestion (goods) 33.8% 39.0% 35.1% 26.8% 41.9% 35.3% 28.8% Ensure efficient movement of Congestion (passenger) 28.6% 32.8% 28.6% 16.3% 36.1% 28.4% 17.9% people Overcrowding on Transit 48.0% 56.4% 48.2% 2.5% 61.7% 42.3% 2.7% Ensure reliable goods movement Reliability (goods) 6.2% 12.4% 8.6% 3.3% 13.6% 8.4% 3.6% Ensure reliable movement of people Reliability (passenger) 4.1% 7.8% 4.8% 0.9% 8.7% 4.4% 1.0% Increase resilience to fossil fuel Fossil Fuel Consumption shortages and price shocks (litres) per Capita People Improve access to communities Access to Community 242, , , , , , ,600 Improve non-auto access to jobs Non-auto access to jobs 271, , , , , , ,433 Ensure transport safety Collisions $1,132 $1,137 $1,071 $888 $1,060 $899 $828 Ensure transport security Crime Reduce contribution to respiratory illness CAC Emissions 151,979 90,778 82,633 67,881 56,121 47,417 41,965 Improve cardiovascular health Walk and Bike Mode Share 11.80% 12.64% 17.26% 24.31% 13.52% 21.03% 25.99% Environment Reduce contribution to climate change GHG Emissions 4,399,258 5,100,979 4,736,449 4,127,744 5,053,194 4,468,486 4,089,076 Support a compact urban form Green-space conversion within the Urban Containment index Boundary 0-281, , , , , ,134 Minimize encroachment on desingnated conservation, recreation, agricultural, and rural lands. Remaining capacity for single-detached homes within UCB 75,000 35,667 46,844 49,853 4,615 24,615 30,000 C-7
 + In all charts, higher position on the y axis indicates better performance.")
94 Appendix C: Outcomes Figure 3 LEGEND Performance Outcomes of Investment Scenarios Target Do Everything Possible (best case) 10-Year Vision No Action 10-Year Vision No Action (worst case) + In all charts, higher position on the y axis indicates better performance. C-8
95 Appendix C: Outcomes PROJECT-CATEGORY PERFORMANCE We assessed each project in the Vision for how well it reduces VKT and improves walk/bike/transit mode share. By estimating these impacts for each project, and dividing by project costs, cost-effectiveness for VKT and mode-share of each project was calculated. The following chart summarizes these results by project-category. TDM and Walking & Cycling investments far outperform other investments; they are relatively inexpensive, and have a large impact per dollar. Roads projects have a negative score, meaning that they are likely to increase VKT and decrease walking, cycling and transit. While these two metrics represent our headline targets, they don t capture everything. For example, we fundamentally need a well-connected road network to move people and goods. We need to invest in transit to alleviate over-crowding and improve reliability. Walking, cycling and transit investments also have health and place-making benefits. As a result, this chart represents a partial snapshot that captures many of the things we care about, but not everything. Bubble size is proportional to cost C-9
96 Appendix C: Outcomes NOTES i This metric is intended to represent the ability of Metro Vancouver residents to travel to destinations throughout the region. Ideally, this metric would account for access to all types of destinations, including shopping, recreation, employment, and social opportunities. This is a relatively new metric, and such a comprehensive measure is not currently available. Instead, Access to Jobs is used as a proxy measure. It is expected that this measure correlates well to true Regional Accessibility. ii In the evaluation of the No Action and Vision scenarios, all access measures (Access to Jobs, Access to Communities and Non-Auto Access to Jobs) was calculated using the best mode available (i.e. that which provides the best accessibility) from a given origin. In almost all cases, this mode was auto. This approach varies from the project-specific evaluations, where Access to Jobs and Access to Communities were estimated using a modeshare weighted average accessibility. Effectively, the approach used for scenarios estimates potential accessibility whereas the approach used for projects estimates realized accessibility. iii Certain adjustments to model outputs were necessary in order to improve estimates of cycling and walking mode share, and to account for capacity constraints on the transit system. A variety of approaches were employed to estimate cycling and walking mode share. These included a review of comparable regions in North America and Europe, a review of studies related to traveler response to infrastructure investments, regression analysis relating cycling mode share to various neighbourhood characteristics, and analysis of regional trip diary data. Using this variety of approaches allowed for comparison and corroboration of results. The other necessary adjustment was to account for transit capacity constraints. This was done by comparing the number of passengers traveling by transit along various corridors with the frequency and size of transit vehicles on those same corridors. Where transit travel exceeded capacity, trips were manually reallocated to non-transit modes. Outputs from these projection methods, including VKT, mode share, and corridor-level travel volumes, were translated into the outcomes described in the above table. Some metrics are direct outputs of the calculations described above, such as VKT and mode share. Others are straightforward to estimate, such as GHG emissions and fossil fuel consumption. These depend on projections of the fuel efficiency of cars and trucks in the region. Other metrics require more complex calculations, such as the congestion, reliability and accessibility metrics. iv TransLink s regional transportation model estimates current walk/bike/transit mode share at 25%. This is slightly less than the 27% mode share estimated by TransLink s 2011 Trip Diary. The model is calibrated to Trip Diary results, so in theory these values should be very similar, however calibration is inherently imperfect. Here, model results rather than Trip Diary results are used to represent today s conditions in order to allow for a fair comparison to modeled future conditions. v Monetary savings are estimated at $186 per household, and time savings are estimated at $332 per household, using $14.31 as the value of one hour (adapted from BC Ministry of Transportation and Infrastructure: vi As estimated by the CAA Cost of Driving Report (2014). vii The hypothetical maximum for a given criteria represents the performance expected to be achieved if decisions were made solely to maximize performance on that specific criteria, without regard for cost or other impacts. It is not expected that performance would approach the hypothetical maximum for any of the criteria. In fact, achieving such a condition would be suboptimal, since performance on other criteria, including cost, may be compromised. viii The geographic scale of available data is too coarse to estimate specific proportions of growth that occur in designated centres. However, assessment of the transportation investments and policies indicate that under the Vision a greater proportion of growth will occur in designated centres than under the No Action scenario. C-10
97 REGIONAL TRANSPORTATION INVESTMENTS A VISION FOR METRO VANCOUVER APPENDIX D APPENDIX D Letter to Mayors Council from the Honourable Todd Stone, Minister of Transportation & Infrastructure February 6,
98
99
100
101
102 REGIONAL TRANSPORTATION INVESTMENTS A VISION FOR METRO VANCOUVER APPENDIX E APPENDIX E Detailed Financial Tables for Vision Plan Investments 44
103 EXPANSION: Incremental Capital ($millions) Unconstrained Partnership Funding Ten Year CAPEX Partnership Contribution* Net Capex MRN-Roads & Bikes TL Cycling & Walking B Line Vehicles 88 (79) 9 B Line Infrastructure 209 (125) 84 sub-total B Line 297 (205) 92 Bus-Vehicles 197 (170) 26 Bus Infrastructure & Facilities 242 (143) 99 sub-total Bus 439 (314) 125 Existing Rail-Vehicles 534 (342) 191 Existing Rail Infrastructure & Facilities 478 (224) 254 sub-total Existing Rail 1,012 (566) 446 Rapid Transit-Millennium to Arbutus 2,279 (1,757) 522 Rapid Transit - Surrey LRT 1,915 (1,104) 811 sub-total New Rail 4,194 (2,862) 1,333 Patullo Bridge Other Total Capex 7,472 (3,946) 3,526 * Partnership contribution includes contributions from Gas Tax, Build Canada Fund programs and municipal contributions. EXPANSION: Incremental Operating Impacts ($millions) Transit Revenue increase 497 Real Estate Program 9 Increase in cumulative funded surplus (143) Remove the Gain on Sale of Oakridge (150) Operating Expenditure Increase (1,583) Debt Service Increase (660) Shortfall (2,030) Toll on Patullo Bridge 81 Provincial Subsidy on Patullo 89 New Revenue Source Requirement (1,860) Numbers may not add due to rounding.
104 FUNDED STATEMENT OF OPERATIONS - EXPANSION SCBCTA $millions Transit Revenues $ Toll Revenues $ User Fees $ Motor Fuel Tax $ Property Tax $ Parking Rights Tax $ Other Taxes $ New Revenue $ Taxation Revenues $ , , , ,172.0 Real Estate Revenues $ Partnership Funding $ Interest Revenue $ Gain on Disposal $ Total Revenues $ 1, , , , , , , , , , ,148.0 Roads, Bridges and Bicycles $ Transit Operations $ , , , , , , , ,364.0 TransLink Corporate & Police $ Operating Expenditures $ 1, , , , , , , , , , ,574.0 Surplus Before Interest and Depreciation $ Interest Expense $ Capital Repayments $ Surplus/(Deficit) before Other Items $ (25.7) (25.9) (13.5) (53.5) (64.8) (72.0) Provision for Contingency Fund Adjustment $ (14.8) Provision for Contingency Efficiencies $ Funded Surplus/(Deficit) $ (40.5) (25.9) (3.4) (43.3) (54.5) (61.0) Opening Cumulative Funded Surplus $ Cumulative Funded Surplus $ 302 $ 276 $ 315 $ 333 $ 330 $ 287 $ 232 $ 369 $ 454 $ 497 $ 436 Cumulative Surplus % of Expenditures before other items 23% 20% 22% 22% 21% 17% 13% 21% 24% 24% 20%
105 Appendix 5 Capital Cash Flow Projects Approved and Proposed EXPANSION $ Thousands Total CAPITAL Projects Approved or Underway 320,733 35, ,128 Bus Bus Equipment 2,395 1,835 2,590 1,942 1,590 1, ,094 Bus Facilities 6,780 3,695 3,815 1,894 1,932 1,971 2,010 2,440 2,489 2,295 29,321 Bus Infrastructure Depot ,339 25,845 61,512 62, ,439 Bus Infrastructure Exchanges/Bus loops 7,527 14,445 51,281 37,618 39,416 25,508 26,018 26,525 32,314 32, ,107 Bus Infrastructure TOH 7,371 4,357 5,491 3,139 7,177 4,505 6,318 8,787 2,988-50,132 Bus Infrastructure Other ,456 35,883 56,032 66,162 71,850 61,451 59,991 49, ,319 Bus Vehicles Conventional Replace 64,117 90,303 92,902 62,112 13, ,645 50, ,489 Bus Vehicles Conventional Expansion ,114 37,019 44,384 29,055 20,676 23,902 2,151 11, ,004 Bus Vehicles Community Shuttle Replace 4,841 2,617 3,282 6,867 9,020 15,046 11,151 1,464-8,330 62,618 Bus Vehicles Community Shuttle Expansion - - 3,566 3,637 3,710 2,973 2,205 1,968 1,434 1,463 20,956 Bus Vehicles Custom Replace 9,432 6,512 5,389 8,219 6,686 12,664 11,372 8,334 7,811 6,222 82,640 Bus Vehicles Custom Expansion - - 4,011 4,092 4,173 2,838 2,068 1,476 1,291 1,317 21,265 Bus Vehicles Seabus Expansion , ,785 Bus Vehicles Non-Revenue 1,147 1,686 1,076 2,291 2,026 2,286 1,861 1,205-1,640 15,219 Bus Other Subtotal Bus 103, , , , , , , , , ,125 1,874,387 Rail Rail Equipment 11,761 15,213 9,546 1,948 2,749 1, ,590-1,629 47,679 Rail Facilities 710 1,250 1, ,210 Rail Infrastructure Stations & surroundings CL - 1,248-5, ,466 15,536 21,942 59,604 Rail Infrastructure Stations & surroundings E&M 1,092 10,109 67,067 92,904 30,993 34,269 41,441 29,592 23, ,899 Rail Infrastructure Stations & surroundings SOGR ,688 1,688 Rail Infrastructure Stations & surroundings Other 19,218 11,230 1,180 1,629 1,303 1,695 1,355 2,204 1,410-41,224 Rail Infrastructure Other Expansion , , , , , , ,015 4,194,213 Rail Other SOGR ,200 10,404 10,612 10,824 11,041 11,262 11,487 11,717 87,546 Rail Infrastructure Other 3,662 5,335 2,000 5,935 3,122 11,581 8,615 4,687 8,300 29,342 82,579 Rail Infrastructure Wayside Power Propulsion ,366 3, ,466 Rail Vehicles Non-Revenue ,590 Rail Vehicles SkyTrain Expansion , ,992 60, ,689-76, ,432 Rail Vehicles Bi-level , , ,420 Subtotal Rail 37,168 45, , , , , ,793 1,034, , ,358 5,393,550 Corporate Corporate Technology Applications 9,210 11,229 8,793 11,655 21,739 8,703 8,281 11,126 10,983 16, ,502 Corporate Technology Infrastructure 3,922 2,367 2,295 2,081 2,122 2,165 2,208 2,252 2,297 2,343 24,053 Corporate Technology Other 726 1, ,747 Corporate Other - - 5,100 5,202 5,306 5,412 5,520 5,631 5,743-37,915 Corporate Vehicles Non-Revenue Subtotal Corporate 14,078 14,812 16,280 19,151 29,167 16,280 16,258 19,009 19,023 19, ,185 TL Roads & Bridges TL Roads & Bridges Infrastructure Bridges Knight Street TL Roads & Bridges Infrastructure Bridges Pattullo 85,654 25, ,556 78, , , ,743 84,111 87,036-1,177,372 TL Roads & Bridges Infrastructure Bike and Walking Program TL Owned 1,500 3,600 5,179 7,090 9,109 11,318 11,544 11,861 11,955 12,233 85,388 Subtotal Roads & Bridges 87,156 28, ,735 85, , , ,287 95,972 98,991 12,233 1,262,761 Capital Gross Cost 562, , , ,538 1,031,968 1,293,513 1,405,600 1,348,709 1,230, ,843 9,070,010
106 Appendix 5 Capital Cash Flow Projects Approved and Proposed EXPANSION $ Thousands Total CAPITAL INFRASTRUCTURE CONTRIBUTIONS Projects Approved or Underway 16, ,765 Major Road Network- Roads & Bridges Major Road Network- RInfrastructure Roads MRN Pavement Rehab 20,500 20,954 22,449 23,114 23,797 24,499 25,218 26,074 26,835 27, ,056 Major Road Network- RInfrastructure Roads MRN Structures Rehab 13,000 13,000 13,796 14,072 14,353 14,640 14,933 15,232 15,536 15, ,408 Major Road Network- RInfrastructure Roads MRNB 20,000 20,000 21,224 21,649 22,082 22,523 22,974 23,433 23,902 24, ,166 Major Road Network- RInfrastructure Bike Program Muni Owned 6,000 7,490 9,530 11,333 13,205 15,147 15,450 15,759 16,074 16, ,383 Subtotal Major Road Network - Roads & Bridges 59,500 61,444 66,998 70,168 73,437 76,809 78,575 80,498 82,347 84, ,012 Operating Subsidiaries and Contractors Minor Capital Capital Infrastructure Contributions Gross Cost 76,265 61,444 66,998 70,168 73,437 76,809 78,575 80,498 82,347 84, ,778 Total Capital and Capital Infrastructure Contributions Gross Cost 639, , , ,706 1,105,405 1,370,322 1,484,175 1,429,207 1,313, ,081 9,820,788 Partnership Funding Federal Build Canada Fund (35,843) (16,181) (23,521) (76,181) (191,172) (228,966) (273,702) (295,459) (250,874) (166,143) (1,558,044) Regional Federal Gas Tax (126,822) (112,024) (225,227) (125,061) (102,752) (108,621) (83,383) (86,946) (131,506) (106,497) (1,208,839) Provincial (13,503) (10,388) (32,727) (80,227) (193,292) (245,189) (278,671) (319,963) (267,622) (167,679) (1,609,261) Other Regional (Including Local Government) (18,771) (45,739) (68,973) (104,013) (121,817) (83,577) - (442,890) Other (502) (500) (500) (500) (500) (500) (500) (500) (500) - (4,502) Total Partnership Funding (176,670) (139,094) (281,976) (300,740) (533,455) (652,248) (740,269) (824,686) (734,080) (440,319) (4,823,536) Total Net Cost 462, , , , , , , , , ,762 4,997,252
107 Projected Borrowing Compared to Borrowing Limit and Select Financial Ratios - Expansion $ Millions 2014B 2015F 2016F 2017F 2018F 2019F 2020F 2021F 2022F 2023F 2024F Opening Gross Direct Borrowing - MFA 1,685 1,548 1,524 1,444 1,312 1,170 1,118 1,115 1, Opening Gross Direct Borrowing - Translink 988 1,277 1,702 1,841 2,150 2,479 3,013 3,659 4,381 4,963 5,495 Opening Gross Direct Borrowing 2,673 2,825 3,226 3,285 3,461 3,648 4,130 4,773 5,426 5,927 6,456 Retirements/Other (146) (52) (114) (169) (181) (90) (75) (91) (105) (50) (90) Borrowing in Yr - Capital Closing Gross Direct Borrowing 2,825 3,226 3,285 3,461 3,648 4,130 4,773 5,426 5,927 6,456 6,797 Less: Sinking Fund - MFA (619) (685) (696) (649) (583) (594) (653) (649) (629) (684) (677) Less: Sinking Fund - Translink (78) (113) (157) (208) (268) (341) (379) (480) (601) (714) (866) Less: MFA Debt Reserve Funds (35) (36) (35) (33) (30) (28) (29) (27) (25) (26) (24) Closing Net Direct Borrowing 2,092 2,392 2,397 2,571 2,767 3,166 3,712 4,270 4,672 5,032 5,230 Deferred Concessionaire credits Golden Ears Bridge contractor liability 1,051 1,051 1,049 1,046 1,040 1,033 1,024 1,013 1, Closing Net Borrowing 3,739 4,015 3,995 4,142 4,310 4,679 5,192 5,715 6,080 6,402 6,557 Established Borrowing Limit - Gross Direct Debt 3,500 3,500 3,500 3,500 3,500 3,500 3,500 3,500 3,500 3,500 3,500 Amount over established limit ,274 1,927 2,427 2,956 3,297 Net Debt / Operating Revenues <350% 285% 298% 267% 269% 272% 287% 310% 300% 312% 307% 308% Gross Interest / Operating Revenues <20% 13.7% 14.0% 14.1% 15.5% 15.6% 15.5% 14.6% 12.0% 13.8% 18.2% 20.9% Net Borrowing per capita <$2,000* 1,082 1,175 1,143 1,131 1,152 1,219 1,303 1,389 1,483 1,590 1,636 *(excludes GEB contractor liability and Pattullo Brigde Net Direct Debt)
108 REGIONAL TRANSPORTATION INVESTMENTS A VISION FOR METRO VANCOUVER APPENDIX F APPENDIX F How to Fund 45

109 Appendix F: How to Fund FUNDING FRAMEWORK CONTEXT It is often easier to agree on the type of transportation investments that are needed than to agree on the difficult decisions about how to pay for them. As outlined in this document, the Mayors Council has worked hard to identify an investment package that is both urgently needed and affordable. The incremental funding requirements to fund this Vision are shown in Figure 1. Figure 1 Incremental Funding Requirements We have also identified workable funding options to pay for those improvements as described in this framework below. For the past 4 years, beginning in 2010 with the Memorandum of Understanding between the Province and the Mayors Council on Regional Transportation, we have undertaken extensive technical and partnership work to explore possible funding solutions. In 2012, municipal, regional and Provincial representatives worked (through a Joint Technical Committee) to publish a report: Evaluation of Revenue Sources to Support Transportation Improvements in Metro Vancouver, which informed a motion passed by the Mayors Council in January 2013 that identified the following five sources as appropriate for funding regional transportation: Near-term and medium-term: vehicle registration fee; carbon tax; regional sales tax; and, land value capture. Long-term: mobility pricing. Further information on each of the five funding sources can be found at the end of this Appendix. Regional transportation is currently funded by the revenue sources as defined in the South Coast British Columbia Transportation Authority Act, as well as senior government contributions for capital projects and vehicle procurement. However, the region faces a number of significant challenges that make it increasingly difficult to continue supporting sustainable transportation choices. In our letter to Hon. Minister Polak, dated January 31, F-1
 as")
110 Appendix F: How to Fund 2013, we outlined our concerns with the sources of revenue currently available for TransLink. Building on this, we would particularly like to stress that: Property tax is a core funding source for TransLink but should be capped at current levels (maximum increase of 3% per year) as municipalities primarily rely on property tax to deliver services and maintain infrastructure. Municipalities must keep property tax levels at a rate that is acceptable to the public while continuing to meet their responsibilities. Fuel tax is not a sustainable long term revenue source. As a result of people driving less and the increased fuel efficiency of vehicles, fuel tax revenues are declining and are expected to continue this trend. It is also a volatile funding source which makes operating and capital planning more difficult. Transit fares are already high and there is not much room to increase them further before having significant negative impacts on ridership. Combined with the constraints and challenges of existing funding sources, the region is continuing to grow which will increase demands for transportation investments and service. The result is that TransLink s existing revenues are currently growing at only half the trends for meeting the regional transportation needs and costs as shown in Figure 2 below: Figure 2 Recent Trends in Costs and Revenues: Our Mounting Challenge PRINCIPLES TO ASSESS A NEW FUNDING APPROACH The work on finding a funding solution has been guided by principles established by the Mayors Council and the Government of BC, both of which are included at the end of this Appendix. We have consolidated these principles into the following five to help guide the development and design of the funding portfolio: 1. Perform well against sets of criteria for funding for regional transportation established by both the Mayors Council and the Province; 2. Be balanced between different sectors of the economy/society; 3. Grow in size over time to keep pace with growth; 4. Be relatively stable and resilient over time; and, 5. Support broader provincial, regional and partner policy objectives. WORKING TOWARDS A PREFERRED FUNDING APPROACH Over the past several years, a comprehensive list of potential funding sources has been developed and evaluated in conjunction with the Ministry of Transportation and Infrastructure. The revenue sources stem from a review of existing funding sources, past suggestions for alternative funding sources, a scan of leading practices in other jurisdictions, and consultation with and by the Mayors Council. In addition, estimates of the revenue potential of the different funding sources have been conducted, as outlined in Table 1. F-2
111 Appendix F: How to Fund Table 1 Rates for Individual Funding Sources 1 Existing Revenue Tools New Revenue Tools Annual Funding Generated Property Tax 2 (increment per average household, $ / year) Hydro Levy (increment above existing $23 year assessment) Transit Fares (% increment above 2% annual growth- 1 time increase) Fuel Tax Increment above $0.17/litre ($/litre) Parking Sales Tax (Increment above current 21%) Regional Sales Tax (%) Carbon Tax 3 ($/tonne) Vehicle Reg. Fee ($/year) Mobility Pricing (Roads) ($/VKT) $25M $19 $28 10% $ % 0.07% $3-$10 $24 n/a $50M $37 $53 20% $ % 0.13% $5-$15 $40 n/a $100M $73 40% $ % $10-$25 $74 $0.01 $200M $146 $ % $15-$25 $142 $0.02 $250M $183 $ % $20-$25 $173 $0.02 $350M $ % $20-$25 $260 $0.03 $500M $ % $0.04 $600M 1.30% $0.05 *Rates for Land value capture mechanisms are not shown as the revenue potential varies significantly by type of land value capture mechanism and how it is applied. None of the land value capture mechanisms are capable of generating $100 million/year. The Mayors Council has evaluated a number of incremental funding portfolios to determine which approach we think best supports the delivery of the Vision and performs well against the established principles. 4 The five incremental funding portfolios tested were as follows: 1 The table includes blank spaces for some funding sources because it was determined that certain rates would either be not technically feasible and/or unlikely to gain broad acceptance. 2 The Mayors Council does not support use of property tax as an additional source of funding for regional transportation beyond the 3% increase per year allowed in TransLink s legislation. 3 The range for the carbon tax depends on several uncertain factors: the overall approach, the percentage of total revenue that is allocated to regional transportation, the schedule and increments by which the carbon tax is increased, and (for a Provincewide increment) the percentage of revenue that is returned to the Metro Vancouver region. 4 The funding portfolios assumed that only four of the five identified sources could offer enough funding capacity to support a large portion of the Vision. Land value capture is therefore treated as a supplementary source of revenue. F-3
112 Appendix F: How to Fund Near Term Potential Portfolios: Portfolio 1 100% from a regional sales tax Portfolio 2 50% from a vehicle registration fee, 40% carbon tax, 10% supplementary sources Portfolio 3 60% from a regional sales tax, 25% vehicle registration fee, 15% supplementary sources Portfolio 4 50% from mobility pricing, 40% carbon tax, 10% supplementary sources Portfolio 5 50% mobility pricing, 40% regional sales tax, 10% supplementary sources The assessment of the five portfolios concluded that the only single source capable of funding the entire amount is a regional sales tax which has less direct relationship to regional transportation. A mixed portfolio of funding sources is therefore recommended. The remaining portfolios all perform well with respect to the principles described above: in addition to supporting the criteria established by the Mayors Council and the Province around affordability, fairness, transparency, and relationship to regional transportation, they are well balanced, they grow over time to keep pace with growth, and they are relatively stable and resilient over time. There was a large variation in the impact on the transportation system, with the combination of mobility pricing and carbon tax scoring highest which is one of the reasons the Mayors Council prefers this option. THE MAYORS COUNCIL PREFERRED FUNDING APPROACH Near Term The incremental funding need in the short to medium-term is $110 million/year beginning in 2016, rising to $275 million/year in Of the five candidate funding sources identified, only three are able to be implemented in the near- to medium-term and are able to generate revenues in excess of $100 million/year: a carbon tax, regional sales tax, and vehicle registration fee. Region-wide road usage charges would not be available until later in the plan period, while land value capture can only generate a modest amount of money, and so should be seen as a source of supplemental funding only. As we have outlined in the Vision, our preferred approach in the near to mid-term is to allocate carbon tax revenues currently collected from the region towards transportation investment. This approach better supports the original policy objective of the BC Carbon Tax to reduce greenhouse gas emissions by 33% by 2020 (over 2007 levels) than the current revenue neutral approach.. It further improves the performance of the Carbon Tax compared to today by using the revenues already collected to support travel behaviour change and reduced travel by single occupancy vehicle. The preferred approach would create a clear linkage between the tax and regional transportation investments which have been shown to reduce emissions by providing more alternatives to the private automobile. The Carbon Tax is relatively easy to administer since the collection mechanisms are already in place. Finally, BC s Carbon Tax is a well-supported policy by the public with at least half of the population in support of it based on recent polling. 5 The reallocation of the BC Carbon Tax is our preference because it improves the performance of a policy already in place. If the Government of BC rejects this approach we would then discuss alternative reforms to the BC Carbon Tax including increases above the existing rate (currently at $30/tonne since 2012) with this new increment directed back to a dedicated fund for use by regions across the Province. In Metro Vancouver, we would use these funds for regional transportation investment. If the increase is implemented Province-wide, we assume that the Provincial government would work with the Union of BC Municipalities, regional districts, and individual 5 Focus Canada 2013 Public Opinion on BC Carbon Tax (The Environics Institute, 2013) F-4
113 Appendix F: How to Fund municipalities to determine how best to allocate additional revenues to fund investments of their choice in their jurisdictions. We believe that Land Value Capture mechanisms should be used to generate revenue for regional transportation in Metro Vancouver and are an important element of both a near-term and long-term funding portfolio. Land Value Capture mechanisms can help offset the costs of major transit infrastructure. As noted, these could be used as a source of funding for local financial contributions as discussed in the Partner section. Some of these mechanisms could also be applied more uniformly across the region. These mechanisms function by capturing a portion of the increased land value derived from improved accessibility to new, high-value transit infrastructure. Although it doesn t have the revenue potential of other sources, it could allow municipalities or TransLink to recapture some of the benefit that accrues to land developers and/or property owners and to use that revenue to support new regional transportation infrastructure. Legislative changes may be needed to apply some of these mechanisms, Long-term The incremental funding need in the medium-term is $275 million/year beginning in 2021 with that rising to $390 million/year in In the long-term, the Mayors Council has been consistent in identifying system-wide mobility pricing as having the greatest potential to achieve our shared vision for the region. Currently there is only a vague policy connection between what people drive, how far, when they go, and what the cost is. We cannot build our way out of congestion and, as a region, we must instead set pricing levels to improve the efficiency and fairness of the transportation system, while also raising revenue from users across the road and transit networks. As a funding source, mobility pricing offers the possibility of reducing, eliminating, or optimizing other taxes, in particular existing auto-based prices. For example, recent work in the US is looking at implementing a road usage charge as a replacement for the fuel tax. This is important for aligning policy objectives and also gaining public acceptability. Further information on a proposed tax shift is included at the end of this Appendix. There is no short path toward a mobility pricing system and while we can learn lessons from other regions, a future mobility pricing system must account for this region s unique economic, geographic, and social profile. We therefore support the establishment of a steering group to lead a Mobility Pricing Field Study in order to begin the necessary technical and communications work. This will be an inclusive process involving key stakeholders with an interest in the regional transportation system. The level of funding required by TransLink by the middle of the next decade (2026) is approximately $390 million per annum. This level would be reduced by local financial contributions as determined through local partnership agreements, but are still to be negotiated and the amount is not known at this time. Our preferred funding approach would generate, by the end of the Vision period, approximately $500 million, with approximately $250 million being generated from the carbon tax reallocation and approximately $250 million generated from mobility pricing on the road system. This translates into a mobility pricing rate of approximately two cents per km applied to all vehicular travel in the region. This portfolio allows for at least $110million of the new revenue source to be used to reduce the fuel sales tax by approximately 6 cents per litre (and reduced further depending on the amount of local financial contributions received). This tax shift will help to align policy objectives, in particular the benefits of system management, and overcome the structural deficiencies of the declining fuel tax. This level of tax shift is only illustrative and further work will be required on funding requirements and driver behaviour in order to legislate for tax changes. F-5

114 Appendix F: How to Fund Figure 3 Funding Need and Sources NEXT STEPS The Funding Framework outlined here responds to the request by the Minister of Transportation and Infrastructure to identify and propose how the Vision could be funded. The Framework draws on considerable technical work undertaken in the last four years in a collaborative manner between the Mayors Council, the Province, TransLink, and partners. While the existing sources of revenue to fund regional transportation are largely at their limits, there are four major new revenue tools that have sufficient capacity to deliver on the investments outlined in this Vision: carbon tax, vehicle registration fee, regional sales tax, and mobility pricing. Each of these major revenue tools, along with smaller supporting revenue tools, such as land value capture, could be combined in various ways to produce a funding portfolio that meets the needs of this region. We have outlined our preference and would like to use this as a starting point for discussions with the Government of BC and the general public in anticipation of the planned referendum. The Mayors Council are confident that this Funding Framework significantly advances the discussion on how new funding sources can support the delivery of this Vision. We look forward to working with the Government of BC and partners to establish a fair, reasonable and efficient funding solution that can meet our common goal of safeguarding our economy, invigorating our quality of life and protecting our health and environment. F-6
10-Year Vision Update. Vancouver City Council May 2, 2017
 1 10-Year Vision Update Vancouver City Council May 2, 2017 The 10-year Vision is our Regional Blueprint for Multimodal Transportation Investments Welcome 1 million more people and 500,000 more jobs in
The Engineering Department recommends Council receive this report for information.
 CORPORATE REPORT NO: R161 COUNCIL DATE: July 23, 2018 REGULAR COUNCIL TO: Mayor & Council DATE: July 19, 2018 FROM: General Manager, Engineering FILE: 8740-01 SUBJECT: Surrey Long-Range Rapid Transit Vision
Phase Two of the 10-Year Vision PUBLIC CONSULTATION DISCUSSION GUIDE. tenyearvision.translink.ca
 Phase Two of the 10-Year Vision PUBLIC CONSULTATION DISCUSSION GUIDE tenyearvision.translink.ca THE 10-YEAR VISION IDENTIFIES TRANSIT AND TRANSPORTATION IMPROVEMENTS THAT ARE PRIORITIES FOR KEEPING THE
2013/2014 Strategic Priorities Fund Application Overview
 2013/2014 Strategic Priorities Fund Application Overview Bob Paddon, Executive Vice President Strategic Planning and Public Affairs TransLink 3 December 2013 Strategic Priorities Fund Application Context
Executive Summary. Phase 2 Evaluation Report. Introduction
 , Executive Summary Executive Summary Introduction TransLink and the Province of British Columbia sponsored a multi-phase study to evaluate alternatives for rapid transit service in the Broadway corridor
TORONTO TRANSIT COMMISSION REPORT NO.
 Form Revised: February 2005 TORONTO TRANSIT COMMISSION REPORT NO. MEETING DATE: October 24, 2012 SUBJECT: DOWNTOWN RAPID TRANSIT EXPANSION STUDY (DRTES) PHASE 1 STRATEGIC PLAN ACTION ITEM RECOMMENDATIONS
CEDAR AVENUE TRANSITWAY Implementation Plan Update
 CEDAR AVENUE TRANSITWAY Implementation Plan Update EECUTIVE SUMMARY DECEMBER 2015 Executive Summary In 2013, the Twin Cities metropolitan area s first bus rapid transit (BRT) line, the METRO Red Line,
STRATEGIC PRIORITIES AND POLICY COMMITTEE MAY 5, 2016
 STRATEGIC PRIORITIES AND POLICY COMMITTEE MAY 5, 2016 Shift Rapid Transit Initiative Largest infrastructure project in the city s history. Rapid Transit initiative will transform London s public transit
Update on Community or Heritage Rail Project (Project Manager Services) The Engineering Department recommends that Council:
 The Engineering Department recommends that Council:") Corporate NO: R279 Report COUNCIL DATE: DECEMBER 18, 2006 REGULAR COUNCIL TO: Mayor & Council DATE: December 15, 2006 FROM: General Manager, Engineering FILE: 8710-20 (Heritage) SUBJECT: Update on Community
Corporate NO: R279 Report COUNCIL DATE: DECEMBER 18, 2006 REGULAR COUNCIL TO: Mayor & Council DATE: December 15, 2006 FROM: General Manager, Engineering FILE: 8710-20 (Heritage) SUBJECT: Update on Community
Green Line LRT: Beltline Segment Update April 19, 2017
 Green Line LRT: Beltline Segment Update April 19, 2017 Quick Facts On April 11, 2017, City Council approved Administration s recommendation for the Green Line to be underground in the Beltline from 2 Street
CITY OF LONDON STRATEGIC MULTI-YEAR BUDGET ADDITIONAL INVESTMENTS BUSINESS CASE # 6
 2016 2019 CITY OF LONDON STRATEGIC MULTI-YEAR BUDGET ADDITIONAL INVESTMENTS BUSINESS CASE # 6 STRATEGIC AREA OF FOCUS: SUB-PRIORITY: STRATEGY: INITIATIVE: INITIATIVE LEAD(S): BUILDING A SUSTAINABLE CITY
Moving around Metro Vancouver: EXPLORING NEW APPROACHES TO REDUCING CONGESTION
 Moving around Metro Vancouver: EXPLORING NEW APPROACHES TO REDUCING CONGESTION OCTOBER 2017 IT S TIME TO ADDRESS CONGESTION IN METRO VANCOUVER It s Time is a research and public engagement DECONGESTION
Jeffrey Busby A/Director, Infrastructure Program Management TransLink Urban Sustainability Accelerator
 TransLink: A multi-modal, integrated transport and operations system Jeffrey Busby A/Director, Infrastructure Program Management TransLink Urban Sustainability Accelerator Is the Grass Greener? Transportation
Green Line LRT: Beltline Recommendation Frequently Asked Questions
 Green Line LRT: Beltline Recommendation Frequently Asked Questions June 2017 Quick Facts Administration has evaluated several alignment options that would connect the Green Line in the Beltline to Victoria
EUGENE-SPRINGFIELD, OREGON EAST WEST PILOT BRT LANE TRANSIT DISTRICT
 EUGENE-SPRINGFIELD, OREGON EAST WEST PILOT BRT LANE TRANSIT DISTRICT (BRIEF) Table of Contents EUGENE-SPRINGFIELD, OREGON (USA)... 1 COUNTY CONTEXT AND SYSTEM DESCRIPTION... 1 SYSTEM OVERVIEW... 1 PLANNING
Supports Item No. 1 T&T Committee Agenda October 5, 2010
 Supports Item No. 1 T&T Committee Agenda October 5, 2010 ADMINISTRATIVE REPORT Report Date: September 28, 2010 Contact: Jerry Dobrovolny Contact No.: 604.873.7331 RTS No.: 8301 VanRIMS No.: 08-2000-20
Executive Summary. Treasure Valley High Capacity Transit Study Priority Corridor Phase 1 Alternatives Analysis October 13, 2009.
 Treasure Valley High Capacity Transit Study Priority Corridor Phase 1 Alternatives Analysis October 13, 2009 Background As the Treasure Valley continues to grow, high-quality transportation connections
5. OPPORTUNITIES AND NEXT STEPS
 5. OPPORTUNITIES AND NEXT STEPS When the METRO Green Line LRT begins operating in mid-2014, a strong emphasis will be placed on providing frequent connecting bus service with Green Line trains. Bus hours
TransLink/MoTI SURREY RAPID TRANSIT ALTERNATIVES ANALYSIS PHASE 2 EVALUATION
 TransLink/MoTI SURREY RAPID TRANSIT ALTERNATIVES ANALYSIS PHASE 2 EVALUATION FINAL EVALUATION REPORT, AUGUST, 2012 In association with Hatch Mott Macdonald, Golder Associates, A. Steadman, and Coriolis
A Transit Plan for the Future. Draft Network Plan
 A Transit Plan for the Future Draft Network Plan Project Overview and Status Completed Market Analysis and Service Evaluation. Developed Plan Framework and Guiding Principles. Developed a draft Five Year
Waco Rapid Transit Corridor (RTC) Feasibility Study
 Feasibility Study") Waco Rapid Transit Corridor (RTC) Feasibility Study Chris Evilia, Director of Waco Metropolitan Planning Organization Allen Hunter, General Manager Waco Transit System Jimi Mitchell, Project Manager AECOM
Waco Rapid Transit Corridor (RTC) Feasibility Study Chris Evilia, Director of Waco Metropolitan Planning Organization Allen Hunter, General Manager Waco Transit System Jimi Mitchell, Project Manager AECOM
Federal Gas Tax Program. Transportation Committee May 7, 2014
 5.2 Federal Gas Tax Program Transportation Committee May 7, 2014 Federal Gas Tax Transfer Program Original head agreement signed in 2005 (Canada-BC-UBCM) Purpose: provide local governments with stable,
METRO Orange Line BRT American Boulevard Station Options
 METRO Orange Line BRT American Boulevard Station Options Bloomington City Council Work Session November 18, 2013 Christina Morrison BRT/Small Starts Project Office Coordinating Planning and Design AMERICAN
FREQUENTLY ASKED QUESTIONS
 FREQUENTLY ASKED QUESTIONS 2018 What is the More MARTA Atlanta program? The More MARTA Atlanta program is a collaborative partnership between MARTA and the City of Atlanta to develop and implement a program
An Asset Management Plan for Transit And Access Transit Fleet
 Header Title ATTACHMENT 1 Building Better Transit: An Asset Management Plan for Transit And Access Transit Fleet 2 June 2016 Transit & Access Transit Fleet INTRODUCTION The Saskatoon Transit fleet is currently
BROWARD BOULEVARD CORRIDOR TRANSIT STUDY
 BROWARD BOULEVARD CORRIDOR TRANSIT STUDY FM # 42802411201 EXECUTIVE SUMMARY July 2012 GOBROWARD Broward Boulevard Corridor Transit Study FM # 42802411201 Executive Summary Prepared For: Ms. Khalilah Ffrench,
Sales and Use Transportation Tax Implementation Plan
 Sales and Use Transportation Tax Implementation Plan Transportation is more than just a way of getting from here to there. Reliable, safe transportation is necessary for commerce, economic development,
Strategic Plan
 2005-2015 Strategic Plan SUMMARY OF THE REVISED PLAN IN 2011 A decade focused on developing mass transit in the Outaouais A updated vision of mass transit in the region The STO is embracing the future
The City of Toronto s Transportation Strategy July 2007
 The City of Toronto s Transportation Strategy July 2007 Presentation Outline Transportation Statistics Transportation Building Blocks Toronto s Official Plan Transportation and City Building Vision Projects
The Boston South Station HSIPR Expansion Project Cost-Benefit Analysis. High Speed Intercity Passenger Rail Technical Appendix
 The Boston South Station HSIPR Expansion Project Cost-Benefit Analysis High Speed Intercity Passenger Rail Technical Appendix Prepared by HDR August 5, 2010 The Boston South Station HSIPR Expansion Project
Downtown Transit Connector. Making Transit Work for Rhode Island
 Downtown Transit Connector Making Transit Work for Rhode Island 3.17.17 Project Evolution Transit 2020 (Stakeholders identify need for better transit) Providence Core Connector Study (Streetcar project
2.4 TRANSIT VISION 2040 FROM VISION TO ACTION. Support the revitalization of urban cores STRATEGIC DIRECTION
 TRANSIT VISION 2040 FROM VISION TO ACTION TRANSIT VISION 2040 defines a future in which public transit maximizes its contribution to quality of life with benefits that support a vibrant and equitable society,
5 RAPID TRANSIT NETWORK PLAN PRINCIPLES, METROLINX BUSINESS CASE, AND ALTERNATIVE FINANCE AND PROCUREMENT ANALYSIS UPDATE
 5 RAPID TRANSIT NETWORK PLAN PRINCIPLES, METROLINX BUSINESS CASE, AND ALTERNATIVE FINANCE AND PROCUREMENT ANALYSIS UPDATE The Rapid Transit Public/Private Partnership Steering Committee recommends the
4 Circulation & Transportation
 4.1 Mobility Network The mobility network at the new St. Paul s hospital and health campus is comprised of an interconnected system of sidewalks, cycle paths, transit routes and roadways. Figure 4-1: Indicative
Advancing Electric Buses In Metro Vancouver. David Cooper TransLink, Senior Planner, System Planning Vancouver, British Columbia
 Advancing Electric Buses In Metro Vancouver David Cooper TransLink, Senior Planner, System Planning Vancouver, British Columbia West Coast Express Transit Police Coast Mountain Bus Company Roads and Bridges
Amman Green Policies Projects and Challenges. Prepared by: Eng. Sajeda Alnsour Project coordinator Sept. 20, 2017
 Amman Green Policies Projects and Challenges Prepared by: Eng. Sajeda Alnsour Project coordinator Sept. 20, 2017 Amman: Demographics Greater AMMAN Municipality GAM Amman is the capital of Jordan with a
Welcome. Green Line in Your Community
 Welcome Green Line in Your Community Today's session will provide you with information about Administration's recommendation for connecting the Green Line in the Beltline to Victoria Park and Inglewood/Ramsay
TORONTO TRANSIT COMMISSION REPORT NO.
 Revised: March/13 TORONTO TRANSIT COMMISSION REPORT NO. MEETING DATE: March 26, 2014 SUBJECT: COMMUNITY BUS SERVICES ACTION ITEM RECOMMENDATION It is recommended that the Board not approve any routing
THE WAY WE MOVE LRT FOR EVERYONE
 THE WAY WE MOVE LRT FOR EVERYONE 2 LRT for Everyone LRT FOR EVERYONE Light rail is about more than transit; it s about transforming Edmonton. As the city grows, so do its transportation needs. LRT is an
2.1 TRANSIT VISION 2040 FROM VISION TO ACTION. Expand regional rapid transit networks STRATEGIC DIRECTION
 TRANSIT VISION 2040 FROM VISION TO ACTION TRANSIT VISION 2040 defines a future in which public transit maximizes its contribution to quality of life with benefits that support a vibrant and equitable society,
Form Revised: February 2005 TORONTO TRANSIT COMMISSION REPORT NO. MEETING DATE: August 30, SUBJECT: Scarborough Rt Strategic Plan
 Form Revised: February 2005 TORONTO TRANSIT COMMISSION REPORT NO. MEETING DATE: August 30, 2006 SUBJECT: Scarborough Rt Strategic Plan RECOMMENDATIONS It is recommended that the Commission: 1. Endorse
US 29 Bus Rapid Transit Planning Board Briefing. February 16, 2017
 US 29 Bus Rapid Transit Planning Board Briefing February 16, 2017 Project Goals Improve the quality of transit service Improve mobility opportunities and choices Enhance quality of life Support master
CITY OF VANCOUVER ADMINISTRATIVE REPORT
 CITY OF VANCOUVER A19 ADMINISTRATIVE REPORT Report Date: July 10, 2007 Author: Chris Darwent Phone No.: 604.873.7358 RTS No.: 6866 VanRIMS No.: 13-1400-20 Meeting Date: July 24, 2007 TO: FROM: SUBJECT:
Bi-County Transitway/ Bethesda Station Access Demand Analysis
 Bi-County Transitway/ Bethesda Station Access Demand Analysis Prepared for: Washington Metropolitan Area Transit Authority Office of Planning and Project Development May 2005 Prepared by: in conjunction
Executive Summary. Draft Environmental Impact Statement/Environmental Impact Report ES-1
 Executive Summary Introduction The Eastside Transit Corridor Phase 2 Project is a vital public transit infrastructure investment that would provide a transit connection to the existing Metro Gold Line
DRAFT Evaluation Scores. Transit
 DRAFT Evaluation s The criteria for evaluating applications for new funding commitments are used to measure how well they advance the six goals identified for the MTP. Through transportation: Reduce per
Green Line Long-Term Investments
 Enhancements Short-term improvements to keep Austin moving. Investments Long-term projects to support our future. Mobility Hubs MetroRapid MetroRail MetroExpress Connectors Circulators Project Connect
Zorik Pirveysian, Air Quality Policy and Management Division Manager Policy and Planning Department
 Environment Committee Meeting: April 11, 2006 To: From: Environment Committee Zorik Pirveysian, Air Quality Policy and Management Division Manager Policy and Planning Department Date: March 20, 2006 Subject:
UNIVERSITY OF BRITISH COLUMBIA. Transit Service Plan. Discussion Paper #8
 OF BRITISH CONTENTS Summary... 1 1. Introduction... 2 1.1 U-TREK Program...2 1.2 Ridership Forecasts...3 2. s To UBC... 6 2.1 Existing s...6 2.1.1 Ridership...6 2.1.2 Target Markets...10 2.2 Future s...13
Restoration of Historic Streetcar Services in Downtown Los Angeles
 Restoration of Historic Streetcar Services in Downtown Los Angeles Early Scoping Meeting for Alternatives Analysis (AA) May 17, 2011 Introduction Key players Local lead agency: Metro Federal lead agency:
Transit Vehicle (Trolley) Technology Review
 Technology Review") Transit Vehicle (Trolley) Technology Review Recommendation: 1. That the trolley system be phased out in 2009 and 2010. 2. That the purchase of 47 new hybrid buses to be received in 2010 be approved with
Transit Vehicle (Trolley) Technology Review Recommendation: 1. That the trolley system be phased out in 2009 and 2010. 2. That the purchase of 47 new hybrid buses to be received in 2010 be approved with
Capital Needs Assessment Riders Advisory Council July2, 2008
 Capital Needs Assessment 2011-2020 Riders Advisory Council July2, 2008 1 Outline I. Capital Improvement Plan History II. Capital Improvement Plan Update III. Capital Needs Assessment State of Good Repair
Letter EL652 City of Mercer Island. Page 1. No comments n/a
 Letter EL652 City of Mercer Island Page 1 No comments n/a Page 2 Response to comment EL652 1 Section 4.5.3 of the Final EIS presents the range of potential impacts of the project. This project also lists
Attachment 5 Eglinton West LRT Planning and Technical Update
 Eglinton West LRT Planning and Technical Update 1. Introduction In July 2016, City Council approved an Eglinton West LRT with between 8 and 12 stops between Mount Dennis and Renforth Gateway, and up to
TRAVEL DEMAND FORECASTS
 Jiangxi Ji an Sustainable Urban Transport Project (RRP PRC 45022) TRAVEL DEMAND FORECASTS A. Introduction 1. The purpose of the travel demand forecasts is to assess the impact of the project components
V03. APTA Multimodal Operations Planning Workshop August Green Line LRT
 V03 APTA Multimodal Operations Planning Workshop August 2016 Green Line LRT 2 Presentation Outline Past Present Future 3 16/03/2016 RouteAhead Update 4 4 16/03/2016 RouteAhead Update 5 5 16/03/2016 6 6
Service Quality: Higher Ridership: Very Affordable: Image:
 Over the past decade, much attention has been placed on the development of Bus Rapid Transit (BRT) systems. These systems provide rail-like service, but with buses, and are typically less expensive to
Metropolitan Council Budget Overview SFY
 Metropolitan Council Budget Overview SFY 2016-2017 H T t ti C itt House Transportation Committee February 4, 2015 Transit connects us to the places that matter Transportation Needs Grow as the Region Grows
We Want Your Input! Review the design alternatives and tell us what s important to you in the design of these areas of the approved BRT Network:
 We Want Your Input! Review the design alternatives and tell us what s important to you in the design of these areas of the approved BRT Network: Richmond North of Oxford Street Richmond Row Dundas Street
Proposed FY Capital Improvement Program (CIP) March 5, 2018 Capital Planning Committee 1
 March 5, 2018 Capital Planning Committee 1") Proposed FY 2019-2023 Capital Improvement Program (CIP) March 5, 2018 Capital Planning Committee 1 The Capital Improvement Program is: A fiscally constrained, 5-year program of capital projects An implementation
Proposed FY 2019-2023 Capital Improvement Program (CIP) March 5, 2018 Capital Planning Committee 1 The Capital Improvement Program is: A fiscally constrained, 5-year program of capital projects An implementation
CITY OF VANCOUVER ADMINISTRATIVE REPORT
 Supports Item No. 1 T&T Committee Agenda May 13, 2008 CITY OF VANCOUVER ADMINISTRATIVE REPORT Report Date: April 29, 2008 Author: Don Klimchuk Phone No.: 604.873.7345 RTS No.: 07283 VanRIMS No.: 13-1400-10
Metro Transit Update. Christina Morrison, Senior Planner Metro Transit BRT/Small Starts Project Office. John Dillery, Senior Transit Planner
 Metro Transit Update Christina Morrison, Senior Planner Metro Transit BRT/Small Starts Project Office John Dillery, Senior Transit Planner Metro Transit Service Development May 16, 2013 1 Transit Planning
TORONTO TRANSIT COMMISSION REPORT NO.
 Form Revised: February 2005 TORONTO TRANSIT COMMISSION REPORT NO. MEETING DATE: September 27, 2012 SUBJECT: NOTICE OF AWARD PROCUREMENT AUTHORIZATION - ARTICULATED BUSES INFORMATION ITEM RECOMMENDATION
4.0 TIER 2 ALTERNATIVES
 4.0 TIER 2 ALTERNATIVES The Tier 2 Alternatives represent the highest performing Tier 1 Alternatives. The purpose of the Tier 2 Screening was to identify the LPA utilizing a more robust list of evaluation
U N I V E R S I T Y O F B R I T I S H C O L U M B I A. Fall 2008 Transportation Status Report
 U N I V E R S I T Y O F B R I T I S H C O L U M B I A Fall 2008 Transportation Status Report 6 February 2009 U N I V E R S I T Y O F B R I T I S H C O L U M B I A Fall 2008 Transportation Status Report
PEACHTREE CORRIDOR PARTNERSHIP. Current Status & Next Steps
 PEACHTREE CORRIDOR PARTNERSHIP Current Status & Next Steps PEACHTREE CORRIDOR PARTNERSHIP Why Peachtree? Why Now? I. THE CONTEXT High Level View of Phasing Discussion Potential Ridership Segment 3 Ease
King County Metro. Columbia Street Transit Priority Improvements Alternative Analysis. Downtown Southend Transit Study. May 2014.
 King County Metro Columbia Street Transit Priority Improvements Alternative Analysis Downtown Southend Transit Study May 2014 Parametrix Table of Contents Introduction... 1 Methodology... 1 Study Area...
Yonge Subway Extension Breakfast Meeting
 Yonge Subway Extension Breakfast Meeting May 12, 2011 1 breakfast meeting overview 1. Welcome 2. Rapid Transit overview Yonge Subway Funding Call to action 3. Commentary 4. Open discussion 5. Closing remarks
Transportation Sustainability Program
 Transportation Sustainability Program Photo: Sergio Ruiz San Francisco 2016 Roads and public transit nearing capacity Increase in cycling and walking despite less than ideal conditions 2 San Francisco
PROJECT BACKGROUND 3
 AGENDA 1. Welcome & Introductions 2. Project Background 3. Project Approach & Schedule 4. Draft Long List of Options 5. Evaluation Process 6. Next Steps 2 PROJECT BACKGROUND 3 OUR RAPID TRANSIT NETWORK
Welcome. The purpose of today s session is to:
 Welcome The purpose of today s session is to: Update you on what we ve heard from the community Share the preferred Rapid Transit network solution Present the draft Rapid Transit Master Plan Representatives
FINAL. Sound Transit Long-Range Plan Update. Issue Paper S.1: Tacoma Link Integration with Central Link. Prepared for: Sound Transit
 Sound Transit Long-Range Plan Update Issue Paper S.1: Tacoma Link Integration with Central Link Prepared for: Sound Transit Prepared by: Quade & Douglas, Inc. FINAL March 2005 Foreword This issue paper
GO Transit s deliverable: the 2020 Service Plan
 GO Transit s deliverable: the 2020 Service Plan GO Transit s 2020 Service Plan describes GO s commitment to customers, existing and new, to provide a dramatically expanded interregional transit option
Click to edit Master title style
 Nelson/Nygaard Consulting Associates SERVICE IMPROVEMENT STRATEGIES September 22, 2015 1 PROJECT OVERVIEW & WORK TO DATE 1. Extensive stakeholder involvement Throughout 2. System and market assessment
RELEASED UNDER THE OFFICIAL INFORMATION ACT 1982
 Subject MINISTERIAL BRIEFING NOTE Rapid Transit in Auckland Date 1 November 2017 Briefing number BRI-1133 Contact(s) for telephone discussion (if required) Name Position Direct line Cell phone 1 st contact
Rapid Transit and Land-Use Integration a Reality
 City of Charlotte Rapid Transit and Land-Use Integration a Reality Transportation Oversight Committee Carolyn Flowers CEO Charlotte Area Transit System April 29, 2010 Charlotte Region Statistics Mecklenburg
Chapter 4 : THEME 2. Transportation
 Chapter 4 : THEME 2 Strengthen connections to keep the Central Area easy to reach and get around 55 Figure 4.2.1 Promote region-wide transit investments. Metra commuter rail provides service to the east,
Develop ground transportation improvements to make the Airport a multi-modal regional
 Project Overview TRANSPORTATION IMPROVEMENTS WHAT ARE THE PROJECT GOALS? Transportation transportation hub. Develop ground transportation improvements to make the Airport a multi-modal regional Land Use
Washington Metropolitan Area Transit Authority
 Executive Summary: Metrobus Network Evaluation and Future Fleet Needs Presented to: Washington Metropolitan Area Transit Authority Submitted by: In Association with P 2 D Joint Venture Introduction Metrobus
Public Meeting. City of Chicago Department of Transportation & Department of Housing and Economic Development
 Public Meeting City of Chicago Department of Transportation & Department of Housing and Economic Development Funded by Regional Transportation Authority September 12, 2011 In partnership with Presentation
CHAIR AND MEMBERS STRATEGIC PRIORITIES AND POLICY COMMITTEE MEETING ON MARCH 20, 2019 RECOMMENDATION
 TO: FROM: SUBJECT: CHAIR AND MEMBERS STRATEGIC PRIORITIES AND POLICY COMMITTEE MEETING ON MARCH 20, 2019 KELLY SCHERR, P.ENG., MBA, FEC MANAGING DIRECTOR, ENVIRONMENTAL & ENGINEERING SERVICES AND CITY
I-405 and SR 522/NE 145th Bus Rapid Transit. Elected Leadership Groups Meeting November 30, 2018
 I-405 and SR 522/NE 145th Bus Rapid Transit Elected Leadership Groups Meeting November 30, 2018 Agenda Welcome and Introductions Public Comment BRT Connection in Bothell Common Elements: Bus base, Station
Sustainability SFMTA Path to Platinum
 Sustainability SFMTA Path to Platinum Ed Reiskin San Francisco Municipal Transportation Agency, Director of Transportation San Francisco, CA Timothy Papandreou Deputy Director Strategic Planning & Policy
Public and Fleet Electric Vehicle Charging Infrastructure Strategy
 CoQuitlam For Council Our File: 11-5210-01/000/2018-1 Doc#: 3187569.V3 To: From: Subject: For: City Manager General Manager, Engineering and Public Works Public and Fleet Electric Vehicle Charging Infrastructure
7 COMPARATIVE EVALUATION OF ALTERNATIVES
 7 COMPARATIVE EVALUATION OF ALTERNATIVES 7.1 INTRODUCTION This chapter presents the comparative analysis of the four Level 2 build alternatives along with a discussion of the relative performance of the
What We Heard Report - Metro Line NW LRT
 What We Heard Report - Metro Line NW LRT by Metro Line NW LRT Project Team LRT Projects City of Edmonton April 11, 2018 Project / Initiative Background Name Date Location Metro Line Northwest Light Rail
CITY OF ANN ARBOR, MICHIGAN 301 E. Huron St., P.O. Box 8647 Ann Arbor, Michigan
 Date: Wednesday, June 24, 2014 Location: Ann Arbor District Library Attendees: 40 citizen attendees Ann Arbor Station Environmental Review Public Meeting Meeting Notes Meeting #2 The second public meeting
Pedestrians, Cars, Buses and Trains? Considerations for Rapid Transit Service at Western University
 Pedestrians, Cars, Buses and Trains? Considerations for Rapid Transit Service at Western University Shift: The City of London s Rapid Transit Proposal Shift: The City of London s Rapid Transit Proposal
RTID Travel Demand Modeling: Assumptions and Method of Analysis
 RTID Travel Demand Modeling: Assumptions and Method of Analysis Overall Model and Scenario Assumptions The Puget Sound Regional Council s (PSRC) regional travel demand model was used to forecast travel
Newsletter. service to rider demand and ensure efficient use of its fleet. I NSIDE T HIS ISSUE
 Newsletter Volume 5, Issue 8 August 2013 I NSIDE T HIS ISSUE 1 2 3 Fall Service Changes Start September 2nd Call for Interest to Serve on the 2014 Access Transit Users Advisory Committee Accessible Bus
Sound Transit East Link: Bus/LRT System Integration Study
 Sound Transit East Link: Bus/LRT System Integration Study Prepared For: Sound Transit King County Metro Mercer Island WSDOT Prepared By: CH2M HILL July, 2014 1 SOUND TRANSIT EAST LINK: BUS/LRT SYSTEMES
Draft Results and Open House
 Waco Rapid Transit Corridor (RTC) Feasibility Study Draft Results and Open House Chris Evilia, Director of Waco Metropolitan Planning Organization Allen Hunter, General Manager Waco Transit System Jimi
TRAIN, BUS & TRANSIT
 TRAIN, BUS & TRANSIT Input Metra 1 Metra does not want to add parking because of space; maxed out on number of cars per train. Developments on Rt. 59 will affect. 2 Should do studies regarding what the
2030 Multimodal Transportation Study
 2030 Multimodal Transportation Study City of Jacksonville Planning and Development Department Prepared by Ghyabi & Associates April 29,2010 Introduction Presentation Components 1. Study Basis 2. Study
Converting BRT to LRT in the Nation s Capital Ottawa, Canada. John Manconi City of Ottawa Ottawa, Canada
 Converting BRT to LRT in the Nation s Capital Ottawa, Canada John Manconi City of Ottawa Ottawa, Canada 1 The Challenge *Mackenzie King Bridge Ottawa, AM peak period 2 The Challenge Ottawa s population
IMPROVEMENT CONCEPTS
 IMPROVEMENT CONCEPTS for the South Novato Transit Hub Study Prepared by: January 11, 2010 DKS Associates With Wilbur Smith Associates IMPROVEMENT CONCEPTS Chapter 1: Introduction 1. INTRODUCTION The strategic
The Future of Transportation on the Caltrain Corridor
 The Future of Transportation on the Caltrain Corridor 11.30.16 1 2 Today What is happening Vision Recommendations What is costs How to pay for it 3 The Caltrain Corridor is home to the world s innovation
Background Information about the Metrobus 29 Lines Study
 Background Information about the Metrobus 29 Lines Study Questions Overview of Existing Service Q. Why is the study being conducted? A. The 29 Lines provide an important connection between Annandale and
West LRT. Alignment Update and Costing Report May Calgary Transit Transportation Planning Clifton ND Lea Consultants
 West LRT Alignment Update and Costing Report 2006 May Calgary Transit Transportation Planning Clifton ND Lea Consultants West LRT Update Background The service area for West LRT is generally described
Appendix C. Parking Strategies
 Appendix C. Parking Strategies Bremerton Parking Study Introduction & Project Scope Community concerns regarding parking impacts in Downtown Bremerton and the surrounding residential areas have existed