World Economic Overview. M. Fouquin, H. Guimbard, C. Herzog & D. Unal. December 2012
|
|
|
- Jeffrey Stevenson
- 5 years ago
- Views:
Transcription

1 1
2 Contents Presentation P Part one : Countries weight Part two : International Trade Trade in goods and services Trade in goods Trade in services Part three : Specialization Appendix Appendix 1 : Geographical classification Appendix 2 : Sectoral classification Appendix 3 : References 2
3 Presentation 3
4 This World Economic Overview highlights the main changes in the world economy in the long run and how nations took part in it. Trends over some forty years are featured in the overview : from 196 to 213 for GDP, and from 1967 to 21 for international trade in goods and services. The first part of the overview is dedicated to changes in the world ranking of economic and population weights as well as in the one of nations development levels. The second part describes trade flows. It sets out the growing share of trade in goods and services in the world production along with trade balances and imbalances across nations. Trade in goods and services, reflecting and explaining global and national transformations, is observed in detail. On one side through the product structure evolution, on the other side through the changes in geographical breakdowns. In the third part, specialization indicators in terms of comparative advantages are presented for about twenty major countries. This overview has been carried out from hte CHELEM database (Harmonized Accounts on the World Economy) CHELEM-Banque de données du CEPII, document de travail n 88-14, Décembre
5 Part one : Countries Weight 5
6 Total population millions World = 1 Variation of inhabitants North America 474 7,9 7,6 7,3 6,9 6,8 6,7-1,2 United States 322 6, 5,6 5,2 4,8 4,7 4,5-1,5 Canada 35,6,6,6,5,5,5 -,1 Mexico 117 1,3 1,4 1,5 1,6 1,6 1,6,4 South America * 489 5,9 6,3 6,5 6,7 6,8 6,9 1, Brazil 2 2,4 2,6 2,7 2,8 2,9 2,8,4 European Union (27) 51 13,4 11,9 1,4 9, 8, 7,2-6,2 European Union (15)** 43 9,9 8,8 7,6 6,6 6,2 5,7-4,2 Euro Area** 338 8, 7,2 6,3 5,5 5,2 4,7-3,3 Germany** 81 1,8 1,7 1,4 1,2 1,3 1,1 -,7 France 66 1,5 1,4 1,2 1,1 1,,9 -,6 Italy 61 1,7 1,5 1,3 1,1,9,9 -,8 United Kingdom 63 1,7 1,5 1,3 1,1 1,,9 -,8 Other Europe 12 1,9 1,9 1,8 1,8 1,7 1,7 -,2 Turkey 76,9 1, 1, 1, 1, 1,1,1 CIS 279 6,8 6,4 5,8 5,3 4,6 3,9-2,9 Russian Federation 14 3,9 3,5 3,1 2,8 2,4 2, -2, Ukraine 45 1,4 1,3 1,1 1,,8,6 -,8 Middle East 39 3,4 3,7 4,1 4,6 4,9 5,5 2,1 Saudi Arabia 29,1,2,2,3,3,4,3 Egypt 86,9 1, 1, 1,1 1,1 1,2,3 Sub-Saharan Africa 91 7,6 8, 8,7 9,7 1,9 12,8 5,2 South Africa 59,6,7,7,8,8,8,2 Nigeria 172 1,5 1,6 1,7 1,8 2, 2,4,9 Japan 127 3, 2,8 2,6 2,3 2,1 1,8-1,3 East and South-East Asia ,7 3,5 3,7 3,4 29,7 28,1-1,6 ASEAN ,5 6,9 7,3 7,6 7,8 7,9 1,5 China ,9 22,2 22,1 21,4 2,6 19,1-2,9 South Korea 49,8,9,9,8,8,7 -,1 Taiwan 24,4,4,4,4,4,3, Oceania and other Asia ,5 21,1 22,1 23,4 24,5 25,6 5,1 Australia/New Zealand 28,4,4,4,4,4,4, India ,7 15, 15,7 16,5 17,2 17,9 3,2 Asia and Oceania n.e.s ,3 5,7 6, 6,5 6,9 7,3 2, World , 1, 1, 1, 1, 1,, Source : CEPII, CHELEM-GDP database * South and Central America and the Caribbean is referred to as South America * * Former East Germany included since 1991 World Economic Overview 6
7 Regional shares of world income GDP at national current prices, converted at current exchange rates Structure % of world Variation billion dollars North America ,2 38,6 29, 3,3 35, 25,5-16,7 United States ,1 34,3 24,6 26,4 3,8 21,4-16,7 Canada , 2,9 2,4 2,7 2,2 2,5 -,5 Mexico ,2 1,4 2, 1,3 2, 1,7,5 South America * ,8 4,5 5, 4, 4,6 6,5 1,7 Brazil ,1 1,4 2,1 2,1 2, 3,2 2,1 European Union (27) ,7 28,6 33,4 33,3 26,2 23,2-2,5 European Union (15)** ,4 25,7 31, 31,3 25, 21,3-1,2 Euro Area** ,6 19,8 24,4 25,1 19,3 16,9 1,3 Germany** , 6,1 7,3 7, 5,8 4,7,7 France ,5 4,9 6,1 5,7 4,1 3,7 -,8 Italy 2 9 2,9 3,6 4,1 5,2 3,4 2,8 -,2 United Kingdom ,3 4,2 4,8 4,6 4,6 3,4-1,9 Other Europe , 2,7 3,1 3,1 2,7 3,2,3 Turkey 872 1,4,8,8,9,8 1,1 -,3 CIS 3 6 1,7 1,1 4, 4, Russian Federation 2 299,9,8 3, 3, Ukraine 199,4,1,3,3 Middle East ,6 1,7 4,8 2,6 2,5 4,1 2,5 Saudi Arabia 642,2,2 1,5,5,6,8,7 Egypt 254,3,3,2,2,3,3, Sub-Saharan Africa ,3 2,2 2,4 1,4 1,1 1,9 -,4 South Africa 478,6,6,7,5,4,6,1 Nigeria 298,3,4,6,1,1,4,1 Japan ,3 7, 9,6 14,1 14,6 8, 4,7 East and South-East Asia ,2 5,6 5,8 5,7 8,7 17,5 1,3 ASEAN ,2 1,9 1,9 1,6 1,9 3,3 1,1 China ,5 3,1 2,7 1,8 3,7 11,6 7,1 South Korea 1 243,3,3,6 1,2 1,6 1,6 1,4 Taiwan 52,1,2,4,8 1,,7,6 Oceania and other Asia ,7 5, 4,2 3,8 3,5 6,2,5 Australia/New Zealand ,8 1,7 1,8 1,7 1,4 2,5,6 India ,7 2, 1,6 1,4 1,4 2,8,1 Asia and Oceania n.e.s 683 1,2 1,2,8,7,7,9 -,3 World , 1, 1, 1, 1, 1,, World Economic Overview Source : CEPII, CHELEM-GDP database * South and Central America and the Caribbean is referred to as South America ** Former East Germany included since
8 Regional shares of world production*** GDP at 25 international prices and purchasing power parities Structure % of world total Variation billion dollars North America ,1 27,7 26,2 26,5 27,8 22,2-7,9 United States ,2 23,6 21,5 22,2 23,3 18,4-7,8 Canada ,2 2,1 2,1 2,1 2,1 1,7 -,5 Mexico ,8 2,1 2,6 2,3 2,4 2,1,3 South America * ,5 6,4 7,3 6,2 6,3 6,6,2 Brazil ,1 2,3 3,4 3, 2,9 2,9,8 European Union (27) ,1 3,2 28,1 26,7 24,9 18,9-12,2 European Union (15)** ,5 26,9 24,4 23,3 22,4 16,5-11, Euro Area** ,5 21,1 19,7 18,9 18,2 13,3-7,2 Germany** ,4 6,2 5,5 5,2 5,2 3,8-2,6 France ,2 4,3 4,1 3,9 3,6 2,6-1,6 Italy ,9 4,1 3,9 3,7 3,3 2,1-1,8 United Kingdom ,7 4,5 3,6 3,6 3,5 2,8-2,9 Other Europe ,1 3,1 3, 2,9 2,9 2,7 -,4 Turkey , 1, 1, 1,2 1,3 1,4,4 CIS ,3 3,5 4,3 4,3 Russian Federation ,2 2,6 3, 3, Ukraine 31 1,2,4,4,4 Middle East , 5, 6,4 4,5 4,6 5, 1, Saudi Arabia 659,4,5 1,2,9,8,9,5 Egypt 48,3,3,4,5,6,6,3 Sub-Saharan Africa , 2,7 2,5 2,3 2,2 2,6 -,4 South Africa 571,9 1,,9,8,8,8 -,2 Nigeria 417,5,4,5,4,4,6,1 Japan ,9 7,5 7,7 9,1 7,6 5,4,4 East and South-East Asia ,2 4,2 5,5 8,8 13,7 23,2 19, ASEAN ,7 1,8 2,2 2,9 3,5 4,2 2,5 China ,9 1,6 1,9 3,5 7, 15,5 13,6 South Korea 1 474,3,4,7 1,3 1,8 1,9 1,6 Taiwan 838,2,3,5,8 1,1 1,1,9 Oceania and other Asia , 5,2 4,8 5,7 6,6 9,1 4,1 Australia/New Zealand ,6 1,6 1,4 1,4 1,4 1,3 -,3 India ,3 2,5 2,3 2,9 3,7 6,1 3,8 Asia and Oceania n.e.s ,1 1,1 1,2 1,5 1,4 1,7,6 World , 1, 1, 1, 1, 1,, Source : CEPII, CHELEM-GDP database * South and Central America and the Caribbean is referred to as South America ** Former East Germany included since 1991 ** PPP GDP is the GDP converted in international dollars, using PPP rates; an international dollar has the same purchasing power than the dollar in tthe United States; data are expressed in 25 billion dollars. World Economic Overview 8
9 55 Shares in World Production* areas % of World PPP GDP Europe Africa Middle East Asia Oceania 3 America Source : CEPII, CHELEM-GDP database. *See p.8 9
10 Shares in World Production* main geographic regions (% of World PPP GDP) 35 3 European Union (27) North America 25 2 East and South-East Asia 15 CIS and other Europe 1 Japan Ocania and other Asia South America 5 Middle-East, Maghreb Sub-saharan Africa Source : CEPII, CHELEM-GDP database. *See p.8 1
11 Shares in World Production* major countries % of World PPP GDP World Economic Overview 3 18 China 16 India 25 United Etats-Unis States United States United States 14 Japan Germany 2 12 Russian Federation 15 1 Brazil United Kingdom 8 France 1 6 Italy Mexico South Korea Canada Spain Indonesia Source : CEPII, CHELEM-GDP database *See p.8. 11
12 GDP PPP* per head 25 international dollars Ranking of regions in 213 World Economic Overview GDP at 25 international prices and purchasing power parities Structure % of world average Dollars per head in United States Australia/New Zeland Canada Taiwan North America Germany United Kingdom Japan European Union (15)* France South Korea Euro Area* European Union (27)* Italy Saudi Arabia Other Europe Russian Federation Turkey Mexico CIS Brazil World AVERAGE South America Middle East South Africa East and South-East Asia China Ukrain ASEAN Egypt Oceania and other Asia India Nigeria Asia and Oceania n.e.s Sub-saharan Africa Source : CEPII, CHELEM-GDP database. *See p.8 12
13 25 PPP GDP per head* (annual average growth rate) World Economic Overview China South Korea Taiwan India ASEAN Turkey Egypt 12 other EU27 East Asia nes United Kingdom Russian federation 213/198 Japan Australia/New Zealand Other EU15 198/196 United States Other Europe Canada France Nigeria Germany Brazil Italy Mexico Sub-saharan Africa MENA Saudi Arabia -2,, 2, 4, 6, 8, 1, Source : CEPII, CHELEM-GDP database. *See p.8 13
14 Part two International Trade 14
15 Trade in goods and services 15
16 Shares of main current account items in World GDP World Economic Overview percent of World GDP at current prices Current account Current Current account account 3 25 Total Goods and Services 25 2 Industry Services 5 5 Primary products Source : CEPII, CHELEM-International Trade, CHELEM-GDP and CHELEM-Balance of Payments databases 16
17 World Trade and World GDP (current prices, annual average growth rate, %) billion dollars annual average growth rate, % World Trade ,8 8,3 8,4 7,8 1,3 Primary products ,4 3,2 5,4 1,8 9,6 Industry ,5 9,9 9,1 6,9 1,5 Services ,8 9,4 9,1 7,7 1,7 World GDP ,4 8,7 6,1 5,8 8, Source : CEPII, CHELEM-International Trade, CHELEM-GDP and CHELEM-Balance of Payments databases 17
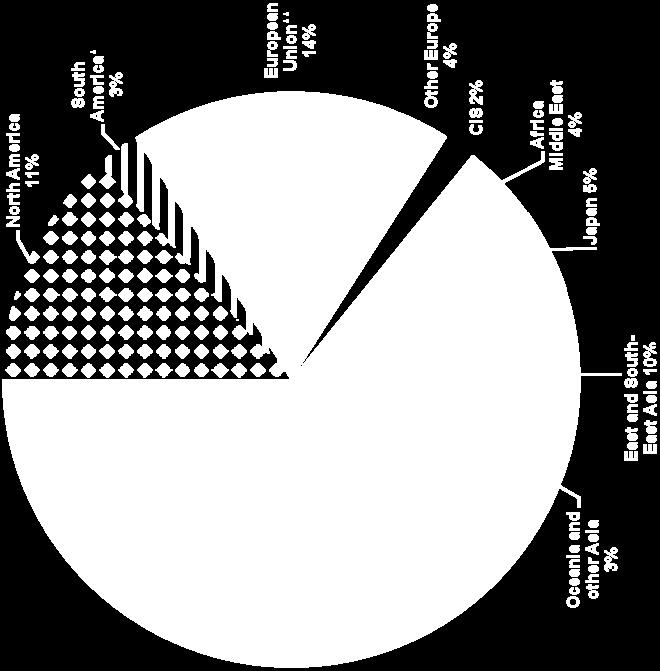
18 World Exports in Goods and Services (9 areas in % of world trade) World Economic Overview EU27* (36%) East & South East Asia (24%) North America (14%) Africa, Middle East (5%) Japan (5%) Other Europe (4%) South America (4%) CIS (4%) Oceania & Other Asia (4%) Source : CEPII, CHELEM-Balance of Payments database. Note: the the right axis is for EU, the left axis is for the other areas. Figures into brakets show the share in 21. *Intra-EU trade included 18
19 World Imports in Goods and Services (9 areas in % of world trade) World Economic Overview EU27* (4%) East & South East Asia (19%) North America (18%) Japan (5%) Africa Middle East (4%) Other Europe (4%) Oceania & Other Asia (3%) South America (4%) CIS (4%) Source : CEPII, CHELEM-Balance of Payments database.. Note: the the right axis is for EU, the left axis is for the other areas. Figures into brakets show the share in 28. *Intra-EU trade included 19
20 6, Trade Balances on Goods and Services (billion current dollars) 4, East and South East Asia 2,, European Union CIS Africa Middle East Japan Other Europe South America Oceania and other Asia 2, 4, 6, North America 8, Source : CEPII, CHELEM-Balance of Payments database 2
21 Shares of the 4 sectors in World Trade World Economic Overview 9 Percent of World Trade 8 7 Manufacturing Energy Food agriculture Mining Source : CEPII, CHELEM-International Trade database. 21
22 Shares of the 6 stages of Production in World Trade Percent of World Trade Equipment goods Consumption goods Primary Intermediate goods Basic Manufacturing 1 Mixed products Source : CEPII, CHELEM-International Trade database 22
23 Shares of chains in World Trade excluding Energy Percent of World Trade excluding Energy World Economic Overview Chimique Electronique Mécanique 1 5 Agroalimentaire Véhicules Textile Bois papiers Electrique Sidérurgique Non ferreux Source : CEPII, CHELEM-International Trade 23
24 Geographic structure of World Trade in 21 percent of World Trade (all goods) (14 88 billion dollars at current prices in 21**) World Economic Overview Exporting zone in row Importing zone in column % flux 21 Amérique Amérique Union Autres CEI Moyen-orient, Afrique Japon Asie de l'est Océanie et Monde* du Nord du Sud européenne (a) Europe Maghreb sub-saharienne et du Sud-Est Autres Asie Amérique du Nord 6,1 1,1 2,,3,1,4,1,5 1,8,4 12,7 Amérique du Sud 1,1 1,1,7,1,1,1,1,1,7,1 4,2 Union européenne* 2,8,7 22,7 2,4 1,1 1,4,6,4 2,2,7 35, Autres Europe,4,1 2,2,2,1,3,,1,3,1 3,7 CEI,3, 1,8,3,7,2,,1,5,1 3,9 Moyen-orient, Maghreb,6,3 1,2,1,,4,2,8 1,7,6 6,1 Afrique sub-saharienne,5,1,5,,,1,3,1,5,2 2,2 Japon 1,,2,6,1,1,2,1, 2,9,2 5,5 Asie de l'est et du Sud-Est 4,5,9 3,8,4,5,9,5 2, 7,7 1,6 22,9 Océanie et Autres Asie,4,1,6,1,,4,1,4 1,3,4 3,7 Monde* 17,6 4,6 36, 3,9 2,7 4,4 2, 4,6 19,7 4,4 1, Source : CEPII, base CHELEM - commerce international *Non compris les flux non ventilés géographiquement (a) Union européenne à 27 24


25 World exports in nine zones (percent of World Trade) World Economic Overview billion dollars billion dollars Source : CEPII, CHELEM-International Trade database. *See p.8 ** European Union 27 25

 World")


26 World imports in nine zones (percent of World Trade) World Economic Overview billion dollars billion dollars Source : CEPII, CHELEM International Trade database. *See p.8 **European Union 27 26


 1967 217")


27 World exports in nine zones Intra-Zone exchanges excluded (percent of World Trade, intra-zone included) billion dollars billion dollars Source : CEPII, CHELEM-International Trade database. *See p.8 **European Union 27 27


28 World imports in nine zones Intra-zone exchanges excluded (percent of World Trade, intra-zone included) billion dollars billion dollars Source : CEPII, CHELEM-Internbational Trade database. *See p.8 **European Union 27 28
29 Ten leading merchandises exporters (percent of world merchandise trade) World Economic Overview China Germany United States Japan France Netherlands South Korea Italy BLEU United Kingdom Source : CEPII, CHELEM-International Trade database. 29
30 EU27 share in member countries manufacturing product imports other EU27 France 9 other EU15 Italy Benelux Germany Source : CEPII, CHELEM-International Trade database. 3
31 EU27 share in member countries food agriculture product imports World Economic Overview other EU27 France 6 Italy 9 other EU15 5 Germany Benelux Source : CEPII, CHELEM-International Trade database. 31
32 Trade balances of the 6 major countries (percent of world merchandise trade, current dollars) World Economic Overview 6 4 China 2 2 Germany Japan France United Kingdom 4 United States Source : CEPII, CHELEM-International Trade database 32
33 Positions of 6 major countries in the energy chain (net exports, % of world trade in energy, current dollars) 5 United Kingdom France 5 Germany China Japan 1 United States Source : CEPII, CHELEM-International Trade database 33
34 Positions of 6 major countries in the Food Agriculture chain (net exports, % of world trade in Food Agriculture, current dollars) United States 5 France Germany United Kingdom China Japan Source : CEPII, CHELEM-International Trade database 34
35 Positions of 6 major countries in the textiles chain (net exports, % of world trade in textiles, current dollars) 4 3 China France Germany United Kingdom Japan United States Source : CEPII, CHELEM-International Trade database 35
36 Positions of 6 major countries in the wood paper chain (net exports, % of world trade in wood paper, current dollars) 2 15 China 1 5 Germany 5 Japan United Kingdom France United States Source : CEPII, CHELEM-International Trade database 36
37 Positions of 6 major countries in the chemical chain (net exports, % of world trade in chemicals, current dollars) Germany 2 Japan France United States United Kingdom China Source : CEPII, CHELEM-International Trade database 37
38 Positions of 6 major countries in the Iron & Steel chain (net exports,, % of world trade in iron & steel, current dollars) Japan United Kingdom Germany France United States 5 1 China Source : CEPII, CHELEM-International Trade database 38
39 Positions of 6 major countries in the non ferrous chain (net exports, % of world trade in non ferrous, current dollars) France United Kingdom United States Germany Japan China Source : CEPII, CHELEM-International Trade database 39
40 Positions of 6 major countries in the machinery chain (net exports, % of world trade in machinery, current dollars) Japan Germany China France United Kingdom United States Source : CEPII, CHELEM-International Trade database 4
41 Positions of 6 major countries in the vehicles chain (net exports, % of world trade in vehicles, current dollars) Japan Germany France China United Kingdom 1 United States Source : CEPII, CHELEM-International Trade database 41
42 Positions of 6 major countries in the electrical chain (net exports, % of world trade in electrical equipment, current dollars) 2 15 China 1 5 Germany Japan France United Kingdom 5 United States Source : CEPII, CHELEM-International Trade database 42
43 Positions of 6 major countries in the electronics chain (net exports, % of world trade in electronics products) China Japan Germany France United Kingdom 1 United States Source : CEPII, CHELEM-International Trade database. 43
44 Trade in Services 44
45 International Trade in Services compared to Trade In Goods: relative shares, (% of world trade in goods and services) Industry (63% in 21) Primary products (15% in 21) Services (22% in 21) Source : CEPII, CHELEM-International Trade and CHELEM-Balance of Payments. 45
46 World Trade in Services (% of world trade in services) 6 55 Other services (55 % en 21) Travel (23% en 21) Transportation (22% en 21) 1 Source : CEPII, CHELEM-Balance of Payments dataase. 46
47 World Trade in Services, 11 sectors: relative shares in 21 and growth World Economic Overview Value* Share** Growth rate*** ** *** ** 21 Services , 7,7 Transportation ,4 6,7 Travel , 5,4 Other Services ,6 9,4 of which Computer & Information 159 4,5 18,9 Finance 189 5,3 12, Insurance 119 3,4 11,2 Non either specified 92 2,6 9,8 Royalties & license 215 6, 1,2 Communication 96 2,7 1, Other Business ,1 8,5 Construction 8 2,3 6,9 Culture 3,9 5,7 Government 12 2,6 5,6 * Billion current dollars ** % of world trade in services in 21 ***Annual average growth rate Source : CEPII, CHELEM-Balance of Payments database. 47


48 World Exports in Services, 9 zones (% of total exports) billion dollars billion dollars Oceania and other Asia 3% North America 22% East and South East Asia 14% Japan 5% Africa Middle East 3% CIS 2% Other Europe 6% EU27 43% South America 3% Océania and other Asia 3 % North America 17% East and South East Asia 15 % South America 3% Japan 4 % Africa Middle East 4% CIS 2% EU27 46% Other Europe 6% Source : CEPII, CHELEM-Balance of Payments database. 48


49 World Imports in Services, 9 zones (% of total imports) billion dollars billions dollars East and South East Asia 15% Oceania and other Asia 3% North America 16% South America 4% Japan 9% Océania and other Asia 3% North America 15% Africa Middle East 5% EU27 41% East and South East Asia 16% South America 4% CIS 2% Other Europe 4% Japan 5% Africa Middle East 7% EU27 43% CIS 3% Other Europe 4% Source : CEPII, CHELEM-Balance of Payments database. 49
50 Trade Balances on Services ( billion current dollars) 3 25 * * * 2 European Union* 15 1 North America Other Europe 5 5 Oceania and other Asia East and South East Asia Japan South America CIS 1 Africa Middle East Source : CEPII, CHELEM Balance of Payments database. * EU27 5
51 1 Major Countries in International Trade Services (% of world trade in services) World Economic Overview Exports Imports Trade Balances (the five largest surpluses and deficits) Country Country United States 18,6 15,1 United States 12,2 11,8 United Kingdom 7,4 7,3 Germany 9,3 8,2 Germany 6,1 7, United Kingdom 5,8 5,3 France 5,9 4,4 China 2,1 5,1 BLEU 2,6 4,3 Japan 9,1 4,8 China 1,8 3,9 France 4,7 4,1 Japan 5,1 3,9 Italy 4,3 3,7 Spain 3,2 3,7 BLEU 2,3 3,5 Italy 4,9 3,1 Spain 1,9 2,8 Netherlands 3,6 2,8 Netherlands 3,4 2,7 Total 1 59,2 55,6 Total 1 55, 52, United States United Kingdom Hong Kong Spain Switzerland Russian federation Japan Germany China Saudi Arabia Source : CEPII, CHELEM-Balance of Payments database.. 51
52 1 Major countries in International Trade Transportation (% of world trade in transportation) World Economic Overview Exports Imports Trade Balances (the five largest surpluses and deficits) Country Country United States 15,2 1,1 United States 12,9 9,4 Germany 6,2 8,5 Germany 6,4 7,3 France 6,2 5,3 China 2,7 6,5 Japan 6,9 5,2 Japan 8,5 5,6 United Kingdom 5,8 5,2 India 1,9 4,9 Singapore 2,7 5, France 5,2 4,6 South Korea 3,5 4,7 United Kingdom 5,9 3,9 Netherlands 6,2 4, Singapore 2,8 3,7 BLEU 3,1 4, South Korea 2,8 3,3 China,9 3,9 Italy 3,7 3,2 Total 1 56,9 56, Total 1 52,8 52, Greece Netherlands Norway South Korea BLEU Saudi Arabia Indonesia Thailand China India Source : CEPII, CHELEM-Balance of Payments database. 52
53 1 Major Countries in International Trade Travel World Economic Overview (% of world trade in travel) Exports Imports Trade Balances (the five largest surpluses and deficits) Country Country United States 2,1 15,6 Germany 13,3 11,4 Spain 6,1 6,9 United States 13,3 11,1 France 6,4 6,4 United Kingdom 7,1 7,1 Italy 6,9 5,2 China 2, 6,1 China 2,8 5,1 France 4,3 5,4 Germany 4,1 4,5 Italy 4,1 3,9 United kingdom 5,3 3,9 Japan 8,2 3,5 Turkey 1,6 2,7 Canada 2,9 3,4 Austria 2,6 2,5 BLEU 2,1 3, Malaysia,9 2, Russia 2,5 2,9 Total 1 56,7 54,6 Total 1 59,8 57, United States Spain Turkey Italy Thailand Russian federation Saudi Arabia Japan United Kingdom Germany Source : CEPII, CHELEM-Balance of Payments database. 53
54 1 Major Countries in International Trade Other Services* World Economic Overview (% of world trade in other services*) Exports Imports Trade Balances (the five largest surpluses and deficits) Country Country United States 19,3 16,5 United States 11, 13,2 7 United Kingdom 9,8 9,3 Germany 8,5 7,2 Germany 7,3 7,6 United kingdom 4,8 5,2 5 BLEU 3,3 5,5 Japan 1, 4,9 Japan 6,9 4,5 Ireland 1,8 4,4 3 Hong Kong 2,9 4,5 China 1,7 4,1 India,7 3,6 BLEU 2,7 4, 1 China 1,5 3,5 Italy 4,9 3,9 1 Ireland,4 3,4 France 4,6 3,3 3 France 5,5 3,3 Spain 2,2 3,1 Total 1 57,7 61,7 Total 1 52,1 53, United States United Kingdom Hong Kong BLEU Switzerland Russian federation Angola Italy South Korea Saudi Arabia Source : CEPII, CHELEM-Balance of Payments database. *Other than Transportation and Travel 54
55 1 Major Countries in International Trade Communication World Economic Overview (% of world trade in communication) Exports Imports Trade Balances (the five largest surpluses and deficits) Country Country United States 16, 11,6 United States 3,5 1,4 United Kingdom 7,5 9,2 United Kingdom 7,8 9,5 BLEU 5, 8,7 Germany 1,1 9,2 Koweit, 8,4 BLEU 1,7 6,4 Germany 7,4 5,9 Netherlands 2,3 5,3 Gfrance 2,4 5,6 France 2,3 5,2 Netherlands 2,5 5,4 Spain 1,6 4,2 Canada 5,6 2,8 Sweden 2,6 3,1 Spain 2,1 2,5 Italy 3,6 3, Sweden 3,5 2,4 Russia 1,2 2,6 Total 1 52,1 62,6 Total 1 63,7 59, Koweit BLEU United States France United Kingdom Angola Irland Spain Saudi Arabia Germany Source : CEPII, CHELEM-Balance of Payments database. 55
56 1 Major Countries in International Trade Construction World Economic Overview (% of world trade in construction) Exports Imports Trade Balances (the five largest surpluses and deficits) Country Country Germany 13,4 15,4 Japan 19,9 15,2 15 Japan 2,3 14,8 Germany 22,5 13,2 China 1,5 11,2 China 4,4 7,8 1 France 1,2 8,3 Italy 4,6 6,9 United States 9, 8,1 Angola, 6,2 5 Spain 1,4 5, Russia 2,9 5,9 Russia,2 3,9 France 6,7 4,5 Netherlands 8,5 3,5 Saudi Arabia, 4,4 Italy 8,6 3,5 Spain,8 3,1 5 United Kingdom 1,1 2,9 Netherlands 6,8 2,9 Total 1 74,3 76,6 Total 1 68,8 7, United States France China Germany Spain Russian federation Kazakhstan Italy Saudi Arabia Angola Source : CEPII, CHELEM-Balance of Payments database. 56
57 1 Major Countries in International Trade Insurance World Economic Overview (% of world trade in insurance) Exports Imports Trade Balances (the five largest surpluses and deficits) Country Country United States 9, 18,7 United States 16, 37,4 United Kingdom 22, 15, China 2,8 7,7 4 1 Ireland, 13,5 Mexico 11, 7,2 Switzerland 6,5 6,9 Ireland,5 6, 6 Germany 7,7 6,4 Canada 7,9 3,8 11 BLEU 3,9 5,7 Japan 5,5 3,5 16 Canada 9, 4,9 India 1,8 2,7 21 Singapore 1,9 3, Germany 5, 2,3 Spain 1,7 2,4 Italy 4,9 2, 26 China,7 2, BLEU 2,1 2, 31 Total 1 62,4 78,6 Total 1 57,4 74, United Kingdom Switzerland Ireland Germany BLEU India Japan Mexico China United States Source : CEPII, CHELEM-Balance of Payments database. 57
58 1 Major Countries in International Trade Finance World Economic Overview (% of world trade in finance) Exports Imports Trade Balances (the five largest surpluses and deficits) Country Country United States 17,4 23,4 BLEU 9,9 19,8 28 United Kingdom 28,7 22,6 United States 11,7 16, BLEU 8,1 16,4 United Kingdom 1,7 9,4 23 Switzerland 1,3 6,8 Germany 4,9 6, Germany 4,7 5, Ireland, 5,6 18 Singapore 7,2 3,5 Spain 2,2 4,4 Ireland 3,4 India 3,7 13 Italy 6,4 3,2 Canada 4,4 3,4 8 Japan 3,1 2, Italy 17,5 3, Spain 1,6 1,9 Japan 9,4 3, 3 Total 1 87,6 88,2 Total 1 7,8 74, United Kingdom United States BLEU Switzerland Singapore Russian federation Poland Slovakia Ukraine Canada Source : CEPII, CHELEM-Balance of Payments database. 58
59 1 Major Countries in International Trad Computer & Information (% of world trade in computer & information) Exports Imports Country Country India 24,1 United States 5,1 19,5 Ireland 17,4 Germany 2,6 13,8 21 Germany 11,8 7,5 United kingdom 4,4 7, 16 United States 18,9 6,9 Netherlands 4,6 6,5 United Kingdom 12,1 5,9 Japan 23,3 4,3 11 Israel 5,8 4, BLEU 5,4 4,2 6 Sweden 1,1 3,5 China 1,5 3,7 1 Finland 5,2 3,5 Brazil 1,4 3,2 4 China,5 3,4 Spain 5,7 3, Netherlands 4,4 3,2 Finland 4,5 3, 9 Total 1 59,9 79,3 Total 1 76,6 68, Trade Balances (the five largest surpluses and deficits) India Irland Israël united Kingdom Sweden Indonesia Italy Brazil Japan United States Source : CEPII, CHELEM-Balance of Payments database. 59
60 1 Major Countries in International Trade Royalties & License Fees World Economic Overview (% of world trade in royalties & license fees) Exports Imports Trade Balances (the five largest surpluses and deficits) Country Country United States 54,5 49,5 Ireland 6,7 18,5 3 Japan 12, 12, United States 15, 13,4 Germany 5,3 7,6 Japan 15,8 8,9 2 United Kingdom 11,1 7,1 Germany 9,4 7,5 France 3,4 5,2 Singapore 3,1 6,2 1 Netherlands 3,6 3, China,9 5,9 Sweden 1,6 2,6 United Kingdom 1,1 5, Canada 1,9 1,8 Canada 3,8 4,1 South Korea,4 1,8 South Korea 4, 3,7 1 BLEU 1,1 1,5 France 4,1 2,8 Total 1 94,9 91,9 Total 1 72,9 76, United States Japan France United Kingdom Sweden South Korea Canada Singapore China Ireland Source : CEPII, CHELEM-Balance of Payments database. 6
61 1 Major Countries in International Trade Other Business Services World Economic Overview (% of world trade in other business services) Exports Imports Country Country United States 12,5 11,3 Germany 8,5 8,7 5 Germany 7,5 9,5 United States 7,5 8,3 United Kingdom 7,8 9, Italy 5,7 6, 3 China 2,7 5,7 United Kingdom 3,7 6, Japan 7, 5,3 Ireland 2,2 5,6 1 BLEU 2,9 5, Japan 1,6 5,2 Singapore 2,7 4,4 China 2, 4,6 1 France 6,9 4,2 France 5,3 4,5 Netherlands 4,5 4, Spain 2,3 4,3 3 Italy 4,9 3,9 BLEU 2,6 4, Total 1 59,4 62,4 Total 1 5,4 57,2 5 7 Trade Balances (the five largest surpluses and deficits) United States United Kingdom Singapore Switzerland China Saudi Arabia Angola Ireland Italy South Korea Source : CEPII, CHELEM-Balance of Payments database. 61
62 1 Major Countries in International Trade Culture World Economic Overview (% of world trade in culture) Exports Imports Trade Balances (the five largest surpluses and deficits) Country Country United States 27,1 38, France 11, 11,5 United Kingdom 1,3 8,7 Germany 15,6 9, France 1,8 5,2 Canada 7,3 6,9 Canada 8,2 5,2 Italy 6,6 6,6 Spain 2,7 4,7 Spain 7,7 6,4 BLEU 3,1 4,6 United States,9 6,3 Germany 1,1 3,3 BLEU 4,2 5,4 Italy 3,4 3,3 Japan 6,6 3,5 Hungary,5 2,9 Brazil 1,8 3,1 Netherlands 3,5 2,2 Hungary,2 3, Total 1 7,7 78, Total 1 61,9 61, United States United Kingdom Turkey Malta Sweden Spain Italy Japan France Germany Source : CEPII, CHELEM-Balance of Payments database. 62
63 1 Major Countries in International Trade Government Services World Economic Overview (% of world trade in government ervices) Exports Imports Trade Balances (the five largest surpluses and deficits) Country Country United States 46, 33, United States 25,6 28, Germany 11,3 7, Saudi Arabia 21,1 22,5 United Kingdom 3,9 5, United Kingdom 5,6 4,7 BLEU 3, 3,9 Brazil 1,6 2,3 Netherlands 2,7 3,7 Koweit 2, 1,8 Japan 2,5 3,7 Mexico 1,4 1,8 Switzerland 1,8 2,6 Russia, 1,8 Canada 1,9 2,4 Italy,5 1,7 Brazil 1,1 2,2 Japan 2,5 1,4 Pakistan,4 2,2 Morocco,8 1,3 Total 1 74,6 65,7 Total 1 61,1 67, Germany BLEU Netherlands Switzerland Bangladesh Russian federation Mexico United Kingdom United States Saudi Arabia Source : CEPII, CHELEM-Balance of Payments database. 63
64 Part three : Specialization 64
65 Indicators The indicators used in this study were chosen on the basis of the experience gained in earlier CEPII work and after thorough comparison of the methods generally used in this field. 1
66 Revealed comparative advantages Revealed comparative advantage 1 If Vijk represents the flow from exporting country i to importing country j of product k, the summation of the indices is as follows: X ik V i. k exports from country i of product k M jk V. jk imports into country j of product k W k V.. k world trade in product k 1
67 For country i and product k, the balance is first calculated in relation to Gross Domestic Product at current exchange rate Y, giving (in thousandths): y ik 1 X ik M Y i ik The contribution of product k to the trade balance, in relation to GDP, is defined by: where: fik yik gik * yi. g ik X M and ik ik i 1 * X i M i y X i M Y i i In addition, it is necessary to eliminate the influence of changes which are not specific to the country in question but result from the evolution of the importance of the product in world trade. In relation to a base year (r) the flows X and M in the other years (n) are adjusted by multiplying them all by: e n k W W r k r. : W W n k n. The comparative advantage indicator f ' is therefore calculated using world weights for the base year (r). For this year it is identical to the relative contribution f. For the other years (n) the difference is all the greater, the more world trade in product k diverges from the average tendency for all merchandise. Comparative advantages are calculated for individual products at the most detailed level of the CHELEM sectoral classification. The advantage by chain or by stage or production is then calculated by summing. 1
68 Revealed comparative advantage 2 The formulas are described below, with V ijk indicating the flow from exporting country i, to importing country j for product k. The summations of the various indices are given as: X ik V i. k Exports form country i of product k X V Exports form country i of all goods and services i. i.. M jk V. jk Imports by country j of product k M V Imports of country j of all goods and services j.. j. W k V.. k World trade of product k 1
69 This indicator is expressed in thousandths of PPP GDP in current dollars of country i, designated by Y i. It depends on the spread between the market position of product k and the global position, given by the following formula: F ik 1 W Y k i S ik 1 S i. 1 Furthermore, it is necessary to eliminate the influence of changes which are not specific to the country studied, but which follow from the evolution of the weight of the production in international trade. By referring to a base year (r), the flows for X and M are thus corrected for other years (n), by multiplying them all by: e ( r ) ( n) ( n) W k W k k ( r ) ( n) W. W. The revealed comparative advantage is calculated at the most detailed level of the CHELEM categories and products. The standard deviation of the advantages/disadvantages per category provides a global measure of the degree of specialisation. The advantages/disadvantages by chain or by stage of production are obtained by summing these two categories. Defined in this way, the indicator corresponds to a contribution to the overall balance for goods and service. Indeed, this leads to: F F ik ik 1 1 Y i W Y k i W k X ik X ik W M k ik M ik W. X i. X W i.. M i. M i. 1
70 It is thus close to the definition used previously (revealed comparative advantage, first version). However, three differences should be noted: the weighting used here is based on world trade, and not only according to the changes of a single country; GDP in current dollars is expressed here at world prices, i.e. the purchasing power parity with respect to the whole of the world, and not simply the current exchange rate; the overall balance includes services, and is not just limited to trade in goods. 1
71 United States specialization Revealed comparative advantages thousandths of 25 PPP GDP in current dollars Services Agriculture Strong points 1967 thousandts of GDP in current dollars Weak points Vehicles components 1,9 Crude oil -2,4 Computer equipment 1,4 Cars and cycles -2,3 Engines 1,3 Refined petroleum products -1,8 Aeronautics 1,1 Natural gas -1,5 Electronic components 1,1 Consumer electronics -,8 Precision instruments 1, Non ferrous metals -,8 Plastic articles,8 Iron Steel -,7 Construction equipment,8 Leather -,6 Telecommunications equipment,7 Jewellery, works of art -,6 Pharmaceuticals,7 Meat -,6 5 Strong points 21 thousandths of GDP in current dollars Weak points Industry Energy Mining Plastic articles 2,7 Crude oil -12,6 Precision instruments 2,3 Computer equipment -3,5 Engines 2,1 Cars and cycles -3, Refined petroleum products 1,8 Telecommunications equipment -2,9 Other edible agricultural prod 1,8 Consumer electronics -1,8 Cereals 1,7 Knitwear -1,7 Electronic components 1,5 Leather -1,4 Basic organic chemicals 1,3 Clothing -1,4 Non ferrous ores 1,3 Furniture -1, Construction equipment 1,3 Domestic electrical appliances -,5 Source : CEPII, CHELEM-International Trade, CHELEM-GDP and CHELEM-Balance of Payments databases 71
72 Canada specialization World Economic Overview Revealed comparative advantages Strong points 1967 thousandts of GDP in current dollars Weak points thousandths of 25 PPP GDP in current dollars Energy Mining Agriculture Services Industry Natural gas 23,1 Vehicles components -17,7 Paper 12,8 Electrical apparatus -5, Non ferrous metals 8,5 Miscellaneous hardware -4,3 Cars and cycles 7,1 Plastic articles -4, Iron ores 5, Computer equipment -4, Non ferrous ores 3,8 Engines -3,4 Crude oil 3,4 Refined petroleum products -3,2 Cereals 2,2 Electronic components -2,8 Commercial vehicles 1,6 Precision instruments -2,6 Meat 1,5 Miscellaneous manuf. articles -2,5 Strong points 21 thousandths of GDP in current dollars Weak points Crude oil 2, Commercial vehicles -7,8 Natural gas 8,8 Computer equipment -5,9 Cars and cycles 7,8 Electrical apparatus -5,3 Paper 7,2 Miscellaneous hardware -5,1 Non ferrous metals 7,1 Engines -4,8 Non-monetary gold 4,1 Vehicles components -4,7 Refined petroleum products 4,1 Telecommunications equipment -4,3 Coals 4, Miscellaneous manuf. articles -4,3 Aeronautics 3,7 Pharmaceuticals -3,6 Cereals 3,3 Consumer electronics -3, Source : CEPII, CHELEM-International Trade, CHELEM-GDP and CHELEM-Balance of Payments databases 72
73 France specialization World Economic Overview Revealed comparative advantages Strong points 1967 thousandts of GDP in current dollars Weak points thousandths of 25 PPP GDP in current dollars Services Industry Agriculture Cars and cycles 3,6 Crude oil -15,8 Refined petroleum products 2,5 Other edible agricultural prod -1,6 Pharmaceuticals 2,4 Coals -1,6 Electrical apparatus 1,6 Furniture -1,4 Rubber articles (incl. tyres) 1,4 Non ferrous metals -1,2 Beverages 1,4 Electronic components -1,2 Toiletries 1,2 Meat -1, Vehicles components 1,2 Precision instruments -,8 Leather 1,1 Non-edible agricultural prod. -,6 Iron Steel 1, Paper -,6 1 Strong points 21 Weak points 2 thousandths of GDP in current dollars Energy Mining Aeronautics 12,8 Crude oil -12,7 Pharmaceuticals 5, Natural gas -4,1 Toiletries 4,9 Computer equipment -3, Beverages 4,5 Refined petroleum products -2,8 Vehicles components 3,4 Cars and cycles -2,4 Cereals 3, Knitwear -2,3 Engines 2,6 Clothing -1,9 Fats 1,6 Furniture -1,9 Iron Steel 1, Consumer electronics -1,5 Paints,9 Telecommunications equipment -1,5 Source : CEPII, CHELEM-International Trade, CHELEM-GDP and CHELEM-Balance of Payments databases 73
74 Germany specialization World Economic Overview Revealed comparative advantages thousandths of 25 PPP GDP in current dollars Industry Agriculture Services Energy Mining Strong points thousandts of GDP in current dollars Cars and cycles 8,4 Crude oil -18,3 Electrical apparatus 5,8 Other edible agricultural prod -5,8 Specialized machines 5,5 Non ferrous metals -4,6 Pharmaceuticals 5, Refined petroleum products -4,6 Engines 4,7 Meat -2,5 Plastic articles 4,4 Knitwear -2,4 Miscellaneous hardware 4,4 Paper -2,2 Vehicles components 3,3 Non ferrous ores -2,2 Telecommunications equipment 2,6 Iron ores -2, Basic organic chemicals 2,4 Clothing -2, Strong points thousandths of GDP in current dollars Weak points Weak points Cars and cycles 22,9 Crude oil -16,8 Specialized machines 8, Natural gas -8,9 Engines 5,5 Other edible agricultural prod -7,1 Precision instruments 4,8 Computer equipment -5,2 Miscellaneous hardware 4,7 Refined petroleum products -4,6 Commercial vehicles 3,5 Electronic components -4, Plastic articles 3,5 Knitwear -3,3 Vehicles components 3,4 Clothing -2,9 Construction equipment 3,1 Non ferrous metals -2,9 Pharmaceuticals 2,6 Leather -2,7 Source : CEPII, CHELEM-International Trade, CHELEM-GDP and CHELEM-Balance of Payments databases 74
75 Italy specialization World Economic Overview Revealed comparative advantages thousandths of 25 PPP GDP in current dollars Industry Strong points 1967 thousandts of GDP in current dollars Weak points Refined petroleum products 8,4 Crude oil -24,4 Knitwear 6,6 Meat -3,7 Leather 4,7 Iron ores -2,8 Cars and cycles 4,2 Non ferrous metals -2,7 Computer equipment 3,9 Electronic components -2,4 Domestic electrical appliances 3,2 Non-edible agricultural prod. -1,9 Plastic articles 2,4 Coals -1,8 Engines 1,8 Iron Steel -1,7 Miscellaneous hardware 1,5 Fats -1,6 Furniture 1,5 Paper -1,1 Services Agriculture Strong points 21 thousandths of GDP in current dollars Weak points Energy Mining Miscellaneous hardware 9, Crude oil -21,2 Specialized machines 8,9 Natural gas -11,6 Engines 7,7 Cars and cycles -7,7 Refined petroleum products 5,5 Electronic components -5, Leather 4,5 Computer equipment -3,4 Furniture 4,1 Meat -3,3 Vehicles components 3,8 Non ferrous metals -3,1 Machine tools 3,3 Basic organic chemicals -2,8 Yarns fabrics 3, Electricity -1,9 Beverages 2,9 Consumer electronics -1,8 Source : CEPII, CHELEM-International Trade, CHELEM-GDP and CHELEM-Balance of Payments databases 75
76 United Kingdom specialization World Economic Overview Revealed comparative advantages thousandths of 25 PPP GDP in current dollars Strong points 1967 thousandts of GDP in current dollars Weak points Services Cars and cycles 5,9 Crude oil -16,1 Vehicles components 5,1 Refined petroleum products -5,9 Engines 4,9 Other edible agricultural prod -3,5 Pharmaceuticals 4,8 Fats -3,5 Telecommunications equipment 4,3 Natural gas -3,3 Electrical apparatus 4,2 Meat -2,7 Miscellaneous hardware 2,8 Non ferrous ores -2,6 Commercial vehicles 2,5 Paper -2,4 Electrical equipment 2, Non ferrous metals -2,1 Specialized machines 1,7 Preserved meat/fish -1,9 2 Strong points 21 Weak points Energy Mining Agriculture Industry thousandths of GDP in current dollars Pharmaceuticals 7,5 Non-monetary gold -9,8 Aeronautics 5,3 Computer equipment -3,2 Jewellery, works of art 5, Other edible agricultural prod -3,1 Refined petroleum products 3,4 Knitwear -2,8 Engines 2,8 Clothing -2,2 Precision instruments 2,4 Leather -2,1 Construction equipment 1,5 Consumer electronics -2,1 Paints 1,5 Vehicles components -2, Beverages 1,5 Telecommunications equipment -1,9 Printing 1,4 Furniture -1,7 Source : CEPII, CHELEM-International Trade, CHELEM-GDP and CHELEM-Balance of Payments databases 76
77 Turkey specialization Revealed comparative advantages thousandths of 25 PPP GDP in current dollars Services Strong points 1967 thousandts of GDP in current dollars Weak points Other edible agricultural prod 6, Vehicles components -1,3 Non-edible agricultural prod. 2, Engines -1, Animal food 1, Crude oil -,8 Non ferrous ores,6 Electrical apparatus -,8 Non ferrous metals,5 Plastic articles -,6 Meat,2 Basic organic chemicals -,6 Fats,2 Miscellaneous hardware -,5 Sugar,2 Specialized machines -,5 Unprocessed minerals n.e.s.,2 Pharmaceuticals -,5 Preserved fruits,1 Telecommunications equipment -,4 1 Strong points 21 Weak points Agriculture Industry Energy Mining thousandths of GDP in current dollars Knitwear 11,3 Crude oil -1,2 Clothing 6,4 Iron ores -7,7 Other edible agricultural prod 5,4 Refined petroleum products -5,6 Iron Steel 4,8 Pharmaceuticals -4,1 Carpets 4,7 Plastic articles -3,7 Commercial vehicles 4,6 Basic organic chemicals -3,6 Domestic electrical appliances 3,7 Telecommunications equipment -3,2 Cement 3,1 Computer equipment -3,2 Miscellaneous hardware 2,9 Non ferrous metals -3,1 Preserved fruits 2,8 Coals -3, Source : CEPII, CHELEM-International Trade, CHELEM-GDP and CHELEM-Balance of Payments databases 77
78 Japan specialization World Economic Overview Revealed comparative advantages Strong points 1967 thousandts of GDP in current dollars Weak points 15 1 thousandths of 25 PPP GDP in current dollars Industry Consumer electronics 6,4 Crude oil -16,2 Ships 4,6 Iron ores -6, Cars and cycles 3,9 Refined petroleum products -5,7 Electrical apparatus 3,4 Non ferrous ores -3,9 Optics 3,1 Non-edible agricultural prod -2,9 Miscellaneous hardware 2,7 Coals -2,6 Miscellaneous manuf. articles 2,6 Non ferrous metals -2,4 Plastic articles 2,6 Computer equipment -2,2 Telecommunications equipment 2,5 Natural gas -2,2 Yarns fabrics 2,4 Pharmaceuticals -2,2 5 Strong points 21 thousandths of GDP in current dollars Weak points Agriculture Services Energy Mining Cars and cycles 14,6 Crude oil -19,8 Specialized machines 5,2 Natural gas -8,5 Engines 5,1 Coals -3,8 Vehicles components 5, Non ferrous ores -3,5 Iron Steel 4,6 Meat -2,9 Electrical apparatus 4,2 Knitwear -2,4 Ships 3,9 Clothing -2,3 Electronic components 3,2 Pharmaceuticals -2,2 Miscellaneous hardware 2,7 Leather -2, Plastic articles 2,6 Iron ores -1,9 Source : CEPII, CHELEM-International Trade, CHELEM-GDP and CHELEM-Balance of Payments databases 78
79 South African Union specialization World Economic Overview Revealed comparative advantages Strong points 1967 thousandts of GDP in current dollars Weak points thousandths of 25 PPP GDP in current dollars Energy Mining Jewellery, works of art 35,8 Cars and cycles -9,4 Non ferrous ores 18,2 Telecommunications equipment -7,9 Non ferrous metals 14,5 Electrical apparatus -7,3 Preserved fruits 9,8 Plastic articles -6,4 Sugar 8,5 Engines -6,2 Iron Steel 8,3 Vehicles components -6,1 Other edible agricultural prod 6, Computer equipment -5, Iron ores 4,8 Commercial vehicles -4,1 Non-edible agricultural prod. 4,6 Electrical equipment -3,5 Cereals 3,6 Miscellaneous hardware -3,5 Agriculture Services Industry Strong points 21 thousandths of GDP in current dollars Weak points Non ferrous metals 3,3 Crude oil -23,9 Non ferrous ores 16,1 Telecommunications equipment -7,1 Iron Steel 15,1 Computer equipment -6,9 Iron ores 13,9 Refined petroleum products -5,7 Jewellery, works of art 13,5 Pharmaceuticals -5,3 Coals 12,1 Vehicles components -5,2 Non-monetary gold 7,5 Electrical apparatus -3,9 Other edible agricultural prod 6,7 Miscellaneous hardware -3,8 Basic inorganic chemicals 2,2 Miscellaneous manuf. articles -3, Beverages 1,7 Precision instruments -2,9 Source : CEPII, CHELEM-International Trade, CHELEM-GDP and CHELEM-Balance of Payments databases 79
80 Mexico specialization World Economic Overview Revealed comparative advantages Strong points 1967 thousandts of GDP in current dollars Weak points thousandths of 25 PPP GDP in current dollars Crude oil 3,6 Telecommunications equipment -3,9 Meat 3, Engines -2,4 Other edible agricultural prod 2,9 Vehicles components -2, Pharmaceuticals 2,9 Cars and cycles -1,5 Non ferrous metals 2,2 Specialized machines -1,4 Sugar 1,8 Computer equipment -1,3 Non-edible agricultural prod. 1,3 Electrical apparatus -1, Unprocessed minerals n.e.s. 1, Natural gas -,9 Non ferrous ores,9 Precision instruments -,9 Cereals,9 Miscellaneous hardware -, Energy Mining Industry Agriculture Services Strong points 21 thousandths of GDP in current dollars Weak points Crude oil 3,3 Refined petroleum products -13,5 Consumer electronics 15,3 Plastic articles -1,2 Cars and cycles 13,3 Electronic components -6,7 Commercial vehicles 12,6 Basic organic chemicals -6,6 Precision instruments 4,7 Optics -5,2 Non-monetary gold 4, Miscellaneous hardware -5, Other edible agricultural prod 3,7 Paper -4,1 Furniture 3,4 Iron Steel -3,9 Domestic electrical appliances 3, Vehicles components -3,6 Beverages 2,5 Yarns fabrics -3,2 Source : CEPII, CHELEM-International Trade, CHELEM-GDP and CHELEM-Balance of Payments databases 8
81 Brazil specialization World Economic Overview Revealed comparative advantages thousandths of 25 PPP GDP in current dollars Strong points 1967 thousandts of GDP in current dollars Weak points Energy Mining Agriculture Other edible agricultural prod 11,8 Crude oil -6, Iron ores 5, Natural gas -2,8 Sugar 2,4 Telecommunications equipment -1,7 Non-edible agricultural prod. 2, Electrical apparatus -1,2 Preserved fruits 1,4 Engines -1,1 Animal food 1, Basic organic chemicals -1,1 Non ferrous ores,9 Refined petroleum products -1,1 Iron Steel,7 Miscellaneous hardware -,9 Toiletries,6 Precision instruments -,8 Meat,5 Non ferrous metals -,8 5 Strong points 21 thousandths of GDP in current dollars Weak points Services Industry Iron ores 13,3 Refined petroleum products -4,1 Other edible agricultural prod 8,9 Fertilizers -2,8 Sugar 5,2 Cars and cycles -2,8 Crude oil 4,8 Telecommunications equipment -2,8 Meat 4,2 Pharmaceuticals -2,3 Paper 1,8 Computer equipment -2,1 Animal food 1,6 Electrical apparatus -2,1 Non ferrous ores 1,3 Natural gas -2, Iron Steel 1, Specialized machines -2, Leather,9 Plastic articles -1,8 Source : CEPII, CHELEM-International Trade, CHELEM-GDP and CHELEM-Balance of Payments databases 81
I. World trade in Overview
 I. World trade in - Overview Table I.1 Growth in the volume of world merchandise exports and production, 2-5 (Annual percentage change) 2-5 23 24 World merchandise exports 4.5 5. 9.5 6. Agricultural products
1. INTERNATIONAL OVERVIEW. 1.0 Area and population. population (1,000) area
 area") 1.0 Area and population area population (1,000) km 2 2000 2010 2018 1 inhabitants per km 2 Belgium 30,530 10,251 10,920 11,443 375 Germany 357,380 82,212 81,777 82,952 232 Estonia 45,230 1,397 1,331 1,315
1.0 Area and population area population (1,000) km 2 2000 2010 2018 1 inhabitants per km 2 Belgium 30,530 10,251 10,920 11,443 375 Germany 357,380 82,212 81,777 82,952 232 Estonia 45,230 1,397 1,331 1,315
BP Statistical Review of World Energy June 2017
 BP Statistical Review of World Energy June 217 Primary energy 8 Consumption 8 Consumption by fuel 9 66 th edition Primary energy Consumption* Growth rate per annum Million tonnes oil equivalent 26 27 28
Primary energy. 8 Consumption 9 Consumption by fuel. 67 th edition
 Primary energy 8 Consumption 9 Consumption by fuel 67 th edition Primary energy Consumption* Growth rate per annum Million tonnes oil equivalent 27 28 29 2 211 212 213 214 215 216 217 217 26-16 Share 217
exports of goods annual change (%)
") 12.0 Austria s foreign trade 2015 by world region imports of goods 2015 exports of goods 2015 region 1 1 share (%) share (%) Europe 106,984 80.4 104,032 79.1 EU 93,686 70.4 90,841 69.1 EFTA 8,020 6.0 8,098
12.0 Austria s foreign trade 2015 by world region imports of goods 2015 exports of goods 2015 region 1 1 share (%) share (%) Europe 106,984 80.4 104,032 79.1 EU 93,686 70.4 90,841 69.1 EFTA 8,020 6.0 8,098
exports of goods annual change (%)
") 12.0 Austria s foreign trade 2016 by world region imports of goods 2016 exports of goods 2016 region 1 1 share (%) share (%) Europe 110,067 81.2 104,271 79.5 EU 96,801 71.4 91,112 69.4 EFTA 7,718 5.7 8,132
12.0 Austria s foreign trade 2016 by world region imports of goods 2016 exports of goods 2016 region 1 1 share (%) share (%) Europe 110,067 81.2 104,271 79.5 EU 96,801 71.4 91,112 69.4 EFTA 7,718 5.7 8,132
Total credit to the non-financial sector (core debt), % of GDP Table F1.1
, % of GDP Table F1.1") Total credit to the non-financial sector (core debt), % of GDP Table F1.1 2012 2013 2014 2015 2016 Q2 16 Q3 16 Q4 16 Q1 17 Q2 17 Argentina 62.6 66.4 64.6 75.5 75.3 81.7 80.1 75.3 71.6 72.7 Australia 208.0
Total credit to the non-financial sector (core debt), % of GDP Table F1.1 2012 2013 2014 2015 2016 Q2 16 Q3 16 Q4 16 Q1 17 Q2 17 Argentina 62.6 66.4 64.6 75.5 75.3 81.7 80.1 75.3 71.6 72.7 Australia 208.0
Natural gas. 26 Reserves 28 Production and consumption 33 Prices 34 Trade movements. 67 th edition
 Natural gas 26 Reserves 28 Production and consumption 33 Prices 34 Trade movements 67 th edition Natural gas Total proved reserves At end 1997 At end 2007 At end 2016 At end Trillion Trillion Trillion
World real merchandise trade grows faster than output
 I. I. world trade developments 8 Merchandise trade and GDP World real merchandise trade grows faster than output In 2006, the volume of world merchandise trade grew by 8 per cent while world gross domestic
Introductory text 225. Table 14.1 Goods Exports and Imports summary analysis 227. Table 14.2 Goods Exports by country of destination 228
 14 External Trade Exports for 2012 were 92,009m, up 1% from 2011, while Imports were 49,024m, up 1.5%. This resulted in a Trade surplus of 42,985m up marginally (0.2%) from 2011. Chemicals and related
AUSTRIA. Table 1. FDI flows in the host economy, by geographical origin. (Millions of US dollars)
") Table 1. FDI flows in the host economy, by geographical origin World 5 690 138 6 195 3 184 10 784 7 933 31 154 6 858 9 303 840 10 618 5 760 Developed economies 5 740 13 5 341 2 689 10 137 6 291 29 721
Table 1. FDI flows in the host economy, by geographical origin World 5 690 138 6 195 3 184 10 784 7 933 31 154 6 858 9 303 840 10 618 5 760 Developed economies 5 740 13 5 341 2 689 10 137 6 291 29 721
WORLD MOTOR VEHICLE PRODUCTION BY COUNTRY AND TYPE QUARTERS June 14, 2018
 QUARTERS 2017-2018 June 14, 2018 CONTENTS BASEPROTOTAL BASEPROCARS BASEPROLCV BASEPROHCV BASEPROBC Summation of cars, LCVs, HCVs, heavy buses Cars LCVs HCVs Heavy buses Note: The production of cars and
External and intra-european Union trade
 ISSN 1606-3481 External and intra-european Union trade Data 2004 09 2010 edition Pocketbooks External and intra-european Union trade Data 2004 09 2010 edition Europe Direct is a service to help you find
Coal. 36 Reserves and prices 38 Production and consumption. 67 th edition
 Coal 36 Reserves and prices 38 Production and consumption 67 th edition Total proved reserves at end 217 Million tonnes Anthracite and bituminous Subbituminous and lignite US 228 3116 25916 24.2% 357 Canada
Table B1. Advanced Economies: Unemployment, Employment, and Real per Capita GDP (Percent)
") Statistical Appendix Table B1. Advanced Economies: Unemployment, Employment, and Real per Capita GDP (Percent) Unemployment Rate 2 Averages 1 1993 2002 2003 12 Advanced Economies 6.8 6.9 6.7 6.5 6.3 5.8
Statistical Appendix Table B1. Advanced Economies: Unemployment, Employment, and Real per Capita GDP (Percent) Unemployment Rate 2 Averages 1 1993 2002 2003 12 Advanced Economies 6.8 6.9 6.7 6.5 6.3 5.8
67 th edition. Renewable energy. Appendices. 44 Other renewables consumption 45 Biofuels production
 Renewable energy 44 Other renewables consumption 45 Biofuels production Appendices A1 Solar Generation A2 Wind Generation A3 Geothermal, biomass and other Generation A4 Geothermal Cumulative installed
World Geographic Shares
 World Geographic Shares North America South America Europe Africa Asia Australia/ Oceania 18% 13% 7% 22% 33% 6% World Population Shares North America South America Europe Africa Asia Australia/ Oceania
European Union, Trade in goods with Malaysia
 European Union, Trade in goods with Malaysia Table of Contents pg - Key Figures 2 - / 2017 2 - - AMA/NAMA product Groups 2 - - SITC product Groups 2 - - Top 5 - HS sections 2 - - Top 5 - SITC sections
Executive Summary International Trade Report. December 2018 MINISTRY OF INDUSTRY,TRADE AND TOURISM GOVERNMENT OF SPAIN
 Executive Summary International Trade Report December 2018 GOVERNMENT OF SPAIN MINISTRY OF INDUSTRY,TRADE AND TOURISM Report prepared by the Deputy Directorate-General for Studies andtrade Policy Evaluation.
European Union, Trade in goods with New Zealand
 Union, Trade in goods with New Zealand Table of Contents pg Union, Trade with New Zealand - Key Figures 2 - / 2018 2 - - AMA/NAMA product Groups 2 - - SITC product Groups 2 - - Top 5 - HS sections 2 -
FEDERAL RESERVE statistical release
 FEDERAL RESERVE statistical release FOR IMMEDIATE RELEASE MARCH 16, 1992 E.U C1Z1, GEOGRAPHICAL r DISTRIBUTION n OF e ASSETS AND^LIABILITIES (IN MILLIONS OF DOLLARS) ASSETS COUNTRY OF CUSTOMER 12/31/90
Export Oriented Enterprises (EOE) 1st Quarter Introduction This issue of Economic and Social Indicators (ESI) presents the results of the
 1st Quarter Introduction This issue of Economic and Social Indicators (ESI) presents the results of the") Export Oriented Enterprises (EOE) 1st Quarter 2018 1. Introduction This issue of Economic and Social Indicators (ESI) presents the results of the Quarterly Survey of Employment among Export Oriented Enterprises
Export Oriented Enterprises (EOE) 1st Quarter 2018 1. Introduction This issue of Economic and Social Indicators (ESI) presents the results of the Quarterly Survey of Employment among Export Oriented Enterprises
SWITZERLAND October 2011
 UNITED NATIONS CONFERENCE ON TRADE AND DEVELOPMENT INVESTMENT COUNTRY PROFILES SWITZERLAND October 2011 i NOTE The Division on Investment and Enterprise of UNCTAD is a global centre of excellence, dealing
Export Oriented Enterprises (EOE) 3 rd Quarter Introduction This issue of Economic and Social Indicators (ESI) presents the results of the
 3 rd Quarter Introduction This issue of Economic and Social Indicators (ESI) presents the results of the") Export Oriented Enterprises (EOE) 3 rd Quarter 2017 1. Introduction This issue of Economic and Social Indicators (ESI) presents the results of the Quarterly Survey of Employment among Export Oriented Enterprises
Export Oriented Enterprises (EOE) 3 rd Quarter 2017 1. Introduction This issue of Economic and Social Indicators (ESI) presents the results of the Quarterly Survey of Employment among Export Oriented Enterprises
European Union, Trade in goods with Kuwait
 European Union, Trade in goods with Kuwait Table of Contents pg - Key Figures 2 - / 2017 2 - - AMA/NAMA product Groups 2 - - SITC product Groups 2 - - Top 5 - HS sections 2 - - Top 5 - SITC sections 2
STATISTISCHER ANHANG VORLÄUFIGE AUSGABE
 OECD-Wirtschaftsausblick Ausgabe 2013/1 OECD 2013 STATISTISCHER ANHANG VORLÄUFIGE AUSGABE Die statistischen Daten für Israel wurden von den zuständigen israelischen Stellen bereitgestellt, die für sie
European Union, Trade in goods with Israel
 Union, Trade in goods with Israel Table of Contents pg Union, Trade with Israel - Key Figures 2 - / 2017 2 - - AMA/NAMA product Groups 2 - - SITC product Groups 2 - - Top 5 - HS sections 2 - - Top 5 -
Export Oriented Enterprises (EOE) 2nd Quarter 2018
 2nd Quarter 2018") Export Oriented Enterprises (EOE) 2nd Quarter 2018 1. Introduction This issue of Economic and Social Indicators (ESI) presents the results of the Quarterly Survey of Employment among Export Oriented Enterprises
Export Oriented Enterprises (EOE) 2nd Quarter 2018 1. Introduction This issue of Economic and Social Indicators (ESI) presents the results of the Quarterly Survey of Employment among Export Oriented Enterprises
Information Technology and Economic Development: An Introduction to the Research Issues
 November 1998 Working Papers No. 153 Information Technology and Economic Development: An Introduction to the Research Issues TABLE 1 WORLD-WIDE INFORMATION TECHNOLOGY MARKET BREAKDOWN, 1995
Fresh Connections: Netherlands
 Fresh Connections: Netherlands SHIFTING TRADE WINDS: GEOPOLITICS, GLOBAL TRADE & YOU JULIEN MARCILLY CHIEF ECONOMIST APRIL 29, 215 Oil prices: Lower for longer 14 Oil price (Brent, source: OPEC) 12 Oil
Corn & Bean Producers-1
 Largest Corn Producing Countries - 2016 est. Largest Corn Importing Countries - 2016 est. (Marketing year - thousands of hectares, tons per hectare, and thousands of metric tons) (Marketing year - thousands
Spain s exports by oil product group and country of destination
 Corporación de Reservas Estratégicas de Productos Petrolíferos Castellana, 79 28046 Madrid T. +34 91 360 09 10 Updated F. +34 91 420 on39 45 www.cores.es February 13 th 2017 Spain s exports by oil product
European Union, Trade in goods with Jordan
 European Union, Trade in goods with Jordan Table of Contents pg - Key Figures 2 - / 2017 2 - - AMA/NAMA product Groups 2 - - SITC product Groups 2 - - Top 5 - HS sections 2 - - Top 5 - SITC sections 2
Fiche 1 Quelques données de la Banque Mondiale
 Fiche 1 Quelques données de la Banque Mondiale 274 WORLD DEVELOPMENT REPORT 2000 2001 Table 1. Size of the economy Surface Population area density Gross national product (GNP) GNP per capita GNP measured
European Union, Trade in goods with Tunisia
 European Union, Trade in goods with Tunisia Table of Contents pg - Key Figures 2 - / 2017 2 - - AMA/NAMA product Groups 2 - - SITC product Groups 2 - - Top 5 - HS sections 2 - - Top 5 - SITC sections 2
Global Dialysis - Cost per Dialysis Session
 Cost per session for dialysis where a cost has been entered for a dialysis centre. All costs have been converted to US Dollars as at 19 May 2006. Note that the costs do not state what is covered by a dialysis
Region, country or area Région, pays ou zone Total Total
 goods exports Exportations des produits manufacturés Total Total 1 Indices de valeur unitaire, $ des E.-U. 1 105 111 112 115 126 133 123 125 136 124 Indices de valeur unitaire, DTS 100 98 99 103 108 111
STATISTICAL ANNEX NOTE ON QUARTERLY PROJECTIONS
 OECD Economic Outlook, Volume 2017 Issue 1 OECD 2017 This annex contains data on key economic series which provide a background to the recent economic developments in the OECD area described in the main
Labor Productivity, Compensation Costs, and U.S. International Competitiveness
 Cornell University ILR School DigitalCommons@ILR Federal Publications Key Workplace Documents June 1993 Labor Productivity, Compensation Costs, and U.S. International Competitiveness U.S. Bureau of Labor
Global Summary Report Market for High Voltage Switchgear
 Global Summary Report Market for High Voltage Switchgear 2012-2022 GOULDEN REPORTS October 2016 No 1, Priorsfield, Marlborough,WiltshireSN8 4AQ, United Kingdom Tel: +44 1672 513316 Fax: +44 1672 513316
European Union, Trade in goods with Venezuela
 European Union, Trade in goods with Venezuela Table of Contents pg - Key Figures 2 - / 2017 2 - - AMA/NAMA product Groups 2 - - SITC product Groups 2 - - Top 5 - HS sections 2 - - Top 5 - SITC sections
(annual average compound growth rate)
") Table 3-1. 3KDVHVRI*URZWKE\0DMRU5HJLRQ (annual average compound growth rate) 1820-70 1870-1913 1913-50 1950-73 1973-92 1820-1992 GDP Western Europe 1.7 2.1 1.4 4.7 2.2 2.2 Western Offshoots 4.3 3.9 2.8
Table 3-1. 3KDVHVRI*URZWKE\0DMRU5HJLRQ (annual average compound growth rate) 1820-70 1870-1913 1913-50 1950-73 1973-92 1820-1992 GDP Western Europe 1.7 2.1 1.4 4.7 2.2 2.2 Western Offshoots 4.3 3.9 2.8
World Air Conditioner Demand by Region
 World Air Conditioner Demand by Region April 2015 The Japan Refrigeration and Air Conditioning Industry Association 1 World Air Conditioner Demand by Region April 2015 The Japan Refrigeration and Air Conditioning
European Union, Trade in goods with Brazil
 European Union, Trade in goods with Brazil Table of Contents pg - Key Figures 2 - / 2017 2 - - AMA/NAMA product Groups 2 - - SITC product Groups 2 - - Top 5 - HS sections 2 - - Top 5 - SITC sections 2
European Union, Trade in goods with Belarus
 Union, Trade in goods with Belarus Table of Contents pg Union, Trade with Belarus - Key Figures 2 - / 2017 2 - - AMA/NAMA product Groups 2 - - SITC product Groups 2 - - Top 5 - HS sections 2 - - Top 5
European Union, Trade in goods with Chile
 Union, Trade in goods with Chile Table of Contents pg Union, Trade with Chile - Key Figures 2 - / 2018 2 - - AMA/NAMA product Groups 2 - - SITC product Groups 2 - - Top 5 - HS sections 2 - - Top 5 - SITC
European Union, Trade in goods with Central America 6
 European Union, Trade in goods with Central America 6 Central America 6 Costa Rica, El Salvador, Guatemala, Honduras, Nicaragua, Panama Table of Contents pg - Key Figures 2 - / 2017 2 - - AMA/NAMA product
European Union, Trade in goods with Senegal
 European Union, Trade in goods with Senegal Table of Contents pg - Key Figures 2 - / 2017 2 - - AMA/NAMA product Groups 2 - - SITC product Groups 2 - - Top 5 - HS sections 2 - - Top 5 - SITC sections 2
European Union, Trade in goods with ACP - Caribbean Countries
 European Union, Trade in goods with ACP - Caribbean Countries ACP - Caribbean Countries Antigua and Barbuda, Bahamas, Barbados, Belize, Cuba, Dominica, Dominican Republic, Grenada, Guyana, Haiti, Jamaica,
Spain s exports by oil product group and country of destination. Year Corporación de Reservas Estratégicas de Productos Petrolíferos
 Corporación de Reservas Estratégicas de Productos Petrolíferos Castellana, 79 28046 Madrid T. +34 91 360 09 10 Updated F. +34 91 420 on39 45 www.cores.es July 13 th 2015 Spain s exports by oil product
FAPRI Food and Agricultural Policy Research Institute
 26 WORLD OUTLOOK Presentation Food and Agricultural Policy Research Institute Global Macroeconomic Overview Sustained and widespread real economic growth for the decade averaging 3.1%. Industrialized countries
European Union, Trade in goods with Peru
 European Union, Trade in goods with Peru Table of Contents pg - Key Figures 2 - / 2017 2 - - AMA/NAMA product Groups 2 - - SITC product Groups 2 - - Top 5 - HS sections 2 - - Top 5 - SITC sections 2 -
Civil Dialogue Group on WINE Thursday April 19th, 2018
 COMMISSION EUROPÉENNE DIRECTION GÉNÉRALE DE L'AGRICULTURE ET DU DÉVELOPPEMENT RURAL Directorate G. Markets and Observatories G.2. Wine, spirits and horticultural products Bruxelles, le G.2/GD(2017) Civil
Introductory text 221. Table 14.1 Goods Exports and Imports summary analysis 223. Table 14.2 Goods Exports by country of destination 224
 14 External Trade Exports for 2011 were 92,936m, up 4% from 2010, while imports were 48,238m, up 5%. This resulted in a trade surplus of 44,697m (+3%), the highest annual surplus on record. The EU accounted
Global Monthly February 2018
 Global Monthly February 18 3 1-year Treasury yields 1-year breakeven inflation rate 1 1 15 16 17 18 February 18 5 3 Global GDP growth Composite PMI (RHS) Index 56 5 5 1 5 1 13 1 15 16 17 18 3..5. 1.5 1.
GLOBAL SUMMARY REPORT Market for High Voltage Insulators & Bushings
 GLOBAL SUMMARY REPORT Market for High Voltage Insulators & Bushings 2010-2015 - 2025 GOULDEN REPORTS October 2016 No 1 Priorsfield, Marlborough, Wiltshire, SN84AQ. United Kingdom Tel: +44 1672 513316 Fax:
F Statistics on total credit to the non-financial sector
 F Statistics on total credit to the non-financial sector www.bis.org/statistics/totcredit.htm The BIS statistics on credit to the non-financial sector capture borrowing activity of the government sector
European Union, Trade in goods with Andean community 4
 European Union, Trade in goods with Andean community 4 Andean community 4 Bolivia, Colombia, Ecuador, Peru Table of Contents pg - Key Figures 2 - / 2017 2 - - AMA/NAMA product Groups 2 - - SITC product
CHARTS AND PRICE PROJECTIONS
 CHARTS AND PRICE PROJECTIONS 18 / Charts and Price Projections: FAPRI 28 Agricultural Outlook Average Annual GDP Growth, 27-217 Percent Change 1 8 8.4 7.92 6 4 4.44 3.67 4.6 4.34 2 2.37 2.17 1.38 2.44
External trade in goods of Montenegro January-December 2017 (p)
") Jan Feb Mar Apr May Jun Jul Aug Sep Oct Nov Dec MONTENEGRO STATISTICAL OFFICE R E L E A S E No: 7 Podgorica, January 25 th 2018 When using these data, please name the source External trade in goods of
Jan Feb Mar Apr May Jun Jul Aug Sep Oct Nov Dec MONTENEGRO STATISTICAL OFFICE R E L E A S E No: 7 Podgorica, January 25 th 2018 When using these data, please name the source External trade in goods of
European Union, Trade in goods with ACP - Caribbean Countries
 Union, Trade in goods with ACP - Caribbean Countries ACP - Caribbean Countries Antigua and Barbuda, Bahamas, Barbados, Belize, Cuba, Dominica, Dominican Republic, Grenada, Guyana, Haiti, Jamaica, St Kitts
Global Valuation Summary - SAMPLE PAGES
 - SAMPLE PAGES Regional Valuation Comparisons... 2... 4... 7... 9... 11 Developed Asia Pacific ex... 13 Developed Europe ex... 16 Advanced Emerging... 19 Appendix... 22 Disclaimer... 23 Global Market Valuations
Thermal Coal Market Presentation to UNECE Ad Hoc Group of Experts on Coal in Sustainable Development December 7, 2004
 Thermal Coal Market Presentation to UNECE Ad Hoc Group of Experts on Coal in Sustainable Development December 7, 2004 Barlow Jonker Pty Ltd Commercial in Confidence 1 Presentation Outline 1. Barlow Jonker
CHARTS AND PRICE PROJECTIONS
 CHARTS AND PRICE PROJECTIONS 18 / Charts and Price Projections: FAPRI 27 Agricultural Outlook Average Annual GDP Growth Percent Change 9 8 7 6 4 3 2 1 26-216 Canada China EU NMS EU- India Japan Latin America
Foreign trade: value and changes compared with previous year. Change in CHF mn and in % Period CHF mn Adjusted for working. unit CHF mn nominal
 Federal Department of Finance FDF Federal Customs Administration FCA Foreign Trade Statistics Press release Date: 3 February 2015 Swiss foreign trade Exports in 2014: new record Switzerland's goods exports
Table 13 Production, trade and supply of conventional crude oil Thousand metric tons; kilograms per capita; reserves production ratio (R/P) in years
 in years") , trade and supply of conventional crude oil Thousand metric tons; kilograms per capita; reserves production ratio (R/P) in years Table Notes The Reserves / ratio refers to crude oil and natural gas liquids.
, trade and supply of conventional crude oil Thousand metric tons; kilograms per capita; reserves production ratio (R/P) in years Table Notes The Reserves / ratio refers to crude oil and natural gas liquids.
Production (bbl/day)
") 1 of 5 14/09/2011 22:15 From Wikipedia, the free encyclopedia This is a list of countries by oil production mostly based on CIA World Factbook data. [1] Note that oil production refers to the sum of barrels
1 of 5 14/09/2011 22:15 From Wikipedia, the free encyclopedia This is a list of countries by oil production mostly based on CIA World Factbook data. [1] Note that oil production refers to the sum of barrels
Annex. List of tables
 Statistical annex Annex List of tables A. 1 Developed economies: rates of growth of real GDP, 2000-2010... 145 A. 2 Economies in transition: rates of growth of real GDP, 2000-2010... 146 A. 3 Developing
European Union, Trade in goods with Colombia
 Union, Trade in goods with Colombia Table of Contents pg Union, Trade with Colombia - Key Figures 2 - / 2015 2 - - AMA/NAMA product Groups 2 - - SITC product Groups 2 - - Top 5 - HS sections 2 - - Top
ECONOMIC BULLETIN - No. 42, MARCH Statistical tables
 ECONOMIC BULLETIN - No. 42, MARCH 2006 APPENDIX Appendix Statistical tables The world economy Table a1 Gross domestic product a2 Industrial production a3 Consumer prices a4 External current account a5
European Union, Trade in goods with Panama
 Union, Trade in goods with Panama Table of Contents pg Union, Trade with Panama - Key Figures 2 - / 2015 2 - - AMA/NAMA product Groups 2 - - SITC product Groups 2 - - Top 5 - HS sections 2 - - Top 5 -
Table 23 Production of minor oil products from refineries - by type Thousand metric tons
 Table 23 Production of minor oil from refineries - by type Table Notes Data refer to production from refineries of refinery, ethane, naphtha, lubricants, bitumen, paraffin, petroleum, white spirit, and
I. Global wine markets,
 I. Global wine markets, 2007-09 Table 1: Summary of the world's wine markets, 2007-09 (annual average) Vine % of cropland Wine Wine Wine Wine Wine Per adult wine Pop- GDP GDP Area under vines produced
MERCHANDISE TRADE STATISTICS 2009
 MERCHANDISE TRADE STATISTICS 2009 The content of this publication is intended for general information only. The aim of this publication is to provide While precaution is taken to ensure the accuracy of
Table 13 Production, trade and supply of conventional crude oil Thousand metric tons; kilograms per capita; reserves production ratio (R/P) in years
 in years") Million metric tons Million metric tons Table 13, trade and supply of conventional crude oil Thousand metric tons; kilograms per capita; reserves production ratio (R/P) in years Table Notes The Reserves
Million metric tons Million metric tons Table 13, trade and supply of conventional crude oil Thousand metric tons; kilograms per capita; reserves production ratio (R/P) in years Table Notes The Reserves
UXC.COM A PUBLICATION OF. NPO Overview 1501 MACY DRIVE ROSWELL, GA PH FX
 2019 A PUBLICATION OF UXC.COM NPO Overview 1501 MACY DRIVE ROSWELL, GA 30076 PH +1 770 642-7745 FX +1 770 643-2954 NOTICE UxC, LLC ( UxC ) shall have title to, ownership of, and all proprietary rights
Production of minor oil products from refineries - by type Thousand metric tons
 Production of minor oil from refineries - by type Table 23 Table Notes Data refer to production from refineries of refinery, ethane, naphtha, lubricants, bitumen, paraffin, petroleum, white spirit, and
STATISTICAL TABLES RELATING TO INCOME, EMPLOYMENT, AND PRODUCTION
 A P P E N D I X B STATISTICAL TABLES RELATING TO INCOME, EMPLOYMENT, AND PRODUCTION C O N T E N T S GDP, INCOME, PRICES, AND SELECTED INDICATORS Page B 1. Percent changes in real gross domestic product,
KINGDOM OF CAMBODIA NATION RELIGION KING 3
 KINGDOM OF CAMBODIA NATION RELIGION KING 3 TOURISM STATISTICS REPORT September 2017 MINISTRY OF TOURISM Statistics and Tourism Information Department No. A3, Street 169, Sangkat Veal Vong, Khan 7 Makara,
KINGDOM OF CAMBODIA NATION RELIGION KING 3
 KINGDOM OF CAMBODIA NATION RELIGION KING 3 TOURISM STATISTICS REPORT September 2018 MINISTRY OF TOURISM Statistics and Tourism Information Department No. A3, Street 169, Sangkat Veal Vong, Khan 7 Makara,
KINGDOM OF CAMBODIA NATION RELIGION KING 3
 KINGDOM OF CAMBODIA NATION RELIGION KING 3 TOURISM STATISTICS REPORT March 2015 MINISTRY OF TOURISM Statistics and Tourism Information Department No. A3, Street 169, Sangkat Veal Vong, Khan 7 Makara, Phnom
Textile Per Capita Consumption
 November 2017 Textile Per Capita Consumption 2005-2022 Part 1: Lower middle income countries CHF300.- Table of Contents Preface... 4 Sources... 5 Definitions... 6 Charts... 7 Executive Summary... 9 Country
Global Coal and Coke Flows, 2008
 Global Coal and Coke Flows, 2008 Phil Fisher Pet Coke Consulting Argus Petroleum Coke Summit September 17-18, 2009 Houston, TX Global Coal and Coke Flows What we will see: 1 How much steam coal is produced/
Table 13 Production, trade and supply of conventional crude oil Thousand metric tons; kilograms per capita; reserves production ratio (R/P) in years
 in years") Table 13, trade and supply of conventional crude oil Thousand metric tons; kilograms per capita; reserves production ratio (R/P) in years Table Notes The Reserves / ratio refers to crude oil and natural
Table 13, trade and supply of conventional crude oil Thousand metric tons; kilograms per capita; reserves production ratio (R/P) in years Table Notes The Reserves / ratio refers to crude oil and natural
KINGDOM OF CAMBODIA NATION RELIGION KING 3
 KINGDOM OF CAMBODIA NATION RELIGION KING 3 TOURISM STATISTICS REPORT December 2015 MINISTRY OF TOURISM Statistics and Tourism Information Department No. A3, Street 169, Sangkat Veal Vong, Khan 7 Makara,
Switzerland. A. Definitions and sources of data
 Switzerland A. Definitions and sources of data The Swiss National Bank (SNB) compiles data on foreign direct investment (FDI) for balance of payments- and international investment position- purposes. The
Table 5 Production, trade and supply of hard coal Thousand metric tons and kilograms per capita
 Table Notes Production includes production from other sources as defined in the previous table. Data for China include brown coal. Please refer to the Definitions Section on pages ix to xv for the appropriate
Imports of seed for sowing by country Calendar year 2011 Source: ISF compilation based on official statistics and international seed trade reports
 USA 157,432 15,562 464 173,458 523 318 67 908 Germany 195,159 5,913 520 201,592 595 97 22 714 France 125,701 4,389 277 130,367 522 150 11 683 Netherlands 140,899 12,253 796 153,948 250 330 48 628 Italy
KINGDOM OF CAMBODIA NATION RELIGION KING 3
 KINGDOM OF CAMBODIA NATION RELIGION KING 3 TOURISM STATISTICS REPORT March 2018 MINISTRY OF TOURISM Statistics and Tourism Information Department No. A3, Street 169, Sangkat Veal Vong, Khan 7 Makara, Phnom
Table 5 Production, trade and supply of hard coal Thousand metric tons and kilograms per capita
 Table Notes Production includes production from other sources as defined in the previous table. Data for China include brown coal. Please refer to the Definitions Section on pages ix to xv for the appropriate
KINGDOM OF CAMBODIA NATION RELIGION KING 3
 KINGDOM OF CAMBODIA NATION RELIGION KING 3 TOURISM STATISTICS REPORT February 2017 MINISTRY OF TOURISM Statistics and Tourism Information Department No. A3, Street 169, Sangkat Veal Vong, Khan 7 Makara,
KINGDOM OF CAMBODIA NATION RELIGION KING 3
 KINGDOM OF CAMBODIA NATION RELIGION KING 3 TOURISM STATISTICS REPORT May 2017 MINISTRY OF TOURISM Statistics and Tourism Information Department No. A3, Street 169, Sangkat Veal Vong, Khan 7 Makara, Phnom
KINGDOM OF CAMBODIA NATION RELIGION KING 3
 KINGDOM OF CAMBODIA NATION RELIGION KING 3 TOURISM STATISTICS REPORT October 2017 MINISTRY OF TOURISM Statistics and Tourism Information Department No. A3, Street 169, Sangkat Veal Vong, Khan 7 Makara,
KINGDOM OF CAMBODIA NATION RELIGION KING 3
 KINGDOM OF CAMBODIA NATION RELIGION KING 3 TOURISM STATISTICS REPORT October 2018 MINISTRY OF TOURISM Statistics and Tourism Information Department No. A3, Street 169, Sangkat Veal Vong, Khan 7 Makara,
Table 16 Refinery distillation capacity, throughput and output Thousand metric tons
 Million metric tons Table 16 Refinery distillation capacity, throughput and output Table Notes Output is equal to the sum of production from refineries for aviation gasoline, bitumen, gas/diesel oil, ethane,
Table 16 Refinery distillation capacity, throughput and output Thousand metric tons
 Table 16 Refinery distillation capacity, throughput and output Table Notes Output is equal to the sum of production from refineries for aviation gasoline, bitumen, gas/diesel oil, ethane, feedstocks, gasoline-type
19,000 38,500. Mean Crop. 5, ,827 Max , ,869 Last Year 6, ,
 YTD Inventory / Shipment Report In Shell Basis Crop: 2017 Monthly Market Prices FCA Hamburg Iranian Dried In Shell 28/30 Fandoghi Pistachios 10th Marketing Month YTD Carry in from previous year 3,000 Total
ASEAN International Merchandise Trade Statistics Yearbook 2014
 International Merchandise Trade Statistics Yearbook 2014 The Secretariat Jakarta The Association of Southeast Asian Nations () was established on 8 August 1967. The Member States of the Association are
AZERBAIJAN GDP BY SECTOR ,2% 40,1% TRADE IN GOODS. Billions of euros. Imports Exports Balance 35,0 15,0 10,0 7,3 5,0 0,0 -5,0
 AZERBAIJAN MAIN ECONOMIC INDICATORS Surface Area: 86,6 1000 sq km ** * : IMF (World Economic Outlook) *** : IMF (DoTS & WEO) Population: 9,0 Millions of inhabitants - 2009 (estimates after 2008) * ** :
35,000 52,000 87,000 1,600 8, ,400 76,600. Mean Crop. Monthly YTD Min ,671 8,211 Max. 2017
 YTD Inventory / Shipment Report In Shell Basis Crop: 2018 Monthly Market Prices FCA Hamburg Iranian Dried In Shell 28/30 Fandoghi Pistachios Total Consumption Ending Inventory 2nd Marketing Month YTD Carry