List of Figures. List of Tables Membership Parking ations...
|
|
|
- Colleen Booth
- 5 years ago
- Views:
Transcription
1 Denver Car Share Program 2016 Program Summary Prepared for: Prepared by: Project Manager: Jeff Ream, PE, PTOE Apex Design Reference No. P130145, Task Order #20 March 28, 2017
2 Denver Car Share Program Table 1: Annual Denver Car Share Program Membership... 6 Table 2: Commuting Habits Before & After Membership Table 3: Trip Purpose... 7 Table 4: Car Share and Additional Vehicle Ownership... 8 Table 5: Weekly Parking Demand Created by Car Share Members before and after Joining the Denver Car Share Program... 9 Table 6: Annual Vehicle Miles Traveled by Car Sharee Members Before and After Joining the Denver Car Share Program... 9 Table 7: Reasons Members Use the Denver Car Share Program Table 8: Travel Mode Use after Joining the Denver Car Share Program Table 9: Downtown Employee Car Share Membership Table 10: Employer-Provided Transportationn Benefits Table of Contents 1. Introduction Program Overview Membership... 2 Personal Mobility... 6 Trip Purpose... 7 Reasons for Using Car Share... 7 Parking... 8 Car Share and Additional Vehicle Ownership Program Assessment Reduce Parking Demand... 8 Reduction in Vehicle Miles Traveled... 9 Enhanced Mobility Downtown Denver Partnership Survey Downtown Employee Car Share Membership Car Share as an Employer-Provided Benefit Summary and Recommenda ations List of Figures Figure 1: Number of Registered Car Share Users by Zipp Code... 3 Figure 2: Percentagee of Total Registered Car Share Users by Zip Code... 4 Figure 3: Percentagee of Total Population That Are Registered Car Share Users by Zip Code... 5 List of Tables Page 1 of 12
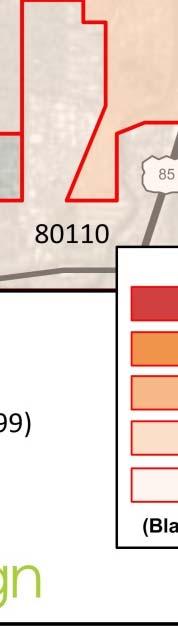
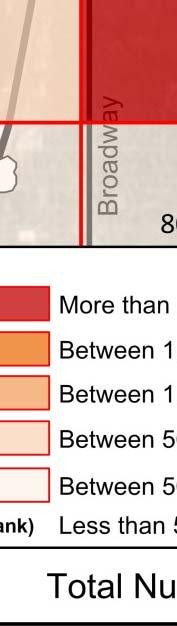
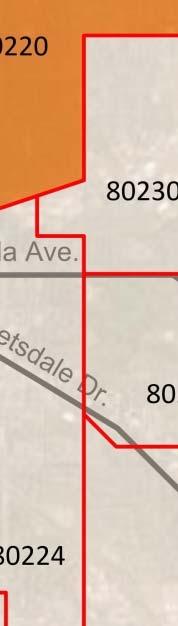
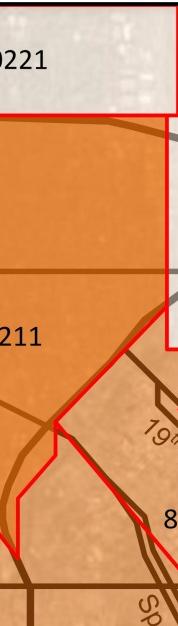
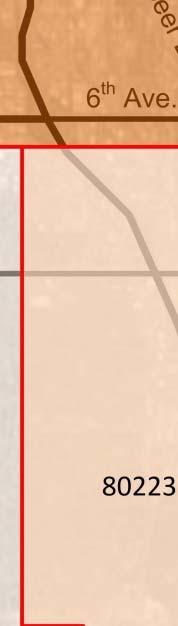
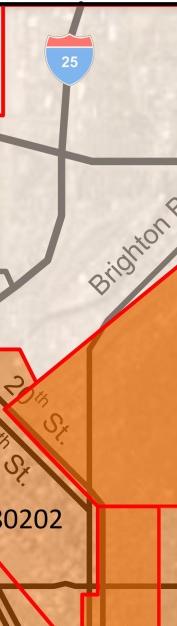
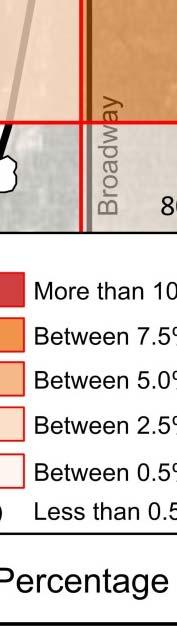
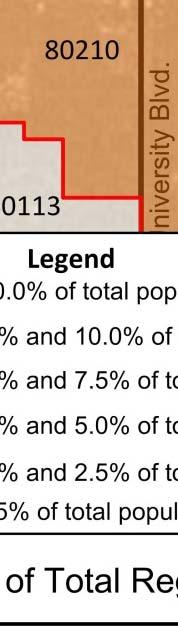
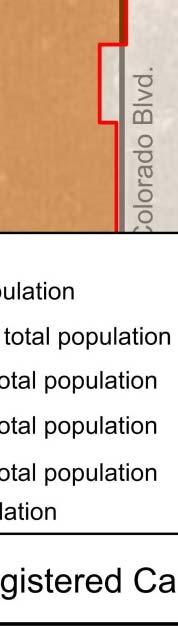
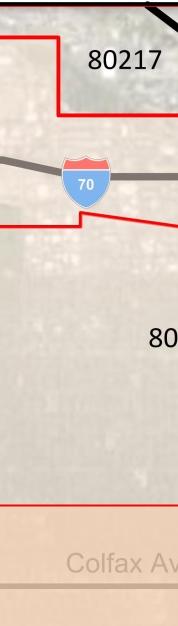
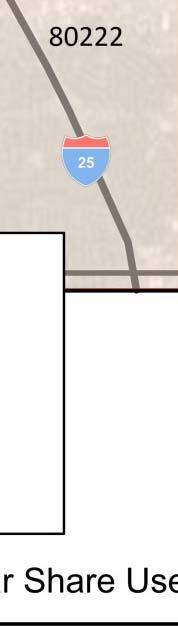
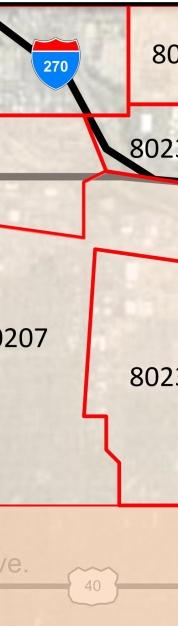
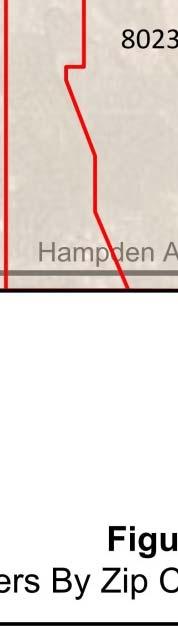
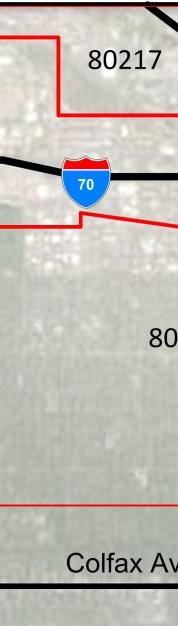
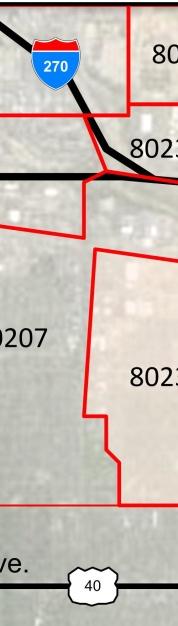
3 1. Introduction In May of 2013, the City and County of Denver (the City) adopted rules and regulations pertaining to private operators providing car sharing to Denver residents, employees, and visitors. Under the arrangement t, car share operators provide a fleet of vehicles that individuals may use for personal or business trips, provided they are registered members with the car share provider. The Denver Car Share Program allows qualified car share operators to purchase permits to either dedicate a parking space in the ROW for the operator s use or purchase an area permit that allows the vehicle to park at meters without payment, park in exemption of two hour or greater time limits, and park in Residential Parking Permit areas. Permit fees cover the cost of lost meter revenue and the value of on-street space as well as program administration costs. Such an arrangement adds to the attractivenesss of the service becausee it increases the number of on-street parking options available to car share members. The City outlined a series of goals for the program in the rules and regulations, including reducing parking demand, reducing vehiclee miles traveled, and enhancing mobility options for car share members. The rules and regulations required that each service provider conduct an annual survey of their membership to gauge the program s effectiveness in meeting these goals. Each car share provider distributedd their own survey language to their respective car share members. Participating car share providers at the time of this report included ego Car Share, car2go, Zipcar, and Enterprise CarShare. This report summarizes the results of the program s third year of operation ( ), and provides a comparison to the program s first two years of operation ( ) where applicable. 2. Program Overview The membership survey included questions about travel habits, modes, and types of trips made using a car share. This section provides an overview of members and their travel habits Membersh ip Denver Car Share Program The typical car share member lives downtown, in one off the neighborhoods adjacent to downtown or in one of the neighborhoods adjacent to University of Denver, has a commute of less than five miles, does not typically drive to work, andd uses car share for personal use. Figure 1 shows the number of members living in each zip code in and around the downtownn Denver area. As in 2015, the highest number of car share members resides in the Capitol Hill neighborhood, with all of the neighborhoods surroundingg downtown showing high membership numbers. Figure 2 shows the percentage of the total number of registered car share members in each zip code. While these neighborhoods continue to have the highest percentage of car share members, the percentages displayed on this graphic are lower than those that were shown in This appears to be due to car share members using the servicee but living outside of the Denver city limits. It should be noted that some car share providers submitted zip codes only for Denver residents that use the Denver Car Share Program while others submitted zip codes for all individuals that use the Denver Car Share Program, so the results providedd in Figure 2 may actually be skewed towards higher percentages in Denver than reality. Figure 3 shows the percentage of the total population that are registered car share userss by zip code. The zip code with the highest percent of its population being car share members is downtown, where more than one in four residents is registered with a car share provider; the high Page 2 of 12


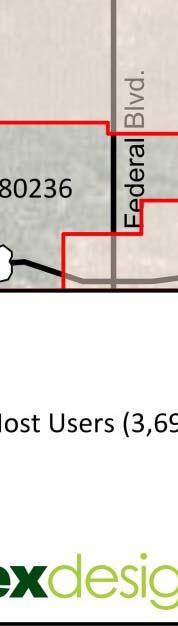


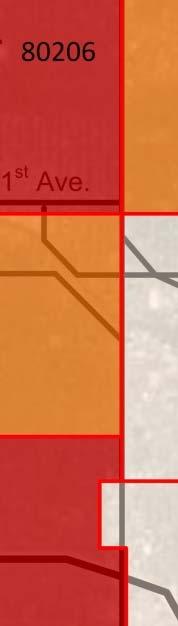
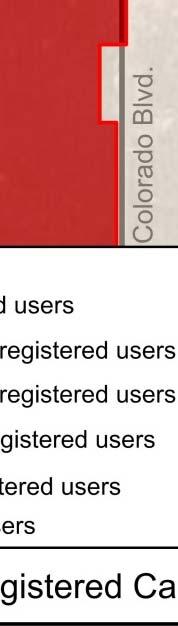
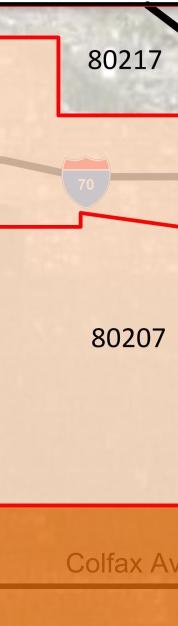

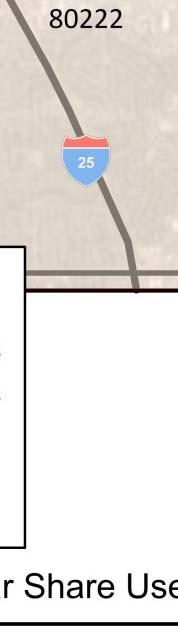
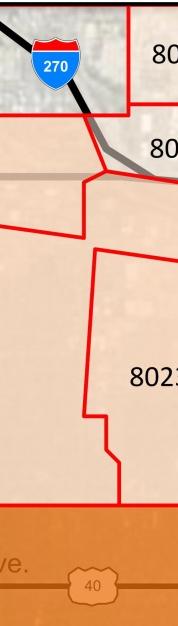
4 Denver Car Share Program Figure 1: Number of Registered Car Share Users by Zip Code Page 3 of 12


5 Denve er Car Sharre Program m Assessm ment Figu ure 2: Percenttage of Total Registered R Ca r Share Users s by Zip Code March Pa age 4 of 12


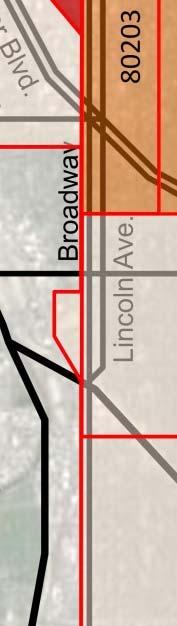
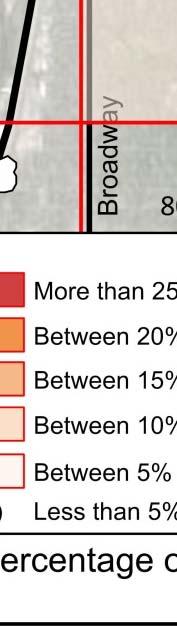


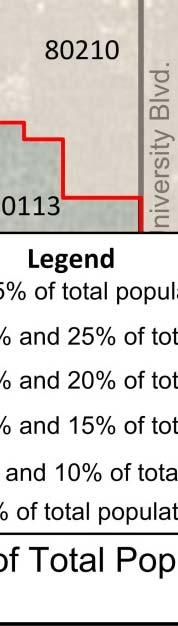


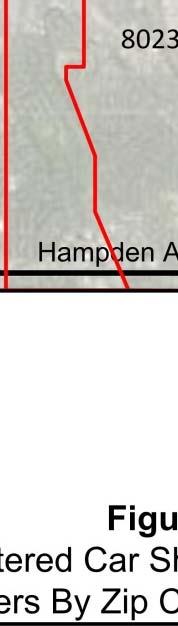
6 Denve er Car Sharre Program m Assessm ment Figure 3: Percenta age of Total Po opulation Tha at Are Registered Car Share e Userrs by Zip Code e March Pa age 5 of 12
7 membership in the Capitol Hill area translates to one in six residentss being registered in the program. Car share membership also appeared to be high in thee University of Denver area. This can be attributed to the high population of collegee students, faculty, and staff in the area. Surveys conducted by the University of Denver Center for Sustainability showed that roughly 10% of the 12,000 student population weree registered members of a car share service provider. These students indicated that car share services were primarily used for running errands and recreational trips on the weekends. Additionally, most parents of students indicated thatt they preferred alternate modes of transportation to personal vehicle use. As Table 1 indicates, membership in the Denver Car Share Program has grown steadily in the past three years and there are now approximately 32, 750 members in This number is based on the active members that the car share providers reported (it should be noted that there are additional members that have not actively used their membership within the twelve months prior to the survey). These 32,750 car share members took approximately 380,300 car share trips in 2016, a 36% reduction from 2015 when members took 591,556 trips. Changes in service provided by car share operators over the past year may have contributed to the observed decline in the number of trips Personal Mobility Denver Car Share Program Table 1: Annual Denver Car Share Program Membership Year Car Share Members , , ,750 Average Annual Percent Growth 36.8% The typical car share member owned one or two vehicles and drove less than 10,000 miles per year prior to joining a car share. The vast majority of car share members walk to a car share location when using their membership, are not Denverr B-cycle members, and do not have an RTD Eco Pass. Once they arrive at the car share location, they generally drive between 2-5 miles to their destination. Over 25 percent of car share members surveyed have given up a vehicle and another 15 percent have considered givingg up a vehicle as a result of becoming a car share member. Prior to becoming a member, 40 percent of those surveyed never commuted by car, while 31 percent commuted by car five days a week. After becoming members, the number of peoplee who never commute by car stayed fairly consistent, but those commuting by car five days a week dropped by five percent. As shown in Table 2, these findings are similar to the 2014 and 2015 survey results. One possible explanation for the shift away from five-day-a-week commuting by car is that the people who used to drive every day because they needed their vehicle during the day now have accesss to a vehiclee even when they do not commute by car, allowing them to shift to transit or some other alternate mode for their commute trip. Table 2: Commuting Habits Before & After Membership Commuting Habits Before After Before After Before After Never Commute by Car Commute by Car 5 days a week 39% 31% 36% 26% 41% 31% 40% 26% 40% 31% 38% 25% Page 6 of 12
8 Additionally, car share membership has been shown to result in changes to members personal mobility choices. After joining a car share, members walked, took public transit, and rode their bikes more often than prior to becoming members. Onn the other hand, members drove alone, carpooled, used B-Cycle, and used motorcycles or scooters less than prior to becoming members. Membership did not significantly impact working from home. Thesee mobility choices are further discussedd in Section 3.3 Enhanced Mobility and summarized in Table Trip Purpose As shown in Table 3, members use car share most frequently for personal errands, with over 66 percent of members indicating they have used it for personal errands at least a few times a year, and 27 percent indicating they have used it for personal errands at least once a month. Entertainment was the second most frequent trip purpose, with 64 percent of members indicating they have used it for those types of trips at least a few times a year. Around half of all members also used carshare services for commuting (51 percent), visiting friends (48 percent), recreation (46 percent), and work-related trips (43 percent) at least a few times a year. Other frequent uses include: grocery shopping (40 percent), retail shopping (38 percent), healthcare (32 percent), sporting events (30 percent), and giving someone a ride (26 percent). Members very rarely use car share for moving/hauling (13 percent), trips to the airport (11 percent) and education (9 percent). These 2016 findings are all relatively similar to the results of the 2015 survey. It should be noted thatt a change in phrasing of the questions between the 2014 and 2015 surveys may have resulted in overall higher percentages reported in 2014 (in 2015 the rarely category was changed to a few times a year ). Table 3: Trip Purpose Trip Purpose 2014 Percent of Car Percent of Car 2016 Percent of Car Share Members Share Members Share Members 2 Personal Errands Entertainment (theater, concert, etc.) Commuting 73% 76% 59% 60% 62% 45% 66% 64% 51% Visiting Friends Recreation 60% 57% 44% 43% 48% 46% Work Related Trips Grocery Shopping Retail Shopping Healthcare 47% 45% 42% 37% 38% 35% 33% 24% 43% 40% 38% 32% Sporting Events Giving Someone a Ride Moving/Haulin ng Trips to the Airport N/A 3 36% 14% 11% 32% 26% 9% 8% 30% 26% 13% 11% Education 12% 9% 9% 1. The percent of car share members shown from 2014 are thosee that used car share for the type of trip listed anywhere from rarely to more than five times a month. 2. The percent of car share members shown from 2015 and are those that used car share for the type of trip listed anywhere from a few times a year to more than twice a week. 3. This option was not included as a possible response in the 2014 survey Reasons for Using Car Share Denver Car Share Program Almost three in four members surveyed cited convenience/increased mobility options as one of the reasons why they joined a car share (72 percent). Parking flexibility was also a very common reason members joined a car share service (56 percent). Other common reasons include alternative modes of transportation (44 percent), cost savings (32 percent), lack of a Page 7 of 12
9 Denver Car Share Program personal vehicle (333 percent), and environmental awareness (25 percent). These findings are discussed further in Section 3.3 and summarized in Table Parking The vast majority (90 percent) of car share members surveyed have not changed their personal parking habits since becoming members. Two-thirds of car share members surveyed that do own a personal vehicle predominately park off-street, with the remaining one-third predominately parking on-street Car Share and Additional Vehicle Ownership The survey includedd a question about whether members would consider giving up a car because of becoming a car share member. One in four members surveyed cited that they either gave up a car before becoming a member or gave up a car after becoming a member, while 15 percent cited that they have considered giving up a carr but have not yet done so. Similarly, the majority of members surveyed cited that they would not purchase a new vehicle if car sharing disappeared (60 percent). One in four members surveyed are unsure if they would purchase an additional vehiclee if car share disappeared, and another 15 percent would purchase an additional vehicle. As shown in Table 4, these results are similar to those from the 2014 and 2015 surveys, but it should be noted that more members now are actually givingg up a car as opposed to just considering giving up a car. Table 4: Car Share and Additional Vehicle Ownership Vehicle Ownership 2014 Percentt of 2015 Percent of Respondents Respondents Either gave up a car before becoming a member or gave up a car after becoming a member Have considered givingg up a car Would not purchase a new vehicle if car sharing disappeared Unsure if they would purchase an additional vehicle if car share disappeared Would purchase an additional vehicle 23% 22% 58% 27% 15% 22% 19% 55% 20% 17% 2016 Percent of Respondents 27% 15% 60% 25% 15% 3. Program Assessme ent Per the City s Rules and Regulations, the intent of the Denver Car Share Program is to provide the opportunity to reduce parking demand, reduce vehicle miles traveled, and enhance mobility options for members. This section assesses how well the program is meeting these three metrics after the third year of operation Reduce Parking Demand Members were asked how many days a week they drove to work or school prior to joining a car share and how many days a week they drove to work or school after joining the program; this information was used to estimate the parking demand generated by car share members before and after joining the program. As Table 5 indicates, prior to joining, the 32,743 current car share members generated a combined parking demand of 78,367 vehicles per week. After joining the program, those same members generated a parking demand of 72,,272 vehicles per week, thereby reducing demandd by almost eight percent. This is a slight improvement on the seven percent parking reduction reported in the 2015 survey. These results continue to suggest that the program is having a positive effect on reducing parking demand in the areas that it serves. Page 8 of 12
10 Table 5: Weekly Parking Demand Created byy Car Share Members beforee and after Joining the Denver Car Share Program Days/Week Before Joining Car Share After Joining Car Share Driving to Work/School Total Number of Members 13,010 2,138 2,319 2,190 2,061 10, ,743 Parked Vehicles/Weekk 0 2,138 4,637 6,569 8,244 50,106 2,164 4,508 78,367 Number of Members 12,5911 3,509 2,787 2,451 2,400 8, ,7433 Parked Vehicles/Week 0 3,509 5,573 7,354 9,598 41,,413 1,393 3,432 72,,272 Percent Reduced, % Percent Reduced, % Percent Reduced, % 3.2. Reduction in Vehiclee Miles Traveled Members were asked approximately how many miles they drove per month prior to joining a car share and how many miles they now drive per month after joining the program. As Table 6 indicates, prior to joining a car share, members drove an average of approximately 7,100 miles per year, and after joining they drove approximatelyy 6,150 miles per year, a 13 percent reduction. This corresponds to approximately 31.1 million fewer vehicle miles traveled by car share members in the past year. In 2016 car share members drove 4.5 million fewer vehicle miles than members did in 2015, suggestingg that as membership in the program increases, it is having a more positive effect on reducing vehicle miles traveled in the region. Table 6: Annual Vehicle Miles Traveled by Carr Share Members Before and After Joining the Denver Car Share Program Average Annual Mileage Before Joining Car Share 7,100 Average Annual Mileage After Joining Car Share 6,150 Net Average Reduction in Mileage 950 Total Car Share Members 32,7433 Approximate Total Mileage Reduction 31,105, Total Mileage Reduction 26,635, Enhanced Mobility Denver Car Share Program Members were asked to identify the reasons they usee car share. As Table 7 indicates, 72 percent of the respondents in 2016 identified Convenience and Increased Mobility Options as one of the reasons for joining the program. This level of response would indicate that the members believe that the program meets the stated intent of enhancing mobility options. It should also be noted that the Convenience e and Increased Mobility Options response did drop rather significantly between 2014 and 2016, from 91 percent to 72 percent. In fact, the percent of respondents that selected each reason for using carr share dropped from 2014 to 2016 with the exception of the Alternative Modes of Transportation Do Not Meet Alll Mobility Needs response, which in 2014 was listed as Lack of Alternative Transportation. The drop in responses across the board may be due to changes in the survey after 2014 (i.e., more options being provided and respondents only choosing a limited number of options), becausee the percentages for each reason remained fairly consistent in both the 2015 and 2016 surveys. Page 9 of 12
11 Table 7: Reasons Members Use the Denver Car Share Program Reason 2014 Percent of 2015 Percent of 2016 Percent of Respondents Respondents Respondents Convenience and Increased Mobility Options Parking Flexibility Alternativee Modes of Transportation n (Transit, Biking, etc.) Do Not Meet All Mobility Needs Lack of a Personal Vehicle Cost Savings Environmental Awareness Variety of Vehicle Choices Other 91% 76% 29% 2 N/A 3 45% 35% 36% N/A 3 66% 61% 42% 29% 32% 22% 11% 18% 72% 56% 44% 33% 32% 25% 13% 12% 4 1. Members were asked to select all of the options that applied to them, so the percentages shown add up to greater than This response was listed as Lack of Alternative Transportation in the 2014 survey. 3. This option was not included as a possible response in the 2014 survey.. 4. "Other"" option was only included in the survey by one car share service in 2016 A second way of assessing the program s effect on enhancing mobility is to examine how members travel modes changed after they joined the program.. Table 8 summarizess the responses to the various travel mode questions posedd in the member survey. As indicated, members drove alone significantly less after joining a car share, and were also less likely to carpool, use a motorcycle or scooter, and use B-cycle. On the other hand, members increased their frequency of walking, taking public transit, and biking. Based on these results, it would appear that the program continues to be moderately effective in getting members to use other transportation options for their trips, instead of just switching theirr personal vehicle with a car share vehicle. Overall, the 2016 results are similar to those from 2015, with the notable exceptions of an increase in car share members walkingg and using public transportation, as well as fewer car share members driving alone in 2016 than were reported in 2014 and Table 8: Travel Mode Use after Joining the Denver Car Share Program Travel Mode Walk Public Transit Bicycle Work at Home B-Cycle Motorcycle/Scooter Carpool Drive Alone Denver Car Share Program Net Net Net Less Same More Change Change Change 5% 61% 34% +29% +21% +15% 14% 59% 27% +13% +5% -5% 10% 70% 19% +9% +5% +7% 7% 82% 11% +4% +3% +0% 13% 80% 6% -7% -8% -2% 14% 82% 4% -10% -12% -6% 17% 79% 4% -13% -14% -11% 34% 58% 7% -27% -34% -37% Page 10 of 12
12 Denver Car Share Program 4. Downtown n Denver Partnership Survey Each fall, the Downtown Denver Partnership (DDP) surveys employees working in downtown Denver to examine the trends and habits of downtown commuters. The Downtown Denver Commuter Survey measures a sample of the downtown employee population to analyze commuting patterns, explore the attractiveness of transportation benefits and determinee how commuters currently travel to their downtown work destinations. This survey differs from the Denver Car Share Program survey because it represents a cross-section of all employees in the downtown area, rather than just car share members. Since 2012, the DDP survey has includedd several questions about car share membership, whether it is employer-providedd or something the employee has elected to do on their own. This section summarizes the responses to car share-related questions from the DDP survey Downtown n Employeee Car Share Membership In the 2016 survey, 13 percent of downtownn employeess indicated that they were members of a car share. While the car share membership percentage increased steadily between 2012 (when car share usage was first surveyed) and 2014 (one year after the City adoptedd regulations that allowed car share providers to purchase parking permits and provide free on-street for the past three parking to members), membership has generally remained at the same percentage years. Table 9: Downtown Employee Car Share Membership Year Car Share Membership (as Percent of Total Downtown Employees) 1.50% 7% 12% 14% 13% 4.2. Car Share as an Employer Provided Benefit Althoughh employee membership has generally increased each year, very few employers have embraced it as an employer-provided benefit, and even fewer employees have elected to participate in it through their company. In 2016, only sixx percent of employees indicated it was a service offered by their employer, and only one percent of the employees indicated thatt they elected to receive it as a benefit, which is consistent with the results of the 2014 and 2015 surveys, as shown in Table 10. Instead, most employees elect to receive benefits such as transit passes and subsidized parking (50 percent usee transit and 31 percent use a personal vehicle). Page 11 of 12
13 Denver Car Share Program Table 10: Employer-Provided Transportation Benefits Transportatio on Benefits Offered by Downtown Employers Percent of Downtown Employees Offered Benefit 1 Percent of Downtown Employees Using Benefit Car Share Membership and/or Usage Fees Parking Space Transit Pass B-Cycle Membership and/or Usage Fees Secure Bicycle Parking 8% 62% 85% 17% 57% 7% 61% 81% 14% 53% 6% 58% 77% 13% 54% 1% 30% 56% 3% 12% 1% 31% 54% 2% 11% 1% 31% 50% 2% 11% 1. This includes employers that offer the benefits regardless of how much of the cost is covered. 5. Summary and Recommendations The 2016 survey results suggest that the Denver Car Share Program continues to be successful in achieving the three-pronged intent of reducing parking demand (car share members reduced their weekly parking impact by seven percent after joining the program), reducing vehicle miles traveled (car share members reduced their annual vehicle miles traveled by 13 percent after joining the program), and enhancing the mobility options for its users (72 percent of the members identified increased mobility as one of the reasons they joined the program). Overall membership in the program continues to grow steadilyy each year,, and the Downtown Denver Partnership s annual survey continues to indicate that just under 15 percent of all downtown employees participate in car share. Given the positive results and the continued growth in membership, it is recommended that the City continue to support the Denver Car Share Program through the provision of parking permits. However, to better measure the program s effectiveness,, it is recommended that the car share providers all be encouraged to provide resident zip codes for anyone that utilizes the Denver Car Share Program. As discussed in Section 2.1, some car share providers submitted zip codes only for Denver residents that use the Denver Car Share Program while others submitted zip codes for all individuals that use the Denver Car Share Program. Consistency in how each provider submits data will help to generate a better understanding of Denver residents using the program verses residents of Denver s surrounding Metro Area using the program. Page 12 of 12
Denver Car Share Program 2017 Program Summary
 Denver Car Share Program 2017 Program Summary Prepared for: Prepared by: Project Manager: Malinda Reese, PE Apex Design Reference No. P170271, Task Order #3 January 2018 Table of Contents 1. Introduction...
List of Figures. List of Tables Membership. Parking ations
 Denver Car Share Program 2015 Program Summary Prepared for: Prepared by: Project Manager: Jeff Ream, PE, PTOE Apex Design Reference No. P130145, Task Order #20 March 15, 2016 Table of Contents 1. Introduction...
Car Sharing at a. with great results.
 Car Sharing at a Denver tweaks its parking system with great results. By Robert Ferrin L aunched earlier this year, Denver s car sharing program is a fee-based service that provides a shared vehicle fleet
CTR Employer Survey Report
 CTR Employer Survey Report Employer Id : E11056 City of Lacey Employer : Worksite : City of Lacey Street : 420 College St Se Jurisdiction : City of Lacey Thank you for completing your Commute Trip Reduction
CTR Employer Survey Report
 CTR Employer Survey Report Employer Id : E12740 WA State Dept. of Agriculture Employer : Worksite : Cleveland Lab Street : 3939 Cleveland Ave Se Jurisdiction : City of Olympia Thank you for completing
Kauai Resident Travel Survey: Summary of Results
 Kauai Resident Travel Survey: Summary of Results Kauai Multimodal Land Transportation Plan Charlier Associates, Inc. November 23, 2011 1 Table of Contents Executive Summary... 2 Survey Goals and Methodology...
car2go Toronto Proposal for on-street parking pilot project
 car2go Toronto Proposal for on-street parking pilot project Public Works & Infrastructure Committee June 18, 2014 Car2go Overview car2go is currently operating in 14 cities in North America, 12 cities
Denver Car Share Permit Program
 Denver Car Share Permit Program Rocky Mountain Land Use Institute Conference 13 March 2014 Strategic Parking Plan (SPP) Vision & Framework Acknowledge a variety of land use patterns & contexts Manage parking
CONSUMER ATTITUDES TOWARD E- BIKES: A REVIEW OF THREE STUDIES IN NORTH AMERICA
 CONSUMER ATTITUDES TOWARD E- BIKES: A REVIEW OF THREE STUDIES IN NORTH AMERICA Christopher Cherry (University of Tennessee), Ziwen Ling (University of Tennessee), John MacArthur (Portland State University),
QUALITY OF LIFE EXECUTIVE SUMMARY REPORT I O N S TAT I O N
 QUALITY OF LIFE EXECUTIVE SUMMARY REPORT UN I O N S TAT I O N T R AV E L by TR A I N Published September 2017 2015 PROGRESS MAP This document reports FasTracks progress through 2015 BACKGROUND RTD The
1.963 Report: A Sustainable Transportation Plan for MIT Campus May 2007
 1.963 Report: A Sustainable Transportation Plan for MIT Campus May 2007 Authors: David Block-Schachter Michael Kay Francesca Napolitan Tegin Teich Supervisors: John Attanucci, Lawrence Brutti, Fred Salvucci
Evaluation of an Electric Bike Pilot Project at Three Employment Campuses in Portland, Oregon
 Portland State University PDXScholar TREC Friday Seminar Series Transportation Research and Education Center (TREC) 1-22-2016 Evaluation of an Electric Bike Pilot Project at Three Employment Campuses in
CTR Employer Survey Report
 CTR Employer Report Employer Id : E12146 Employer : WA State Dept. of Enterprise Services Worksite : Street : 7511 New Market St 7511 New Market St Sw Thank you for completing your Commute Trip Reduction
Parking Management Element
 Parking Management Element The State Transportation Planning Rule, adopted in 1991, requires that the Metropolitan Planning Organization (MPO) area implement, through its member jurisdictions, a parking
CTR Employer Survey Report
 CTR Employer Report Employer Id : E12138 Employer : WA State Dept. of Enterprise Services Worksite : Street : 616 Cherry St 616 Cherry St Se Thank you for completing your Commute Trip Reduction survey.
Office of Transportation Bureau of Traffic Management Downtown Parking Meter District Rate Report
 Office of Transportation Bureau of Traffic Management 1997 Downtown Parking Meter District Rate Report Introduction The City operates approximately 5,600 parking meters in the core area of downtown. 1
Case Study: City of San Diego
 Case Study: City of San Diego Approach to Sharing Economy in San Diego 2 Two primary approaches to the growing sharing economy within the City of San Diego: Compliance Corporate Sponsorships Compliance
Breakout Session. The Mobility Challenges of Our Growing & Sprawling Upstate
 Breakout Session The Mobility Challenges of Our Growing & Sprawling Upstate The Mobility Challenges of Our Growing & Sprawling Upstate Why is our suburban and sprawling development pattern a challenge
More persons in the cars? Status and potential for change in car occupancy rates in Norway
 Author(s): Liva Vågane Oslo 2009, 57 pages Norwegian language Summary: More persons in the cars? Status and potential for change in car occupancy rates in Norway Results from national travel surveys in
2010 Motorcycle Risk Study Update
 2010 Motorcycle Risk Study Update Introduction This report provides an update to the Motorcycle Risk Study from AI.16 of the 2005 Rate Application. The original study was in response to Public Utilities
Whither the Dashing Commuter?
 Whither the Dashing Commuter? The MTA in a Changing Region William Wheeler Director of Special Project Development and Planning Travel in the New York Region has changed from the days of the 9 to 5 commute
TRANSPORTATION DEMAND MANAGEMENT
 TRANSPORTATION DEMAND MANAGEMENT Deborah Stacey Senior Transportation Planner CDTC dstacey@cdtcmpo.org Unique Process CDTC Programs $525,000 per Year (CMAQ) in the TIP for TDM CDTA, the Region s Transit
CITY OF VANCOUVER ADMINISTRATIVE REPORT
 Supports Item No. 1 T&T Committee Agenda May 13, 2008 CITY OF VANCOUVER ADMINISTRATIVE REPORT Report Date: April 29, 2008 Author: Don Klimchuk Phone No.: 604.873.7345 RTS No.: 07283 VanRIMS No.: 13-1400-10
Electric Vehicle Programs & Services. October 26, 2017
 1 Electric Vehicle Programs & Services October 26, 2017 2 Outline Electric vehicle (EV) market update MGE Programs, Services and Outreach Public charging Home charging Multi-family charging Madison Gas
2018 Long Range Development Plan Update Community Advisory Group- February 21, 2018
 Transportation @ UC San Diego 2018 Long Range Development Plan Update Community Advisory Group- February 21, 2018 Agenda UC San Diego Transportation Services Organizational Overview Current State Parking,
Address Land Use Approximate GSF
 M E M O R A N D U M To: Kara Brewton, From: Nelson\Nygaard Date: March 26, 2014 Subject: Brookline Place Shared Parking Analysis- Final Memo This memorandum presents a comparative analysis of expected
CHAPTER 9. PARKING SUPPLY
 CHAPTER 9. PARKING SUPPLY The goal of this chapter is to provide City and University decision-makers with information about Study Area parking that can be used to determine the amount of parking that should
Jeff s House. Downtown Charlottesville. PEC Office
 Jeff s House Downtown Charlottesville PEC Office Year 2000 US Census Data Employed persons over 16 Percentage of Employed Persons Locality Avg Commute (in minutes) Drove Public Transit Walk/Bike Other
SUPPORTING TOD IN METRO CHICAGO
 www.rtachicago.org SUPPORTING TOD IN METRO CHICAGO Tuesdays at APA November 18, 2014 OVERVIEW OF RTA 2 11/18/2014 Tuesdays at APA: Supporting TOD in Metro Chicago RTA Region 8.5 million people 3,700 square
6/6/2018. June 7, Item #1 CITIZENS PARTICIPATION
 June 7, 2018 Item #1 CITIZENS PARTICIPATION 1 Item #2 APPROVAL OF MINUTES Item #3 TRAC GOALS, FRAMEWORK & AGENDA REVIEW 2 COMMITTEE GOALS Learn about Southern Nevada s mobility challenges, new developments
Results from the North American E-bike Owner Survey
 Results from the North American E-bike Owner Survey TRB Emerging Vehicles for Low Speed Transportation Subcommittee January 2018 John MacArthur Research Associate Portland State University UNITED STATES
WHITE PAPER. Preventing Collisions and Reducing Fleet Costs While Using the Zendrive Dashboard
 WHITE PAPER Preventing Collisions and Reducing Fleet Costs While Using the Zendrive Dashboard August 2017 Introduction The term accident, even in a collision sense, often has the connotation of being an
Utah Transit Authority Rideshare. CTAA Conference June 12, 2014
 Utah Transit Authority Rideshare CTAA Conference June 12, 2014 UTA Statistics and Info A Public Transit Agency Six counties, about 1600 square miles Within this area is 80% of the state s population, an
San Rafael Civic Center Station Area Plan May 2012 DRAFT FOR PUBLIC REVIEW
 CHAPTER 4. PARKING Parking has been identified as a key concern among neighbors and employers in the area, both in terms of increased demand from potential new development and from SMART passengers that
Welcome! Think carpool, then think bigger! Questions? Contact our Vanpool team!
 Welcome! Smart commuters like you are seizing the opportunity to turn costly and often frustrating daily commutes into a better experience. Vanpool helps you save money on gas and maintenance, reduces
Changing Behavior and Achieving Mode Shi2 Goals
 Changing Behavior and Achieving Mode Shi2 Goals Tim Papandreou - Director Strategic Planning & Policy, San Francisco Municipal TransporaBon Agency Michael KeaBng - Founder & CEO, Scoot Networks Mike Mikos
Kenosha-Racine-Milwaukee (KRM)
") Kenosha-Racine-Milwaukee (KRM) Commuter Rail #147925 November 6, 2009 1 Guidance of KRM Commuter Rail Studies Intergovernmental Partnership Technical Steering Committee Temporary and Limited Authority
Kenosha-Racine-Milwaukee (KRM) Commuter Rail #147925 November 6, 2009 1 Guidance of KRM Commuter Rail Studies Intergovernmental Partnership Technical Steering Committee Temporary and Limited Authority
Otay Ranch Station 2020 MOBILITY SERVICES MAP REGIONAL MOBILITY HUB IMPLEMENTATION STRATEGY
 MAGDALENA REGIONAL MOBILITY HUB IMPLEMENTATION STRATEGY Otay Ranch Station Mobility hubs are transportation centers located in smart growth areas served by high frequency transit service. They provide
National Household Travel Survey Add-On Use in the Des Moines, Iowa, Metropolitan Area
 National Household Travel Survey Add-On Use in the Des Moines, Iowa, Metropolitan Area Presentation to the Transportation Research Board s National Household Travel Survey Conference: Data for Understanding
M E M O R A N D U M INTRODUCTION. POTENTIAL TDM STRATEGIES Marketing & Management. Residents & Employees. Exhibit 6
 Exhibit 6 M E M O R A N D U M To: From: Joe Ernst and Bryan Graves Nelson\Nygaard Date: February 6, 2015 Subject: Preliminary TDM Strategies INTRODUCTION The memorandum provides an overview of potential
Parking Pricing As a TDM Strategy
 Parking Pricing As a TDM Strategy Wei-Shiuen Ng Postdoctoral Scholar Precourt Energy Efficiency Center Stanford University ACT Northern California Transportation Research Symposium April 30, 2015 Parking
1
 1 2 3 4 5 6 7 8 9 10 11 12 Breakdown of License Changes Definitions First Draft ROW License Changes in Revised Draft Explanation of Change Dockless sharing Shared active transportation vehicle NACTO recommendation
Electric Vehicle Charging Station Installation and Eco-Pass Updates. Report Prepared by: A. Rolston, Parking Operations Coordinator
 Report to Council Date: File: 1862-01 To: From: Subject: City Manager D. Duncan, Manager, Parking Services Electric Vehicle Charging Station Installation and Eco-Pass Updates Report Prepared by: A. Rolston,
TEXAS CITY PARK & RIDE RIDERSHIP ANALYSIS
 TEXAS CITY PARK & RIDE RIDERSHIP ANALYSIS This document reviews the methodologies and tools used to calculate the projected ridership and parking space needs from the proposed Texas City Park & Ride to
2009/10 NWT Aurora Visitor Survey Report. Industry, Tourism and Investment Government of the Northwest Territories
 2009/10 NWT Aurora Visitor Survey Report Industry, Tourism and Investment Government of the Northwest Territories INTRODUCTION... 3 SURVEY METHODOLOGY... 4 EXECUTIVE SUMMARY... 5 VISITOR PROFILE... 7 AGE...
UC Santa Cruz TAPS 3-Year Fee & Fare Proposal, through
 UC Santa Cruz TAPS 3-Year Fee & Fare Proposal, 2016-17 through 2018-19 Introduction Transportation and Parking Services (TAPS) proposes a three-year series of annual increases to most Parking fees and
UTA Transportation Equity Study and Staff Analysis. Board Workshop January 6, 2018
 UTA Transportation Equity Study and Staff Analysis Board Workshop January 6, 2018 1 Executive Summary UTA ranks DART 6 th out of top 20 Transit Agencies in the country for ridership. UTA Study confirms
CO 2 Emissions: A Campus Comparison
 Journal of Service Learning in Conservation Biology 3:4-8 Rachel Peacher CO 2 Emissions: A Campus Comparison Abstract Global warming, little cash inflow, and over-crowded parking lots are three problems
Parking Management Strategies
 Parking Management Strategies Policy Program Potential Effectiveness (percent reduction in demand) Comments Parking Pricing Unbundling and Cash-Out Options Reduced Parking Requirements Transit/TOD Supportive
University of Washington. Stadium Expansion Parking Plan and Transportation Management Program
 University of Washington Transportation Office University of Washington Stadium Expansion Parking Plan and Transportation Management Program 2006 Report 2006 Stadium Parking Plan and Transportation Management
EVOLUTION OF MOBILITY: FOUR PREDICTIONS FOR THE FUTURE
 EVOLUTION OF MOBILITY: FOUR PREDICTIONS FOR THE FUTURE 1 The Evolution of Mobility Study Series Phase I Consumer attitudes about the changing mobility landscape Perceptions and perceived need for traditional
The Case for. Business. investment. in Public Transportation
 The Case for Business investment in Public Transportation Introduction Public transportation is an enterprise with expenditure of $55 billion in the United States. There has been a steady growth trend
Sales and Use Transportation Tax Implementation Plan
 Sales and Use Transportation Tax Implementation Plan Transportation is more than just a way of getting from here to there. Reliable, safe transportation is necessary for commerce, economic development,
appendix 4: Parking Management Study, Phase II
 appendix 4: Parking Management Study, Phase II A4-1 A4-2 Eastlake Parking Management Study Final Phase 2 Report Future Parking Demand & Supply January 6, 2017 Submitted by Denver Corp Center III 7900 E.
The TDM Plan for Fort Washington Office Park NOVEMBER 1 6, 2017 FORT WASHINGTON OFFICE PARK STAKEHOLDERS
 The TDM Plan for Fort Washington Office Park NOVEMBER 1 6, 2017 FORT WASHINGTON OFFICE PARK STAKEHOLDERS What is Transportation Demand Management (TDM)? Sources: Philly.com, Montgomery County, GVF Location
Denver Dockless Mobility Program Pilot Interim Report
 Denver Dockless Mobility Program Pilot Interim Report Table of Contents A. Introduction and Overview of Program to Date.1 B. Program Vision and Status 1 C. Current Deployment Status 3 D. Public Outreach
Puget Sound Transportation Panel Factors in Daily Travel Choices September 1991
 Puget Sound Transportation Panel Factors in Daily Travel Choices September 1991 My current work/school status is: 1 Work, 35 hours/week or more 2 Work, fewer than 35 hours/week 3 Student, full-time Continue
Pilot Project Evaluation Summary
 SFpark Pilot Project Evaluation Summary A summary of the SFMTA s evaluation of the SFpark pilot project M U N I June 2014 2 / Overview SFpark: Pilot Project Evaluation Summary / 3 Pilot Project Evaluation
Draft Marrickville Car Share Policy 2014
 Draft Marrickville Car Share Policy 2014 1. Background 1.1. Marrickville Council has supported car sharing in the LGA since 2007 as part of a holistic approach to encouraging more sustainable modes of
How to Create Exponential Decline in Car Use in Australian Cities. By Peter Newman, Jeff Kenworthy and Gary Glazebrook.
 How to Create Exponential Decline in Car Use in Australian Cities By Peter Newman, Jeff Kenworthy and Gary Glazebrook. Curtin University and University of Technology Sydney. Car dependent cities like those
A Transit Plan for the Future. Draft Network Plan
 A Transit Plan for the Future Draft Network Plan Project Overview and Status Completed Market Analysis and Service Evaluation. Developed Plan Framework and Guiding Principles. Developed a draft Five Year
9. Downtown Transit Plan
 CORRADINO 9. Downtown Transit Plan KAT Transit Development Plan As part of the planning process for the TDP, an examination of downtown transit operations was conducted. The Downtown Transit Plan 1 is
TR15: Public Outreach
 TR15: Public Outreach Brief Summary: The Public Outreach control measure includes activities to encourage Bay Area residents to make choices that benefit air quality. This measure includes various public
Transportation Demand Management Element
 Transportation Demand Management Element Over the years, our reliance on the private automobile as our primary mode of transportation has grown substantially. Our dependence on the automobile is evidenced
TRANSPORTATION OVERVIEW INTRODUCTION QUESTION HYPOTHESIS
 OVERVIEW TRANSPORTATION Group No. 2 Brian Kim Cheryce Rutkai Sean Burles Dustin Rose Introduction Experiment Experiment Analysis Portland Public Transportation Bicycles Bio-diesel Hybrids Conclusion INTRODUCTION
Policy Note. Vanpools in the Puget Sound Region The case for expanding vanpool programs to move the most people for the least cost.
 Policy Note Vanpools in the Puget Sound Region The case for expanding vanpool programs to move the most people for the least cost Recommendations 1. Saturate vanpool market before expanding other intercity
2 VALUE PROPOSITION VALUE PROPOSITION DEVELOPMENT
 2 VALUE PROPOSITION The purpose of the Value Proposition is to define a number of metrics or interesting facts that clearly demonstrate the value of the existing Xpress system to external audiences including
Metro Strategic Plan: Changing our relationship with the customer May 17, 2018
 Metro Strategic Plan: Changing our relationship with the customer May 17, 2018 MISSION AND VISION Mission Provide a world-class transportation system that enhances quality of life for everyone in LA County.
2 EXISTING ROUTE STRUCTURE AND SERVICE LEVELS
 2 EXISTING ROUTE STRUCTURE AND SERVICE LEVELS In the Study Area, as in most of the Metro Transit network, there are two distinct route structures. The base service structure operates all day and the peak
Public Meeting. March 21, 2013 Mimosa Elementary School
 Public Meeting March 21, 2013 Mimosa Elementary School Today s Meeting Purpose 2 Where We Are The Process What We ve Heard and Findings Transit Technologies Station Types Break-out Session Where We Are
Ideas + Action for a Better City learn more at SPUR.org. tweet about this #DisruptiveTransportation
 Ideas + Action for a Better City learn more at SPUR.org tweet about this event: @SPUR_Urbanist #DisruptiveTransportation TNCs & AVs The Future Is Uncertain The Future Is Uncertain U.S. Dept of Transportation
Abstract. Executive Summary. Emily Rogers Jean Wang ORF 467 Final Report-Middlesex County
 Emily Rogers Jean Wang ORF 467 Final Report-Middlesex County Abstract The purpose of this investigation is to model the demand for an ataxi system in Middlesex County. Given transportation statistics for
Berkeley Lab - Innovative Fleet Ideas, Goal Performance & Challenges
 Berkeley Lab - Innovative Fleet Ideas, Goal Performance & Challenges June 19, 2013 Blair Horst, PE, CEM Sustainability Coordinator / Energy Manager LBNL Happy Juneteenth!! Juneteenth: observed on June
This letter provides SPUR s comments on the Draft Supplemental Environmental Impact Statement/ Subsequent Environmental Impact Report.
 Tom Fitzwater, Environmental Planning Manager VTA Environmental Programs & Resources Management 3331 North First Street, Building B-2 San Jose, CA 95134 March 6, 2017 Submitted Electronically Re: VTA s
Car passengers on the UK s roads: An analysis. Imogen Martineau, BA (Hons), MSc
, MSc") Car passengers on the UK s roads: An analysis Imogen Martineau, BA (Hons), MSc June 14th 2005 Introduction At a time when congestion is increasing on the UK s roads and reports about global warming are
Car passengers on the UK s roads: An analysis Imogen Martineau, BA (Hons), MSc June 14th 2005 Introduction At a time when congestion is increasing on the UK s roads and reports about global warming are
Early adopters of EVs in Germany unveiled
 Early adopters of EVs in Germany unveiled Results of a study among private users of EVs in Germany Stefan Trommer, Julia Jarass, Viktoriya Kolarova DLR Institute of Transport Research Berlin, Germany DLR.de
Urban Land Use/Transport Policy, Metro and Its Impacts in Shanghai
 Towards Low Carbon Cities: Understanding and analyzing urban energy and carbon February 17-18, 2009,Nagoya Urban Land Use/Transport Policy, Metro and Its Impacts in Shanghai Pan Haixiao, Professor Department
Facts and Figures. October 2006 List Release Special Edition BWC National Benefits and Related Facts October, 2006 (Previous Versions Obsolete)
") Facts and Figures Date October 2006 List Release Special Edition BWC National Benefits and Related Facts October, 2006 (Previous Versions Obsolete) Best Workplaces for Commuters - Environmental and Energy
Facts and Figures Date October 2006 List Release Special Edition BWC National Benefits and Related Facts October, 2006 (Previous Versions Obsolete) Best Workplaces for Commuters - Environmental and Energy
WELCOME Open House on Parking
 WELCOME Open House on Parking Tonight we re presenting our policy responses for your input on how to best manage our public parking. Parking is a shared community resource. To best serve everyone in our
School Transportation Assessment
 Grade: K-12 Version 1 April 2015 School Transportation Assessment SCHOOL BUS Evaluate the carbon emissions from daily transportation related to your school and identify strategies for more sustainable
Rapid Transit and Land-Use Integration a Reality
 City of Charlotte Rapid Transit and Land-Use Integration a Reality Transportation Oversight Committee Carolyn Flowers CEO Charlotte Area Transit System April 29, 2010 Charlotte Region Statistics Mecklenburg
Transportation Sustainability Program
 Transportation Sustainability Program Photo: Sergio Ruiz A Comprehensive Approach to Growing Sustainably Public Investment and Strategies for Existing and Future Population Underway Transit capital and
Energy Technical Memorandum
 Southeast Extension Project Lincoln Station to RidgeGate Parkway Prepared for: Federal Transit Administration Prepared by: Denver Regional Transportation District May 2014 Table of Contents Page No. Chapter
Nebraska Teen Driving Experiences Survey Four-Year Trend Report
 Nebraska Teen Driving Experiences Survey Four-Year Trend Report 2014-2015, 2015-2016, and 2017-2018 School Years April 2018 Division of Public Health Injury Prevention Program Table of Contents Executive
Figure 1 Unleaded Gasoline Prices
 Policy Issues Just How Costly Is Gas? Summer 26 Introduction. Across the nation, the price at the pump has reached record highs. From unleaded to premium grade, prices have broken three dollars per gallon
Motorcoach Census. A Study of the Size and Activity of the Motorcoach Industry in the United States and Canada in 2015
 Motorcoach Census A Study of the Size and Activity of the Motorcoach Industry in the United States and Canada in 2015 Prepared for the American Bus Association Foundation by John Dunham & Associates October
Valley Metro Overview. ITE/IMSA Spring Conference March 6, 2014
 Valley Metro Overview ITE/IMSA Spring Conference March 6, 2014 Valley Metro Who Are We? Operate Regional Transit Services Valley Metro and Phoenix are region s primary service providers Light Rail and
TRAVEL DEMAND FORECASTS
 Jiangxi Ji an Sustainable Urban Transport Project (RRP PRC 45022) TRAVEL DEMAND FORECASTS A. Introduction 1. The purpose of the travel demand forecasts is to assess the impact of the project components
Carsharing for Older Populations
 Carsharing for Older Populations Susan A. Shaheen, Ph.D. Co-Director, Transportation Sustainability Research Center (TSRC), UC Berkeley sashaheen@tsrc.berkeley.edu Transportation Research Board 90 th Annual
FasTracks News. RTD s Eagle P3 Transit Project Nears Halfway Mark to Opening Day EP3 will add three commuter rail lines to metro area in 2016
 July 29, 2013 Welcome to Inside RTD FasTracks a monthly e- update to keep you informed about the progress of the Regional Transportation District's FasTracks program. FasTracks News RTD s Eagle P3 Transit
Motorcycling. New Zealand Household Travel Survey October 2015
 Motorcycling New Zealand Household Travel Survey 2009-2014 October 2015 Disclaimer: All reasonable endeavours are made to ensure the accuracy of the information in this report. However, the information
2011 Saskatoon Transit Services Annual Report
 2011 Annual Report Saskatoon Transit provides a high quality of service for all citizens in our community, and is undertaking initiatives focused on building its ridership. Saskatoon, like most North American
Husky Stadium: TMP Modernization Project
 Husky Stadium: TMP Modernization Project 1 Husky Stadium: TMP History 2 Husky Stadium TMP History 1986-1987 Husky Stadium adds the north upper deck. City of Seattle and UW agree on a plan (TMP) to mitigate
ROCHESTER, MINNESOTA
 ROCHESTER, MINNESOTA Rochester Public Works TRANSIT AND PARKING DIVISION Transit and Parking Manager Tony Knauer tknauer@rochestermn.gov SERVICE ATTITUDE CONSISTENCY - TEAMWORK ROCHESTER TRANSIT & PARKING
Transportation Sustainability Program
 Transportation Sustainability Program Photo: Sergio Ruiz San Francisco is a popular place to work, live and visit, straining the existing transportation network Roads and transit vehicles nearing capacity
Appendix B CTA Transit Data Supporting Documentation
 RED ED-PURPLE BYPASS PROJECT ENVIRONMENTAL ASSESSMENT AND SECTION 4(F) EVALUATION Appendix B CTA Transit Data Supporting Documentation 4( Memorandum Date: May 14, 2015 Subject: Chicago Transit Authority
Shared Mobility Action Plan Overview July 2017
 Shared Mobility Action Plan Overview July 2017 With support from Expanding the ecosystem of transportation choices by creating a multimodal transportation system that works for all Connect public agencies
Trip Generation and Parking Study New Californian Apartments, Berkeley
 Trip Generation and Parking Study New Californian Apartments, Berkeley Institute of Transportation Engineers University of California, Berkeley Student Chapter Spring 2012 Background The ITE Student Chapter
Memorandum. To: The Arlington County Board Date: June 29, 2018 From: Subject:
 OFFICE OF THE COUNTY MANAGER 2100 Clarendon Boulevard, Suite 302, Arlington, VA 22201 TEL 703.228.3120 FAX 703.228.3218 TTY 703.228.4611 www.arlingtonva.us Memorandum To: The Arlington County Board Date:
CORE AREA SPECIFIC PLAN
 only four (A, B, D, and F) extend past Eighth Street to the north, and only Richards Boulevard leaves the Core Area to the south. This street pattern, compounded by the fact that Richards Boulevard is