Trends in U.S. crude oil and petroleum product exports
|
|
|
- Laura Barrett
- 5 years ago
- Views:
Transcription
1 Trends in U.S. crude oil and petroleum product exports For ENERCOM Oil & Gas Conference August 21, 218 Denver, Colorado By T. Mason Hamilton, Petroleum Markets Analyst, Office of Energy Markets and Financial Analysis U.S. Energy Information Administration Independent Statistics & Analysis
2 Key Takeaways The United States is a net importer of petroleum The decrease in U.S. net petroleum imports is because of increasing exports of petroleum products U.S. crude oil exports have increased but face infrastructure limitations Distillate is the most widely exported petroleum product from the United States More than half of U.S. motor gasoline exports go to Mexico Propane exports mainly go to supply petrochemical demand in Asia 2
3 The United States is a net importer of petroleum U.S. total petroleum trade (crude oil and petroleum products) Million barrels per day imports net -5 exports
4 Decrease in U.S. petroleum net imports is because of increased product exports U.S. total petroleum trade (crude oil and petroleum products) Million barrels per day petroleum product imports crude oil imports net crude oil exports petroleum product exports
5 Exports of Hydrocarbon Gas Liquids and Distillate are the largest U.S. petroleum exports Total U.S. petroleum exports Million barrels per day share of total petroleum exports 6 5 5% residual fuel 9% petroleum coke 12% other liquids % 18% motor gasoline crude oil % distillate % hydrocarbon gas liquids 5
6 Prior to 217, product exports were responsible for most of the growth in U.S. petroleum exports Year-over-year growth in crude and petroleum product exports Crude oil Motor gasoline Distillate Hydrocarbon gas liquids Other liquids
7 The current period of U.S. crude oil exports is unlike anything seen in historical data U.S. Crude oil exports 12 1 crude oil exports 217: 1.1 million b/d crude oil exports 1938: 21, b/d crude oil exports 198: 287, b/d year-over-year change in crude oil exports 217: 527, b/d -2 7

8 Canada, China, and Europe are the top destinations for U.S. crude oil exports U.S. crude oil export destination (217) Million barrels per day Canada China United Kingdom Netherlands South Korea Italy France Singapore Japan India Spain Colombia Bahama Islands Malaysia Curacao rest of world 4% 2.7% 2.6% 2.5% 2.% 2.% 1.9% 1.5% 1.4% 1.4% 5% 8% 8% 9% 2% percent of U.S. total Source: 29% 8


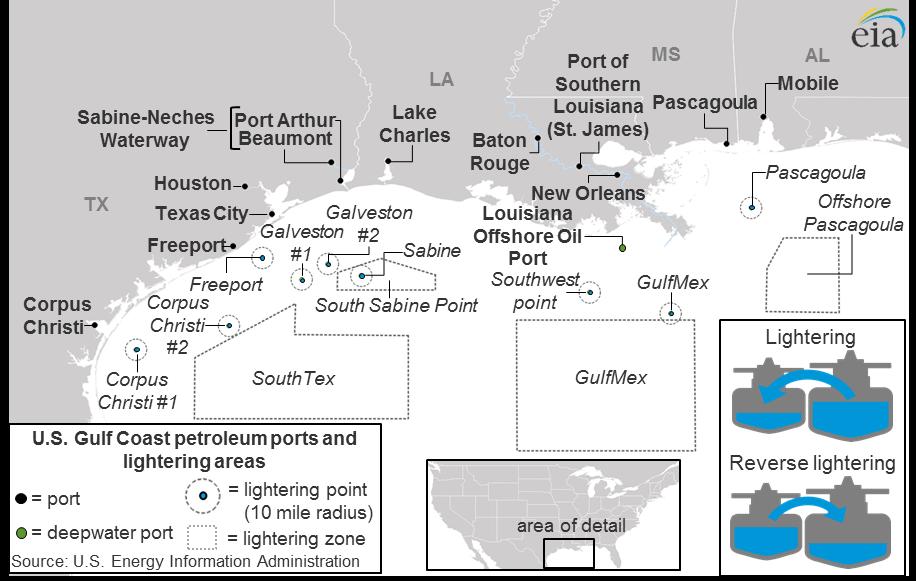
9 U.S. crude oil exports face port and infrastructure limitations 9
10 U.S. Crude oil exports continue to increase U.S. crude oil exports 2,5 U.S. crude oil export destinations (year to date, May 218) China 21% 2, Canada 2% 1,5 1, 217 annual average crude oil exports: 1.1 million b/d Italy United Kingdom 9% 9% 5 Netherlands 7% rest of world 34%
11 Differences in PADD crude oil trade balances are hidden in U.S. numbers U.S. Gulf Coast and Midwest crude oil trade million barrels per day Gulf Coast (PADD 3) Midwest (PADD 2) net imports net exports 11
12 U.S. distillate exports mostly go to Mexico and Central and South American destinations U.S. distillate exports U.S. distillate export destinations (year to date, May 218) 1,8 1,6 1,4 1,2 1, Mexico Brazil Chile Peru Panama rest of world 25% 11% 1% 6% 4% 44%
13 Distillate fuel oil is the most widely exported petroleum product from the United States Destinations receiving more than 1, b/d of distillate annually from the United States Number of destinations
14 EIA now publishes export data by PADD and by destination East Coast (PADD 1) distillate exports 25 2 East Coast (PADD 1) distillate exports West Coast (PADD 5) distillate exports Netherlands Canada Export destinations (year to date, May 218) East Coast West Coast 33% 25% Mexico Singapore 16% 31% 15 Brazil 16% Chile 16% 1 Paraguay 7% Canada 14% 5 Peru 5% Malaysia 7% rest of world 14% rest of world 15%
15 More than half of U.S. motor gasoline exports go to Mexico U.S. motor gasoline exports U.S. motor gasoline export destinations (year to date, May 218) 1,4 Mexico 55% 1,2 1, 8 Canada Brazil 7% 5% 6 Venezuela 4% Guatemala rest of world 3% 27%
16 The United States is on track to become a year-round net gasoline exporter U.S. total motor gasoline trade imports net exports
 5-5 -1 West Coast")
17 The balance of U.S. net gasoline imports or exports is between East Coast imports and Gulf Coast exports Total motor gasoline trade by PADD 15 1 East Coast (PADD 1) West Coast (PADD 5) Midwest (PADD 2) Rocky Mountain (PADD 4) Gulf Coast (PADD 3) net imports net exports
18 U.S. Propane exports largely destined for petrochemical facilities in Asia U.S. propane exports 1,2 U.S. propane export destinations (year to date, May 218) Japan 2% 1, Mexico Korea China Singapore 14% 9% 9% 7% rest of world 41%
19 HGL exports, supply, and demand changes will become increasingly important to global balances going forward HGL trade Million barrels per day.5 net imports. net exports propane net ethane natural gasoline butanes
20 Thank you For more information Subject matter experts for this presentation: T. Mason Hamilton, Petroleum Markets Analyst, Petroleum Markets Analysis Team, Office of Energy Markets and Financial Analysis
21 For more information U.S. Energy Information Administration home page This Week in Petroleum Today in Energy Annual Energy Outlook Short-Term Energy Outlook International Energy Outlook State Energy Profiles Drilling Productivity Report 21
Emerging Trends in Petroleum Markets
 Emerging Trends in Petroleum Markets For Defense Logistics Agency, Worldwide Energy Conference Washington, D.C. By T. Mason Hamilton, Petroleum Markets Analyst U.S. Energy Information Administration Independent
Evolving Global Oil Trade Flows. IEA-IEF-OPEC Joint Meeting Vienna, March 2018
 Evolving Global Oil Trade Flows IEA-IEF-OPEC Joint Meeting Vienna, March 2018 SHIFTING FLOWS: WHAT HAS THIS MEANT IN PRACTICE? US/Europe crude imports & exports Saudi crude to Poland Chinese teapots importing
Energy Outlook. U.S. Energy Information Administration. For EnerCom Dallas February 22, 2018 Dallas, TX
 Energy Outlook For EnerCom Dallas Dallas, TX Jeff Barron Industry Economist, U.S. Energy Information Administration U.S. Energy Information Administration Independent Statistics & Analysis www.eia.gov
A summary of national and global energy indicators. FEDERAL RESERVE BANK of KANSAS CITY
 THE U.S. Energy DATABOOK A summary of national and global energy indicators JULY 1, 17 FEDERAL RESERVE BANK of KANSAS CITY SUMMARY OF CURRENT ENERGY CONDITIONS The number of total active drilling rigs
NGLs and Feedstock Market Overview
 NGLs and Feedstock Market Overview Platts Inaugural Petrochemical Seminar Kelly Van Hull Manager Energy Analytics Processing & Fractionation Additions 45 129 1778 1845 553 232 6 4 17 695 * Expansions Through
Implications of the U.S. Shale Revolution
 Implications of the U.S. Shale Revolution For October 17, 214 Chicago, Illinois By Adam Sieminski, Administrator U.S. Energy Information Administration U.S. Energy Information Administration Independent
Energy Security of APEC Economies in a Changing Downstream Oil Environment
 IEEJ Feb. 2018 4th APEC OGSN Forum on 7 March 2018 Session2-2 Energy Security of APEC Economies in a Changing Downstream Oil Environment Takashi MATSUMOTO and Ichiro KUTANI Manager, Global Energy Group
May 2018 Short-Term Energy Outlook
 May 2018 for Williston Basin Petroleum Conference Bismarck, N.D. by Dr. Linda Capuano Administrator U.S. Energy Information Administration Independent Statistics & Analysis www.eia.gov Brent crude oil
Primary energy. 8 Consumption 9 Consumption by fuel. 67 th edition
 Primary energy 8 Consumption 9 Consumption by fuel 67 th edition Primary energy Consumption* Growth rate per annum Million tonnes oil equivalent 27 28 29 2 211 212 213 214 215 216 217 217 26-16 Share 217
BP Statistical Review of World Energy June 2017
 BP Statistical Review of World Energy June 217 Primary energy 8 Consumption 8 Consumption by fuel 9 66 th edition Primary energy Consumption* Growth rate per annum Million tonnes oil equivalent 26 27 28
FEDERAL RESERVE statistical release
 FEDERAL RESERVE statistical release FOR IMMEDIATE RELEASE MARCH 16, 1992 E.U C1Z1, GEOGRAPHICAL r DISTRIBUTION n OF e ASSETS AND^LIABILITIES (IN MILLIONS OF DOLLARS) ASSETS COUNTRY OF CUSTOMER 12/31/90
Production (bbl/day)
") 1 of 5 14/09/2011 22:15 From Wikipedia, the free encyclopedia This is a list of countries by oil production mostly based on CIA World Factbook data. [1] Note that oil production refers to the sum of barrels
1 of 5 14/09/2011 22:15 From Wikipedia, the free encyclopedia This is a list of countries by oil production mostly based on CIA World Factbook data. [1] Note that oil production refers to the sum of barrels
For Region 5 and Region 7 Regional Response Teams Meeting April 22, 2015 St. Charles, Missouri via video/teleconference
 For Region 5 and Region 7 Regional Response Teams Meeting St. Charles, Missouri via video/teleconference By Grant Nülle, Upstream Oil & Gas Economist, Exploration and Production Analysis Team U.S. Energy
SHALE-ADVANTAGED CHEMICAL INDUSTRY INVESTMENT
 9 April 2013 SHALE-ADVANTAGED CHEMICAL INDUSTRY INVESTMENT Martha Gilchrist Moore Sr. Director, Policy Analysis and Economics Shale Gas Shale gas is possibly the most important energy development in the
Table 16 Refinery distillation capacity, throughput and output Thousand metric tons
 Table 16 Refinery distillation capacity, throughput and output Table Notes Output is equal to the sum of production from refineries for aviation gasoline, bitumen, gas/diesel oil, ethane, feedstocks, gasoline-type
US Crude Oil Reshaping International Crude Oil Flows. Olivier Jakob,
 US Crude Oil Reshaping International Crude Oil Flows Olivier Jakob, ojakob@petromatrix.com www.petromatrix.com Claimer Petromatrix publishes since 2006 a daily market note on the oil markets Our reports
Global Polybutadiene Rubber (BR) Market Study ( )
 Market Study ( )") Global Polybutadiene Rubber (BR) Market Study (2014 2025) Table of Contents 1. INTRODUCTION 1.1. Introduction to Polybutadiene Rubber Market Product Description Properties Industry Structure Value Chain
Global Polybutadiene Rubber (BR) Market Study (2014 2025) Table of Contents 1. INTRODUCTION 1.1. Introduction to Polybutadiene Rubber Market Product Description Properties Industry Structure Value Chain
Table 16 Refinery distillation capacity, throughput and output Thousand metric tons
 Million metric tons Table 16 Refinery distillation capacity, throughput and output Table Notes Output is equal to the sum of production from refineries for aviation gasoline, bitumen, gas/diesel oil, ethane,
ANNUAL STATISTICAL SUPPLEMENT
 ANNUAL STATISTICAL SUPPLEMENT with 2016 data 2017 Edition This Statistical Supplement has been prepared to provide a longer historical perspective for the oil demand, supply, trade, stocks, prices and
World crude oil exports by country, thousand barrels daily
 World crude oil exports by country, 2002 thousand barrels daily Saudi Arabia 5 285 Former USSR 3 940 Norway 3 113 Iran 2 094 Nigeria 1 798 United Kingdom 1 746 Mexico 1 715 United Arab Emirates 1 614 Venezuela
The Supply of Oil. Projections to Oil and the Macroeconomy in a Changing World Federal Reserve Bank of Boston June 9, 2010 Boston, MA
 The Supply of Oil Projections to 2035 Oil and the Macroeconomy in a Changing World Federal Reserve Bank of Boston June 9, 2010 Boston, MA Howard Gruenspecht, Deputy Administrator Near-term oil price uncertainty
67 th edition. Renewable energy. Appendices. 44 Other renewables consumption 45 Biofuels production
 Renewable energy 44 Other renewables consumption 45 Biofuels production Appendices A1 Solar Generation A2 Wind Generation A3 Geothermal, biomass and other Generation A4 Geothermal Cumulative installed
Abstract Process Economics Program Report 222 PETROLEUM INDUSTRY OUTLOOK (July 1999)
") Abstract Process Economics Program Report 222 PETROLEUM INDUSTRY OUTLOOK (July 1999) Global energy demand is rising, with fossil fuels oil, natural gas, and coal continuing to provide more than 90% of
Abstract Process Economics Program Report 222 PETROLEUM INDUSTRY OUTLOOK (July 1999) Global energy demand is rising, with fossil fuels oil, natural gas, and coal continuing to provide more than 90% of
2016 U.S. ETHANOL EXPORTS AND IMPORTS
 2016 U.S. ETHANOL EXPORTS AND IMPORTS STATISTICAL SUMMARY Copyright 2017 Renewable Fuels Association. All Rights Reserved 2016 U.S. ETHANOL EXPORTS U.S. Ethanol Exports, 2006-2016 1,200 1,000 800 600 396
Information Technology and Economic Development: An Introduction to the Research Issues
 November 1998 Working Papers No. 153 Information Technology and Economic Development: An Introduction to the Research Issues TABLE 1 WORLD-WIDE INFORMATION TECHNOLOGY MARKET BREAKDOWN, 1995
Focus on Refinery Product Flows
 December 14, 2016 Focus on Refinery Product Flows Stratas Advisors Gasoline Imports in 2014 CIS and the Middle East are the largest gasoline exporters to Asia. While China and India do not import gasoline
The Great Transition: Shifting from Fossil Fuels to Solar and Wind Energy Supporting Data - Hydropower
 The Great Transition: Shifting from Fossil Fuels to Solar and Wind Energy Supporting Data - Hydropower World Installed Hydroelectric Generating Capacity, 1980-2013 GRAPH: World Installed Hydroelectric
World Geographic Shares
 World Geographic Shares North America South America Europe Africa Asia Australia/ Oceania 18% 13% 7% 22% 33% 6% World Population Shares North America South America Europe Africa Asia Australia/ Oceania
Spain s exports by oil product group and country of destination. Year Corporación de Reservas Estratégicas de Productos Petrolíferos
 Corporación de Reservas Estratégicas de Productos Petrolíferos Castellana, 79 28046 Madrid T. +34 91 360 09 10 Updated F. +34 91 420 on39 45 www.cores.es July 13 th 2015 Spain s exports by oil product
Methodology. Supply. Demand
 Methodology Supply Demand Tipping the Scale 1 Overview Latin America and the Caribbean, a major petroleum product importing region, provides an important counterbalance to surpluses in refined product
Natural gas. 26 Reserves 28 Production and consumption 33 Prices 34 Trade movements. 67 th edition
 Natural gas 26 Reserves 28 Production and consumption 33 Prices 34 Trade movements 67 th edition Natural gas Total proved reserves At end 1997 At end 2007 At end 2016 At end Trillion Trillion Trillion
Presented by Ken Roberts President, WorldCity Dec. 2, 2014
 Presented by Ken Roberts President, WorldCity Dec. 2, 2014 Hemispheric Snapshot Brazil Colombia Mexico United States Closer look: Mexico-US Trade Top U.S. Customs districts Top Mexico Exports to the U.S.
Sharp Decline in Vegetable Oil Stocks Leads to Steeply Higher Prices
 United States Department of Agriculture Foreign Agricultural Service Circular Series FOP 1-11 Sharp Decline in Vegetable Oil Leads to Steeply Higher Prices Commodity prices have been on an upward trend
Market Report Series: Oil 2018 Analysis & Forecasts to Energy Community 10 th Oil Forum, Belgrade, 25 September 2018
 Market Report Series: Oil 218 Analysis & Forecasts to 223 Energy Community 1 th Oil Forum, Belgrade, 25 September 218 Short term update: crude prices (excl. WTI) up strongly Aug/Sep $/bbl 8 Benchmark Crude
Midwest Association of Rail Shippers
 January 13, 2016 Midwest Association of Rail Shippers Lance Fritz Chairman and CEO Union Pacific 1 2015 Economic Results Consumer-driven growth 1 Consumer Spending 2 Light Vehicle Sales 3.6% 3.0% 3.0%
Production of minor oil products from refineries - by type Thousand metric tons
 Production of minor oil from refineries - by type Table 23 Table Notes Data refer to production from refineries of refinery, ethane, naphtha, lubricants, bitumen, paraffin, petroleum, white spirit, and
2014 U.S. ETHANOL EXPORTS AND IMPORTS STATISTICAL SUMMARY
 2014 U.S. ETHANOL EXPORTS AND IMPORTS STATISTICAL SUMMARY Copyright 2015 Renewable Fuels Association. All Rights Reserved 2014 U.S. ETHANOL EXPORTS Annual U.S. Ethanol Exports, 2005-2014 1,200 1,193 1,000
ANNUAL STATISTICAL SUPPLEMENT
 ANNUAL STATISTICAL SUPPLEMENT with 2008 data 2009 Edition This Statistical Supplement has been prepared to provide a longer historical perspective for the oil demand, supply, trade, stocks, prices and
I. World trade in Overview
 I. World trade in - Overview Table I.1 Growth in the volume of world merchandise exports and production, 2-5 (Annual percentage change) 2-5 23 24 World merchandise exports 4.5 5. 9.5 6. Agricultural products
Global Downstream Petroleum Outlook
 Global Downstream Petroleum Outlook Claude Mandil Executive Director International Energy Agency 3 rd OPEC International Seminar Vienna, 12 September 26 Spare Refinery Capacity Has Tightened 9 1% 85 95%
Coal. 36 Reserves and prices 38 Production and consumption. 67 th edition
 Coal 36 Reserves and prices 38 Production and consumption 67 th edition Total proved reserves at end 217 Million tonnes Anthracite and bituminous Subbituminous and lignite US 228 3116 25916 24.2% 357 Canada
About Czarnikow. The Premier Provider of Sugar Market Services. Czarnikow has been in the sugar business since 1861
 About Czarnikow The Premier Provider of Sugar Market Services Czarnikow has been in the sugar business since 1861 Czarnikow is the leading professional services company in the sugar market Czarnikow has
Table 13 Production, trade and supply of conventional crude oil Thousand metric tons; kilograms per capita; reserves production ratio (R/P) in years
 in years") , trade and supply of conventional crude oil Thousand metric tons; kilograms per capita; reserves production ratio (R/P) in years Table Notes The Reserves / ratio refers to crude oil and natural gas liquids.
, trade and supply of conventional crude oil Thousand metric tons; kilograms per capita; reserves production ratio (R/P) in years Table Notes The Reserves / ratio refers to crude oil and natural gas liquids.
Thermal Coal Market Presentation to UNECE Ad Hoc Group of Experts on Coal in Sustainable Development December 7, 2004
 Thermal Coal Market Presentation to UNECE Ad Hoc Group of Experts on Coal in Sustainable Development December 7, 2004 Barlow Jonker Pty Ltd Commercial in Confidence 1 Presentation Outline 1. Barlow Jonker
Table 23 Production of minor oil products from refineries - by type Thousand metric tons
 Table 23 Production of minor oil from refineries - by type Table Notes Data refer to production from refineries of refinery, ethane, naphtha, lubricants, bitumen, paraffin, petroleum, white spirit, and
Global Medium & Heavy Commercial Vehicle Model Level Production Forecast Report. From 2001 to 2021
 Global Medium & Heavy Commercial Vehicle Model Level Production Forecast Report From 2001 to 2021 Global CV Markets Covered Industry Production Data Truck & Bus Model Production Forecast Engine Production
U.S. GASOLINE AND DISTILLATE FUELS UPDATE - DECEMBER 20, 2017
 U.S. GASOLINE AND DISTILLATE FUELS UPDATE - DECEMBER 20, 2017 PRICE TRENDS Monday, December 18 According to the Energy Information Administration (EIA), the average U.S. retail price for regular grade
Pakistan Oilseed Processors Seize Opportunity to Crush Soybeans
 United States Department of Agriculture Foreign Agricultural Service December 2015 Pakistan Oilseed Processors Seize Opportunity to Crush Soybeans Pakistan, long an importer of soybean meal, is transitioning
Monthly Biodiesel Production Report
 Monthly Biodiesel Production Report With data for June 2017 August 2017 Independent Statistics & Analysis www.eia.gov U.S. Department of Energy Washington, DC 20585 This report was prepared by the U.S.
Textile Per Capita Consumption
 November 2017 Textile Per Capita Consumption 2005-2022 Part 1: Lower middle income countries CHF300.- Table of Contents Preface... 4 Sources... 5 Definitions... 6 Charts... 7 Executive Summary... 9 Country
PVC and Chlor-Alkali In a Vibrant Region
 PVC and Chlor-Alkali In a Vibrant Region Joel Lindahl Director, Chlor-Alkali & Vinyls Americas Foro PEMEX Petroquímica Junio 2011 1Singapore Shanghai Bangkök Houston New York London Düsseldorf Dubai Latin
Share of Brazil s Soybean Exports to China Spikes in August
 United States Department of Agriculture Foreign Agricultural Service September 2018 Share of Brazil s Soybean Exports to China Spikes in August Monthly Share of Brazil's Soybean Exports to China 85% 75%
World Air Conditioner Demand by Region
 World Air Conditioner Demand by Region April 2015 The Japan Refrigeration and Air Conditioning Industry Association 1 World Air Conditioner Demand by Region April 2015 The Japan Refrigeration and Air Conditioning
The Great Transition: Shifting from Fossil Fuels to Solar and Wind Energy Supporting Data - Coal
 The Great Transition: Shifting from Fossil Fuels to Solar and Wind Energy Supporting Data - Coal Proved Coal Reserves, 213 GRAPH: Proved Coal Reserves in Top Countries, 213 Coal Production in Top Ten Countries
Table B1. Advanced Economies: Unemployment, Employment, and Real per Capita GDP (Percent)
") Statistical Appendix Table B1. Advanced Economies: Unemployment, Employment, and Real per Capita GDP (Percent) Unemployment Rate 2 Averages 1 1993 2002 2003 12 Advanced Economies 6.8 6.9 6.7 6.5 6.3 5.8
Statistical Appendix Table B1. Advanced Economies: Unemployment, Employment, and Real per Capita GDP (Percent) Unemployment Rate 2 Averages 1 1993 2002 2003 12 Advanced Economies 6.8 6.9 6.7 6.5 6.3 5.8
Indian Soybean Meal Exports Unlikely to Recover in 2015/16
 United States Department of Agriculture Foreign Agricultural Service November 2015 Indian Soybean Meal Exports Unlikely to Recover in Though once a significant regional exporter of soybean meal, India
Weak Real to Boost Brazil s Soybean Exports in 2016
 United States Department of Agriculture Foreign Agricultural Service October 2015 Weak Real to Boost Brazil s Soybean Exports in 2016 Brazil s exchange rate is having a significant impact on domestic and
Table 5 Production, trade and supply of hard coal Thousand metric tons and kilograms per capita
 Table Notes Production includes production from other sources as defined in the previous table. Data for China include brown coal. Please refer to the Definitions Section on pages ix to xv for the appropriate
Cotton This Month. Major Changes in Supply and Demand Estimates and Projections
 1629 K Street NW, Suite 702 Washington, DC 20006, USA Cotton This Month February 1, 2018 Major Changes in Supply and Demand Estimates and Projections India Mexico Pakistan United States 2017/18 production
Table 5 Production, trade and supply of hard coal Thousand metric tons and kilograms per capita
 Table Notes Production includes production from other sources as defined in the previous table. Data for China include brown coal. Please refer to the Definitions Section on pages ix to xv for the appropriate
Defining the Debate: Crude Oil Exports
 Defining the Debate: Crude Oil Exports Trisha Curtis, Director of Research Upstream and Midstream Energy Policy Research Foundation, Inc. (EPRINC) Brookings Task Force February 28th, 214 About EPRINC www.eprinc.org
2017 U.S. Ethanol Exports and Imports. Statistical Summary Renewable Fuels Association. All Rights Reserved.
 2017 U.S. Ethanol Exports and Imports Statistical Summary 2018 Renewable Fuels Association. All Rights Reserved. 2017 U.S. ETHANOL EXPORTS Annual U.S. Ethanol Exports 1, 1, 1,000 800 600-1,367 1,193 1,169
Rice Global E&C Forum August 9, 2013
 Rice Global E&C Forum August 9, 2013 Midyear Forecast: July 1, 2013 Conglin Xu, Senior Editor-Economics Laura Bell, Statistics Editor Alan Petzet, Chief Editor-Exploration Forecast & Review: Jan. 7, 2013
Weekly Petroleum Status Report
 DOE/EIA-0208(2015-34) Distribution Category UC-98 Data for Week Ended: August 14, 2015 Weekly Petroleum Status Report EIA DATA ARE AVAILABLE IN ELECTRONIC FORM The tables in the Weekly Petroleum Status
Table 13 Production, trade and supply of conventional crude oil Thousand metric tons; kilograms per capita; reserves production ratio (R/P) in years
 in years") Table 13, trade and supply of conventional crude oil Thousand metric tons; kilograms per capita; reserves production ratio (R/P) in years Table Notes The Reserves / ratio refers to crude oil and natural
Table 13, trade and supply of conventional crude oil Thousand metric tons; kilograms per capita; reserves production ratio (R/P) in years Table Notes The Reserves / ratio refers to crude oil and natural
Coconut Oil Prices Spike
 United States Department of Agriculture Foreign Agricultural Service Coconut Oil Prices Spike Coconut oil prices have surged over the past year in contrast to the general downward trend in other vegetable
Table 13 Production, trade and supply of conventional crude oil Thousand metric tons; kilograms per capita; reserves production ratio (R/P) in years
 in years") Million metric tons Million metric tons Table 13, trade and supply of conventional crude oil Thousand metric tons; kilograms per capita; reserves production ratio (R/P) in years Table Notes The Reserves
Million metric tons Million metric tons Table 13, trade and supply of conventional crude oil Thousand metric tons; kilograms per capita; reserves production ratio (R/P) in years Table Notes The Reserves
China s Global Peanut Export Share Declines
 United States Department of Agriculture Foreign Agricultural Service Circular Series FOP 07-13 China s Global Peanut Export Share Declines U.S. 10% Others 19% Argentina 17% U.S. 11% Others 16% Argentina
OCTANE THE NEW ECONOMICS OF. What Drives the Cost of Octane and Why Octane Costs Have Risen Since 2012 T. J. HIGGINS. A Report By:
 THE NEW ECONOMICS OF OCTANE What Drives the Cost of Octane and Why Octane Costs Have Risen Since 2012 A Report By: T. J. HIGGINS Contents Foreword... 1 1. Executive Summary... 2 2. Tracking the Changing
Linu Mathew Philip. Centre for Trade and Development (Centad), New Delhi, India
, New Delhi, India") Linu Mathew Philip Centre for Trade and Development (Centad), New Delhi, India Regional Dialogue in Biofuels in Asia 9-10 November 2009 Relevance of Biofuel in the new context Trends Production Consumption
Linu Mathew Philip Centre for Trade and Development (Centad), New Delhi, India Regional Dialogue in Biofuels in Asia 9-10 November 2009 Relevance of Biofuel in the new context Trends Production Consumption
U.S. Rail Crude Oil Traffic
 U.S. Rail Crude Oil Traffic Association of American Railroads May 217 Summary U.S. crude oil production has risen sharply in recent years, with much of the increased output moving by rail. In 28, U.S.
Soybean and Oilseed Meal Import Prospects Higher as Severe Weather Damages EU Crops
 Million Tons Million Tons Million Tons United States Department of Agriculture Foreign Agricultural Service August 2018 Soybean and Oilseed Meal Import Prospects Higher as Severe Weather Damages EU Crops
U.S. Rail Crude Oil Traffic
 U.S. Rail Crude Oil Traffic Association of American Railroads November 215 Summary U.S. crude oil production has risen sharply in recent years, with much of the increased output moving by rail. In 28,
Soybean Trade Growth: A Story of Brazil, the United States, and China
 United States Department of Agriculture Foreign Agricultural Service October 2017 Soybean Trade Growth: A Story of Brazil, the United States, and China 12-Month Soybean Export Growth Year Ending September
Global High Performance Anticorrosion Coatings Market Study ( )
") Global High Performance Anticorrosion Coatings Market Study (2014 2025) Table of Contents 1. INTRODUCTION 1.1. Introduction to High Performance Anticorrosion Coatings Market Product Description Materials,
Global High Performance Anticorrosion Coatings Market Study (2014 2025) Table of Contents 1. INTRODUCTION 1.1. Introduction to High Performance Anticorrosion Coatings Market Product Description Materials,
Weekly Statistical Bulletin
 API 1220 L Street, NW Washington, DC 20005 Weekly Statistical Bulletin STATISTICS DEPARTMENT Volume: 93 Number: 35 Week Ending: August 31, 2012 SUMMARY (In thousands of 42-gallon barrels per day, except
KEY METRICS FINANCIAL
 ABBOTT GLOBAL CITIZENSHIP REPORT METRICS 2015 KEY METRICS FINANCIAL SALES WORLDWIDE DIVIDENDS PAID 2012 2013 2014 2015 2012 2013 2014 2015 Dollars in Millions Dollars in Billions TOTAL 19,050* 19,657*
Downstream & Chemicals
 Downstream & Chemicals Pierre Breber Executive Vice President Profitable downstream & chemicals portfolio Fuels refining & marketing Focused, regional optimization Petrochemicals Advantaged feed, scale
GLOBAL SUSTAINABILITY REPORT 2016
 GLOBAL SUSTAINABILITY REPORT 2016 KEY METRICS FINANCIAL SALES WORLDWIDE Dollars in Millions 2013 2014 2015 2016 DIVIDENDS PAID Dollars in Billions 2013 2014 2015 2016 TOTAL 19,657 20,247 20,405 20,853
China Soybean Imports Stagnant Despite Record Consumption as Production Rebounds
 United States Department of Agriculture Foreign Agricultural Service Circular Series FOP 9-08 tember 2008 China Soybean Stagnant Despite Record Consumption as Rebounds Million Tons 60 50 40 30 20 10 0
Market Report Series Oil 2018 Analysis and Forecasts to Columbia University Centre on Global Energy Policy, New York, May 22 nd 2018
 Market Report Series Oil 218 Analysis and Forecasts to 223 Columbia University Centre on Global Energy Policy, New York, May 22 nd 218 Robust global oil demand growth to 223 1.8 1.6 1.4 1.2 1..8.6.4.2.
REVIEW OF MARITIME TRANSPORT 2013
 UNITED NATIONS CONFERENCE ON TRADE AND DEVELOPMENT REVIEW OF MARITIME TRANSPORT 2013 Report by the UNCTAD secretariat Annex III UNITED NATIONS New York and Geneva, 2013 STATISTICAL ANNEX 173 True nationality
Cotton This Month. Major Changes in Supply and Demand Estimates and Projections
 1629 K Street NW, Suite 702 Washington, DC 20006, USA Cotton This Month March 1, 2018 Major Changes in Supply and Demand Estimates and Projections Brazil China Turkey United States 2017/18: production
GLOBAL SUMMARY REPORT Market for High Voltage Insulators & Bushings
 GLOBAL SUMMARY REPORT Market for High Voltage Insulators & Bushings 2010-2015 - 2025 GOULDEN REPORTS October 2016 No 1 Priorsfield, Marlborough, Wiltshire, SN84AQ. United Kingdom Tel: +44 1672 513316 Fax:
Imports of seed for sowing by country Calendar year 2011 Source: ISF compilation based on official statistics and international seed trade reports
 USA 157,432 15,562 464 173,458 523 318 67 908 Germany 195,159 5,913 520 201,592 595 97 22 714 France 125,701 4,389 277 130,367 522 150 11 683 Netherlands 140,899 12,253 796 153,948 250 330 48 628 Italy
Market Report Series Oil 2018
 Market Report Series Oil 218 Norwegian Ministry of Energy, 17 April 218 Neil Atkinson, Head of Oil Industry and Markets Division Toril Bosoni, Senior Oil Market Analyst, Oil Industry and Markets Division
JURISDICTIONS PARTICIPATING IN THE CONVENTION ON MUTUAL ADMINISTRATIVE ASSISTANCE IN TAX MATTERS
 JURISDICTIONS PARTICIPATING IN THE CONVENTION ON MUTUAL ADMINISTRATIVE ASSISTANCE IN TAX MATTERS STATUS 27 JULY 2018 ORIGINAL CONVENTION 27-05-2010) OR OR 1. ALBANIA 01-03-2013 (AC) 08-08-2013 01-12-2013
Growing Fuel Use Limits Exports of Soybean Oil by South America
 United States Department of Agriculture Foreign Agricultural Service Circular Series FOP 11-09 ember 2009 Growing Fuel Use Limits of Soybean Oil by South America 2006/07 Soybean Oil Distribution Soybean
WORLD MOTOR VEHICLE PRODUCTION BY COUNTRY AND TYPE QUARTERS June 14, 2018
 QUARTERS 2017-2018 June 14, 2018 CONTENTS BASEPROTOTAL BASEPROCARS BASEPROLCV BASEPROHCV BASEPROBC Summation of cars, LCVs, HCVs, heavy buses Cars LCVs HCVs Heavy buses Note: The production of cars and
Oil. 12 Reserves 14 Production and consumption 20 Prices 22 Refining 24 Trade movements. 67 th edition
 Oil 12 Reserves 14 Production and consumption 20 Prices 22 Refining 24 Trade movements 67 th edition Oil Total proved reserves At end 1997 At end 2007 At end 2016 At end Thousand million barrels Thousand
Annex IV. True nationality of the 20 largest fleets by flag of registration, as at 1 January 2011 a
 194 Annex IV. True nationality of the 20 largest fleets by flag of registration, as at 1 January 2011 a Antigua and Barbuda Bahamas China Belgium 0 0-9 122 0.2 1 59 0.1 Bermuda 0 0-17 1 907 2.8 0 0 - Brazil
Recent Developments in EU Refining and in the Supply and Trade of Petroleum Products
 Recent Developments in EU Refining and in the Supply and Trade of Petroleum Products Third Meeting of the EU Refining Forum Brussels, 22 May 2014 Toril Bosoni, International Energy Agency OECD/IEA 2014
 Urchin 7 cflag.ifas.ufl.edu Page 1 of 2 Standard View Export All Visits Permalink Geo Location Jul 1, 2015 - Jul 31, 2015 First Date 2015 Compare to Past Jan Feb Mar Apr May Jun Jul Aug Sep Oct Nov Dec
Summary of debt securities outstanding
 Summary of debt securities outstanding All countries........................ 22,695 15,852 6,665 3,427 1,762 Developed countries........................ 16,504 13,087 5,869 2,716 701 Austria 510 173 44
Argentine Exporters Switch to Soybean Oil as Biodiesel Exports Fall
 United States Department of Agriculture Foreign Agricultural Service Circular Series FOP 08-13 Argentine Exporters Switch to Soybean Oil as Biodiesel Exports Fall Argentina s soybean oil exports have surged
The Case for Mexico to Improve Vehicle Fuel Efficiency
 The Case for Mexico to Improve Vehicle Fuel Efficiency Feng An Energy and Transportation Technologies LLC Katherine Blumberg International Council on Clean Transportation Workshop on Sustainable Transport
World real merchandise trade grows faster than output
 I. I. world trade developments 8 Merchandise trade and GDP World real merchandise trade grows faster than output In 2006, the volume of world merchandise trade grew by 8 per cent while world gross domestic
Refining Industry to Asia-Pacific, Middle East and Africa to Emerge as Key Regions for Infrastructure Investments for Capacity Additions
 Refining Industry to 2017 Asia-Pacific, Middle East and Africa to Emerge as Key Regions for Infrastructure Investments for Capacity Additions GBI Research Report Guidance GBI Research Report Guidance Chapter
I. Global wine markets,
 I. Global wine markets, 2007-09 Table 1: Summary of the world's wine markets, 2007-09 (annual average) Vine % of cropland Wine Wine Wine Wine Wine Per adult wine Pop- GDP GDP Area under vines produced
Global Motorcycle Market Research Report 2018
 Report Information More information from: https://www.wiseguyreports.com/reports/3271957-global-motorcycle-market-research-report-2018 Global Motorcycle Market Research Report 2018 Report / Search Code: