North American Energy Roundtable: Panel 1
|
|
|
- Terence Bailey
- 5 years ago
- Views:
Transcription
1 University of Nevada, Las Vegas Digital North American Energy Roundtable North American Energy Roundtable Mar 27th, 8:45 AM - 10:00 AM North American Energy Roundtable: Panel 1 Ricardo Samaniego-Breach Autonomous Technological Institute of Mexico Angela Colarusso U.S. Department of Energy Jeff Rush TransCanada U.S. Pipelines West Len Webber Legislative Assembly of Alberta & Parliamentary Assistant for Energy Repository Citation Samaniego-Breach, Ricardo; Colarusso, Angela; Rush, Jeff; and Webber, Len, "North American Energy Roundtable: Panel 1" (2009). North American Energy Roundtable This Event is brought to you for free and open access by the Conferences/Meetings (USI) at Digital Scholarship@UNLV. It has been accepted for inclusion in North American Energy Roundtable by an authorized administrator of Digital Scholarship@UNLV. For more information, please contact digitalscholarship@unlv.edu.

2 North American Energy Roundtable! Panel 1 March 27, 2009! University of Nevada, Las Vegas
3 North American Energy Security and Supply: A Mexican Perspective Ricardo Samaniego-Breach Autonomous Technological Institute of Mexico North American Energy Roundtable University of Nevada, Las Vegas March 27, 2009
4 Opening Remarks 1. An overview of Mexico s oil and gas sector Basic information The fall in production The decrease of reserves Growing gasoline imports Fiscal regime The need for reform 2. Scenarios towards 2025 Trend scenario Scenarios with increased investment Scenario with full impact of the reform of 2008
5 1.1 Overview: Mexico s Oil and Gas Sector At A Glance Petroleos Mexicanos or Pemex is the largest company in Mexico and Latin America and the largest fiscal contributor to the country. It is one of the few oil companies in the world that integrates all the productive chains of the industry: upstream, downstream and final product commercialization.
6 1.1 Overview: Mexico s Oil and Gas Sector At A Glance During 2008 it recorded total sales of about 121 billion dollars of which In 2008 odomestic sales of 680 billion pesos (about 62 billion dollars) and o Exports of 644 billion pesos (about 59 billion dollars). othe daily average oil production was million barrels per day and exports of 1.4 million barrels per day o Natural gas production was 6,919 million cubic feet per day o Gasoline production was 436 thousand barrels per day odiesel and jet fuel production was 408 thousand barrels per day
7 1.2 Overview: Mexico s Oil and Gas Sector At A Glance PEMEX in the world is: o 3rd in crude oil production o 11th integrated oil company o 12th in crude oil reserves o 15th in natural gas production o 13th in refining capacity
8 1.2 Overview: Mexico s Oil and Gas Sector At A Glance Total investment in Pemex during 2008 totaled 285 billion pesos (or about 26 billion dollars) o An increase of 21.5% over 2007 o Most of the investment is in upstream (95% of all is financed investment in Pemex) Assets and debt. In 2008: o Pemex total assets amount to 1,227 billion pesos (about 112 billion dollars) o Pemex short and long term debt is 587 billion pesos (about 53 billion dollars)
9 1.3 Oil production has been falling; most of the reduction comes from the decay of the Cantarell heavy oil field (thousand barrels daily) Crude Oil Natural By type By region Total Total Gas Crude Heavy Light Extralight Marine Southern Northern liquids a ,825 3,383 2, , ,760 3,333 2, , ,683 3,256 2, , b 3,471 3,076 2, , R 3,157 R 2,792 R 1, R 2, a. Includes condensates. b. Adjusted production and corrected by water content. c. The ouput volume shows a reduction due to adverse climatological conditions that mantained closed the wells.
10 1.4 The fall in crude oil production began in 2004 and is 15.4% below its peak Crude oil production (Thousand barrels per day (tbd)) 591 tbd 2, ,
11 1.5 The oil recovery factor in Mexico is low by international standards Country Oil companies RF 1995 Mexico Mejorar la tasa de Average recuperación (w/o Mexico) Source:: Distribution and Evolution of Recovery Factors, EIA. RF 2005 % change year of reform Saudi Arabia Kuwait Norway Russia United States Brazil Great Britain Canada Nigeria Argentina Colombia p. 66
12 1.4 The fall in oil and gas reserves has been steady since 2002 Evolution of oil and gas reserves (Billion barrels of crude oil equivalent, Bbcoe) In 2008 proven reserves fell to 14.3 Bbcoe and 3P reserves to 43.6 Bbcoe
13 1.5 The value of Mexico s oil exports has doubled but the imports of refined products, natural gas and petrochemicals has increased four-fold since 2004 (million U.S. dollars) Total a PEMEX Pemex Exports/Total Exports Imports Balance Exports Imports b Balance Percentage , ,067-28,021 23,422 5,565 17, , ,141-29,309 31,703 9,363 22, , ,627-30,217 38,672 11,292 27, , ,949-10,074 42,582 16,938 25, , ,645-16,838 49,551 23,466 26, a. Starting from 2007, Banco de México presents exports with products abroad procesing included. SOURCE: Banco de México. b. Only refined products, natural gas and petrochemicals.
14 1.6 The volume of imports of gasoline has increased 250% since 2004 and imports of diesel are also increasing sharply (thousand barrels daily) Total LPG b Gasolines c Diesel Fuel oil Others Natural Gas Petrochemicals MMcfd Mt MMcfd = Million cubic feet daily Mt = Thousand tonnes a. Excludes return of products under procesing agreement (values in Mbd): 94.5 of gasolines, 1.2 of isobutane, 10.0 of diesel, 0.9 of jet fuel and 1.2 of fuel oil for 2002; 87.2 of gasolines, 0.9 of isobutane, 5.4 of diesel and 1.6 of fuel oil for 2003; 0.7 of diesel and 79.1 of gasolines for 2004; 3.4 of diesel and 62.4 of gasolines for 2005; 0.7 of diesel and 69.5 of gasolines for 2006; and 2.2 of gasolines for b. Includes propane and butane. c. Includes MTBE.
15 1.7 Pemex financial losses come from the refining and petrochemical sectors Pemex net profits (billion 2007 pesos) *First quarter * PEP Sector Gas Transformación processing, refining and Total petrochemical
16 1.8 Pemex s fiscal regime is not abnormally exacting As a % of profits, Pemex taxes are about the median of other countries Country Taxes and royalties as a % of profits Great Britain 40 New Zeeland 41 South Africa 50 Australia 59 Malaysia 66 Mexico 77 United Arab Emirates 84 Indonesia 86 Libya 86 Qatar 87 Iran 95 Source: Johnston, Daniel, Higher Prices Lower Government Take? Petroleum Accounting and Financial Management Journal, Autumn/Winter 2004, vol.23 No. 3, pp ).
17 Scenarios towards 2025 Trend scenario Scenarios with increased investment Scenario with full impact of the reform of 2008
 1,800 tbd Other fields Present fields Source: PEMEX.")
18 2.1 Production under a business as usual scenario Production with trend investment (thousand barrels per day, tbd) 1,800 tbd Other fields Present fields Source: PEMEX.
19 2.2 Production under additional investment scenario Production with new investment in the Southeastern region (thousand barrels a day relative to 2008) 1,100 tbd 1,800 tbd Southeastern fields 700 tbd Other fields Present fields Sourcee: PEMEX.
 1,077 tbd 23 tbd 1,800 tbd Abandoned fields Southeastern fields Other fields Present fields Source:")
20 2.3 Production under new investments and new fiscal regime scenario Oil production with new investments and new fiscal regime for abandoned fields (thousand barrels per day relative to 2008) 1,077 tbd 23 tbd 1,800 tbd Abandoned fields Southeastern fields Other fields Present fields Source: PEMEX.
21 2.4 Production under energy reform and Chicontepec region scenario Oil production with new investments and a new fiscal regime for abandoned fields and Chicontepec (thousand barrels per day relative to 2008) 500 tbd Mbd 600 tbd 1,800 tbd Abandoned fields Southeastern fields Other fields Present fields Source: PEMEX.
 1,800 tbd 500 tbd New fields Deep water Present fields Abandoned fields Southeastern fields Other fields The present fall in production does not reflect Mexico s potential")
22 2.5 Production under full impact of the 2008 energy reform Oil production with new investments and a new fiscal regime for abandoned fields, Chicontepec, and deep water production (thousand barrels per day relative to 2008) 1,800 tbd 500 tbd New fields Deep water Present fields Abandoned fields Southeastern fields Other fields The present fall in production does not reflect Mexico s potential
23 North American Energy Roundtable March 27, 2009! University of Nevada, Las Vegas


24 Alberta Energy Len Webber Member, Legislative Assembly, Alberta, Canada Parliamentary Assistant for Energy March 27, 2009


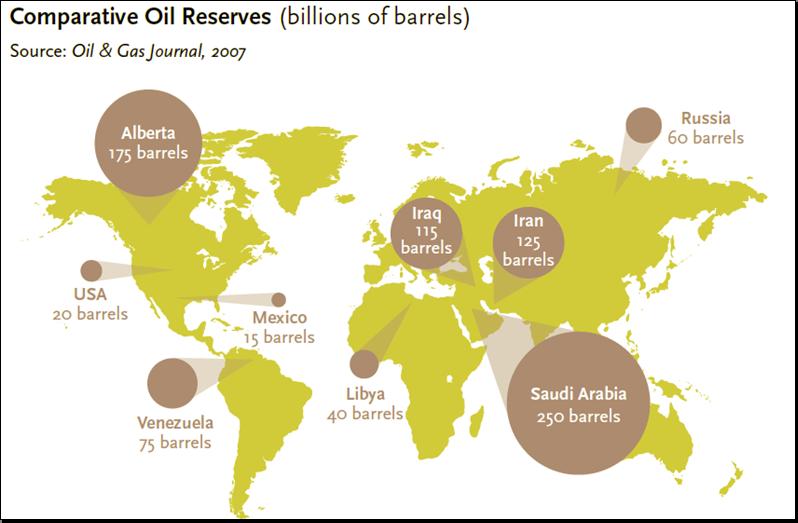
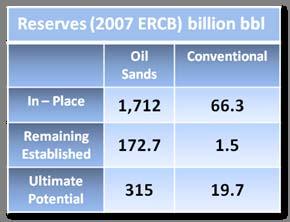
25 Sources: Alberta Energy Resources Conservation Board US Energy Information Administration Alberta is the world s third largest producer and exporter of natural gas, and by far the largest supplier of natural gas to the U.S. In 2007, Alberta exported enough natural gas to the U.S. to supply approximately 20 million residential households.


26 Alberta Natural Gas Production Alberta s natural gas transportation hub provides access to markets for northern gas. Alberta natural gas reaches markets from northern California to the eastern seaboard. Source: Alberta Energy Resources Conservation Board
27

28 Alberta currently produces 1.8 million bbl/d of crude oil, the majority of which goes to the U.S.
29 Million Barrels Per Day Oil!Sands Con v e n tio n a ll 1.8 mbbl/d 3.2 mbbl/d 0 Oil sands will be responsible for future oil production increases in Alberta.

30 Unlike tankers, pipelines represent infrastructure largely dedicated to delivering crude oil to the U.S.


31 Source: U.S. Energy Information Administration Alberta Energy Resources Conservation Board


32 Carbon Capture and Storage Main element of Alberta s Climate Change Strategy. $2 billion for large-scale CCS projects. Funding to accelerate the development of projects and encourage investment from industry to make large-scale CCS projects viable. Alberta s geology ideal for CCS and enhanced oil recovery.
World crude oil exports by country, thousand barrels daily
 World crude oil exports by country, 2002 thousand barrels daily Saudi Arabia 5 285 Former USSR 3 940 Norway 3 113 Iran 2 094 Nigeria 1 798 United Kingdom 1 746 Mexico 1 715 United Arab Emirates 1 614 Venezuela
Monthly Petroleum Statistics
 AUGUST 2015 Vol. XXVII No. 8 Monthly Petroleum Statistics SUBDIECCIÓN DE DESEMPEÑO DEL NEGOCIO AV. MAINA NACIONAL 329 GEENCIA DE INDICADOES OPEATIVOS Y DEL NEGOCIO PISO 31 TOE EJECUTIVA 11311 MÉXICO D.
OPEC PRIMARY ENERGY CONSUMPTION IN 2005 (1)
") CHAPTER 4 I n 1384, political tensions in the Middle East and some oil-producing countries, sabotage in Iraq s oil industry and speculation in the market raised oil prices incrementally. As of the beginning
CHAPTER 4 I n 1384, political tensions in the Middle East and some oil-producing countries, sabotage in Iraq s oil industry and speculation in the market raised oil prices incrementally. As of the beginning
2009 Mexico in the World Proved crude oil reserves 17 Proved gas reserves 31 Crude oil production 6 Natural gas production 12 Atmospheric
 07 INTERNATIONAL COMPARISONS 2009 Mexico in the World Proved crude oil reserves 17 Proved gas reserves 31 Crude oil production 6 Natural gas production 12 Atmospheric distillation capacity 14 International
Oil and Gas Projects in Mexico and Expectations for Japanese Technologies
 JOGMEC Techno Forum 2013 PEMEX Exploración y Producción Subdirección de Distribución y Comercialización Gerencia De Operaciones Oil and Gas Projects in Mexico and Expectations for Japanese Technologies
Financial Results 4 th Quarter, 2007
 February 29, 2008 Financial Results 4 th Quarter, 2007 1/32 Content 2007 Operating and Financial Highlights 4Q07 Main Highlights Upstream Downstream International Trade Financial Results Other Relevant
proved natural gas reserves, selected countries oil production, selected countries
 [66] 07 7.1 2010 proved oil reserves, selected countries 7.2 2010 proved natural gas reserves, selected countries 7.3 2010 oil production, selected countries 7.4 7.5 2010 natural 2009 gas production, atmospheric
2007 atmospheric distillation capacity, top petroleum companies top petroleum companies by natural gas production
 International comparisons 28 proved crude oil reserves, selected countries 28 proved natural gas reserves, selected countries 28 crude oil production, selected countries 28 natural gas production, selected
A summary of national and global energy indicators. FEDERAL RESERVE BANK of KANSAS CITY
 THE U.S. Energy DATABOOK A summary of national and global energy indicators JULY 1, 17 FEDERAL RESERVE BANK of KANSAS CITY SUMMARY OF CURRENT ENERGY CONDITIONS The number of total active drilling rigs
Petroleum Geopolitics at the beginning of the 21 st century
 Petroleum Geopolitics at the beginning of the 21 st century JP. Favennec Director - Center for Economics and management Institut français du pétrole 26 th Annual Conference International Association for
UK Continental Shelf (UKCS) Oil and Gas Production and the UK Economy. Mike Earp
 Oil and Gas Production and the UK Economy. Mike Earp") UK Continental Shelf (UKCS) Oil and Gas Production and the UK Economy Mike Earp 15 June 215 Outline Production and Reserves Expenditure, Income and Taxation Gross Value Added Trade Recent Production History
UK Continental Shelf (UKCS) Oil and Gas Production and the UK Economy Mike Earp 15 June 215 Outline Production and Reserves Expenditure, Income and Taxation Gross Value Added Trade Recent Production History
New York Energy Forum
 Presentation at the New York Energy Forum 30 June 2014 Antoine Halff The oil market at a junction Balances loosen up on paper but must be seen in perspective The unconventional supply revolution enters
Evolving Global Oil Trade Flows. IEA-IEF-OPEC Joint Meeting Vienna, March 2018
 Evolving Global Oil Trade Flows IEA-IEF-OPEC Joint Meeting Vienna, March 2018 SHIFTING FLOWS: WHAT HAS THIS MEANT IN PRACTICE? US/Europe crude imports & exports Saudi crude to Poland Chinese teapots importing
Global Oil Exports: Smooth Sailing Or Midnight on the Titanic?
 Global Oil Exports: Smooth Sailing Or Midnight on the Titanic? Jeffrey J. Brown; Samuel Foucher, PhD; Tiger Craft*, Fortress Investment Group April 26, 2012 * All views are those of the authors, and Fortress
Market Report Series: Oil 2018 Analysis & Forecasts to Energy Community 10 th Oil Forum, Belgrade, 25 September 2018
 Market Report Series: Oil 218 Analysis & Forecasts to 223 Energy Community 1 th Oil Forum, Belgrade, 25 September 218 Short term update: crude prices (excl. WTI) up strongly Aug/Sep $/bbl 8 Benchmark Crude
IEA Analysis of Fossil-Fuel Subsidies for APEC
 211/SOM3/DIA/3 Session 2 IEA Analysis of Fossil-Fuel Subsidies for APEC Submitted by: IEA Policy Dialogue on Fossil Fuel Subsidy Reform San Francisco, United States 23 September 211 IEA analysis of fossil
Natural gas. 26 Reserves 28 Production and consumption 33 Prices 34 Trade movements. 67 th edition
 Natural gas 26 Reserves 28 Production and consumption 33 Prices 34 Trade movements 67 th edition Natural gas Total proved reserves At end 1997 At end 2007 At end 2016 At end Trillion Trillion Trillion
California s Petroleum Infrastructure Overview and Import Projections
 California s Petroleum Infrastructure Overview and Import Projections Port of Los Angeles Harbor Commission Meeting San Pedro, CA February 1, 2007 Gordon Schremp Fuels and Transportation Division California
The Supply of Oil. Projections to Oil and the Macroeconomy in a Changing World Federal Reserve Bank of Boston June 9, 2010 Boston, MA
 The Supply of Oil Projections to 2035 Oil and the Macroeconomy in a Changing World Federal Reserve Bank of Boston June 9, 2010 Boston, MA Howard Gruenspecht, Deputy Administrator Near-term oil price uncertainty
World Air Conditioner Demand by Region
 World Air Conditioner Demand by Region April 2015 The Japan Refrigeration and Air Conditioning Industry Association 1 World Air Conditioner Demand by Region April 2015 The Japan Refrigeration and Air Conditioning
OUTLINING STORAGE REGIONALLY IN AFRICA How much is sufficient and well-linked storage key to security of supply and competitive pricing?
 Platts African Refining Summit 2014 OUTLINING STORAGE REGIONALLY IN AFRICA How much is sufficient and well-linked storage key to security of supply and competitive pricing? - by Gabriel Ogbechie, Managing
Strategic Factors Impacting The California Crude Oil Market. About Purvin & Gertz, Inc. California Independent Petroleum Association
 Strategic Factors Impacting The California Crude Oil Market Hyatt Regency Huntington Beach Mike Sarna Eric Wei Long Beach Office 1 About Purvin & Gertz, Inc. Privately-Owned, Independent International
COMPETITION FOR FOREIGN INVESTMENT IN E&P IN LATIN AMERICA
 COMPETITION FOR FOREIGN INVESTMENT IN E&P IN LATIN AMERICA Prof. Edmar de Almeida Energy Economics Group Institute of Economics Federal University of Rio de Janeiro Workshop The Changing Global Energy
Global Olefins Review
 Presented to: Asia Petrochemical Industry Conference Raw Materials Committee Meeting May 2, 24 Kuala Lumpur, Malaysia Mark Eramo Vice President Olefins & Elastomers meramo@cmaiglobal.com Agenda! Ethylene
WORLD OIL SUPPLY AND DEMAND (million barrels per day)
") INTERNATIONAL ENERGY AGENCY OIL MARKET REPORT TABLES TABLES Table 1 WORLD OIL SUPPLY AND DEMAND (million barrels per day) 2005 2006 1Q07 2Q07 3Q07 4Q07 2007 1Q08 2Q08 3Q08 4Q08 2008 1Q09 2Q09 3Q09 4Q09
INTERNATIONAL ENERGY AGENCY OIL MARKET REPORT TABLES TABLES Table 1 WORLD OIL SUPPLY AND DEMAND (million barrels per day) 2005 2006 1Q07 2Q07 3Q07 4Q07 2007 1Q08 2Q08 3Q08 4Q08 2008 1Q09 2Q09 3Q09 4Q09
Table 1: World Oil Supply And Demand
 INTERNATIONAL ENERGY AGENCY - OIL MARKET REPORT TABLES Table 1 WORLD OIL SUPPLY AND DEMAND Table 1: World Oil Supply And Demand (million barrels per day) TABLES 2012 2013 1Q14 2Q14 3Q14 4Q14 2014 1Q15
Statistical Data in Japan
 Statistical Data in Japan Trends in LP Gas Supply Patterns 20,000 18,832 18,198 18,140 17,905 18,079 17,454 7454 Domestic Production 25.9% 74.1% Import Ratio of Import and Domestic Production 20,000 1,000
Where Are Oil Prices Headed? Graham Loveland Senior Consultant, Oil
 Resource Scramble or Market Rebalance: Where Are Oil Prices Headed? Graham Loveland Senior Consultant, Oil Presentation Outline & Approach Outline Key messages Demand Supply Costs & Prices Refining & Products
Pakistan Refining Industry An Overview
 Pakistan Refining Industry An Overview October 2016 Oil World Crude Oil Reserves Largely sustained level of reserves Largest Region Contributes 47% (2014: 47.2%) Global proven oil reserves in 2015 fell
For Region 5 and Region 7 Regional Response Teams Meeting April 22, 2015 St. Charles, Missouri via video/teleconference
 For Region 5 and Region 7 Regional Response Teams Meeting St. Charles, Missouri via video/teleconference By Grant Nülle, Upstream Oil & Gas Economist, Exploration and Production Analysis Team U.S. Energy
Emerging Trends in Petroleum Markets
 Emerging Trends in Petroleum Markets For Defense Logistics Agency, Worldwide Energy Conference Washington, D.C. By T. Mason Hamilton, Petroleum Markets Analyst U.S. Energy Information Administration Independent
Total credit to the non-financial sector (core debt), % of GDP Table F1.1
, % of GDP Table F1.1") Total credit to the non-financial sector (core debt), % of GDP Table F1.1 2012 2013 2014 2015 2016 Q2 16 Q3 16 Q4 16 Q1 17 Q2 17 Argentina 62.6 66.4 64.6 75.5 75.3 81.7 80.1 75.3 71.6 72.7 Australia 208.0
Total credit to the non-financial sector (core debt), % of GDP Table F1.1 2012 2013 2014 2015 2016 Q2 16 Q3 16 Q4 16 Q1 17 Q2 17 Argentina 62.6 66.4 64.6 75.5 75.3 81.7 80.1 75.3 71.6 72.7 Australia 208.0
Table 1 TABLES INTERNATIONAL ENERGY AGENCY OIL MARKET REPORT 15 MAY
 INTERNATIONAL ENERGY AGENCY OIL MARKET REPORT TABLES Table 1 Table WORLD 1 - World OIL SUPPLY Oil Supply AND DEMAND and Demand (million barrels per day) 2010 2011 1Q12 2Q12 3Q12 4Q12 2012 1Q13 2Q13 3Q13
US Refining Industry: Forecasts, Capacity, Challenges
 US Refining Industry: Forecasts, Capacity, Challenges Crude Oil Quality Group Cindy Schild, API February 26, 2009 Overview Prices, Earnings & Forecasts Domestic Refinery Industry Capacity Environmental
KEROSENE JET FUEL. Morten Simonsen. Vestlandsforsking,
 KEROSENE JET FUEL Morten Simonsen Vestlandsforsking, 19 October 2009 1 Content Introduction... 3 Crude oil extraction methods... 3 Production of kerosene... 5 Consumption of kerosene in China... 11 Raffinerie\Öl-Produkte-CN...
Fuel Focus. National Overview. Recent Developments. In this Issue. Volume 11, Issue 13 June 24, 2016 ISSN
 National Overview Fuel Focus Canadian Retail Gasoline Prices Remained the Same over the Last Two Weeks For the two-week period ending June 21, 16, the Canadian average retail gasoline price was $1.1 per
F Statistics on total credit to the non-financial sector
 F Statistics on total credit to the non-financial sector www.bis.org/statistics/totcredit.htm The BIS statistics on credit to the non-financial sector capture borrowing activity of the government sector
SHALE-ADVANTAGED CHEMICAL INDUSTRY INVESTMENT
 9 April 2013 SHALE-ADVANTAGED CHEMICAL INDUSTRY INVESTMENT Martha Gilchrist Moore Sr. Director, Policy Analysis and Economics Shale Gas Shale gas is possibly the most important energy development in the
1H 2003 Financial Results (US GAAP)
") 1H 2003 Financial Results (US GAAP) October 2003 Crude Oil Production Growth bpd 1.52 1.50 1.48 1.46 1.44 1.42 1.40 Jan- 03 Daily crude production Feb- 03 Mar- 03 Apr- 03 May- 03 Jun- 03 Crude oil production*
1H 2003 Financial Results (US GAAP) October 2003 Crude Oil Production Growth bpd 1.52 1.50 1.48 1.46 1.44 1.42 1.40 Jan- 03 Daily crude production Feb- 03 Mar- 03 Apr- 03 May- 03 Jun- 03 Crude oil production*
Trends in U.S. crude oil and petroleum product exports
 Trends in U.S. crude oil and petroleum product exports For ENERCOM Oil & Gas Conference August 21, 218 Denver, Colorado By T. Mason Hamilton, Petroleum Markets Analyst, Office of Energy Markets and Financial
PETROBRAS ARGENTINA S.A.
 PETROBRAS ARGENTINA S.A. Second Quarter 2015 Results Buenos Aires, July 30, 2015 Petrobras Argentina S.A. (Buenos Aires: PESA NYSE: PZE) announces the results for the second quarter ended June 30, 2015.
Table 1 WORLD OIL SUPPLY AND DEMAND (million barrels per day)
") INTERNATIONAL ENERGY AGENCY - OIL MARKET REPORT TABLES TABLES Table 1 WORLD OIL SUPPLY AND DEMAND (million barrels per day) 2011 2012 1Q13 2Q13 3Q13 4Q13 2013 1Q14 2Q14 3Q14 4Q14 2014 1Q15 2Q15 3Q15 4Q15
INTERNATIONAL ENERGY AGENCY - OIL MARKET REPORT TABLES TABLES Table 1 WORLD OIL SUPPLY AND DEMAND (million barrels per day) 2011 2012 1Q13 2Q13 3Q13 4Q13 2013 1Q14 2Q14 3Q14 4Q14 2014 1Q15 2Q15 3Q15 4Q15
FEDERAL RESERVE statistical release
 FEDERAL RESERVE statistical release FOR IMMEDIATE RELEASE MARCH 16, 1992 E.U C1Z1, GEOGRAPHICAL r DISTRIBUTION n OF e ASSETS AND^LIABILITIES (IN MILLIONS OF DOLLARS) ASSETS COUNTRY OF CUSTOMER 12/31/90
Energy Security of APEC Economies in a Changing Downstream Oil Environment
 IEEJ Feb. 2018 4th APEC OGSN Forum on 7 March 2018 Session2-2 Energy Security of APEC Economies in a Changing Downstream Oil Environment Takashi MATSUMOTO and Ichiro KUTANI Manager, Global Energy Group
refining PEMEX S business unit dedicated to the REFINING of crude oil
 refining REFINERY PRODUCTION (thousands barrels per day) 2002 Gasolines 398 Fuel Oil 450 Diesel 267 Jet Fuel 57 DOMESTIC SALE (thousands barrels per day) 2002 Gasolines 566 Fuel Oil 406 Diesel 271 Jet
OIL SUPPLY / DEMAND REPORT OIL SUPPLY/DEMAND REPORT FY 2016
 OIL SUPPLY / DEMAND REPORT OIL SUPPLY/DEMAND REPORT FY 2016 SUPPLY Inventory December 2016 actual crudes and petroleum products inventory closed at 20,742 thousand barrels (MB) or 51-day supply equivalent;
Mr. Steve Jenkins Head Global PX and Derivatives PCI X&P Malaysia
 Mr. Steve Jenkins Head Global PX and Derivatives PCI X&P Malaysia Recognized as a leading global authority in the commercial analysis of the paraxylene and derivatives industry sector, Mr. Steve Jenkins,
The Case for Mexico to Improve Vehicle Fuel Efficiency
 The Case for Mexico to Improve Vehicle Fuel Efficiency Feng An Energy and Transportation Technologies LLC Katherine Blumberg International Council on Clean Transportation Workshop on Sustainable Transport
Global Biofuels Market & Policy Developments
 Global Biofuels Market & Policy Developments Liisa Kiuru Executive Director, International Fuel Quality Center lkiuru@ifqc.org Presented to Missao Tecnica Internacional de Logistica: Petroleo Presentation
Exxon Bets on Downstream U.S. Returns Beaumont refinery expansion complements Permian investment.
 ? Exxon Bets on Downstream U.S. Returns Beaumont refinery expansion complements Permian investment. Morningstar Commodities Research March. 12, 2018 Sandy Fielden Director, Oil and Products Research +1
Corn & Bean Producers-1
 Largest Corn Producing Countries - 2016 est. Largest Corn Importing Countries - 2016 est. (Marketing year - thousands of hectares, tons per hectare, and thousands of metric tons) (Marketing year - thousands
Cosmo Oil Co., Ltd. Presentation on Results for First Quarter of Fiscal 2012 August 2, 2012 Director: Satoshi Miyamoto
 Cosmo Oil Co., Ltd. Presentation on Results for First Quarter of Fiscal 2012 August 2, 2012 Director: Satoshi Miyamoto Copyright 2012 COSMO OIL CO.,LTD. All Rights Reserved. Key Points of Financial Results
AN ECONOMIC AND ENVIRONMENTAL ASSESSMENT OF EASTERN CANADIAN CRUDE OIL IMPORTS
 Study No. 167 CANADIAN ENERGY RESEARCH INSTITUTE AN ECONOMIC AND ENVIRONMENTAL ASSESSMENT OF EASTERN CANADIAN CRUDE OIL IMPORTS Canadian Energy Research Institute Relevant Independent Objective An Economic
Primary energy. 8 Consumption 9 Consumption by fuel. 67 th edition
 Primary energy 8 Consumption 9 Consumption by fuel 67 th edition Primary energy Consumption* Growth rate per annum Million tonnes oil equivalent 27 28 29 2 211 212 213 214 215 216 217 217 26-16 Share 217
The Outlook for Energy: A View to 2040
 The Outlook for Energy: A View to 24 Dr. David Khemakhem Riyadh, Kingdom of Saudi Arabia March 25, 213 This presentation includes forward-looking statements. Actual future conditions (including economic
Fuel Focus. Understanding Gasoline Markets in Canada and Economic Drivers Influencing Prices. Issue 20, Volume 8
 Fuel Focus Understanding Gasoline Markets in Canada and Economic Drivers Influencing Prices Issue 20, Volume 8 October 18, 2013 Copies of this publication may be obtained free of charge from: Natural Resources
The Changing Face of Global Refining
 The Changing Face of Global Refining OPIS National Supply Summit Las Vegas, Nevada October 24-26, 2010 John B. O Brien, Executive Chairman Baker & O Brien, Inc. All rights reserved. The Changing Face of
STATISTICAL ANNEX NOTE ON QUARTERLY PROJECTIONS
 OECD Economic Outlook, Volume 2017 Issue 1 OECD 2017 This annex contains data on key economic series which provide a background to the recent economic developments in the OECD area described in the main
BP Statistical Review of World Energy June 2017
 BP Statistical Review of World Energy June 217 Primary energy 8 Consumption 8 Consumption by fuel 9 66 th edition Primary energy Consumption* Growth rate per annum Million tonnes oil equivalent 26 27 28
Table 1 WORLD OIL SUPPLY AND DEMAND (million barrels per day)
") INTERNATIONAL ENERGY AGENCY - OIL MARKET REPORT TABLES Table 1 WORLD OIL SUPPLY AND DEMAND (million barrels per day) 2004 2005 1Q06 2Q06 3Q06 4Q06 2006 1Q07 2Q07 3Q07 4Q07 2007 1Q08 2Q08 3Q08 4Q08 2008
INTERNATIONAL ENERGY AGENCY - OIL MARKET REPORT TABLES Table 1 WORLD OIL SUPPLY AND DEMAND (million barrels per day) 2004 2005 1Q06 2Q06 3Q06 4Q06 2006 1Q07 2Q07 3Q07 4Q07 2007 1Q08 2Q08 3Q08 4Q08 2008
Chemical and Petrochemical Opportunities in Iran
 Chemical and Petrochemical Opportunities in Iran by Mohammad Reza Ghasemian Managing Director of Chemicalways LLC. Greece Oct 2015 In cooperation with Best Land to produce Petrochemicals in ME Natural
Sulphur Market Outlook
 Sulphur Market Outlook The Outlook for the future Supply and Balance of the Global Sulphur Market Joanne Peacock, CRU International/BSC Creon Moscow December 2009 LONDON RALEIGH WASHINGTON MINNEAPOLIS
Algae is a superior renewable feedstock
 Tim Zenk VP of Corporate Affairs, Sapphire Energy Inc. October 11, 2012 Cost of production ($ per barrel) Algae is a superior renewable feedstock Superior attributes of algae Scalable to millions of barrels
Sharp Decline in Vegetable Oil Stocks Leads to Steeply Higher Prices
 United States Department of Agriculture Foreign Agricultural Service Circular Series FOP 1-11 Sharp Decline in Vegetable Oil Leads to Steeply Higher Prices Commodity prices have been on an upward trend
Defining the Debate: Crude Oil Exports
 Defining the Debate: Crude Oil Exports Trisha Curtis, Director of Research Upstream and Midstream Energy Policy Research Foundation, Inc. (EPRINC) Brookings Task Force February 28th, 214 About EPRINC www.eprinc.org
Operating Refineries in a High Cost Environment. Options for RFS Compliance. March 20, Baker & O Brien, Inc. All rights reserved.
 Operating Refineries in a High Cost Environment Options for RFS Compliance March 2, 217 Baker & O Brien, Inc. All rights reserved. Discussion Points Introduction Renewable Fuels Standard (RFS) Overview
Oil. 12 Reserves 14 Production and consumption 20 Prices 22 Refining 24 Trade movements. 67 th edition
 Oil 12 Reserves 14 Production and consumption 20 Prices 22 Refining 24 Trade movements 67 th edition Oil Total proved reserves At end 1997 At end 2007 At end 2016 At end Thousand million barrels Thousand
The Sulphur Market Outlook
 The Sulphur Market Outlook Mike Kitto Principal Consultant Sulphur CRU China International Sulphur&Sulphuric Acid Conference(211) The sulphur market outlook Mike Kitto CRU, UK. Part 1: Recent market trends
An Overview on Pakistan Refining Industry
 An Overview on Pakistan Refining Industry May 2018 Oil 000' mln tonnes World Crude Oil Reserves 120,000 240,000 Largely sustained level of reserves 90,000 225,000 Middle east Contributes ~48% 60,000 210,000
INTERTANKO Istanbul Tanker Event. Demand Developments. David Martin Oil Industry & Markets Division OECD/IEA
 INTERTANKO Istanbul Tanker Event Demand Developments David Martin Industry & s Division david.martin@iea.org - Istanbul, April 20-23, 2008 Medium-Term Outlook What is driving oil prices? Fundamentals or
FISCAL YEAR MARCH 2018 FIRST QUARTER FINANCIAL RESULTS
 FISCAL YEAR MARCH 2018 FIRST QUARTER FINANCIAL RESULTS PRESENTATION OUTLINE Highlights Fiscal Year March 2018 First Quarter Results Fiscal Year March 2018 Full Year Forecast Structural Reform Stage 2 Progress
GLOBAL SUSTAINABILITY REPORT 2016
 GLOBAL SUSTAINABILITY REPORT 2016 KEY METRICS FINANCIAL SALES WORLDWIDE Dollars in Millions 2013 2014 2015 2016 DIVIDENDS PAID Dollars in Billions 2013 2014 2015 2016 TOTAL 19,657 20,247 20,405 20,853
Fuel Focus. Understanding Gasoline Markets in Canada and Economic Drivers Influencing Prices. Volume 10, Issue 4
 Fuel Focus Understanding Gasoline Markets in Canada and Economic Drivers Influencing Prices Volume 1, Issue 4 March, Copies of this publication may be obtained free of charge from: Natural Resources Canada
Nove b m er 21, Yun K Kan g Jessie i Y Yoh
 Energy for tomorrow November 21, 2008 Yun Kang Jessie Yoh Industry Overview Company Overview Thesis Analysis Risks Q & A AGENDA WHY CONOCO? Leader in refining process provides natural hedge against falling
Downstream & Chemicals
 Downstream & Chemicals Mark Nelson Executive Vice President Downstream & chemicals portfolio Fuels refining & marketing Focused, regional optimization Petrochemicals Advantaged feed, scale and technology
Canada s Refining Industry Sector Performance Report
 Canada s Refining Industry 217 Sector Performance Report The Canadian Fuels Association represents the industry that produces, distributes and markets petroleum products in Canada including 95 percent
Resilience and society: energy infrastructure, 26th April, Northumbria University.
 Electricity sector resilience Sara Walker What s the big deal? 1. GROWTH in world energy consumption 2. Climate Change Global: UNFCCC, Kyoto Protocol and the most recent COP17 Europe: 20 20 20 UK: Climate
67 th edition. Renewable energy. Appendices. 44 Other renewables consumption 45 Biofuels production
 Renewable energy 44 Other renewables consumption 45 Biofuels production Appendices A1 Solar Generation A2 Wind Generation A3 Geothermal, biomass and other Generation A4 Geothermal Cumulative installed
FISCAL YEAR ENDING MARCH 2012 FIRST HALF FINANCIAL RESULTS
 FISCAL YEAR ENDING MARCH 2012 FIRST HALF FINANCIAL RESULTS Mazda Motor Corporation November 2, 2011 New Mazda CX-5 (European specifications) 1 PRESENTATION OUTLINE Highlights Fiscal Year Ending March 2012
The Global Downstream Market
 The Global Downstream Market ANIMP Add. 2 1 The global picture The market is a challenging one for many refiners, but the picture is varied, region by region Significant capacity expansion is expected
SUPPLY CHAIN PERSPECTIVE
 SUPPLY CHAIN PERSPECTIVE FUEL Overview Australia s economy is built on key industries that rely heavily on fuel consumption. This report deals with fuel as it is processed from crude oil to refined petroleum
Empresa Nacional del Petróleo. 2Q 2012 Financial Results
 Empresa Nacional del Petróleo 2Q 2012 Financial Results Disclaimer Forward-looking statements are based on the beliefs and assumptions of ENAP s management and on information currently available to the
Energy Security Fact Pack
 Energy Security Fact Pack 217 @Securing_Energy #SAFEenergyfacts ENERGY SECURITY FACT PACK Contents 1. 2. 3. 4. 5. 6. QUARTER SUMMARY CHARTS OF THE QUARTER U.S. OIL SUPPLY, DEMAND, AND TRADE GLOBAL OIL
PETROBRAS ARGENTINA S.A.
 PETROBRAS ARGENTINA S.A. Fiscal Year 2014 Results Buenos Aires, February 4, 2015 Petrobras Argentina S.A. (Buenos Aires: PESA NYSE: PZE) announces the results for fiscal year ended December 31, 2014. Petrobras
ASPHALT SUPPLY IN A VOLATILE OIL WORLD
 ASPHALT SUPPLY IN A VOLATILE OIL WORLD Bill Haverland ConocoPhillips Baxter Burns Ergon CRUDE OIL SUPPLY A WORLD LOOK Crude Oil Supply (2006) World Crude Oil Production Millions of Barrels Per Day FSU/E.
Implications of the U.S. Shale Revolution
 Implications of the U.S. Shale Revolution For October 17, 214 Chicago, Illinois By Adam Sieminski, Administrator U.S. Energy Information Administration U.S. Energy Information Administration Independent
Investors Day Brazil Sven Antonsson
 Investors Day Brazil Sven Antonsson President Latin American Operations Deliveries Key figures 28, 321 vehicles Net sales SEK 37,105 m. Op. income SEK 5,632 m. Operating margin 15.2 % Scania in Brief First
Petroleum and Natural Gas Situation
 Petroleum and Natural Gas Situation John C. Felmy Chief Economist and Director Statistics Department American Petroleum Institute Felmyj@api.org www.api.org www.gasolineandyou.org www.naturalgasfacts.org
Petroleum Planning & Analysis Cell
 MONTHLY REPORT ON INDIGENOUS CRUDE OIL PRODUCTION, IMPORT AND PROCESSING & PRODUCTION, IMPORT AND EXPORT OF PETROLEUM PRODUCTS November 2017 Petroleum Planning & Analysis Cell (Ministry of Petroleum &
Analyst Presentation 1Q 2008 Results
 Analyst Presentation 1Q 2008 Results 0 Contents Section 1: Section 2: Section 3: Section 4: Section 5: Company Overview IPO Update Operating Performance Consolidated Financial Performance Dividend Update
Stronger than the others
 Stronger than the others Natural gasoline demand, markets, and pricing Maria Mejia, NGL Analyst September 29, 2014 2014 Platts, McGraw Hill Financial. All rights reserved. Bentek Energy is a leader in
World Geographic Shares
 World Geographic Shares North America South America Europe Africa Asia Australia/ Oceania 18% 13% 7% 22% 33% 6% World Population Shares North America South America Europe Africa Asia Australia/ Oceania
OUR WORLD OF POWER IS CHANGING
 23 March 2017 VALVE MANUFACTURERS ASSOCIATION OF AMERICA OUR WORLD OF POWER IS CHANGING LYLE WHITE VICE PRESIDENT LW15 29 June 2015 THERE ARE TRENDS CHANGING OUR WORLD OF ENERGY AND THE WAY WE USE TO DO
Downstream & Chemicals
 Downstream & Chemicals Pierre Breber Executive Vice President 017 Chevron Corporation Downstream portfolio Fuels refining & marketing Integrated value chains Lubricants & additives Globally positioned
Oil and gas prices down off 2008 highs
 Oil and gas prices down off 28 highs $ US$ per per barrel barrel US$ $ per thousand cubic feet 16 9 14 8 12 7 Natural gas (wellhead) 6 1 (Right) 5 8 4 6 3 4 2 Crude oil 2 (Left) 1 198 1985 199 1995 2 25
I. World trade in Overview
 I. World trade in - Overview Table I.1 Growth in the volume of world merchandise exports and production, 2-5 (Annual percentage change) 2-5 23 24 World merchandise exports 4.5 5. 9.5 6. Agricultural products
AOC Holdings, Inc. (TSE:5017)
") AOC Holdings, Inc. (TSE:5017) (TSE:5017) Report on on Performance in infy2008 (April 1, 1, 2008 2008 March 31, 31, 2009) May May 18, 18, 2009 2009 AOC AOC Holdings, Inc. Inc. www.aochd.co.jp 1 Chapter
AOC Holdings, Inc. (TSE:5017) (TSE:5017) Report on on Performance in infy2008 (April 1, 1, 2008 2008 March 31, 31, 2009) May May 18, 18, 2009 2009 AOC AOC Holdings, Inc. Inc. www.aochd.co.jp 1 Chapter
GAZPROM NEFT TODAY FEBRUARY 2017
 GAZPROM NEFT TODAY FEBRUARY 2017 ABOUT GAZPROM NEFT KEY PERFORMANCE INDICATORS 2016 TITLE 1,514 mtoe proven hydrocarbon reserves (SPE(PRMS)) 86.2 mtoe of hydrocarbon production 41.89 mt refining volumes
Statistical Appendix
 Statistical Appendix Middle East and Central Asia Department REO Update, May 2013 The IMF s Middle East and Central Asia Department (MCD) countries and territories comprise Afghanistan, Algeria, Armenia,
KEY METRICS FINANCIAL
 ABBOTT GLOBAL CITIZENSHIP REPORT METRICS 2015 KEY METRICS FINANCIAL SALES WORLDWIDE DIVIDENDS PAID 2012 2013 2014 2015 2012 2013 2014 2015 Dollars in Millions Dollars in Billions TOTAL 19,050* 19,657*