ETHANOL INDUSTRY IN MINNESOTA ECONOMIC IMPACT OF THE. Agricultural Marketing Services Division Minnesota Department of Agriculture
|
|
|
- Justina Simon
- 6 years ago
- Views:
Transcription

1 ECONOMIC IMPACT OF THE ETHANOL INDUSTRY IN MINNESOTA Agricultural Marketing Services Division Minnesota Department of Agriculture May
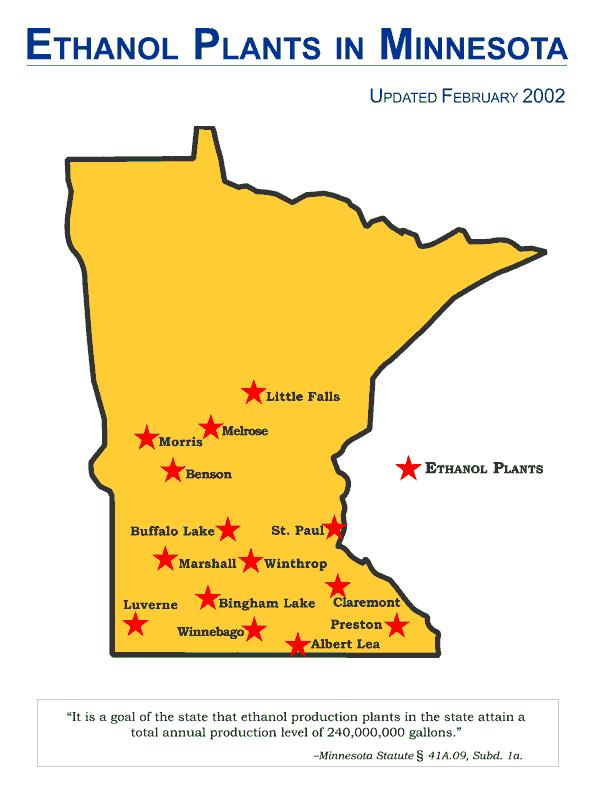
2 INDEX Page 3 Page 4 Page 5-8 Page 5 Page 7 Page 7 Page 8 Page 9-13 Page 10 Page 10 Page 12 Page 12 Page 13 Page 13 Page Page 14 Page 14 Page 15 Page 15 Page 16 Page 16 Page Page 17 Page 17 Page 18 Page 18 Page 19 Page 19 Page 20 Page 20 Minnesota Ethanol Statistics Ethanol Plants in Minnesota (Map) Minnesota Ethanol The Minnesota Ethanol Program Minnesota Ethanol Production Trend (Chart) Minnesota Ethanol Production and Consumption (Chart) Legislative Summary of the Minnesota Ethanol Program Economic Impact Analysis Minnesota Ethanol Industry Output Impact (Chart) Minnesota Ethanol Industry Employment Impact (Chart) Minnesota Ethanol Industry Output Impact by Sector (Chart) Minnesota Ethanol Industry Employment Impact by Sector (Chart) Minnesota Ethanol: Production, Producer Payments, and Economic Impacts (Chart) Minnesota Ethanol: Total Economic Impact & Employment Impact (Chart) Price Trends: Fuel Ethanol, Gasoline, MTBE, and Corn Minnesota Fuel Ethanol Price Trend (Chart) Minnesota Ethanol Prices, Annual Average (Chart) Ethanol Prices in Selected Cities (Chart) Minnesota Ethanol & Gasoline Prices (Chart) Ethanol & MTBE Prices (Chart) Minnesota Corn & Ethanol Prices (Chart) U.S. Ethanol U.S. Ethanol Plants (Map) U.S. Ethanol Production (Chart) U.S. Ethanol Production by Top States (Chart) U.S. Ethanol Production by Mill Type (Chart) U.S. Corn Utilized for Ethanol Production (Chart) U.S. Ethanol Production Capacity (Chart) U.S. Crude Oil Imports (Chart) U.S. Petroleum Prices (Chart) 1
3 INDEX (continued) Page 21 Page Page 22 Page 22 Page 23 Page 23 Page 24 Page 24 Page 25 Page 26 Page 26 Page Page 31 Page 31 Page 31 Page 32 Page 32 Page 32 Page Page 33 Page 33 Page 34 Page 34 Page 35 Page 35 Page 36 Page 36 Page 36 U.S. Oil Production and Imports (Chart) Corn Production, Utilization, and Prices, MN & U.S. Minnesota Corn Utilization (Chart) Minnesota Corn Production (Chart) U.S. Top Corn States (Chart) U.S. and MN Corn Prices (Chart) U.S. Top Corn States: Production Rank (Table) U.S. Top Corn States: Processing Rank (Table) U.S. Top Corn States: Price Rank (Table) Corn Production: Top 5 States (Chart) Corn Prices: Top 5 States (Chart) Value of Corn: Raw Commodity vs. Value-Added (Tables) Corn: Export, Feed Use, and Processing - Minnesota and U.S. Minnesota Corn Utilization (Chart) U.S. Corn Utilization (Chart) Industrial Uses of Corn Industrial Use of Corn in the U.S. (Chart) HFCS Production in the U.S. (Chart) Distillers Dried Grains (DDG) and Corn Gluten Feed & Meal Minnesota DDG Production (Chart) DDG Prices (Chart) U.S. DDG Production (Chart) U.S. DDG Exports (Chart) U.S. Corn Gluten Feed & Meal Production & Exports (Chart) Protein Feed Prices (Chart) Other Corn Products Prices Corn Oil Prices (Chart) Corn Starch Prices (Chart) 2
4 MINNESOTA ETHANOL STATISTICS Ethanol Production 300 million gallons 11 million gallons Ethanol Consumption 240 million gallons 20 million gallons Net Ethanol export/import 60 million gallons exported 9 million gallons imported Ethanol Plants 14 plants 5 plants Ethanol Producer Payment $34 million $2 million Economic Impact Output impact $588 million $29 million Employment impact 2,564 jobs 166 jobs Corn Production 1,052 million bushels 763 million bushels Rank in Corn Production No. 3 No. 4 Total Corn processing 138 million bushels 34 million bushels Corn Processed for Ethanol 120 million bushels 4.4 million bushels Corn Prices $2.15/bushel $2.17/bushel Ethanol Prices $1.14/gallon $1.33/gallon 3
5 4


6 A. Background: The Minnesota Ethanol Program The 20-cent ethanol producer payment legislation (1986) initially provided the security required by lenders to invest in small farmer-owned ethanol facilities. In addition to opposition from the petroleum industry, bankers were concerned that these plants could not compete in the market with large agribusiness processors. At the time, most ethanol production occurred in large mills outside the state. Minnesota corn prices were among the lowest in the country, which was an advantage for local processing. Although these ventures have been successful to date, margins have been squeezed by periods of record high corn prices and low ethanol prices. It is hoped that ten years of payments will allow plants to retire debt, increase efficiency and develop new products and markets so they can survive the competition and price fluctuations in agricultural and petroleum markets. Unique aspects of the ethanol industry made these incentive payments necessary, but the ethanol industry is projected to contribute over $350 million in increased economic activities in the state. Since low commodity prices are common, these new corn plants may represent a new strategy for the long-range profitability of farmers and farm communities. Vertical integration from the bottom up could allow farmers to participate in the more profitable end of agriculture. Promoting farmer investments in the processing and marketing of other crop or livestock enterprises may not require the high level of state funding as did ethanol. It is hoped that such initiatives can allow farmers to make it on their own and reduce the need for funding of farm financial crisis measures. B. The main components of the Minnesota Ethanol Program are: 1. An oxygenated fuel statute that requires state-wide oxy-fuel (ethanol blend) use; 2. The 20 cent per-gallon ethanol producer incentive provides payment for ethanol produced; Plus $550 million was spent for total corn/ethanol plant construction and startup costs; $370 million in private sector financing was contingent on local equity capital; $180 million in local equity capital was raised by over 8,000 farmer and business members; $200 million worth of corn is committed for processing annually by local farmers. C. The goals of the program include: 1. To build a new market for the state's largest crop (corn); 2. To develop corn processing/ethanol production facilities in Minnesota; 3. To increase the number of New Generation Farmer Coops (NGCs). These businesses were designed to provide farmer-members greater direct cash return for their crops; 4. To replace 10 percent of imported petroleum we use for gasoline (estimated at $100 million annual savings); and 5. To help the Twin Cities Area meet U.S. EPA standards for carbon monoxide. D. Results to date: million bushels of corn (12 percent of Minnesota s crop) is made into ethanol and livestock feed (2002); 2. Minnesota's 14 plants produced 300 million gallons of ethanol in 2002; 3. Twelve of Minnesota's 14 ethanol plants were organized as NGCs**; 4. Nearly 10% of our gasoline is being replaced by ethanol each year; and 5. The Twin Cities Area met EPA's carbon monoxide standard and has achieved "attainment" status (the continued use of ethanol is required to keep emissions low). 5
7 The Minnesota Ethanol Program Ethanol Production vs. Ethanol Use Year Production mm=million Estimated Consumption % MN Ethanol Produced Here mm gal. 25 mm gal. 4% of total mm gal. 125 mm gal. 33% of total mm gal mm gal. 100% of total Ethanol Plants & Capacities in 2002 City & (plant name) Capacity gallons/year mm. bushel corn/year Start-up year New Generation Co-op** Members Marshall (ADM) 40 million (Public Corp) Morris (DENCO) 20 million Winnebago (Corn Plus) 40 million Winthrop (Heartland) 32 million Benson* (CVEC) 20 million Claremont (Al-Corn) 30 million Bingham Lake (Ethanol2000) 30 million Buffalo Lake (MN Energy) 18 million Melrose (Dairy Proteins) 3 million Cheese whey 1986 (Regional Co-op) Preston (Pro-Corn) 40 million Luverne (Corn-er Stone) 20 million Little Falls (CMEC) 20 million Albert Lea (Exol/Agri Resources) 40 million St. Paul (Gopher State Ethanol) 13 million (Public Corp) Current TOTAL 366 mm gal. 133 mm bu. 5,229 Processing corn products instead of exporting corn as raw commodity adds value to each bushel of corn. In addition to fuel ethanol, corn plants also produce high-protein livestock feeds plus other products such as corn sweeteners, starch, and carbon dioxide. * Benson plant will add 20 million gallons by ** Plants organized as New Generation Farmer Co-ops (NGC) may be combined with, converted to or organized as limited liability companies or partnerships that are generally designed to: 1) be built by farmers and local businessmen to process member crops; 2) return more cash to farmers than conventional markets would provide; 3) be controlled by farmer/local board members so that member profits remain a top priority; and 4) create a stable source of local jobs and economic development. 6
8 Minnesota Ethanol Production Trend Fiscal Year: July 1-June Million ga * 2004* 2005* * : Projected. Minnesota Ethanol Production and Consumption Million gallons Production Consumption
9 LEGISLATIVE SUMMARY OF THE MINNESOTA ETHANOL PROGRAM Minnesota passed legislation in 1980 offering a 4 cent per gallon pump tax credit for 10 percent ethanol/gasoline blends. The credit was available to marketers responsible for paying the gasoline tax to the state. By 1986, 40 percent of the state s gasoline was blended with 10 percent ethanol, but little ethanol was produced in Minnesota. Legislation reduced the pump tax credit to 2 cents and initiated a 20 cent per gallon cash incentive payment for ethanol produced in the state. In 1987, legislation provided $100,000 annually to conduct an ethanol promotion program in the Minnesota Department of Agriculture. The Minnesota Ethanol Commission was established to promote the production and use of ethanol in Minnesota. Activities included: 1) production of educational documents and events; 2) troubleshooting consumer and industry concerns about ethanol fuels; 3) helping develop farmer-owned ethanol production facilities; and 4) providing information to policymakers, the public and the media. In 1989, the mandatory pump labeling requirement for ethanol blends was discontinued in favor of voluntary labeling that was more consistent with other gasoline components. In 1992, a minimum 2.7 percent oxygen content requirement for gasoline was made effective year-round in the Twin Cities in 95 and then statewide in A federal program previously required 2.7 percent oxygen in the Twin Cities during the winter months. In 1993, funding was provided for $500,000 loans to assist ethanol plant developers. In ) a phase out of the pump tax credit was made to coincide with phasing in the statewide oxygen requirement; 2) a stock loan program would participate with banks loaning money to qualified farmers who wished to buy stock in ethanol plants. In 1995, a statutory goal to develop 220 million gallons of Minnesota ethanol production was established. In 1998, the production goal was increased to 240 million gallons of ethanol, and approval for the 15 th ethanol plant was authorized. In 2000, the content of non-ethanol oxygenates such as MTBE in gasoline was restricted to 1/3 percent. In 2003, 14 plants remain with a total annual production capacity of over 360 million gallons. Current state statute requires that the payments be reduced from 20 cents to 19 cents per gallon effective July 1, Of the $70 million allotted for biennial ethanol producer payments, $20 million was un-allotted by the governor. Three separate bills considered during the 2003 session include reducing the ethanol producer payment from 20 cents per gallon to 15, 13 and 10 cents per gallon respectively. The outcome of the session was not known at the time this summary was written. 8
10 ECONOMIC IMPACT OF THE ETHANOL INDUSTRY IN MINNESOTA This economic impact analysis was conducted with the IMPLAN program (an inputoutput economic modeling system) to examine the ethanol industry in Minnesota. It estimates the ethanol industry s total economic contribution, or multiplier effect, to the state economy, especially the output and employment impacts. The economic impacts are measured to include the direct, indirect, and induced impacts. Direct impact represents the effect of the ethanol industry s production output. Indirect impact represents the effect on all other economic sectors due to purchases by the ethanol industry to generate the afore-mentioned output. Induced impact represents the effect on all economic sectors due to the expenditures of new income generated by the direct and indirect impacts. Total impact is the sum of direct, indirect and induced impacts. IMPACT ANALYSIS Impact Ethanol production Corn use Ethanol sales Corn feed sales (DDG & gluten feed/meal) Ethanol industry s total value of output Ethanol producer payment 300 million gallons 120 million bushels $308 million $80 million $388 million $34 million Total Economic Impacts ( Multiplier impact in all economic sectors) Total economic impact - Output impact $587 million - Employment impact 2,562 jobs 9
11 Minnesota Ethanol Industry Output Impact Direct, indirect, induced, and total impacts Million $ Direct Indirect Induced Total Minnesota Ethanol Industry Employment Impact Direct, indirect, induced, and total impacts 2,562 2,500 2,000 # of Jobs 1,500 1,000 1, Direct Indirect Induced Total 10
12 IMPACT ANALYSIS (continued) Economic Impact by Sector Sector OUTPUT IMPACT BY SECTOR Impacts 1. Manufacturing $404 million 2. Wholesale & retail trade $44 million 3. Service $41 million 4. Transportation, communication, and and public utilities $31 million 5. Agriculture $28 million 6. Finance, insurance, and real estate $27 million 7. Construction $7 million 8. All other $5 million Total $587 million Sector EMPLOYMENT IMPACT BY SECTOR Impacts 1. Service 674 jobs 2. Wholesale & retail trade 550 jobs 3. Agriculture 484 jobs 4. Manufacturing 419 jobs 5. Transportation, communication, and public utilities 163 jobs 6. Finance, insurance, and real estate 136 jobs 7. Construction 94 jobs 8. All other 42 jobs Total 2,562 jobs 11


13 Minnesota Ethanol Industry Output Impact by Sector Total output impact: $587 million Million $ Manufacturing Trade Services TCPU* Agriculture FIRE** Construction All other Minnesota Ethanol Industry Employment Impact by Sector Total employment impact: 2,562 jobs # of Jobs Services Trade Agriculture Manufacturing TCPU* FIRE** Construction All other *TCPU: Transportation, communication, and public utilities. **FIRE: Finance, insurance, and real estate. 12
14 Minnesota Ethanol: Production, Producer Payments, and Economic Impacts (Fiscal Year: July 1-June 30) Ethanol Production (Million Gallons) Total Economic Impacts (Million $) Producer Payments (Million $) $511 $629 $587 Million $352 $276 $ $ $89 $91 $101 $ $ $29 -$217 -$3 -$5 -$4 -$5 -$6 -$11 -$14 -$22 -$28 -$35 -$35 -$ Million $ $900 $800 $700 $600 $500 $400 $300 $200 $100 $0 Minnesota Ethanol: Total Economic Impact & Employment Impact $29 $42 $89 $91 $101$ Total Economic Impacts (Million $) Employment Impact (# of Jobs) $ $276 $254 $352 1,476 * : Projected. **In 1998 and 2002, ethanol prices declined. 1,759 $ ** $629 $587 2,745 2,562 $721 $755 $ ** 2003* 2004* 2005* 9,000 8,000 7,000 6,000 4,367 5,000 4,000 3,000 2,000 1,000 0 # of jobs 13
15 Minnesota Fuel Ethanol Price* Trend Mpls/St. Paul: Average = $1.27 $/ga. $1.90 $1.80 $1.70 $1.60 $1.50 $1.40 $1.30 $1.20 $1.10 $1.00 $0.90 $0.80 $0.70 $0.60 $0.50 Dec-87 Dec-88 Dec-89 Dec-90 Dec-91 Dec-92 Dec-93 Dec-94 Dec-95 Dec-96 Dec-97 Dec-98 Dec-99 Dec-00 Dec-01 Dec-02 Minnesota Ethanol Prices*, Annual Average Mpls/St. Paul $/ga. $1.60 $1.50 $1.40 $1.30 $1.20 $1.10 $1.00 $0.90 $0.80 $0.70 $0.60 $0.50 $0.40 $0.30 $0.20 $0.10 $ *Rack prices: Wholesale bulk prices at the terminal. Source: Axxis Petroleum. 14
16 $/ga Ethanol Prices* in Selected Cities Weekly Prices Denver Fargo Duluth Omaha Milwaukee Sioux Falls Mpls/St. Paul Mar-94 Mar-95 Mar-96 Mar-97 Mar-98 Mar-99 Mar-00 Mar-01 Mar-02 $2.00 $1.80 Minnesota Ethanol* & Gasoline Prices Mpls/St. Paul Weekly Prices Ethanol UNL $1.60 $1.40 $1.20 $/ga. $1.00 $0.80 $0.60 $0.40 $0.20 $0.00 Jan-94 Jun-94 Dec-94 May-95 Nov-95 Apr-96 Oct-96 Mar-97 Feb-98 Aug-98 *Rack prices: Wholesale bulk prices at the terminal. Source: Axxis Petroleum. 15 Feb-99 Jul-99 Jan-00 Jun-00 Dec-00 May-01 Nov-01 Apr-02 Oct-02
17 Ethanol* and MTBE Prices Ethanol, Mpls/St. Paul $/ga MTBE, U.S. Gulf Coast 0.25 Jan-89 Jan-90 Jan-91 Jan-92 Feb-93 Feb-94 Feb-95 Feb-96 Jan-97 Jan-98 Jan-99 Jan-00 Jan-01 MTBE: Methyl Tertiary Butyl Ether a petroleum oxygenate for gasoline. Minnesota Corn & Ethanol* Prices Monthly Prices $4.00 $ Corn Ethanol $3.00 $2.50 Dollars $2.00 $ $1.00 $0.50 $0.00 Jan-90 Jan-91 Jan-92 Jan-93 Jan-94 Jan-95 Jan-96 Jan-97 Jan-98 Jan-99 Jan-00 Jan-01 *Rack prices: Wholesale bulk prices at the terminal. Source: Minnesota Agricultural Statistics, Axxis Petroleum, and Oxy Fuels. 16

18 U.S. Ethanol Plants (2001) Source: National Corn Growers Association. U.S. Ethanol Production Billion ga Source: Renewable Fuels Association. 17
19 U.S. Ethanol Production by Top States (2002) Million ga IL IA NE MN SD IN MO KS WI TN Source: Renewable Fuels Association. 1,200 U.S. Ethanol Production by Mill Type 1,000 Est. Dry Mills Est. Wet Mills 800 Million bu Source: ProExporter Network (PRX). 18


20 U.S. Corn Utilized for Ethanol Production U.S. Ethanol Production Capacity 19
21 U.S. Crude Oil Imports ( ) Weekly Imports 11,000 10,000 9,000 Mbbl/d 8,000 7,000 6,000 5,000 4,000 1/5/90 1/5/91 1/5/92 1/5/93 1/5/94 1/5/95 1/5/96 1/5/97 1/5/98 1/5/99 1/5/00 1/5/01 1/5/02 Source: U.S. Department of Energy. U.S. Crude Oil Prices ( ) $/bbl Jan-74 Jan-76 Jan-78 Jan-80 Jan-82 Jan-84 Jan-86 Jan-88 Jan-90 Jan-92 Jan-94 Jan-96 Jan-98 Jan-00 Jan-02 Source: U.S. Department of Energy. 20

22 U.S. Oil Production vs. Imports 21
23 Minnesota Corn Production 1,100 1,033 1,052 1, Trendline Million bu Source: USDA. Minnesota Corn Utilization Production Export Feed Use Processing Residual Use 1,100 1, Million bu Source: PRX. 22
24 2,000 1,964 U.S. Top Corn States (2002) 1,750 1,500 1,496 Million bu. 1,250 1, , IA IL MN NE IN WI SD KS MO OH MI TX Source: USDA. $/bu Corn Prices: MN & U.S. Average Annual Average Prices MN U.S. US MN Source: USDA. 23
25 U.S. Top Corn States: Comparing Corn Production, Processing, and Prices Production (Million Bushels) Crop Year Rank ( Crop Year) IA IL MN NE IN U.S. Total ,562 1, , ,427 1, , ,904 1, , , , , ,915 1, , , ,427 1, , ,711 1, , , ,642 1, , , ,769 1,473 1,033 1, , ,758 1, , , ,728 1, , , ,664 1, , , ,964 1,496 1, ,008 Processing (Million Bushels) Crop Year Rank ( Crop Year) IA IL NE IN MN U.S. Total , , , , , , , , , , , , ,175 Source: PRX. 24
26 U.S. Top Corn States: Comparing Corn Production, Processing, and Prices (continued) Prices (Dollar per Bushel) Year Rank (2002) IL IN NE IA MN U.S. Average U.S. High U.S. Low Average Price difference between IL & MN 0.20 Price difference between US & MN 0.14 Source: USDA, NASS. 25
27 Corn Production: Top 5 States IA (1) IL (2) MN (3) NE (4) IN (5) 2,000 1,800 IA 1,600 IL 1,400 Million bu. 1,200 1, MN NE IN Source: USDA. Corn Prices: Top 5 States Annual Average Prices IL (1) IN (2) NE (3) IA (4) MN (5) $/bu Source: USDA. 26
28 Value of Corn Raw Commodity vs. Value-Added (per bushel of corn) 1. July 2002 Prices Corn Value-Added Wet-Milling Dry-Milling Raw Starch & Ethanol & Sweeteners & Products Ethanol & Products Commodity Products Products Corn Syrup HFCS DDG Corn $2.17 Corn Oil $0.29 $0.29 $0.29 $0.29 Gluten Feed $0.28 $0.28 $0.28 $0.28 Gluten Meal $0.41 $0.41 $0.41 $0.41 Starch $4.03 Ethanol $2.76 $2.91 Corn Syrup $4.70 HFCS $3.60 DDG $0.65 Total Value $2.17 $5.02 $3.76 $5.69 $4.59 $ December 2002 Prices Corn Value-Added Wet-Milling Dry-Milling Raw Starch & Ethanol & Sweeteners & Products Ethanol & Products Commodity Products Products Corn Syrup HFCS DDG Corn $2.11 Corn Oil $0.44 $0.44 $0.44 $0.44 Gluten Feed $0.35 $0.35 $0.35 $0.35 Gluten Meal $0.30 $0.30 $0.30 $0.30 Starch $4.15 Ethanol $3.00 $3.16 Corn Syrup $5.10 HFCS $3.83 DDG $0.67 Total Value $2.11 $5.24 $4.09 $6.19 $4.92 $3.83 Computation based on the following: Corn prices (Minneapolis Grain Exchange) Corn oil prices (Wall Street Journal) Gluten feed prices (USDA, Grain & Feed Market News) Gluten meal prices (USDA, Grain & Feed Market News) Starch prices (USDA, ERS) Ethanol prices (Mpls/St. Paul market, Axxis Petroleum) Corn syrup prices (Milling & Baking News) HFCS prices (Milling & Baking News) DDG prices (USDA, Grain & Feed Market News) 27
29 Value of Corn Raw Commodity vs. Value-Added (per bushel of corn) 1. July 2000 Prices Corn Value-Added Wet-Milling Dry-Milling Raw Starch & Ethanol & Sweeteners & Products Ethanol & Products Commodity Products Products Corn Syrup HFCS DDG Corn $1.48 Corn Oil $0.21 $0.21 $0.21 $0.21 Gluten Feed $0.22 $0.22 $0.22 $0.22 Gluten Meal $0.26 $0.26 $0.26 $0.26 Starch $4.02 Ethanol $3.43 $3.61 Corn Syrup $4.10 HFCS $4.91 DDG $0.59 Total Value $1.48 $4.71 $4.12 $4.79 $5.60 $ December 2000 Prices Corn Value-Added Wet-Milling Dry-Milling Raw Starch & Ethanol & Sweeteners & Products Ethanol & Products Commodity Products Products Corn Syrup HFCS DDG Corn $1.85 Corn Oil $0.16 $0.16 $0.16 $0.16 Gluten Feed $0.33 $0.33 $0.33 $0.33 Gluten Meal $0.32 $0.32 $0.32 $0.32 Starch $4.06 Ethanol $4.25 $4.48 Corn Syrup $4.26 HFCS $4.91 DDG $0.71 Total Value $1.85 $4.87 $5.06 $5.07 $5.72 $5.18 Computation based on the following: Corn prices (Minneapolis Grain Exchange) Corn oil prices (Wall Street Journal) Gluten feed prices (USDA, Grain & Feed Market News) Gluten meal prices (USDA, Grain & Feed Market News) Starch prices (USDA, ERS) Ethanol prices (Mpls/St. Paul market, Axxis Petroleum) Corn syrup prices (Milling & Baking News) HFCS prices (Milling & Baking News) DDG prices (USDA, Grain & Feed Market News) 28
30 Value of Corn (continued) Raw Commodity vs. Value-Added (per bushel of corn) 3. July 1998 Prices Corn Value-Added Wet-Milling Dry-Milling Raw Starch & Ethanol & Sweeteners & Products Ethanol & Products Commodity Products Products Corn Syrup HFCS DDG Corn $2.14 Corn Oil $0.50 $0.50 $0.50 $0.50 Gluten Feed $0.29 $0.29 $0.29 $0.29 Gluten Meal $0.30 $0.30 $0.30 $0.30 Starch $4.06 Ethanol $2.85 $3.00 Corn Syrup $3.96 HFCS $3.54 DDG $0.66 Total Value $2.14 $5.14 $3.94 $5.05 $4.63 $ December 1998 Prices Corn Value-Added Wet-Milling Dry-Milling Raw Starch & Ethanol & Sweeteners & Products Ethanol & Products Commodity Products Products Corn Syrup HFCS DDG Corn $1.86 Corn Oil $0.47 $0.47 $0.47 $0.47 Gluten Feed $0.37 $0.37 $0.37 $0.37 Gluten Meal $0.34 $0.34 $0.34 $0.34 Starch $3.81 Ethanol $2.51 $2.64 Corn Syrup $3.90 HFCS $3.45 DDG $0.69 Total Value $1.86 $4.99 $3.69 $5.08 $4.63 $3.33 Computation based on the following: Corn prices (Minneapolis Grain Exchange) Corn oil prices (Wall Street Journal) Gluten feed prices (USDA, Grain & Feed Market News) Gluten meal prices (USDA, Grain & Feed Market News) Starch prices (USDA, ERS) Ethanol prices (Mpls/St. Paul market, Axxis Petroleum) Corn syrup prices (Milling & Baking News) HFCS prices (Milling & Baking News) DDG prices (USDA, Grain & Feed Market News) 29
31 Value of Corn (continued) Raw Commodity vs. Value-Added (per bushel of corn) 5. July 1996 Prices Corn Value-Added Wet-Milling Dry-Milling Raw Starch & Ethanol & Sweeteners & Products Ethanol & Products Commodity Products Products Corn Syrup HFCS DDG Corn $4.68 Corn Oil $0.40 $0.40 $0.40 $0.40 Gluten Feed $0.54 $0.54 $0.54 $0.54 Gluten Meal $0.36 $0.36 $0.36 $0.36 Starch $5.87 Ethanol $3.85 $4.06 Corn Syrup $5.26 HFCS $6.86 DDG $1.28 Total Value $4.68 $7.18 $5.16 $6.57 $8.17 $ December 1996 Prices Corn Value-Added Wet-Milling Dry-Milling Raw Starch & Ethanol & Sweeteners & Products Ethanol & Products Commodity Products Products Corn Syrup HFCS DDG Corn $2.46 Corn Oil $0.35 $0.35 $0.35 $0.35 Gluten Feed $0.49 $0.49 $0.49 $0.49 Gluten Meal $0.40 $0.40 $0.40 $0.40 Starch $4.08 Ethanol $2.84 $2.99 Corn Syrup $5.26 HFCS $6.86 DDG $1.15 Total Value $2.46 $5.33 $4.08 $6.51 $8.11 $4.13 Computation based on the following: Corn prices (Minneapolis Grain Exchange) Corn oil prices (Wall Street Journal) Gluten feed prices (USDA, Grain & Feed Market News) Gluten meal prices (USDA, Grain & Feed Market News) Starch prices (USDA, ERS) Ethanol prices (Mpls/St. Paul market, Axxis Petroleum) Corn syrup prices (Milling & Baking News) HFCS prices (Milling & Baking News) DDG prices (USDA, Grain & Feed Market News) 30
32 Minnesota Corn Utilization Crop Year Crop Year Processing 5% Residual Use* 10% Processing 13% Residual Use* 4% Feed Use 30% Export 51% Feed Use 22% Export 61% Total Production: 763 million bu. Total Production: 1,052 million bu. U.S. Corn Utilization Crop Year Crop Year Processing 18% Residual Use 10% Feed Use 49% Processing 23% Residual Use* 4% Feed Use 54% Export 22% Total Production: 7,934 million bu. Export 20% Total Production: 9,008 million bu. * Residual use: All other uses. Source: PRX. 31


33 Industrial Uses of Corn in the U.S. Corn Sweeteners Corn Starch Ethanol Corn Sweeteners Million bu Ethanol 300 Corn Starch ,000 5,500 5,000 HFCS Production in the U.S. HFCS 1,000 short tons, dry weight 4,500 4,000 3,500 3,000 2,500 2,000 1,500 1, HFCS 42% Source: USDA. 32
34 Minnesota DDG Production 2,250 2,160 2,000 1,750 1,584 1,814 Million lb. 1,500 1,250 1, , DDG Prices Annual Average ( )- IL point $ $157.2 $139.7 $/ton $111.9 $ $ Source: USDA. 33
35 U.S. DDG Production 7,000 6,000 6,266 5,000 4,630 1,000 MT 4,000 3,000 2,709 2,000 1,000 1,045 1,351 1,323 1,134 1,460 2, * 03-04* 04-05* *Projected. Source: PRX. U.S. DDG Exports 900, , , , , ,000 MT 500, , , , , , , Source: USDA, FAS. 34
36 10,000 9,000 8,000 U.S. Corn Gluten Feed and Meal Production Production 8,838 Exports 7,515 9,326 7,000 6,302 MT 6,000 5,000 5,179 4,0003,382 3,000 2,000 1, * *Projected. Source: PRX. 400 Protein Feed Prices Weekly Prices Gluten Meal $/ton /13/93 10/5/93 Source: USDA. 4/5/94 9/20/94 3/7/95 8/22/95 2/6/96 7/23/96 1/7/97 6/24/97 12/9/97 5/26/98 11/10/98 4/27/99 10/12/99 3/28/00 Soyben Meal 9/13/00 2/28/01 8/14/01 1/29/02 7/16/02 Soybean Meal 44% Gluten Feed Gluten Meal DDG 35 DDG Gluten Feed 12/31/02
37 Corn Oil Prices Midwest Cents/lb Jan-90 Jan-91 Jan-92 Jan-93 Jan-94 Jan-95 Jan-96 Jan-97 Jan-98 Jan-99 Jan-00 Jan-01 Jan-02 Corn Starch Prices Cents per lb Source: USDA, AMS, Market News Service. 36
38 For more information, please contact: Su Ye Program Leader, Market Research Minnesota Department of Agriculture 90 West Plato Boulevard St. Paul, MN Tel: Fax:
2017 Risk and Profit Conference Breakout Session Presenters. 13. Ethanol and Biodiesel Market and Profitability Prospects
 2017 Risk and Profit Conference Breakout Session Presenters 13. Ethanol and Biodiesel Market and Profitability Prospects Dan O Brien Daniel O Brien was raised on a grain and livestock
Biodiesel Industry A Statewide Assessment
 University of Nebraska - Lincoln DigitalCommons@University of Nebraska - Lincoln Industrial Agricultural Products Center -- Publications & Information Industrial Agricultural Products Center 8-31-2006
The Outlook for Biofuels
 PRX BlueSky Outlook, Page 1 The Fertilizer Institute Fertilizer Outlook and Technology Conference The Outlook for Biofuels November 6, 2007 Ross Korves Economic Policy Analyst The ProExporter Network ross.korves@proexporter.com
Biofuels: Implications for Prices and Production. Darrel L. Good and Scott H. Irwin
 Biofuels: Implications for Prices and Production Darrel L. Good and Scott H. Irwin Why Ethanol? Convert relatively abundant domestic sources of energy into a substitute for imported petroleum Energy Conversion
US biofuel Indicators and a changing market dynamic
 US biofuel Indicators and a changing market dynamic Seth Meyer AMIS October 1-2, 13, Rome Movement of Ag and Energy Ethanol production and capacity 16 35 Crude oil and maize prices 14 3 billion gallons
IMPORTANCE OF THE RENEWABLE FUELS INDUSTRY TO THE ECONOMY OF IOWA
 IMPORTANCE OF THE RENEWABLE FUELS INDUSTRY TO THE ECONOMY OF IOWA Prepared for the Iowa Renewable Fuels Association John M. Urbanchuk Technical Director - Environmental Economics January 20, 2012 Cardno
Market Outlook. David Reinbott.
 Market Outlook David Reinbott Agriculture Business Specialist P.O. Box 187 Benton, MO 63736 (573) 545-3516 http://extension.missouri.edu/scott/agriculture.aspx reinbottd@missouri.edu Trending Issues Volatile
Macro economic and Energy Factors Driving the Agricultural Outlook
 Macro economic and Energy Factors Driving the Agricultural Outlook Michael Swanson Ph.D. Wells Fargo September 2013 Inter connected Markets Economic growth GDP, Population and Income Currency competition
CONTRIBUTION OF THE RENEWABLE FUELS INDUSTRY TO THE ECONOMY OF IOWA
 CONTRIBUTION OF THE RENEWABLE FUELS INDUSTRY TO THE ECONOMY OF IOWA Prepared for the Iowa Renewable Fuels Association John M. Urbanchuk Managing Partner February 26, 2018 Iowa s renewable fuels industry
CURRENT AGRICULTURAL INDUSTRIAL REPORTS
 CURRENT AGRICULTURAL INDUSTRIAL REPORTS USDA Agricultural Outlook Forum Troy Joshua, Chief Environmental, Economics, and Demographics Branch 2/20/2015 10:26 AM 1 Objectives Discuss the history of the Current
Prices indeed dropped on Thursday, aided by a surprise increase in crude oil supplies caused by stronger imports.
 Trump s war on OPEC Farm fuel prices resist President s attempt to jawbone cartel By Bryce Knorr, senior grain market analyst For a day or two, at least, it looked like President Trump s attempt to tweet
POSITIONED FOR GROWTH BNSF Railway. John Miller Group Vice President Agricultural Products BNSF Railway
 POSITIONED FOR GROWTH BNSF Railway John Miller Group Vice President Agricultural Products BNSF Railway 1 Historic Rail Industry Volumes U.S. Class I Weekly Rail Volumes 800,000 2006 2007 2008 2009 2010
USDA Projections of Bioenergy-Related Corn and Soyoil Use for
 USDA Projections of Bioenergy-Related Corn and Soyoil Use for 2010-2019 Daniel M. O Brien, Extension Agricultural Economist K-State Research and Extension The United States Department of Agriculture released
Diesel prices at multi-year highs mean pain at the pump
 Diesel prices at multi-year highs mean pain at the pump Conflicting signals from Wall Street keep commodity prices unsettled By Bryce Knorr, senior grain market analyst Headline news this week provided
Diesel prices finally ease Winter weather and international events could determine your fuel bill for 2018 By Bryce Knorr, senior grain market analyst
 Diesel prices finally ease Winter weather and international events could determine your fuel bill for 2018 By Bryce Knorr, senior grain market analyst After rallying to their highest level in nearly three
An Economic Analysis of Legislation for a Renewable Fuels Requirement for Highway Motor Fuels
 An Economic Analysis of Legislation for a Renewable Fuels Requirement for Highway Motor Fuels John M. Urbanchuk Executive Vice President AUS Consultants November 2001 EXECUTIVE SUMMARY Congress is considering
CONTRIBUTION OF THE RENEWABLE FUELS INDUSTRY TO THE ECONOMY OF IOWA
 CONTRIBUTION OF THE RENEWABLE FUELS INDUSTRY TO THE ECONOMY OF IOWA Prepared for the Iowa Renewable Fuels Association John M. Urbanchuk Managing Partner January 26, 2017 The U.S. ethanol industry experienced
2007 AAEA Livestock Outlook Symposium
 27 AAEA Livestock Outlook Symposium Ron Plain Professor of Agricultural Economics University of Missouri-Columbia www.ssu.missouri.edu/faculty/rplain Hog Price Outlook Production Efficiency 1 Head 9.5
Outlook for Franchised New Car Dealers
 1 Outlook for Franchised New Car Dealers Fourteenth Annual Automotive Outlook Symposium June 1, 2007 Paul Taylor, Ph.D., Chief Economist National Automobile Dealers Association, McLean, VA www.nada.org
Impact of the Biodiesel Industry on the Iowa Economy
 Impact of the Biodiesel Industry on the Iowa Economy John M. Urbanchuk Director LECG, LLC February 28, 2008 EXECUTIVE SUMMARY In the past two years, the biodiesel industry in Iowa has experienced excellent
Technical Corn Oil Review December 2017
 Technical Corn Oil Review December 2017 Brian Engel GM, Vegetable Oil Trading Green Plains Inc. NASDAQ: GPRE www.gpreinc.com Green Plains Partners LP NASDAQ: GPP www.greenplainspartners.com Corn Kernel
Tennessee Soybean Producers Views on Biodiesel Marketing
 Tennessee Soybean Producers Views on Biodiesel Marketing By Kim Jensen, Burton English, and Jamey Menard* April 2003 *Professors and Research Associate, respectively, Department of Agricultural Economics,
Kansas Ethanol 101 January 25, 2016
 Renew Kansas (Previously Kansas Association of Ethanol Processors) Kansas Ethanol 101 January 25, 2016 Put a little Kansas in your tank. ethanol-enriched fuel good for your car good for the environment
Citigroup Biofuels Conference Ethanol on the Cob October 3, 2006
 Citigroup Biofuels Conference Ethanol on the Cob October 3, 2006 Forward-Looking Statements Certain statements in this presentation, and other written or oral statements made by or on behalf of us, are
It s time to start buying propane for fall Expect to pay more to dry 2017 corn crop By Bryce Knorr, senior grain market analyst
 It s time to start buying propane for fall Expect to pay more to dry 2017 corn crop By Bryce Knorr, senior grain market analyst It s the end of winter hopefully and that means it s a good time to buy coats,
UPPER MIDWEST DAIRY NEWS
 Federal Milk Market Administrator U.S. Department of Agriculture UPPER MIDWEST DAIRY NEWS H. Paul Kyburz, Market Administrator Volume 8, Issue 2 Upper Midwest Marketing Area, Federal Order No. 30 February
Manitoba Economic Highlights
 Economic Overview Real Gross Domestic Product The Manitoba Bureau of Statistics estimates that Manitoba s real GDP grew 1.9% in 2016, above the national average of 1.4%. Manitoba s real GDP is expected
Department of Legislative Services
 Department of Legislative Services Maryland General Assembly 2005 Session SB 740 Senate Bill 740 Budget and Taxation FISCAL AND POLICY NOTE Revised (Senator Middleton, et al.) Environmental Matters Renewable
National Economic Estimating Conference Held July 12, 2018 FINAL Long-Run Tables
 TABLE OF CONTENTS SECTION PAGE Executive Summary 2 Real Expenditures 4 Components of Income 6 Employment and Output 7 Financial Markets 9 Prices 10 Nominal Expenditures 12 The National Economic Estimating
No sale Farmers continue to hold tight By Bryce Knorr
 No sale Farmers continue to hold tight By Bryce Knorr Basis in the grain cash market didn t firm everywhere during Thanksgiving week, but overall the trend is for strengthening as growers resist selling
William Piel
 Fuel Options Exist for Expanding Gasoline Supplies without processing additional Crude Oil? E1? E2? E8? ETBE? Which use of in Fuel Provides the Highest Market Value? Which use of results in the Most Non-Petroleum
CREDIT UNION ESTIMATES
 MONTHLY CREDIT UNION ESTIMATES Prepared June 1, 2018 by Credit Union National Association Economics and Statistics Department cuna.org/mcue Loans Credit union loans outstanding grew 1.1% in, matching the
Corn Outlook. David Miller Director of Research & Commodity Services Iowa Farm Bureau Federation December 2013
 Corn Outlook David Miller Director of Research & Commodity Services Iowa Farm Bureau Federation December 2013 Source: USDA-WAOB U.S. Corn Supply & Usage U.S. Corn Supply & Usage Comments With the largest
CREDIT UNION ESTIMATES
 MONTHLY CREDIT UNION ESTIMATES Prepared September 28, 2018 by Credit Union National Association Economics and Statistics Department cuna.org/mcue Loans Credit union loans outstanding grew 1.0% in, compared
CREDIT UNION ESTIMATES
 MONTHLY CREDIT UNION ESTIMATES Prepared September 4, 2018 by Credit Union National Association Economics and Statistics Department cuna.org/mcue Loans Credit union loans outstanding grew 1.1% in, compared
CREDIT UNION ESTIMATES
 MONTHLY CREDIT UNION ESTIMATES Prepared May 1, 2018 by Credit Union National Association Economics and Statistics Department cuna.org/mcue Loans Credit union loans outstanding grew 1.1% in, compared to
A. U.S. Ethanol Policy. B. U.S. Ethanol Industry Capacity. C. U.S. Ethanol Prices, Costs & Profits. E. Key Ethanol Related Research
 U.S. Ethanol Market Outlook Kansas Farm Managers & Rural Appraisers Annual Meeting February 24, 2012 Ethanol Policy & Markets A. U.S. Ethanol Policy B. U.S. Ethanol Industry Capacity C. U.S. Ethanol Prices,
CREDIT UNION ESTIMATES
 MONTHLY CREDIT UNION ESTIMATES Prepared July 2, 2018 by Credit Union National Association Economics and Statistics Department cuna.org/mcue Loans Credit union loans outstanding grew 1.3% in, compared to
State Policy Trends in Biomass
 State Policy Trends in Biomass Biomass 2010 March 30, 2010 Glen Andersen National lconference of State Legislatures Overview of State Policies Renewable Fuel Standards Renewable Portfolio Standards Reducing/Eliminating
CREDIT UNION ESTIMATES
 MONTHLY CREDIT UNION ESTIMATES Prepared March 4, 2019 by Credit Union National Association Economics and Statistics Department cuna.org/mcue Loans Credit union loans outstanding grew 0.3% in January, compared
High fuel costs could last Diesel and propane may not get much cheaper in 2019 By Bryce Knorr, senior grain market analyst
 High fuel costs could last Diesel and propane may not get much cheaper in 2019 By Bryce Knorr, senior grain market analyst In July I recommended using a dip in the energy market to lock in propane for
CREDIT UNION ESTIMATES
 MONTHLY CREDIT UNION ESTIMATES Prepared March 2, 2018 by Credit Union National Association Economics and Statistics Department cuna.org/mcue Loans Credit union loans outstanding grew 0.7% in, compared
CREDIT UNION ESTIMATES
 MONTHLY CREDIT UNION ESTIMATES Prepared February 1, 2018 by Credit Union National Association Economics and Statistics Department cuna.org/mcue Loans Credit union loans outstanding grew 1.0% in, compared
CREDIT UNION ESTIMATES
 MONTHLY CREDIT UNION ESTIMATES Prepared August 1, 2018 by Credit Union National Association Economics and Statistics Department cuna.org/mcue Loans Credit union loans outstanding grew 1.3% in, matching
CREDIT UNION ESTIMATES
 MONTHLY CREDIT UNION ESTIMATES Prepared January 2, 2019 by Credit Union National Association Economics and Statistics Department cuna.org/mcue Loans Credit union loans outstanding grew 0.6% in, compared
CREDIT UNION ESTIMATES
 MONTHLY CREDIT UNION ESTIMATES Prepared November 1, 2017 by Credit Union National Association Economics and Statistics Department cuna.org/mcue Loans Credit union loans outstanding grew 0.7% in, compared
What you might have missed Bioenergy Situation & Outlook
 What you might have missed Bioenergy Situation & Outlook Ag Lenders Conference David Ripplinger Fall 2018 Record US Corn Ethanol Production Record US Corn Ethanol Exports Expanding US Corn Ethanol Capacity
Table 1 ANTIGUA AND BARBUDA: MAIN ECONOMIC INDICATORS
 Antigua Tables 2006 1 Main Indicators 03/11/2006 08:05 AM Table 1 ANTIGUA AND BARBUDA: MAIN ECONOMIC INDICATORS 1996 1997 1998 1999 2000 2001 2002 2003 2004 2005 a/ Annual growth rates b/ Gross domestic
Crop Market Outlook 8/22/2017
 MSU is an affirmativeaction, equal-opportunity employer. Michigan State University Extension programs and materials are open to all without regard to race, color, national origin, gender, gender identity,
ECONOMIC SURVEY STATISTICAL APPENDIX
 ECONOMIC SURVEY 2017-18 STATISTICAL APPENDIX STATISTICAL APPENDIX : ECONOMIC SURVEY 2017-18 PAGE 1 National Income and Production 1.1 Gross National Income and Net National Income... A1-A2 1.2 Annual
CHARTS AND PRICE PROJECTIONS
 CHARTS AND PRICE PROJECTIONS 18 / Charts and Price Projections: FAPRI 27 Agricultural Outlook Average Annual GDP Growth Percent Change 9 8 7 6 4 3 2 1 26-216 Canada China EU NMS EU- India Japan Latin America
CONTRIBUTION OF THE BIODIESEL INDUSTRY TO THE ECONOMY OF THE UNITED STATES
 CONTRIBUTION OF THE BIODIESEL INDUSTRY TO THE ECONOMY OF THE UNITED STATES Prepared for the National Biodiesel Board With Funding Support from the United Soybean Board 1 John M. Urbanchuk Director LECG,
GDP. Total Domestic demand External balance 1)
") 3.1 GDP and expenditure components (quarterly data seasonally adjusted; annual data unadjusted) GDP Total Domestic demand External balance 1) Total Private Government Gross fixed capital formation Changes
3.1 GDP and expenditure components (quarterly data seasonally adjusted; annual data unadjusted) GDP Total Domestic demand External balance 1) Total Private Government Gross fixed capital formation Changes
External Market Factors Impacting US Soybean Meal
 External Market Factors Impacting US Soybean Meal USSEC Luncheon International Production and Processing Expo January 3, 213 Atlanta, GA Paul Smolen Presentation Objectives Examine the economic drivers
Agricultural and Construction Equipment 2014 Outlook
 Agricultural and Construction Equipment 2014 Outlook Federal Reserve Bank of Chicago 2013 Outlook Symposium December 6, 2013 Agenda Agricultural Machinery Current Situation Demand Factors 2014 Outlook
Thursday, March 6, 2014 Houston, TX. 8:30 9:40 a.m. AN ECONOMIST S-EYE VIEW OF THE ENERGY INDUSTRY: HYDROCARBON HAT TRICK
 Thursday, March 6, 214 Houston, TX 8:3 9:4 a.m. AN ECONOMIST S-EYE VIEW OF THE ENERGY INDUSTRY: HYDROCARBON HAT TRICK Presented by Jesse Thompson Business Economist Federal Reserve Bank of Dallas, Houston
Economic Parameters for Corn Ethanol and Biodiesel Production. Vernon R. Eidman 1
 Economic Parameters for Corn Ethanol and Biodiesel Production By Vernon R. Eidman 1 Ethanol and biodiesel production in the U.S. have been increasing rapidly over the past two years. Ethanol production
STATISTICAL TABLES RELATING TO INCOME, EMPLOYMENT, AND PRODUCTION
 A P P E N D I X B STATISTICAL TABLES RELATING TO INCOME, EMPLOYMENT, AND PRODUCTION C O N T E N T S NATIONAL INCOME OR EXPENDITURE Page B 1. Gross domestic product, 1960 2009... 328 B 2. Real gross domestic
Item
 332 Key Indicators of Developing Asian and Pacific Countries 333 001 POPULATION million; as of 1 July 47.72 48.71 49.68 50.64 51.58 52.51 53.43 54.33 55.21 55.84 56.57 57.29 58.01 58.71 59.40 60.00 60.60
Thank you, Chairman Shimkus and Ranking Member Tonko. I appreciate the opportunity to
 Thank you, Chairman Shimkus and Ranking Member Tonko. I appreciate the opportunity to testify today on behalf of the National Corn Growers Association (NCGA). NCGA represents nearly 40,000 dues-paying
Appendix B STATISTICAL TABLES RELATING TO INCOME, EMPLOYMENT, AND PRODUCTION
 Appendix B STATISTICAL TABLES RELATING TO INCOME, EMPLOYMENT, AND PRODUCTION C O N T E N T S Page NATIONAL INCOME OR EXPENDITURE: B. Gross domestic product, 959 005... 80 B. Real gross domestic product,
CHARTS AND PRICE PROJECTIONS
 CHARTS AND PRICE PROJECTIONS 18 / Charts and Price Projections: FAPRI 28 Agricultural Outlook Average Annual GDP Growth, 27-217 Percent Change 1 8 8.4 7.92 6 4 4.44 3.67 4.6 4.34 2 2.37 2.17 1.38 2.44
Biofuels, Energy Security, and Future Policy Alternatives. Wally Tyner
 Biofuels, Energy Security, and Future Policy Alternatives Wally Tyner Purdue University Ethanol Economics Ethanol has value as energy and as an additive to gasoline The energy content is about 68% of gasoline
Montana Renewable Energy Association
 Montana Renewable Energy Association Mission & Focus areas: Education and Outreach Policy and Advocacy Industry Engagement www.montanarenewables.org SolSmart Solar Ready communities making process of going
Copyright 2018 Renewable Energy Group, Inc. AFOA Biomass Based Diesel Market Trends
 AFOA Biomass Based Diesel Market Trends Agenda Production Trends Modest and steady growth in biodiesel Potential Growth in RD, timeline is uncertain Co-processing volume yet to materialize Market Trends
Macroeconomic Outlook. Presented by Dr. Bruce A. Scherr Chairman of the Board Chief Executive Officer Emeritus
 Macroeconomic Outlook Presented by Dr. Bruce A. Scherr Chairman of the Board Chief Executive Officer Emeritus Waterways Symposium Cincinnati, OH November 15-17, 2016 Topics Energy Macro Implications Inflation
BioFuels Lessons Learned From Georgia
 The University of Georgia Center for Agribusiness and Economic Development College of Agricultural and Environmental Sciences BioFuels Lessons Learned From Georgia www.caed.uga.edu John McKissick, George
Wheat Marketing Situation
 Wheat Marketing Situation Prepared by: Darrell L. Hanavan Executive Director Colorado Wheat Administrative Committee If you would like to receive an email when this report is updated, email gmostek@coloradowheat.org
TOOL #5: C&S WASDE PRICE STUDY FOR DECEMBER CORN 7/09/10 For the July 9 th to the August 12 th time frame for CZ 2010
 TOOL #5: C&S WASDE PRICE STUDY FOR DECEMBER CORN 7/09/10 For the July 9 th to the August 12 th time frame for CZ 2010 Brief summary: In the month ahead, my best estimate is that CZ 2010 could trade in
U.S. Ethanol Ready For The World Market
 U.S. Ethanol Ready For The World Market The United States has plenty of ethanol and is ready and willing to meet foreign market needs. As the U.S. Grains Council (USGC) works with its industry partners
A summary of national and global energy indicators. FEDERAL RESERVE BANK of KANSAS CITY
 THE U.S. Energy DATABOOK A summary of national and global energy indicators JULY 1, 17 FEDERAL RESERVE BANK of KANSAS CITY SUMMARY OF CURRENT ENERGY CONDITIONS The number of total active drilling rigs
World Wheat Supply and Demand Situation October 2018
 World Wheat Supply and Demand Situation October 218 Major data source: USDA World Agricultural Supply and Demand Estimates released October 12, 218. Projections will change over the course of the year
World Wheat Supply and Demand Situation
 World Wheat Supply and Demand Situation November 218 Major data source: USDA World Agricultural Supply and Demand Estimates released November, 218. Projections will change over the course of the year depending
The economics of biofuels. by Ronald Steenblik Director of Research
 The economics of biofuels by Ronald Steenblik Director of Research Current and expected future costs of ethanol 1.0 0.8 0.6 0.4 2005 2030 Ethanol from sugar cane Ethano from maize Ethanol from sugar beet
Renewable Energy Choices
 More customers joined our renewable choice programs in 2017, with participation reaching more than 150,000 as program choices increased. CUSTOMER SOLUTIONS Renewable Energy Choices Our Approach We recognize
Biofuels Incentives: A Summary of Federal Programs
 Order Code RL33572 Biofuels Incentives: A Summary of Federal Programs Updated March 18, 2008 Brent D. Yacobucci Specialist in Energy and Environmental Policy Resources, Science, and Industry Division Biofuels
Economic and Commodity Market Outlook
 Economic and Commodity Market Outlook August 12, 2016 By Robert Coats, Ph.D. Professor Economics Department of Agricultural Economics and Agribusiness Division of Agriculture University of Arkansas System
World Wheat Supply and Demand Situation
 World Wheat Supply and Demand Situation September 218 Major data source: USDA World Agricultural Supply and Demand Estimates released September 12, 218. Projections will change over the course of the year
The U.S. Recovery: Back from Sabbatical
 The U.S. Recovery: Back from Sabbatical Presented to: Federation of Tax Administrators Revenue Estimating Conference New Orleans, Louisiana September 22, 2003 Presented by: Cynthia Latta Managing Director
State of the States NATIONAL BIODIESEL BOARD. Jacobsen Conference. Shelby Neal. May 24, 2018 Chicago, IL
 NATIONAL BIODIESEL BOARD State of the States Jacobsen Conference May 24, 2018 Chicago, IL Shelby Neal Director of State Governmental Affairs National Biodiesel Board 1 NATIONAL BIODIESEL BOARD Represent
Preliminary Assessment of the Drought s Impacts on Crop Prices and Biofuel Production
 CARD Policy Brief 12-PB 7 July 2012 Preliminary Assessment of the Drought s Impacts on Crop Prices and Biofuel Production by Bruce Babcock Partial support for this work is based upon work supported by
Federated States of Micronesia
 IMF Country Report No. 13/17 Federated States of Micronesia 2012 ARTICLE IV CONSULTATION 2012 Statistical Appendix January 29, 2001 January 29, 2001 This Statistical Appendix paper for the Federated States
Do Tax Incentive Programs Change Taxpayers' Behavior?
 Do Tax Incentive Programs Change Taxpayers' Behavior? A Case Study Of Effectiveness of the Iowa Biofuel Retailers' Tax Credits John Good Mandy Jia Iowa Department of Revenue September 3, 214 FTA Revenue
Reed Job Index: September 2010
 Reed Job Index: September 2010 The Reed Job Index tracks the number of new job opportunities and the salaries on offer compared to the previous month and against a baseline of 100 set in December 2009.
Overhauling Renewable Energy Markets
 Overhauling Renewable Energy Markets Bruce Babcock Iowa State University Presented at Recognizing Risk in Global Agriculture, Ag Symposium, Federal Reserve Bank of Kansas City. July 19, 2011. Kansas City,
ENERGY SLIDESHOW. Federal Reserve Bank of Dallas
 ENERGY SLIDESHOW Updated: March 13, 2018 ENERGY PRICES www.dallasfed.org/research/energy Brent & WTI & Crude Brent Oil Crude Oil Dollars per barrel 140 Brent (Mar 9 = $65.12) WTI (Mar 9 = $61.65) 120 100
KCB GROUP PLC INVESTOR PRESENTATION. Q FINANCIAL RESULTS
 KCB GROUP PLC INVESTOR PRESENTATION. Q3 2018 FINANCIAL RESULTS MACRO-ECONOMIC HIGHLIGHTS Macro-Economic Highlights: Kenya KENYA 4.9% 5.3% GDP Growth Rate (%) 5.6% 5.8% 4.9% 6.3% 6.2% KENYA 2013 2014 2015
May ATR Monthly Report
 May ATR Monthly Report Minnesota Department of Transportation Office of Transportation Data and Analysis May 2011 Introduction The purpose of this report is to examine monthly traffic trends on Minnesota
SOYBEAN OUTLOOK Midwest & Great Plains/Western Extension Summer Outlook Conference. St. Louis, Missouri
 SOYBEAN OUTLOOK 2014 Midwest & Great Plains/Western Extension Summer Outlook Conference St. Louis, Missouri Jim Hilker Department of Agricultural, Food, And Resource Economics Michigan State University
Contents. Automotive Holdings Group Limited
 Automotive Holdings Group Limited Institutional Briefings Year End Results June Contents FY Highlights Corporate Statistics Group Performance Floorplan Financing Automotive Logistics Outlook Appendices
Iowa Biodiesel Board Sept. 9, 2011 Gary Haer, VP, Sales and Marketing, REG Chairman, National Biodiesel Board. Copyright Renewable Energy Group
 Iowa Biodiesel Board Sept. 9, 2011 Gary Haer, VP, Sales and Marketing, REG Chairman, National Biodiesel Board. 1 Agenda Biodiesel, America s Advanced Biofuel New Biorefining Manufacturing Sector Creating
NBB & IBB Annual Meeting
 NBB & IBB Annual Meeting September 12, 2018 Doug Struyk Carney & Appleby, PLC 402.510.1576 struyk@carneyappleby.com Political Landscape 2018 Elections Governor - Reynolds/Gregg vs. Hubbell/Hart. Has been
Energy Briefing: US Petroleum Products Supplied
 Energy Briefing: US Petroleum Products Supplied December 29, 217 Dr. Edward Yardeni 516-972-7683 eyardeni@ Mali Quintana 48-664-1333 aquintana@ Please visit our sites at www. blog. thinking outside the
World Wheat Supply and Demand Situation August 2018
 World Wheat Supply and Demand Situation August 218 Major data source: USDA World Agricultural Supply and Demand Estimates released August 1, 218. Projections will change over the course of the year depending
Midwest Governors Association Webinar
 Midwest Governors Association Webinar Clean Cities Success Stories 12/16/14 Samantha Bingham, Lisa Thurstin, Lorrie Lisek Chicago Area, Minnesota, & Wisconsin Clean Cities Coordinators Samantha.bingham@cityofchicago.org
Q Analyst Teleconference. 9 August 2018
 9 August 218 Disclaimer This presentation contains forward-looking statements that reflect the Company management s current views with respect to certain future events. Although it is believed that the
Cambodia. East Asia: Testing Times Ahead
 Key Indicators Cambodia 68 East Asia: Testing Times Ahead 2002 2003 2004 2005 2006 2007 /e 2008 /p 2009 /p Year Year Year Year Year Year Year Year Real GDP (% change, previous year) 6.5 8.5 10.0 13.5 10.8
Petroleum and Natural Gas Situation
 Petroleum and Natural Gas Situation John C. Felmy Chief Economist and Director Statistics Department American Petroleum Institute Felmyj@api.org www.api.org www.gasolineandyou.org www.naturalgasfacts.org
Item
 Key Indicators for Asia and the Pacific 2010 POPULATION a Total population million; as of 1 July 18.17 18.55 18.93 19.33 19.73 20.14 20.56 20.99 21.42 21.87 22.32 22.79 23.30 23.82 24.36 24.91 25.47 26.04
GROWTH IN TENTH DISTRICT MANUFACTURING WAS SLIGHTLY POSITIVE Federal Reserve Bank of Kansas City Releases February Manufacturing Survey
 FOR RELEASE Thursday, February 27, 2014 EMBARGOED FOR 10 A.M. CENTRAL TIME CONTACT: Pam Campbell 405-270-8617 Pam.Campbell@kc.frb.org GROWTH IN TENTH DISTRICT MANUFACTURING WAS SLIGHTLY POSITIVE Federal