Foreign Trade Statistics. First Quarter Trade and industry
|
|
|
- Marjory Kelly
- 6 years ago
- Views:
Transcription


1 Foreign Trade Statistics First Quarter Trade and industry
2
3 COPYRIGHT RESERVED Use of the contents of this publication is allowed, provided the source is stated clearly The Foreign Trade Publication (FTS) is mainly a product of the FTS Team consisting of: Marjolene J. v.d. Biezen-Marques, B.A. (Information Manager) Miriam G. Boekhoudt-Helder (Foreign Trade Statistics) Suyienne Kamperveen-Tromp (Foreign Trade Statistics) For subscriptions contact Mrs. Jo-Anne Croes Tromp or fax: or write to: Central Bureau of Statistics L.G. Smith Blvd 160, Aruba cbs@setarnet.aw Afl or $ 8.00 per copy
4
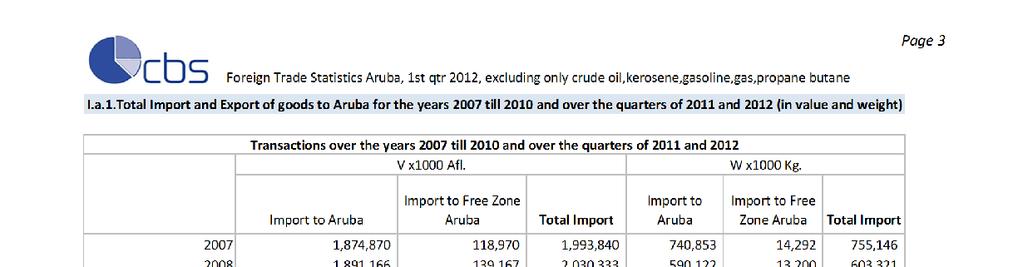
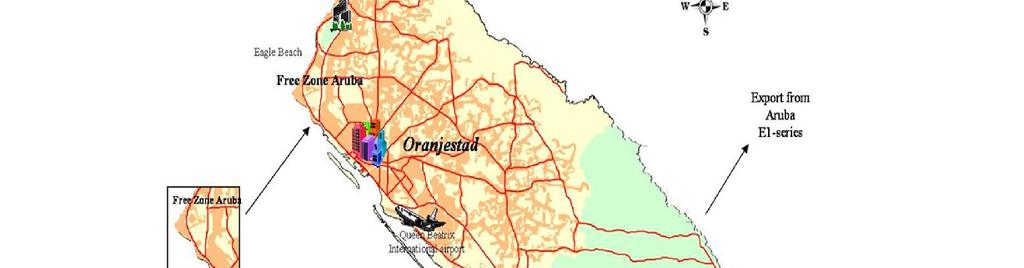
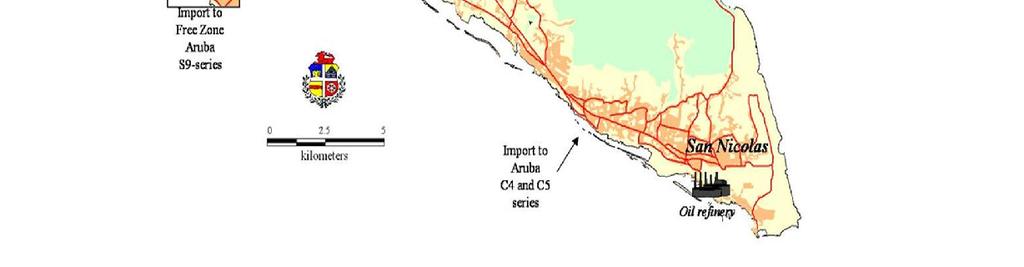
5 HIGHLIGHTS World trade value up by 5% in the first quarter of. The value of world merchandise trade was 5% higher in the first quarter of compared to the same period of 2011, according to WTO figures released on 8 June. This modest performance follows a slowdown in trade during the second half of INTERNATIONAL MERCHANDISE TRADE FOR ARUBA: FIRST QUARTER In the first quarter of the following developments have been registered in the international merchandise flows of Aruba. Trends in total Import 3) During the first quarter of Aruba imported a total value of Afl. 497 million from the rest of the world. This represent a decrease of 8.1% compared to the same quarter of the previous year. (Table 1) Table 1: Total Import according to General Trade System 3) VxAfl.mln Quarterly growth Growth Same quarter 2007 I % -0.4% II % 7.2% III % 6.3% IV % 14.9% 2008 I % 5.6% II % -6.5% III % 13.2% IV % -4.4% 2009 I % -5.9% II % 0.8% III % -1.4% IV % -6.1% 2010 I % -16.4% II % -4.6% III % -21.7% IV % 10.8% 2011 I % 31.3% II % 18.7% Merchandise III trade 523 in the free 6.3% circulation 24.9% area of Aruba 3) IV % 5.2% I % -8.1% 40% 30% 20% 10% 0% -10% -20% -30% 40% 30% 20% 10% 0% -10% -20% -30% graph1a: Total Import General Trade: quarterly growth I II III IV I II III IV I II III IV I II III IV I II III IV I graph 1b: Total Import General Trade: growth same quarter I II III IV I II III IV I II III IV I II III IV I II III IV I Merchandise trade in the free circulation area of Aruba 3) In the first quarter of import to the free circulation area of Aruba decreased with 10.5% compared to the same quarter of the previous year. The value of import to this area was Afl. 446 million in the first quarter of. (Table 2) Table 2: Import free circulation area 3) according to General Trade System VxAfl.mln Quarterly Growth growth Same quarter 2007 I % -0.6% II % 7.6% III % 9.8% IV % 15.2% 2008 I % 5.2% II % -7.2% III % 9.1% IV % -3.3% 2009 I % -5.5% II % -3.5% III % 0.5% IV % -12.5% 2010 I % -22.0% II % -5.5% III % -21.2% IV % 11.3% 2011 I % 39.4% II % 19.1% III % 21.8% IV % 8.1% I % -10.5% 40% 30% 20% 10% 0% -10% -20% -30% 50% 40% 30% 20% 10% 0% -10% -20% -30% graph 2a: Import Free Circulation Area: quarterly growth I II III IV I II III IV I II III IV I II III IV I II III IV I Graph 2b: Import Free Circulation Area: growth same quarter I II III IV I II III IV I II III IV I II III IV I II III IV I
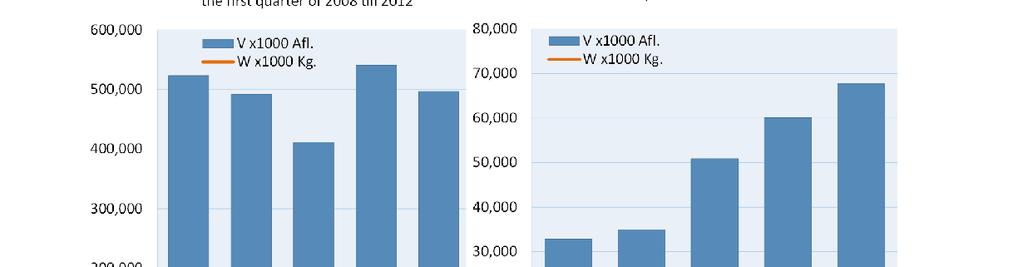
6 In the following graph (graph 3), the import to the free circulation area of Aruba during the first quarters from 2007 till is illustrated. The import to some big companies 4) in Aruba fluctuates a lot. Therefore the import to those companies is combined and separated from the "import to other" to ilustrate this fluctation. V x Afl.mln Graph 3: Import to the free circulation area of Aruba 3), including or excluding certain companies refinary, propane, public owned utility & comunication companies import to other st. Qtr st. Qtr st. Qtr st. Qtr st. 1st. Qtr. Import to the Free Zone of Aruba 3) The value of import to the Free Zone of Aruba for the first quarter of was Afl. 50 million. This represent an increase of 20.9% compared to the same quarter of the previous year. (Table 4) Table 4: Import Free Zone of Aruba 3) according to General Trade System VxAfl.mln Quarterly growth Growth Same quarter 2007 I % 2.7% II % 1.9% III % -29.3% IV % 8.2% 2008 I % 10.5% II % 3.2% III % 79.2% IV % -27.1% 2009 I % -10.9% II % 54.7% III % -20.0% IV % 173.8% 2010 I % 58.5% II % 2.5% III % -27.6% IV % 6.8% 2011 I % -22.7% II % 15.9% III % 66.5% IV % -22.6% I % 20.9% 100% 50% 0% -50% -100% 200% 150% 100% 50% 0% -50% Graph 4a: Import Free Zone of Aruba: quarterly growth I II III IV I II III IV I II III IV I II III IV I II III IV I Graph 4b: Import Free Zone of Aruba: growth same quarter I II III IV I II III IV I II III IV I II III IV I II III IV I The following graph (graph 5) illustrates clearly the huge fluctuations in import and export for the free zone during the past 6 years. For illustrative purposes import values are noted in negative values. The sectors of tobacco and alcohol are the most important products to be imported and exported in the FreeZone. Vx1000Afl Graph 5: Import and export to Free Zone Aruba over the years 2007 till for alcohol, food/other and tobacco products in value Export Tobacco Export Food/Other Export Alcohol Import Tobacco Import Food/Other Import Alcohol st qtr. 2nd qtr. 3rd qtr. 4th qtr.
. The USA had a share of 60.8% in imports to Aruba. From this share 47.7% was by sea, while 13.1% was by air 5).")
 by type of transportation for the first quarter of Import from USA by Sea, 47.7% Import from USA by Air, 13.")
7 Import to the free circulation area of Aruba 3) from USA and Non-USA countries by type of transportation An analysis of the transportation type used to import goods in Aruba indicated that for the first quarter of, 77.3% of imports were by sea and 22.7% by air 5). The USA had a share of 60.8% in imports to Aruba. From this share 47.7% was by sea, while 13.1% was by air 5). (Graph 6) Other customs information for the first quarter of indicated that the total number of containers 6) entering the free circulation area increased with 2%, 3507 containers during the first quarter of compare to 3455 containers in the first quarter of Graph 6: 3) by type of transportation for the first quarter of Import from USA by Sea, 47.7% Import from USA by Air, 13.1% Import from other Non-USA countries by Sea, 29.6% Import from other Non-USA countries by Air, 9.6% Import to the free circulation area of Aruba 3) by Group, Continent and type of transportation In the first quarter of the value of import to the free circulation area of Aruba for air transport 4) was Afl.108 million which represent a decrease of 4.5%. For sea transportation the value of import to the free circulation area of Aruba was Afl.339 million and represent a decrease of 12.1%. The decrease in import, both by air and sea, is directly related to import beloning to the category " Metal products, machinery and equipment". The continent of America remains the main import trade partner for transport of goods by air 4) as well as by sea. (Graph 7a-b) VxAfl.mln st Qtr st Qtr. 1. Agriculture products Graph 7a: Import of goods to Aruba3) by group and by type of transportation for the first quarter of 2011/ SEA AIR 1st Qtr st Qtr. 2. Mineral, chemical and related products 1st Qtr st Qtr. 3. Textiles, pearls and precios stones 1st Qtr st Qtr. 4. Metal products, machinery and equipment 1st Qtr st Qtr. 5. Other transportable goods. VxAfl.mln st Qtr Graph 7b: Import of goods to Aruba3) by continent and by type of transportation for the first quarter of 2011/ 1st Qtr. 1st Qtr st Qtr. 1st Qtr SEA 1st Qtr. AIR 1st Qtr America Asia and Other Caribbean Europe 1st Qtr.
8 Import to the free circulation area of Aruba 3) according to the International Standard Industrial Classification (ISIC) The following graph (Graph 8) represent import to the free circulation area of Aruba by Standard Industrial Classification of all Economic Activities (ISIC). The industrial branch of which the import decreased the most for the first quarter of was "Mining, quarrying and electricity, gas and water supply", decreased by 13% during the first quarter of reaching a value of 20 million, compared to the same quarter of the previous year. The decline is due to completion in some of the biggest companies 4) of different projects whitin these companies. Vx1000 Afl. mln Graph 8: free circulation area3) in value by ISIC for the first quarter of Agric Min Manuf Construct Sale vehi Whole-S trade Retail trade Hotels 2011 Trans Finan.inter Real estate 2011 Pub. adm Education 2011 Health 2011 Other com Private household 2011 Non classified 2011 import to other refinary, propane, public owned utility & comunication companies import to other refinary, propane, public owned utility & comunication companies In the following graph (graph 9), illustrates the import and export to Aruba and Free Zone for the first quarters of the years 2007 till. V x Afl.mln Graph 9: Import and Export to Aruba and the Free Zone Aruba3) Zone Aruba Zone Aruba st. Qtr st. Qtr st. Qtr st. Qtr st. 1st. Qtr ) Import for years 2007 & 2008 excluding all mineral fuels, years 2009 till excluding only crude oil,kerosene,gasoline,gas,propane & butane 4) "refinary (VALERO), propane (ARUGAS), public owned utility (WEB & ELMAR) & comunication companies (SETAR)" refers to the companies established on Aruba 5) All transactions taking place at the custom office at the airport are considered as air-transport. 6) Total containers reflect all container sizes including empty containers.
9 Page 1 Preface Foreign Trade Statistics Aruba, 1st qtr, excluding only crude oil,kerosene,gasoline,gas,propane butane The first quarter Foreign Trade Publication of Aruba contains information on, Zone Aruba, and Zone Aruba. It includes comparisons between the years 2007 till 2010 and over the quarters of 2011 and. The figures pertaining to 2009 till should still be considered as provisional, while the trade statistics series for 2005 till 2008 are final. The CBS developed a system in which it became possible to process the Foreign Trade data according to General Trade System. The 8th of May 2008, the Customs Department switched from the ASYCUDA- system to the Harmonized Commodity Description and Coding System commonly known as the Harmonized System or HS. This is an internationally standarized nomenclature for the description, classification and coding of goods. It is developed and maintained by the World Customs Organization (WCO), formerly known as the Customs Co-operation Council. Currently over 200 countries and customs or economic unions use the Harmonized System as the basis for customs tariffs and for the compilation of international trade statistics. The Harmonized System comprises of 97 Chapters and is arranged in 21 Sections. The pattern of arrangement of goods in the HS is in the increasing degree of manufacture: raw materials, unworked products, semid-finished products, finished products. From January 2009, the CBS will process trade data according to the Harmonized System. In order to facilitate comparisons in time, a link was established between the ASYCUDA-classification and the Harmonized System. Since the introduction of the Harmonized system codification, in 2009, we tried to publish part of the trade in mineral fuels. Finally it has become possible to publicize part of the mineral fuels import and export going back to Elements of Mineral fuels still excluded are crude oil, kerosene, gasoline, gas, propane & butane. Before the year 2009 all mineral fuels were excluded. A special thanks goes to our data-supplier and supporter, namely the department of Duty and Taxes. For further inquiry on definitions and methodology we refer to the Aruba Foreign Trade Statistics Procedure and Definitions, which is available upon request at the Central Bureau of Statistics. The Central Bureau of Statistics hopes that this publication will provide all the users with the necessary information. For comments and further information, feel free to contacts us. The Director of the Central Bureau of Statistics Drs. Ing. M. J. Balkestein Oranjestad, June
10 Page 2 Foreign Trade Statistics Aruba, 1st qtr, excluding only crude oil,kerosene,gasoline,gas,propane butane Table of Contents I.a. Import and Export tables and graphs by sections, excluding only crude oil,kerosene,gasoline,gas,propane & butane 1. Total Import and Export of goods to Aruba for the years 2007 till 2010 and over 3 the quarters of 2011 and (in value and weight) Page b. Import tables and graphs by sections, excluding only crude oil,kerosene,gasoline,gas,propane & butane 1. Import of goods to Aruba by sections over the first quarter of (in value and weight) 4 2. Import of goods to Aruba by sections for the years 2007 till 2010 and over the quarters of 2011 and 6 c. Import tables and graphs by sections and Country, excluding only crude oil,kerosene,gasoline,gas,propane & butane 1. Import of goods by the 12 most important countries over the first quarter of 2011 and 12 (in value and weight) 2. Import of goods to Aruba by the most important countries by sections over the first quarter of 13 (in value and weight) 3. Import of goods to Free Zone Aruba by the most important countries by sections over the 14 first quarter of (in value and weight) d. Export tables and graphs by sections, excluding only crude oil,kerosene,gasoline,gas,propane & butane 1. Export of goods from Aruba by sections over the first quarter of 2011 and (in value and weight) Export of goods from Aruba by sections for the years 2007 till 2010 and over the quarters of 2011 and 17 e. Export tables and graphs by sections and Country, excluding only crude oil,kerosene,gasoline,gas,propane & butane 1. Export of goods by the 10 most important countries over the first quarter of 2011 and 23 (in value and weight) 2. Export of goods from Aruba by the most important countries by sections over the first quarter of 24 (in value and weight) 3. Export of goods from Free Zone Aruba by the most important countries by sections over the 25 first quarter of (in value and weight) II. Explanatory Notes 27 III. Annex -- Commodity Group Codes 29
11
12
13
14 Page 6 Foreign Trade Statistics Aruba, 1st qtr, excluding only crude oil,kerosene,gasoline,gas,propane butane I.b.2. Import of goods to Aruba by sections over the years 2007 till 2010 and over the quarters of 2011 and Section 01 Live animals and other animal products , ,697 17,302 17, , ,464 17,966 17, , ,882 19,940 19, , ,733 20,133 20,133 1 st 37,795 37,795 5,323 5,323 2 nd 36,485 36,485 5,192 5,192 3 rd 35,611 35,611 4,813 4,813 4 th 36,597 36,597 4,895 4,895 1 st 39,925 39,925 5,618 5,618 Section 02 Vegetable products ,474 4,840 66,314 28,926 7,402 36, ,552 3,173 70,725 28,826 5,766 34, ,066 1,672 66,739 30,576 5,281 35, , ,325 30,608 1,300 31,908 1 st 18,895 18,895 7,606 7,606 2 nd 19, ,229 7, ,593 3 rd 18,232 18,232 7,168 7,168 4 th 19, ,504 7, ,824 1 st 19,011 19,011 8,063 8,063 Section 03 Fats and oils ,831 7,831 2,297 2, ,400 10,400 2,274 2, ,913 8,913 2,524 2, ,864 7,864 2,172 2,172 1 st 2,409 2, nd 2,204 2, rd 2,592 2, th 2,518 2, st 2,436 2, Section 04 Food products , , ,717 56,932 6,781 63, , , ,937 58,513 7,070 65, , , ,748 55,176 18,705 73, , , ,987 54,758 9,873 64,631 1 st 50,553 40,392 90,945 12,202 1,941 14,143 2 nd 54,993 57, ,922 13,422 2,796 16,219 3 rd 54,547 48, ,607 13,221 2,406 15,626 4 th 63,169 40, ,406 14,532 2,336 16,868 1 st 55,832 49, ,505 13,930 2,728 16,658
15 Page 7 Foreign Trade Statistics Aruba, 1st qtr, excluding only crude oil,kerosene,gasoline,gas,propane butane Section 05 Mineral products ,059 30, , , ,159 29, , , ,415 32, , , , , , ,983 1 st 8,818 8,818 34,110 34,110 2 nd 5,626 5,626 30,503 30,503 3 rd 6,852 6,852 26,886 26,886 4 th 21,638 21, , ,611 1 st 6,920 6,920 52,207 52,207 Section 06 Chemical products , ,275 26,136 26, , ,963 24, , , ,274 29,853 29, , ,747 19, ,739 1 st 44, ,255 5, ,016 2 nd 55,648 55,648 5,353 5,353 3 rd 54, ,363 5, ,126 4 th 52, ,584 5, ,319 1 st 51, ,677 5, ,526 Section 07 Artificial plastic elements , ,730 7, , , ,113 6, , , ,722 6, , , ,300 5, ,609 1 st 13, ,138 1, ,538 2 nd 16, ,626 1, ,832 3 rd 15, ,858 1, ,593 4 th 16, ,542 1, ,599 1 st 14, ,935 1, ,644 Section 08 Skins, hides, leather and peltry , , , , , , , , st 4, , nd 6, , rd 5, , th 6, , st 6, ,
16 Page 8 Foreign Trade Statistics Aruba, 1st qtr, excluding only crude oil,kerosene,gasoline,gas,propane butane Section 09 Wood, charcoal and woodwork ,836 29,836 14,582 14, , ,898 14, , , ,658 8, , , ,166 11, ,346 1 st 2,749 2,749 1,108 1,108 2 nd 7,569 7,569 2,777 2,777 3 rd 10,888 10,888 5,907 5,907 4 th 4,149 4,149 1,583 1,583 1 st 3,448 3,448 1,945 1,945 Section 10 Materials for the manufacture of paper, paperwork , ,240 8, , , ,009 8, , , ,816 7, , , ,050 7, ,354 1 st 10,785 10,785 1,411 1,411 2 nd 11, ,646 1, ,476 3 rd 12,916 12,916 1,512 1,512 4 th 12,215 12,215 1,759 1,759 1 st 11, ,686 1, ,727 Section 11 Textile fibers and articles , ,228 2, , , ,061 3, , , ,875 2, , , ,534 2, ,397 1 st 22, , nd 22, , rd 23, , th 30, ,188 1, ,590 1 st 23, , Section 12 Footwear, headgear and umbrellas , , , , ,684 1,062 25, , , st 5, , nd 7, , rd 6, , th 8, , st 6, ,
17 Page 9 Foreign Trade Statistics Aruba, 1st qtr, excluding only crude oil,kerosene,gasoline,gas,propane butane Section 13 Works of stone, gypsum, cement, asbestos ,059 50,059 24,456 24, , ,908 19, , , ,334 20, , , ,272 15, ,841 1 st 8,272 8,272 3,242 3,242 2 nd 7, ,036 3, ,790 3 rd 9, ,265 5, ,083 4 th 8, ,937 3, ,903 1 st 6,874 6,874 3,073 3,073 Section 14 Real pearls (natural) and other precious stones , , ,031 89, ,118 71, ,285 80, st 22,469 22, nd 11,093 11, rd 11,300 11, th 44,128 44, st 20,743 20, Section 15 Base metals and derivated works , ,153 20, , , ,432 14, , ,176 1, ,578 13, , , ,537 9, ,866 1 st 30, ,829 4, ,645 2 nd 26, ,398 3, ,130 3 rd 37, ,110 4, ,924 4 th 30, ,002 4, ,476 1 st 26,309 26,309 3,355 3,355 Section 16 Machinery and electrotechnical equipment (new & renewed) , ,824 9, , ,021 3, ,266 10, , ,086 7, ,543 11, , ,543 2, ,295 7, ,682 1 st 133, ,114 3, ,498 2 nd 72, ,925 2, ,229 3 rd 82, ,877 2, ,666 4 th 90, ,289 2, ,120 1 st 76, ,172 2, ,705
18 Page 10 Foreign Trade Statistics Aruba, 1st qtr, excluding only crude oil,kerosene,gasoline,gas,propane butane Section 17 Transport equipment , ,338 7, , ,374 1, ,465 7, , , ,867 6, , , ,983 6, ,327 1 st 28,639 28,639 2,124 2,124 2 nd 27,126 27,126 1,677 1,677 3 rd 33, ,027 2, ,073 4 th 32,104 32,104 1,871 1,871 1 st 27, ,911 1, ,618 Section 18 Optical instruments, apparatus and equipment ,079 96, , , , , , , st 26, , nd 20,345 20, rd 19, , th 30, , st 24, , Section 19 Arms and ammunition st nd rd th st Section 20 Various goods and products n.e.s , ,049 5, , ,056 1,679 52,735 4, , ,345 1,329 54,673 4, , , ,172 4, ,537 1 st 12, ,663 1, ,024 2 nd 14,499 14,499 1,130 1,130 3 rd 17, ,964 1, ,265 4 th 16,951 16,951 1,400 1,400 1 st 12, ,
19 Page 11 Foreign Trade Statistics Aruba, 1st qtr, excluding only crude oil,kerosene,gasoline,gas,propane butane Section 21 Art-objects and collectors items including toys 2) , ,564 1, , , ,118 1, , , ,037 1, , , ,455 1, ,379 1 st 12, , nd 7, , rd 13, , th 17, , st 9, , ) Previously toys were classified in Section 20
20
21 Page 13 Foreign Trade Statistics Aruba, 1st qtr, excluding only crude oil,kerosene,gasoline,gas,propane butane United States Netherlan ds France Panama Netherlands Antilles China Colombia Brazil Korea Republic (South) Venezuela Rest of the world 01 Live animals. 20,089 9, , , Vegetable products 12,764 1, ,330 2, Fats and oils 1, Food products 34,029 9, , , ,261 6, Mineral products 2, , Chemical products 31,211 6, ,818 2, , Artificial plastic.. 8,669 2, , Skins, hides, leather.. 2, , Wood, charcoal & woodwork 2, Materials for the manufacture 7,093 1, , Textile fibers and articles 12,764 1, ,734 1, , Footwear, headgear&umbrellas 3, , Works of stone, gypsum. 3, , Real pearls (natural).. 15, , , Base metals and derivated works 16,494 5, , Machinery&electrotechnical.. 45,518 10,810 5,788 1, , , Transport equipment 9, , , Optical instruments, apparatus 14,353 2, , Arms and ammunition Various goods and products 7,554 1, , Art-objects and collectors 2) 6,702 2, Total 257,338 58,654 9,389 13,437 9,554 6,963 6,461 6,247 8,516 5,022 64,864 2) I.c.2. Import of goods to Aruba by the most important countries by sections over the first quarter of (in value & weight) Section (0..21) in value for the first quarter of Previously toys were classified in Section 20 United States Netherlan ds France Panama Netherlands Antilles China Colombia Brazil Korea Republic (South) Venezuela Rest of the world 01 Live animals. 2,724 1, , Vegetable products 4, , Fats and oils Food products 7,901 2, , Mineral products 4, , , Chemical products 3,419 1, Artificial plastic Skins, hides, leather Wood, charcoal & woodwork 1, Materials for the manufacture Textile fibers and articles Footwear, headgear&umbrellas Works of stone, gypsum , Real pearls (natural) Base metals and derivated works 1, Machinery&electrotechnical.. 1, Transport equipment Optical instruments, apparatus Arms and ammunition Various goods and products Art-objects and collectors 2) Total 31,840 7, ,172 8,638 1, ,018 48,769 2) Previously toys were classified in Section 20 Section (0..21) by weight for the first quarter of
22 Page 14 Foreign Trade Statistics Aruba, 1st qtr, excluding only crude oil,kerosene,gasoline,gas,propane butane I.c.3. Import of goods to Free Zone Aruba by the most important countries by sections over the first quarter of (in value and weight) Section (0..21) in value for the first quarter of Zone Aruba United Kingdom Colombia Paraguay Uruguay Netherlands Antilles Panama United States Rest of the world 04 Food products 23, ,798 3, , Chemical products Artificial plastic Skins, hides, leather Materials for the manufacture Textile fibers and articles Footwear, headgear&umbrellas Machinery&electrotechnical Transport equipment Optical instruments, apparatus 1 20 Various goods and products 5 21 Art-objects and collectors 2) 5 Total 23, ,798 3, ,272 2) Previously toys were classified in Section 20 Section (0..21) by weight for the first quarter of Zone Aruba United Kingdom Colombia Paraguay Uruguay Netherlands Antilles Panama United States Rest of the world 02 Vegetable products 1, Food products 0 06 Chemical products Artificial plastic Skins, hides, leather Textile fibers and articles 1 12 Footwear, headgear&umbrellas 2 13 Works of stone, gypsum Base metals and derivated works 5 16 Machinery&electrotechnical Optical instruments, apparatus 0 21 Art-objects and collectors 2) 0 Total 1, ) Previously toys were classified in Section 20
23
24
25 Page 17 Foreign Trade Statistics Aruba, 1st qtr, excluding only crude oil,kerosene,gasoline,gas,propane butane I.d.2. Export of goods from Aruba by sections for the years 2007 till 2010 and over the quarters of 2011 and Section 01 Live animals and other animal products ,104 1, st nd rd th st Qtr Section 02 Vegetable products ,394 4, ,906 8, ,632 2, ,187 4, ,976 2, ,472 5, ,440 1,480 1 st nd rd th st Qtr Section 03 Fats and oils st nd rd th st Qtr Section 04 Food products , , ,691 1,612 7,028 8, , , ,870 1,128 7,287 8, , , ,845 1,091 19,052 20, , , ,400 1,423 9,438 10,861 1 st ,705 52, ,473 2,774 2 nd ,617 62, ,911 3,219 3 rd ,062 49, ,568 2,927 4 th ,648 45, ,464 2,690 1 st Qtr ,938 52, ,618 2,691
26 Page 18 Foreign Trade Statistics Aruba, 1st qtr, excluding only crude oil,kerosene,gasoline,gas,propane butane Section 05 Mineral products ,456 2, st nd rd th st Qtr Section 06 Chemical products , ,254 2, , , , , , , , st nd 2,242 2, rd 1,822 1, th st Qtr. 1,030 1, Section 07 Artificial plastic elements , , st nd rd th st Qtr Section 08 Skins, hides, leather and peltry , , st nd rd th st Qtr
27 Page 19 Foreign Trade Statistics Aruba, 1st qtr, excluding only crude oil,kerosene,gasoline,gas,propane butane Section 09 Wood, charcoal and woodwork st nd rd th st Qtr Section 10 Materials for the manufacture of paper, paperwork , , , , ,018 3, , , ,137 1 st nd ,315 1,335 3 rd ,020 1,267 4 th ,015 1 st Qtr ,350 1,518 Section 11 Textile fibers and articles , , st nd rd th st Qtr Section 12 Footwear, headgear and umbrellas st nd rd th st Qtr
28 Page 20 Foreign Trade Statistics Aruba, 1st qtr, excluding only crude oil,kerosene,gasoline,gas,propane butane Section 13 Works of stone, gypsum, cement, asbestos , st nd rd th st Qtr Section 14 Real pearls (natural) and other precious stones ,362 2, ,940 4, ,397 2, ,361 7, st nd 10,315 10, rd 1,356 1, th 1,047 1, st Qtr. 1,801 1, Section 15 Base metals and derivated works ,627 11,627 4,769 4, , ,712 4, , , ,149 4, , , ,975 6, ,148 1 st 1, ,454 1, ,802 2 nd 1, ,966 3, ,360 3 rd 1, ,714 2, ,518 4 th 1, ,675 2, ,918 1 st Qtr. 2, ,824 3, ,158 Section 16 Machinery and electrotechnical equipment (new & renewed) , , , , , ,965 3,338 12, , , st 1,545 1, nd 1, , rd 1,518 1, th 1, , st Qtr. 5,058 5,
29 Page 21 Foreign Trade Statistics Aruba, 1st qtr, excluding only crude oil,kerosene,gasoline,gas,propane butane Section 17 Transport equipment , , , , , , , , st 1, , nd 1, , rd 1, , th st Qtr. 1, , Section 18 Optical instruments, apparatus and equipment ,939 2, ,241 1, ,262 1, st nd rd 1,164 1, th , st Qtr Section 19 Arms and ammunition st nd 3 rd th 1 st Qtr Section 20 Various goods and products n.e.s ,735 4, st nd rd th st Qtr
30 Page 22 Foreign Trade Statistics Aruba, 1st qtr, excluding only crude oil,kerosene,gasoline,gas,propane butane Section 21 Art-objects and collectors items including toys 2) , , , , , , , , st nd 2, , rd 4, , th 1, , st Qtr. 1, , ) Previously toys were classified in Section 20
31
32 Page 24 Foreign Trade Statistics Aruba, 1st qtr, excluding only crude oil,kerosene,gasoline,gas,propane butane I.e.2. Export of goods from Aruba by the most important countries by sections over the first quarter of (in value and weight) Taiwan United States Venezuela Netherlands Antilles Colombia Netherl ands Bahamas France China Brazil Rest of the world 01 Live animals Vegetable products Fats and oils Food products Mineral products Chemical products Artificial plastic Skins, hides, leather Wood, charcoal & woodwork Materials for the manufacture Textile fibers and articles Footwear, headgear&umbrellas Works of stone, gypsum Real pearls (natural) Base metals and derivated works 685 1, Machinery&electrotechnical , , Transport equipment Optical instruments, apparatus Arms and ammunition 2 20 Various goods and products Art-objects and collectors 2) Total 715 3,366 2,641 2, ,304 1, ,688 2) Previously toys were classified in Section 20 Section (0..21) in value for the first quarter of Taiwan United States Venezuela Netherlands Antilles Colombia Netherl ands Bahamas France China Brazil Rest of the world 01 Live animals Vegetable products Fats and oils Food products Mineral products Chemical products Artificial plastic Skins, hides, leather Wood, charcoal & woodwork Materials for the manufacture Textile fibers and articles Footwear, headgear&umbrellas Works of stone, gypsum Real pearls (natural) Base metals and derivated works 2, Machinery&electrotechnical Transport equipment Optical instruments, apparatus Arms and ammunition - 20 Various goods and products Art-objects and collectors 2) Total 2, ) Previously toys were classified in Section 20 Section (0..21) by weight for the first quarter of
33 Page 25 Foreign Trade Statistics Aruba, 1st qtr, excluding only crude oil,kerosene,gasoline,gas,propane butane I.e.3. Export of goods from Free Zone Aruba by the most important countries by sections over the first quarter of (in value and weight) Panama Colombia Venezuela Netherlands Antilles Netherlands Surinam Mexico United States Taiwan Rest of the world 04 Food products 9 25,606 16, , Artificial plastic Skins, hides, leather Materials for the manufacture Textile fibers and articles Footwear, headgear&umbrellas Base metals and derivated works Transport equipment Art-objects and collectors 2) 3 Section (0..21) in value for the first quarter of Zone Aruba Total 9 25,620 16, ,059 2) Previously toys were classified in Section 20 Panama Colombia Venezuela Netherlands Antilles Netherlands Surinam Mexico United States Taiwan Rest of the world 04 Food products 1 1, Artificial plastic Skins, hides, leather Materials for the manufacture 30 1, Textile fibers and articles Footwear, headgear&umbrellas Base metals and derivated works Transport equipment 5 21 Art-objects and collectors 2) 0 Section (0..21) by weight for the first quarter of Zone Aruba Total 1 1, , ) Previously toys were classified in Section 20
34
35 II. Explanatory Notes Page 27 Foreign Trade Statistics Aruba, 1st qtr, excluding only crude oil,kerosene,gasoline,gas,propane butane 1. Trade Data The collection of data through Customs administration conform the automated Harmonized System of Aruba register all the documents "Enig Document". The customs department registers approximately 8500 documents per month. While we assumed that all existing documents are incorporated in the Harmonized System, CBS analysis shows that there are a good number of documents, which are lost only a part of which are recovered and with much delay. In order to report findings on a timely basis, it was decided to publish preliminary quarterly data. Possible corrections will be made in the annual FTS publication. 2. Trade Flows CBS is utilizing the International General Trade System for the processing and publication of all import and export data by commodities and by country for the island of Aruba.* Definitions: The Customs Department also registers trade in and out of the bonded warehouses and freezones. Because of the importance of this type of trade for Aruba, we include these trade flow separately in the table wich we called them, Zone Aruba added two additional tables, which we called Storage and Transit. All freezone transactions consisting of storage ( Zone Aruba) and transit ( Zone Aruba) are recorded using an S9 for storage of the goods into the warehouses and an E8 for the release of the goods out of the warehouses. There are two types of movement at the free zone: S9 for goods that arrive from abroad and are stored and E4 for goods exported from Aruba into the freezone. These goods leave the freezone either as a transit good (E8) or an import into Aruba (C48.). By definition, these transactions belong to the Special Trade as well as the General Trade. For many reasons, certain goods are excluded, such as monetary gold, securities, bank notes, coins in circulation and postal items; and goods consigned by a government to its armed forces and diplomatic representatives abroad including Embassies, Consulates, Kabinet van Nederlandse-Antilliaanse en Arubaans Zaken (KABNA), Kabinet of the Governer and Marinierskazerne. These goods are excluded from the foreign trade statistics according to United Nations recommendations. Certain commodities are also excluded from this publication because of specific statistical thresholds or lack of data, for example in the case of mineral fuels. Mineral products (section 5) consist of three categories of wich mineral fuels (categorie 27) is excluded. However, this product will be included in the near future. 3. Partner Countries In the case of import, the partner country is the country of consignment or provenance from which goods are dispatched to Aruba without any commercial transaction in intermediate countries. In case of export, the partner country is the country of destination known at the time of dispatchment as the final country to which goods are delivered. The tables by country show the 10 most important countries of the trade value by section for each transaction type. These top countries represent the total transactions by Section * Total Imports respectively Total Export include all goods entering respectively leaving the economic territory of Aruba. The economic territory of Aruba comprises Aruba (the free circulation area) and the Freezone Aruba. This is consistent with the General Trade System.
36 4. Commodity and Country classification 5. Values and Quantities 6. Publications Page 28 Foreign Trade Statistics Aruba, 1st qtr, excluding only crude oil,kerosene,gasoline,gas,propane butane Harmonized System for Aruba covers 5507 eight digit commodity codes. The first two digits of the code are universally recognize product codes. The remaining six digits further divide the categories into the specific commodities. For publication purposes, Aruba uses 21 sections to clearly organize these product groups. Until december 2008, the Asycuda coding system was used by the Customs department of Aruba. The value of the goods equals the value of the commodity at the place and time it crosses the border. The basis for valuation is cost, insurance & freight (c.i.f.) for import and free on board (f.o.b.) for export. All values are in thousands of Aruban Florins ($1=Afl. 1.79) (Vx1000 Afl) quantities are expressed as net weight in thousand of kilos (Wx1000 kg). Blanks on values or quantities indicate that there was no transaction for that commodity code. The quarterly Foreign Trade report contains global information on imports and exports of Aruba. This publication consists of: Quarterly imports and exports by Harmonized Sections Quarterly imports and exports by country and by Harmonized Sections 7. Tables and graphs Definitions of tables are shown in the upper left-hand corner of each table. Definitions of graphs are shown above each graph.
37 Page 29 butane Annex 1: Foreign Trade Statistics Aruba, 1 st qtr, excluding only crude oil,kerosene,gasoline,gas,propane Harmonized Commodity Group Codes Classification by Sections and Categories 01. Live animals and other animal products Fur and imitation-fur Live animals Meat 09. Wood, charcoal and woodwork Fish and seafood Wood Dairy products Cork Animals other Wattlework and basketwork 02. Vegetable products 10. Materials for the manufacture of paper, paperwork Live plants Materials for the manufacture of paper Vegetables Paper and cardboard Fruit Bookstore articles and graphic art Coffee and tea,mate and spices product Grains 11. Textile fibres and artiles Flour Silk Oil seeds and oleginous fruits Wool,yarn,textile and crin Vegetable substances Cotton Other food product Other vegetable textiele fibres Synthetic fibre 03. Fats and oils Synthetic staplefibre Fats and oils Wadding and felt,rope as well as work thereof 04. Food products Carpet Meat and fish preparations Special textile tufted and embroidery Sugar Textile,technical articles of textile Cocoa Knitted and crocheted fabrics Cereal preparations Clothing of knitted and crocheted fabrics Vegetable preparations Other clothing Other food products Rags Beverages Feeding stuff for animals 12. Footwear, headgear and umbrellas Tobacco Footwear Headgear 05. Mineral products Umbrellas's and walking-stick Salt, sand stone and cement Feather, fluff and artificial flowers Metal-ore Petrochemical products 13. Works of stone, gypsum, cement, asbestos Works of stone, gypsum, cement 06. Chemical products Ceramic products Inorganic chemical products Glass and glassware Organic chemical products Pharmaceutical products 14. Real pearls (natural) and other precious stones Fertilizers Pearls, precious stones and coins Paint, Varnish and Ink Perfumery and cosmetic preparations Soap 15. Base metals and derivated works Albumen and glue Cast iron, iron and steel Gunpowder and explosives Works of cast iron, iron and steel Photographic equipment and supplies Copper Various chemistry Nickel Aluminum 07. Artificial plastic elements Magnesium, beryllium Plastic materials and (synthetic) resin Lead Rubber Zinc Tin 08. Skins,hides, leather and peltry Other base metals Hides, skins and leather Tools, utensils,cutlery and crochery Leather goods and traveling articles Works of base metals
38 Page 30 Foreign Trade Statistics Aruba, 1 st qtr, excluding only crude oil,kerosene,gasoline,gas,propane butane Harmonized Commodity Group Codes Classificaton by Sections and Categories 16. Machinery and (electrotechnical) equipment 19. Arms and ammunition (new & renewed) Arms and ammunition Reactoren,machinery and mechanical appliances Machines, electrical appliances 20. Various goods and products n.e.s Furniture, articles for lighting and 17. Transport equipment construction work Rolling stock Various works, brushware Cars, motorcycles and cycles Various works Aviation and space travel Navigation 18. Optical instruments, apparatus and equipment 21. Art-objects and collectors items including toys 2) Instruments Toys and games Clockwork Various works Musical instruments Art-objects Furniture to be removed 2) Previously toys were classified in Section 20
39
STATISTICAL TABLES REAL SECTOR SECOND QUARTER 2018 Last updated August 17, 2018
 CENTRALE BANK VAN ARUBA STATISTICAL TABLES REAL SECTOR SECOND QUARTER 2018 Last updated August 17, 2018 Contents 1 Real sector 1.1 Gross Domestic Product 1.2A Business Perception Results 1.2B Business
European Union, Trade in goods with Colombia
 Union, Trade in goods with Colombia Table of Contents pg Union, Trade with Colombia - Key Figures 2 - / 2015 2 - - AMA/NAMA product Groups 2 - - SITC product Groups 2 - - Top 5 - HS sections 2 - - Top
European Union, Trade in goods with Venezuela
 European Union, Trade in goods with Venezuela Table of Contents pg - Key Figures 2 - / 2017 2 - - AMA/NAMA product Groups 2 - - SITC product Groups 2 - - Top 5 - HS sections 2 - - Top 5 - SITC sections
European Union, Trade in goods with Central America 6
 European Union, Trade in goods with Central America 6 Central America 6 Costa Rica, El Salvador, Guatemala, Honduras, Nicaragua, Panama Table of Contents pg - Key Figures 2 - / 2017 2 - - AMA/NAMA product
European Union, Trade in goods with ACP - Caribbean Countries
 Union, Trade in goods with ACP - Caribbean Countries ACP - Caribbean Countries Antigua and Barbuda, Bahamas, Barbados, Belize, Cuba, Dominica, Dominican Republic, Grenada, Guyana, Haiti, Jamaica, St Kitts
European Union, Trade in goods with Panama
 Union, Trade in goods with Panama Table of Contents pg Union, Trade with Panama - Key Figures 2 - / 2015 2 - - AMA/NAMA product Groups 2 - - SITC product Groups 2 - - Top 5 - HS sections 2 - - Top 5 -
European Union, Trade in goods with Chile
 Union, Trade in goods with Chile Table of Contents pg Union, Trade with Chile - Key Figures 2 - / 2018 2 - - AMA/NAMA product Groups 2 - - SITC product Groups 2 - - Top 5 - HS sections 2 - - Top 5 - SITC
European Union, Trade in goods with Andean community 4
 European Union, Trade in goods with Andean community 4 Andean community 4 Bolivia, Colombia, Ecuador, Peru Table of Contents pg - Key Figures 2 - / 2017 2 - - AMA/NAMA product Groups 2 - - SITC product
European Union, Trade in goods with ACP - Caribbean Countries
 European Union, Trade in goods with ACP - Caribbean Countries ACP - Caribbean Countries Antigua and Barbuda, Bahamas, Barbados, Belize, Cuba, Dominica, Dominican Republic, Grenada, Guyana, Haiti, Jamaica,
, 2012 ARUBA. Contents. Available. 1 Real sector A 1.2B 1.6A 1.6B 1.7A 1.7B. 1.9 Utilities Oil refining
 CENTRALE C BANK B VAN ARUBA STATISTICAL TABLES Third QUARTER 2011 Last updated January 13, 2012 Contents 1 Real sector 1.1 Gross Domestic Product 1.2A Business Perception Results 1.2B Business Perception
European Union, Trade in goods with Peru
 European Union, Trade in goods with Peru Table of Contents pg - Key Figures 2 - / 2017 2 - - AMA/NAMA product Groups 2 - - SITC product Groups 2 - - Top 5 - HS sections 2 - - Top 5 - SITC sections 2 -
European Union, Trade in goods with Brazil
 European Union, Trade in goods with Brazil Table of Contents pg - Key Figures 2 - / 2017 2 - - AMA/NAMA product Groups 2 - - SITC product Groups 2 - - Top 5 - HS sections 2 - - Top 5 - SITC sections 2
European Union, Trade in goods with Israel
 Union, Trade in goods with Israel Table of Contents pg Union, Trade with Israel - Key Figures 2 - / 2017 2 - - AMA/NAMA product Groups 2 - - SITC product Groups 2 - - Top 5 - HS sections 2 - - Top 5 -
European Union, Trade in goods with Belarus
 Union, Trade in goods with Belarus Table of Contents pg Union, Trade with Belarus - Key Figures 2 - / 2017 2 - - AMA/NAMA product Groups 2 - - SITC product Groups 2 - - Top 5 - HS sections 2 - - Top 5
European Union, Trade in goods with Malaysia
 European Union, Trade in goods with Malaysia Table of Contents pg - Key Figures 2 - / 2017 2 - - AMA/NAMA product Groups 2 - - SITC product Groups 2 - - Top 5 - HS sections 2 - - Top 5 - SITC sections
MERCHANDISE TRADE STATISTICS 2009
 MERCHANDISE TRADE STATISTICS 2009 The content of this publication is intended for general information only. The aim of this publication is to provide While precaution is taken to ensure the accuracy of
European Union, Trade in goods with Tunisia
 European Union, Trade in goods with Tunisia Table of Contents pg - Key Figures 2 - / 2017 2 - - AMA/NAMA product Groups 2 - - SITC product Groups 2 - - Top 5 - HS sections 2 - - Top 5 - SITC sections 2
European Union, Trade in goods with Senegal
 European Union, Trade in goods with Senegal Table of Contents pg - Key Figures 2 - / 2017 2 - - AMA/NAMA product Groups 2 - - SITC product Groups 2 - - Top 5 - HS sections 2 - - Top 5 - SITC sections 2
European Union, Trade in goods with New Zealand
 Union, Trade in goods with New Zealand Table of Contents pg Union, Trade with New Zealand - Key Figures 2 - / 2018 2 - - AMA/NAMA product Groups 2 - - SITC product Groups 2 - - Top 5 - HS sections 2 -
Export Oriented Enterprises (EOE) 1st Quarter Introduction This issue of Economic and Social Indicators (ESI) presents the results of the
 1st Quarter Introduction This issue of Economic and Social Indicators (ESI) presents the results of the") Export Oriented Enterprises (EOE) 1st Quarter 2018 1. Introduction This issue of Economic and Social Indicators (ESI) presents the results of the Quarterly Survey of Employment among Export Oriented Enterprises
Export Oriented Enterprises (EOE) 1st Quarter 2018 1. Introduction This issue of Economic and Social Indicators (ESI) presents the results of the Quarterly Survey of Employment among Export Oriented Enterprises
European Union, Trade in goods with Kuwait
 European Union, Trade in goods with Kuwait Table of Contents pg - Key Figures 2 - / 2017 2 - - AMA/NAMA product Groups 2 - - SITC product Groups 2 - - Top 5 - HS sections 2 - - Top 5 - SITC sections 2
Export Oriented Enterprises (EOE) 3 rd Quarter Introduction This issue of Economic and Social Indicators (ESI) presents the results of the
 3 rd Quarter Introduction This issue of Economic and Social Indicators (ESI) presents the results of the") Export Oriented Enterprises (EOE) 3 rd Quarter 2017 1. Introduction This issue of Economic and Social Indicators (ESI) presents the results of the Quarterly Survey of Employment among Export Oriented Enterprises
Export Oriented Enterprises (EOE) 3 rd Quarter 2017 1. Introduction This issue of Economic and Social Indicators (ESI) presents the results of the Quarterly Survey of Employment among Export Oriented Enterprises
Export Oriented Enterprises (EOE) 2nd Quarter 2018
 2nd Quarter 2018") Export Oriented Enterprises (EOE) 2nd Quarter 2018 1. Introduction This issue of Economic and Social Indicators (ESI) presents the results of the Quarterly Survey of Employment among Export Oriented Enterprises
Export Oriented Enterprises (EOE) 2nd Quarter 2018 1. Introduction This issue of Economic and Social Indicators (ESI) presents the results of the Quarterly Survey of Employment among Export Oriented Enterprises
European Union, Trade in goods with Jordan
 European Union, Trade in goods with Jordan Table of Contents pg - Key Figures 2 - / 2017 2 - - AMA/NAMA product Groups 2 - - SITC product Groups 2 - - Top 5 - HS sections 2 - - Top 5 - SITC sections 2
External trade in goods of Montenegro January-December 2017 (p)
") Jan Feb Mar Apr May Jun Jul Aug Sep Oct Nov Dec MONTENEGRO STATISTICAL OFFICE R E L E A S E No: 7 Podgorica, January 25 th 2018 When using these data, please name the source External trade in goods of
Jan Feb Mar Apr May Jun Jul Aug Sep Oct Nov Dec MONTENEGRO STATISTICAL OFFICE R E L E A S E No: 7 Podgorica, January 25 th 2018 When using these data, please name the source External trade in goods of
HISTORICAL EXCHANGE RATES EUR/ZAR
 HISTORICAL EXCHANGE RATES EUR/ZAR PERIOD 2008 1 = 12,0332 2009 1 = 11,6559 2010 1 = 9,6906 2011 1 = 10,0643 2012 1 = 11,2739 SA IMPORTS FROM BELGIUM 1 Live animals, animal products. 67 872 609 2 Vegetable
Item
 332 Key Indicators of Developing Asian and Pacific Countries 333 001 POPULATION million; as of 1 July 47.72 48.71 49.68 50.64 51.58 52.51 53.43 54.33 55.21 55.84 56.57 57.29 58.01 58.71 59.40 60.00 60.60
Introductory text 225. Table 14.1 Goods Exports and Imports summary analysis 227. Table 14.2 Goods Exports by country of destination 228
 14 External Trade Exports for 2012 were 92,009m, up 1% from 2011, while Imports were 49,024m, up 1.5%. This resulted in a Trade surplus of 42,985m up marginally (0.2%) from 2011. Chemicals and related
Table 1: BALANCE OF TRADE - ALL ITEMS [US$000]
![Table 1: BALANCE OF TRADE - ALL ITEMS [US$000]](/thumbs/78/77194569.jpg "Table 1: BALANCE OF TRADE - ALL ITEMS [US$000]") Table 1: BALANCE OF TRADE ALL ITEMS [US$000] Exports FOB Imports CIF Trade Balance Period Domestic Reexports Total Canneries Government All others Total Surplus(+)/Deficit() 2004 424,625 3,231 427,855
Table 1: BALANCE OF TRADE ALL ITEMS [US$000] Exports FOB Imports CIF Trade Balance Period Domestic Reexports Total Canneries Government All others Total Surplus(+)/Deficit() 2004 424,625 3,231 427,855
Table 8. Gross Domestic Product by Industrial Origin at Current Market Prices, (Rp. Billion)
") Table 8. Gross Domestic Product by Industrial Origin at Current Market Prices, 1997-2003 1. Agriculture, Forestry & Fishery 101,009 172,828 215,687 217,898 246,298 281,325 76,693 74,437 77,305 a. Farm
Table 8. Gross Domestic Product by Industrial Origin at Current Market Prices, 1997-2003 1. Agriculture, Forestry & Fishery 101,009 172,828 215,687 217,898 246,298 281,325 76,693 74,437 77,305 a. Farm
Export Oriented Enterprises (EOE) 4 th Quarter Introduction This issue of Economic and Social Indicators (ESI) presents the results of the
 4 th Quarter Introduction This issue of Economic and Social Indicators (ESI) presents the results of the") Export Oriented Enterprises (EOE) 4 th Quarter 2017 1. Introduction This issue of Economic and Social Indicators (ESI) presents the results of the Quarterly Survey of Employment among Export Oriented Enterprises
Export Oriented Enterprises (EOE) 4 th Quarter 2017 1. Introduction This issue of Economic and Social Indicators (ESI) presents the results of the Quarterly Survey of Employment among Export Oriented Enterprises
Gross Domestic Product 2014 Q4
 REPUBLIC OF RWANDA NATIONAL INSTITUTE OF STATISTICS OF RWANDA P.O.Box 6139 KIGALI - RWANDA Gross Domestic Product 2014 Q4 March 2015 I. Gross Domestic Product and its structure In the fourth quarter of
STATISTICS BOTSWANA. BOTSWANA international MONTHLY DIGEST NOVEMBER No. 2014/01
 BOTSWANA international merchandise trade STATISTICS No. 2014/01 MONTHLY DIGEST STATISTICS BOTSWANA Copyrights C Statistics Botswana 2014 NOVEMBER 2013 Contact Statistician: Keanewa Mandoze Email: kmandoze@gov.bw
EXPORT-IMPORT BANK OF INDIA WORKING PAPER NO. 33
 EXPORT-IMPORT BANK OF INDIA WORKING PAPER NO. 33 Potential for Enhancing Trade with Korea Republic: A Brief Analysis EXIM Bank s Working Paper Series is an attempt to disseminate the findings of research
exports of goods annual change (%)
") 12.0 Austria s foreign trade 2015 by world region imports of goods 2015 exports of goods 2015 region 1 1 share (%) share (%) Europe 106,984 80.4 104,032 79.1 EU 93,686 70.4 90,841 69.1 EFTA 8,020 6.0 8,098
12.0 Austria s foreign trade 2015 by world region imports of goods 2015 exports of goods 2015 region 1 1 share (%) share (%) Europe 106,984 80.4 104,032 79.1 EU 93,686 70.4 90,841 69.1 EFTA 8,020 6.0 8,098
exports of goods annual change (%)
") 12.0 Austria s foreign trade 2016 by world region imports of goods 2016 exports of goods 2016 region 1 1 share (%) share (%) Europe 110,067 81.2 104,271 79.5 EU 96,801 71.4 91,112 69.4 EFTA 7,718 5.7 8,132
12.0 Austria s foreign trade 2016 by world region imports of goods 2016 exports of goods 2016 region 1 1 share (%) share (%) Europe 110,067 81.2 104,271 79.5 EU 96,801 71.4 91,112 69.4 EFTA 7,718 5.7 8,132
Summary of Key Issues
 Summary of Key Issues The Manufacturing Production Index (MPI) in April 2017 shrank by 1.7 percent from last month, but shrank by 0.5 percent from the same period of last year. The major shrinking industries
TRADE POLICY REVIEW MECHANISM. Communication from Hong Kong
 GENERAL AGREEMENT ON TARIFFS AND TRADE RESTRICTED 29 January 1992 Limited Distribution COUNCIL Original: English TRADE POLICY REVIEW MECHANISM Communication from Hong Kong In accordance with the requirements
Export Price Index in Iran Aban 1386 (October 23-November 21,2007) Monthly Report
 Monthly Report") Central Bank of the Islamic Republic of Iran General Directorate of Economic Statistics Export Price Index in Iran (October 23-November 21,2007) Monthly Report Economic Statistics Department Azar 1386
Central Bank of the Islamic Republic of Iran General Directorate of Economic Statistics Export Price Index in Iran (October 23-November 21,2007) Monthly Report Economic Statistics Department Azar 1386
Business and economy. Economic Profile 3rd Quarter of 2011
 Business and economy Economic Profile 3rd Quarter of 2011 1 Economic Profile 3rd Quarter of 2011 Statistics for progress www.cbs.aw COPYRIGHT RESERVED Use of the contents of this publication is allowed,
Business and economy. Economic Profile 2nd Quarter of 2011
 Business and economy Economic Profile 2nd Quarter of 2011 1 Economic Profile 2nd Quarter of 2011 Statistics for progress www.cbs.aw COPYRIGHT RESERVED Use of the contents of this publication is allowed,
QUARTERLY BULLETIN OF EXTERNAL TRADE STATISTICS
 QUARTERLY BULLETIN OF EXTERNAL TRADE STATISTICS P.O. Box CY342, Causeway, Harare Tel: (263-04) 706681/8 or (263-04) 703971/7 Fax: (263-04) 762494 E-mail: info@zimstat.co.zw Website: www.zimstat.co.zw Fourth
Trends in U.S. crude oil and petroleum product exports
 Trends in U.S. crude oil and petroleum product exports For ENERCOM Oil & Gas Conference August 21, 218 Denver, Colorado By T. Mason Hamilton, Petroleum Markets Analyst, Office of Energy Markets and Financial
*SECTION C. Trade of ASEAN and Korea
 *SECTION C Trade of ASEAN and Korea 034 C1. ASEAN and Korea's Exports (Million US $ %) Country/Region 1980 1990 2000 2008 2009 Annual Growth Rate 1) Value Share Value Share Value Share Value Share Value
Goods Exports and Imports
 An Phríomh-Oifig Staidrimh Central Statistics Office 14 June and Seasonally adjusted billion 9 Goods and il 2006 2007 2008 2009 2010 2011 Published by the Central Statistics Office, Ireland. Ardee Road
Goods Exports and Imports
 An Phríomh-Oifig Staidrimh Central Statistics Office 12 July and Seasonally adjusted billion 9 Goods and 8 7 6 5 4 3 2 ember January February March April million Surplus 6,734 3,774 2,959 6,849 3,982 2,867
FED ER AL RESERVE statistical release
 FED ER AL RESERVE statistical release -! ' (3.17 (419) For release at 9:15 a.m. (EDT) April 16, INDUSTRIAL PRODUCTION AND CAPACITY UTILIZATION Industrial production decreased 0.3 percent in March following
Statistical tables S 0. Money and banking. Capital market. National financial account. Public finance
 Statistical tables Money and banking Page S : Liabilities... 2 : Assets... 3 Corporation for Public Deposits: Liabilities... 4 Corporation for Public Deposits: Assets... 5 Banks: Liabilities... 6 7 Banks:
Goods Exports and Imports
 An Phríomh-Oifig Staidrimh Central Statistics Office 16 January 2014 and Seasonally adjusted billion 9 8 Goods and ember 2006 2007 2008 2009 2010 2011 Published by the Central Statistics Office, Ireland.
Goods Exports and Imports
 An Phríomh-Oifig Staidrimh Central Statistics Office 17 April v Seasonally adjusted billion 9 8 7 6 5 4 3 2 1 Goods and ruary million Surplus September 7,998 3,864 4,135 October November 7,680 8,329 3,935
CONSUMER PRICE INDEX (BASE PERIOD NOVEMBER 2009 = 100)
") CONSUMER PRICE INDEX (BASE PERIOD NOVEMBER 2009 = 100) No. 544 y 2015 StatisticalNews BRIEF METHODOLOGY: The CPI measures the over time in prices of goods and services consumed by people for day-to-day
CONSUMER PRICE INDEX (BASE PERIOD NOVEMBER 2009 = 100) No. 544 y 2015 StatisticalNews BRIEF METHODOLOGY: The CPI measures the over time in prices of goods and services consumed by people for day-to-day
FOREIGN TRADE. Finnish Trade in Figures
 FOREIGN TRADE 2007 Finnish Trade in Figures Statistical publications by the National Board of Customs (in Finnish and in Swedish, partly in English) Foreign trade of goods Volume 1, CD-ROM Annual publication
INDONESIA EXPORT AND IMPORT, APRIL 2017
 No. 48/05/Th.XX, May, 15 th INDONESIA EXPORT AND IMPORT, APRIL Table 1. FOB Value of Indonesian Exports (Million US $) and Percentage of Change ( %) % Share Jan Apr March Jan Apr y-on-y m-on-m Jan Apr
CONSUMER PRICE INDEX (BASE PERIOD NOVEMBER 2009 = 100)
") CONSUMER PRICE INDEX (BASE PERIOD NOVEMBER 2009 = 100) No. 537 DECEMBER 2014 BRIEF METHODOLOGY: The CPI measures the over time in prices of goods and services consumed by people for day-to-day living.
CONSUMER PRICE INDEX (BASE PERIOD NOVEMBER 2009 = 100) No. 537 DECEMBER 2014 BRIEF METHODOLOGY: The CPI measures the over time in prices of goods and services consumed by people for day-to-day living.
Consumer Price Index. November Consumer Price Index (CPI) November Contact Statistician: Phaladi Labobedi
 November Contact Statistician: Phaladi Labobedi") Consumer Price Index (CPI) November Consumer Price Index November Contact Statistician: Phaladi Labobedi Email: +267 3671300 November CPI 1 Published by STATISTICS BOTSWANA Private Bag 0024, Gaborone Tel:
Consumer Price Index (CPI) November Consumer Price Index November Contact Statistician: Phaladi Labobedi Email: +267 3671300 November CPI 1 Published by STATISTICS BOTSWANA Private Bag 0024, Gaborone Tel:
National accounts and balance of payments
 1. Danish economy 1998 to 2008 Figure 1 Real growth in GDP 4 3 2 1 0-1 -2 Per cent 98 00 02 04 06 08 For further information visit www.statbank.dk/nat02. Economic downturn in 2008 The economic growth was
BTM 3.0. Rossella Bardazzi Leonardo Ghezzi
 BTM 3.0 Rossella Bardazzi Leonardo Ghezzi XXIII World INFORUM conference Bangkok, 2015 OUTLINE OF THE PRESENTATION i) ii) iii) iv) Where do we come from? The INFORUM international system of models Main
Table 1 ANTIGUA AND BARBUDA: MAIN ECONOMIC INDICATORS
 Antigua Tables 2006 1 Main Indicators 03/11/2006 08:05 AM Table 1 ANTIGUA AND BARBUDA: MAIN ECONOMIC INDICATORS 1996 1997 1998 1999 2000 2001 2002 2003 2004 2005 a/ Annual growth rates b/ Gross domestic
Executive Summary. Exports to China: A key driver of US economic growth. China: An important market for US goods
 Executive Summary Exports to China: A key driver of US economic growth China continues to be an important contributor to US economic growth. In 2014, US exports to China totaled $120 billion, making it
Goods Exports and Imports
 An Phríomh-Oifig Staidrimh Central Statistics Office 13 February 2013 and 2007 2008 2009 2010 Published by the Central Statistics Office, Ireland. Ardee Road Dublin 6 Ireland Skehard Road Cork Ireland
As a result, the share of US in world industrial production should fall from 19.4% in 2012 to 18.5% by 2016 and decline to 17.6% by 2021.
 : Industry Overview GDP is expected to rise by 2.2% in 212 and expand by 2.1% in 213. Over the next 1 years to 221, GDP is predicted to grow on average by 2.8% a year. Manufacturing output growth is forecast
Introductory text 221. Table 14.1 Goods Exports and Imports summary analysis 223. Table 14.2 Goods Exports by country of destination 224
 14 External Trade Exports for 2011 were 92,936m, up 4% from 2010, while imports were 48,238m, up 5%. This resulted in a trade surplus of 44,697m (+3%), the highest annual surplus on record. The EU accounted
BRUNEI DARUSSALAM STATISTICAL APPENDIX. International Monetary Fund Washington, D.C. IMF Country Report No. 15/146. June 2015
 June 2015 IMF Country Report No. 15/146 BRUNEI DARUSSALAM STATISTICAL APPENDIX This Statistical Appendix on Brunei Darussalam was prepared by a staff team of the International Monetary Fund. It is based
Labor Productivity, Compensation Costs, and U.S. International Competitiveness
 Cornell University ILR School DigitalCommons@ILR Federal Publications Key Workplace Documents June 1993 Labor Productivity, Compensation Costs, and U.S. International Competitiveness U.S. Bureau of Labor
Statistical tables S 0. Money and banking. Capital market. National financial account. Public finance
 Statistical tables Money and banking Page S South African Reserve Bank: Liabilities... 2 South African Reserve Bank: Assets... 3 Corporation for Public Deposits: Liabilities... 4 Corporation for Public
INDONESIA Trade Note May 2006
 INDONESIA Trade Note May 2006 OVERVIEW OF INDONESIA S FOREIGN TRADE (2005 and Jan-Feb 2006) 1 Summary Overview Special Issues Reconciling International Trade Statistics New Regulations Trade Tables Annex
Mining and quarrying 13,503 19,062 26,170 35,190 38,511 53,515 74,386 85,792 99, ,422
 Table A1.1: Gross Domestic Product (GDP), at Factor Cost by kind of Economic Activity at Current Prices,Tanzania Mainland, 1992-2001 Millions of TZS Activity 1992 1993 1994 1995 1996 1997 1998 1999 2000
Money and banking. Flow of funds for the first quarter
 Statistical tables Money and banking Page S South African Reserve Bank: Liabilities... 2 South African Reserve Bank: Assets... 3 Corporation for Public Deposits: Liabilities... 4 Corporation for Public
A. EXPORTS. C/RM/G/2/Add.1. Page 1
 GENERAL AGREEMENT ON TARIFFS AND TRADE RESTRICTED 8 December 1989 Limited Distribution COUNCIL TRADE POLICY REVIEW MECHANISM REPORT BY THE GOVERNMENT OF THE KINGDOM OF MOROCCO Addendum DEVELOPMENTS IN
DONAUKOMMISSION * COMMISSION DU DANUBE * ДУНАЙСКАЯ КОМИССИЯ S T A T I S T I C S
 DONAUKOMMISSION * COMMISSION DU DANUBE * ДУНАЙСКАЯ КОМИССИЯ S T A T I S T I C S Statistics on navigation conditions on the Danube are published by the Danube Commission since 1963 and cover period from
DUBLIN PORT COMPANY PORT CHARGES GOODS. Operative: 1st January 2016
 DUBLIN PORT COMPANY PORT CHARGES ON GOODS Operative: 1st January 2016 GOODS RATES 1. The rates shown apply to all goods shipped, transhipped or unshipped. 2. Re-Exports In the case of Goods arriving at
Item
 Key Indicators for Asia and the Pacific 2010 POPULATION a Total population million; as of 1 July 18.17 18.55 18.93 19.33 19.73 20.14 20.56 20.99 21.42 21.87 22.32 22.79 23.30 23.82 24.36 24.91 25.47 26.04
Executive Summary International Trade Report. December 2018 MINISTRY OF INDUSTRY,TRADE AND TOURISM GOVERNMENT OF SPAIN
 Executive Summary International Trade Report December 2018 GOVERNMENT OF SPAIN MINISTRY OF INDUSTRY,TRADE AND TOURISM Report prepared by the Deputy Directorate-General for Studies andtrade Policy Evaluation.
I. World trade in Overview
 I. World trade in - Overview Table I.1 Growth in the volume of world merchandise exports and production, 2-5 (Annual percentage change) 2-5 23 24 World merchandise exports 4.5 5. 9.5 6. Agricultural products
one vision one identity one community
 2017 one vision one identity one community ASEAN Economic Community Chartbook 2017 The ASEAN Secretariat Jakarta The Association of Southeast Asian Nations (ASEAN) was established on 8 August 1967. The
Statistics Botswana CONSUMER PRICE INDEX - DECEMBER 2012
 Statistics Botswana Private Bag 0024, Gaborone, Botswana Tel: (267) 3671300, Fax (267) 3952201, Email: csobots@gov.bw, Website: www.cso.gov.bw All correspondence should be addressed to Statistician General
PREFACE. ... John Steytler STATISTICIAN - GENERAL NAMIBIA CONSUMER PRICE INDEX BULLETIN NOVEMBER
 PREFACE The Namibia Consumer Price Index (CPI) includes all Namibian private households living in urban and rural areas and is compiled by comparing the prices of the goods and services with the prices
Manitoba Economic Highlights
 Economic Overview Real Gross Domestic Product The Manitoba Bureau of Statistics estimates that Manitoba s real GDP grew 1.9% in 2016, above the national average of 1.4%. Manitoba s real GDP is expected
Money and banking. Flow of funds for the third quarter
 Statistical tables Money and banking Page S South African Reserve Bank: Liabilities... 2 South African Reserve Bank: Assets... 3 Corporation for Public Deposits: Liabilities... 4 Corporation for Public
Foreign trade: value and changes compared with previous year. Change in CHF mn and in % Period CHF mn Adjusted for working. unit CHF mn nominal
 Federal Department of Finance FDF Federal Customs Administration FCA Foreign Trade Statistics Press release Date: 3 February 2015 Swiss foreign trade Exports in 2014: new record Switzerland's goods exports
ASEAN International Merchandise Trade Statistics Yearbook 2014
 International Merchandise Trade Statistics Yearbook 2014 The Secretariat Jakarta The Association of Southeast Asian Nations () was established on 8 August 1967. The Member States of the Association are
BRUNEI DARUSSALAM. Copies of this report are available to the public from
 IMF Country Report No. 16/310 September 2016 BRUNEI DARUSSALAM STATISTICAL APPENDIX This Statistical Appendix on Brunei Darussalam was prepared by a staff team of the International Monetary Fund. It is
Item
 Key Indicators for Asia and the Pacific 2009 POPULATION Total population a thousand; as of 1 July 295 305 316 328 340 353 366 380 394 409 420 432 444 457 470 483 496 510 524 Population density persons
Annex 2 Petroleum Products Sales Questionnaire Definitions
 Annex 2 Petroleum Products Sales Questionnaire Definitions Definition of Fuels 1. Liquefied Petroleum Gas or LPG LPG refers to liquefied propane (C3H8) and butane (C4Hl0) or mixtures of both. Commercial
Monthly Report on the Corporate Goods Price Index ( Preliminary Figures for October 2014 )
") Research and Statistics Department Bank of Japan Report on the Corporate Goods Price The fell 0.8 percent from the previous. The index excluding extra charges for summer electricity fell 0.6 percent from
Research and Statistics Department Bank of Japan Report on the Corporate Goods Price The fell 0.8 percent from the previous. The index excluding extra charges for summer electricity fell 0.6 percent from
GCC EU BILATERAL TRADE AND TRADE WITH THE WORLD
 GCC EU BILATERAL TRADE AND TRADE WITH THE WORLD TRADE G.2 TOTAL MERCHANDISE TRADE, 2008-2012 1. Evolution of the EU's Trade Balance with Gcc 2. Evolution of the GCC's Trade Balance GEOGRAPHIC BREAKDOWN
For immediate release, Wednesday, December 15, 1954 ' " " "... "-;rr?a... December 15, 195*... : V.. ^ ' * ' - :_«iies»i*dbxbsawfagr
 w fuec-^ff FIL;>. '.... CEC 17 1954 BOARD OF GOVERNORS QPTBE FfiBBRti, RESERVE SYSTEM For immediate release, Wednesday, December 15, 1954 ' " " "... "-;rr?a..... December 15, 195*.... : V.. ^ ' * ' - :_«iies»i*dbxbsawfagr
Monthly Report on the Corporate Goods Price Index ( Preliminary Figures for June 2014 )
") Research and Statistics Department Bank of Japan Report on the Corporate Goods Price The Producer Price rose 0.2 percent from the previous. The Export Price (contract currency ) fell 0.1 percent from the
Research and Statistics Department Bank of Japan Report on the Corporate Goods Price The Producer Price rose 0.2 percent from the previous. The Export Price (contract currency ) fell 0.1 percent from the
Annual Report on National Accounts for 2015 (Benchmark Year Revision of 2011) Summary (Flow Accounts)
 Summary (Flow Accounts)") Annual Report on National Accounts for 2015 (Benchmark Year Revision of 2011) Summary (Flow Accounts) I. Overview of Benchmark Year Revision of 2011 P 2 II. Expenditure Series P 3 III. Income Series P
Annual Report on National Accounts for 2015 (Benchmark Year Revision of 2011) Summary (Flow Accounts) I. Overview of Benchmark Year Revision of 2011 P 2 II. Expenditure Series P 3 III. Income Series P
Revised July 17, 2017
 Revised July 17, 2017 ISM Manufacturing Purchasing Managers Index (June 2016 June 2017) 66 64 62 60 58 56 54 52 50 48 46 Jun-16 Jul Aug Sept Oct Nov Dec Jan-17 Feb Mar Apr May Jun Purchasing Managers'
Annual Oil Statistics
 Annual Oil Statistics Oil Questionnaire Overview Energy Statistics Training International Energy Agency Ana-Luisa Sao Marcos Annual Oil Statistician Share of oil in Total Primary Energy Supply share of
ROMANIA 49,9% 30,0 25,0 20,0 15,0 11,3 10,0 5,0 % OF THE WORLD * % OF EU TOTAL
 ROMANIA Population 21,6 Mio inhabitants Area 238 (1000qkm) Gross domestic product 2006 97 Bn euros -to-gdp ratio: 25,0 % in 2006 GDP per capita 2006 4.487 Euros (IMF, World Economic Outlook) 2003 2004
Federated States of Micronesia
 IMF Country Report No. 13/17 Federated States of Micronesia 2012 ARTICLE IV CONSULTATION 2012 Statistical Appendix January 29, 2001 January 29, 2001 This Statistical Appendix paper for the Federated States
Schedule of Accreditation issued by United Kingdom Accreditation Service 2 Pine Trees, Chertsey Lane, Staines-upon-Thames, TW18 3HR, UK
 2 Pine Trees, Chertsey Lane, Staines-upon-Thames, TW18 3HR, UK Accredited to ISO/IEC 17021-1:2015 to provide environmental Cobra Court 1 Blackmore Road Stretford Manchester M32 0QY Contact: Mr S Stubley
Monthly Report on the Corporate Goods Price Index ( Preliminary Figures for April 2014 )
") Research and Statistics Department Bank of Japan Report on the Corporate Goods Price The Domestic Corporate Goods Price rose 2.8 percent from the previous. The Export Price (contract currency ) fell 0.1
Research and Statistics Department Bank of Japan Report on the Corporate Goods Price The Domestic Corporate Goods Price rose 2.8 percent from the previous. The Export Price (contract currency ) fell 0.1
World Economic Overview. M. Fouquin, H. Guimbard, C. Herzog & D. Unal. December 2012
 1 Contents Presentation P Part one : Countries weight Part two : International Trade Trade in goods and services Trade in goods Trade in services Part three : Specialization Appendix Appendix 1 : Geographical
Statistics Botswana Consumer Price Index - JULY National Rates of Inflation, January 2011 July 2013
 COMMENTARY Section 1: Headline Inflation Section 2: Core Inflation CHARTS 1. National Rates of Inflation, January 2011 July 2013 2. Monthly Changes in the Cost-of-Living Index, January 2011 July 2013 3.
Monthly Report on the Corporate Goods Price Index ( Preliminary Figures for September 2017 )
") Research and Statistics Department Bank of Japan Report on the Corporate Goods Price Index The Producer Price Index rose 0.2 percent from the previous. The Export Price Index (contract currency ) rose
Research and Statistics Department Bank of Japan Report on the Corporate Goods Price Index The Producer Price Index rose 0.2 percent from the previous. The Export Price Index (contract currency ) rose
THE MACHINERY INDUSTRY OF JAPAN 2009
 00 2010 THE MACHINERY INDUSTRY OF JAPAN 2009 CONTENTS 1. Recent Trends in the Machinery Industry 1-1. Production Trends... 1 1-2. Foreign Trade... 1 2. The Importance of the Machinery Sector in Japanese
Monthly Report on the Corporate Goods Price Index ( Preliminary Figures for August 2014 )
") Research and Statistics Department Bank of Japan Report on the Corporate Goods Price The Producer Price fell 0.2 percent from the previous. The Export Price (contract currency ) rose 0.1 percent from the
Research and Statistics Department Bank of Japan Report on the Corporate Goods Price The Producer Price fell 0.2 percent from the previous. The Export Price (contract currency ) rose 0.1 percent from the