Madara Kupce POTENTIAL OF BIOGAS IN URBAN BUSES. Degree Programme in Environmental Engineering 2017
|
|
|
- Veronica Murphy
- 6 years ago
- Views:
Transcription

1 Madara Kupce POTENTIAL OF BIOGAS IN URBAN BUSES Degree Programme in Environmental Engineering 2017
2 POTENTIAL OF BIOGAS IN URBAN BUSES Kupce, Madara Satakunnan ammattikorkeakoulu, Satakunta University of Applied Sciences Degree Programme in Environmental Engineering May 2017 Supervisor: Sirén, Pekka Number of pages: 30 Appendices: 3 Keywords: biogas, biomethane, fuel, transportation, bus Abstract This Bachelor s thesis was carried out for Pori Environmental Agency with an aim to evaluate whether biomethane as a fuel would be a sustainable solution for public urban buses in Pori municipality. The study was conducted to overview the core aspects of potential biogas bus fleet implementation in city of Pori, considering basic infrastructural requirements, fuel source availability for biomethane production and the fuel demand of the fleet. Environmental aspects were considered by means of potential carbon emission cuts in case of replacing diesel fuel by biomethane.
3 CONTENTS INTRODUCTION Motivation of the study and objectives Reviewing previous research Use of buses in Europe Use of fuels BIOGAS AS A FUEL General Production of biogas Bio methane as a vehicle fuel Infrastructural requirements CNG station LNG station 15 3 PUBLIC BUS SERVICE IN PORI General Bus emission standards Theoretical fuel consumption Results on fuel consumption Carbon dioxide accounting methodology Factors considered and assumptions Results on CO2 emissions BIOGAS SOURCES IN PORI Source availability Raw materials for biogas production Method of biogas production estimation Results CONCLUSIONS REFERENCES APPENDICES
4 Terms and definitions NG LNG CNG LBG CBG AD GHG EEA ACAEA CO2 CO HC NOx IPCC VTT BOD VS SS Natural gas Liquefied natural gas Compressed natural gas Liquefied biogas Compressed biogas Anaerobic digestion Greenhouse gases European Environmental Agency European Association of Car Manufacturers Carbon dioxide Carbon monoxide Hydrocarbons Nitrogen oxides Intergovernmental Panel on Climate Change Technical Research Centre of Finland Biological Oxygen Demand Volatile solids Suspended solids
5 5 INTRODUCTION Energy security and environmental matters have nowadays caused a greater importance to research alternative fuels and sustainable transportation systems. The EU Renewable Energy Directive demands 20% share of its total energy demand to come from renewable energy sources by 2020 and cut the greenhouse gas emissions by 20% from 1990 levels. In 2016, the road transport accounted for 17% of total carbon dioxide emissions in Europe. However, a forecast projects an increase of mobility demand of 2.6 times the current level by Also changing consumer habits such as reduced commitment to ownership and interest of constantly staying online favor the use of public transportation (ACEA, 2016). There are several ways how transportation could be improved: smart transportation systems, alternative fuels, stimulated public transportation, efficient engines, design of cars, electric vehicles. Alternative fuels like biodiesel, biomethane, ethanol, hydrogen and electricity stored in batteries or fuel cells have already increased the importance due to depleting oil resources and stricter emission standards. 1.1 Motivation of the study and objectives The study was conducted for Satahima Towards a carbon neutral Satakunta project, carried out by Pori Environmental Agency to develop and promote carbon neutral activities and services in Satakunta region. The project was launched and it ends Satahima project has been funded by European Regional Development Fund and Satakuntaliitto. The use of biogas fuel in urban buses has been seen as a perfect solution to cut the emissions and improve the air quality in city environment, and support the local infrastructure and energy security. Sewage sludge and biowaste can be considered as an always present resource for biogas production that does not conflict the land use for the food production unlike some other types of biomass. This kind of utilization would reduce the amount of landfills and prevent there occurring methane and carbon dioxide emissions from entering the atmosphere.
6 6 The focus of this study was to estimate the potential demand of biomethane fuel equivalent to supply the energy need of local bus fleet in Pori. The available biogas resources (sewage sludge and biowaste) were reviewed to estimate the biomethane production rates and evaluate if they would meet the demand of fuel equivalent for the local bus fleet. Based on obtained results, it was possible to compute the potential carbon reductions in scenario if CBG buses substituted the current diesel buses of the Pori fleet. Chapter 2 consists of general overview of biogas characteristics, biomethane fuel applications and required infrastructural storage requirements. The study will mainly refer to current situation of the public transportation, potential biogas production and infrastructural requirements for biogas based fuel utilization in the city of Pori.

7 7 1.2 Reviewing previous research The study is supported by a combination of data obtained from different sources. However, some values had to be based on theoretical assumptions. Data on local bus fleet and buses in Chapter 3 was provided by Porin Linjat Oy, the biomethane production estimation in Chapter 4 was based on report compiled by Pöyry Oy. Theoretical assumptions on the average fuel consumption are based on data provided by city of Vaasa which has introduced 12 CNG fueled buses in the city fleet. Site visit to the city of Vaasa was organized to acquire information on the new CNG buses and familiarize with the biogas infrastructure. It was said that 12 buses can substitute liters of fossil diesel fuel every year and the carbon emissions are on the same level as the fully electric vehicles where electricity would come from the wind power. The capacity of Stormossen, the local biogas producer in Vaasa, utilized regional household waste and sludge waste from Vaasan Vesi, could supply 12 city buses and for about passenger cars, (Hällilä 2017). Figure 1. CNG bus in city of Vaasa at the slow filling station. Photo by the author.
, in EU-15 countries in total the use of buses has decreased rapidly by 17.4%.")
8 8 1.3 Use of buses in Europe Table 1 presents the data of bus uses in Europe (EU-15). While Finland has been increasing the number of buses (+2.2% from 2009 to 2014), in EU-15 countries in total the use of buses has decreased rapidly by 17.4%. The use of bus by country can be affected by many factors population density, price of the passenger car fuel, price, reliability and comfort of the bus service, price of other public transportation services (trains, trams, metro, etc.) Furthermore, table 1 does not present data as the number of buses in use per population neither as a share of total transportation vehicles, so the increase of bus use can be simply explained by population growth of area. For example, Italy in 2014 had around 8 times more buses in use than there were in Finland, but also the population was 12 times bigger. However, alternative fuel vehicles took up 1.8% of the total bus fleet. The figure was higher for the city buses 20% of those were using alternative fuels (ANFAC 2015). Table 1. Number of buses in use in EU-15 (ANFAC 2015) 1.4 Use of fuels According to the European Automobile Manufacturer s Association, the number of passenger cars in Finland has increased by 0.8% from 2009 to 2014, which is below the European average of 1% growth. However, most of the passenger cars are fueled on gasoline or diesel, leaving only 0.2% for alternative fuel vehicles (ANFAC 2015).
9 9 Finland has set goals to achieve 4.6% of road vehicles registered from 2012 to 2020 to methane fueled (Lampinen, 2012). Figure 2. Targets for road methane development in Finland until 2020, (Lampinen 2012).
10 10 2 BIOGAS AS A FUEL 2.1 General Biogas can be used to produce heat, utilized in fuel cells or as a vehicle fuel, or injected into natural gas grid. Each application requires gas treatment from impurities and possible other procedures, see figure 3. Regardless of financial feasibility, there are several obvious reasons for biogas production: it decreases dependency on fossil fuels, reduced emissions and landfills and improves local infrastructure, creates more jobs etc. BIOGAS DESULFURATION DESULFURATION GAS TREATMENT GAS TREATMENT REFORMING COMPRESSION BOILER CHP FUEL CELL PRESSURE TANK HEAT POWER HEAT POWER HEAT FUEL Figure 3. Different biogas processing methods and applications 2.2 Production of biogas Biogas is a result of anaerobic digestion of organic material, which can originate from plants or animals, sewage, landfills. Biogas should contain % of methane, the other share is taken by mixture of carbon dioxide (CO2), H2, H2O, NH3, H2S, O2, etc. The chemical composition and physical characteristics of biogas depends highly on the raw material origin and treatment process. Table 2 shows the difference of biogas chemical composition based on the raw material origin. The physical characteristics of biogas are based on its composition (table 3). Raw biogas from household waste produces 50% less energy by combustion compared to equal volume of natural gas.
 (PCI - lower heating value, PCS higher heating value) 2.")

11 11 Table 2. The chemical composition of biogas based on source (Website of Naskeo Environment 2009) Table 3. Physical characteristics of biogas and natural gas (Website of Naskeo Environment 2009) (PCI - lower heating value, PCS higher heating value) 2.3 Bio methane as a vehicle fuel Biogas was first adopted for vehicle fuel use in Germany in the 1930 s. There has been three main key development waves since: the Second World War, the 1970 s oil crisis, and the present day quest for sustainability. One of the alternatives offering complete crude oil in all forms of transport needs, is methane. Although it receives much less media attention than hydrogen and electric cars, it is the only alternative fuel, which has already proved that crude oil dependency can be broken, (Lampinen 2013).
12 12 Biogas by definition is a mixture of several gases obtained by anaerobic digestion of organic material. However, the chemical composition is based on the type of feedstock (table 3). The chemical and physical properties of natural gas and biomethane fuel are the same, the only difference is the fuel source origin, since natural gas is considered fossil but biomethane renewable. The useful part of the energy of biogas is the calorific value of its methane content. The other components of biogas rather absorb than create energy in combustion process. The complete combustion reaction of methane: CH4+2O2 = CO2 + 2H2O. Vehicle manufacturers state that vehicles can use either compressed natural gas or liquefied natural gas. Biomethane has a low volumetric calorific value so it has to be compressed or liquefied to be stored in vehicles, otherwise the vehicles would not receive the necessary energy content. The technical conditions for gas storing are discussed in Chapter 2.4.

13 Infrastructural requirements A reliable infrastructure is required in order to support the transition to biogas fueled vehicles. A stable supply of fuel as well as accessible filling stations are needed to support the transition to biomethane from diesel or gasoline. Currently (2017), there are 25 public biogas filling stations in Finland, located mostly in the southern part of the country (figure 4) and they are operated by 8 different operators. Fossil methane is also available in 21 of these biogas filling stations, and in 3 other stations. Most of the biomethane available at the filling stations originates from domestic biowaste. Figure 4. Map of existing CBG100 filling stations in Finland (Website of CBG ) CNG station Buses are usually fueled with CNG at time - fill stations during night time. Low pressure CNG is delivered to on site compressor, where gas is compressed to 200 to 250 bar pressure and directly filled to vehicle tanks. In difference to fast - fill stations,


14 14 vehicles are generally filled with gas from high pressure storage vessels (see figure 5). The purpose of buffer tank in figure 5 is to keep the compressor from turning off and on unnecessarily which would lead to wasting electricity and causing damage to the compressor. The size of the compressor depends on the demand of the compressed gas supply. The filling time of the vehicles can take from minutes to hours, depending on the compressor size, amount of vehicles and the amount of buffer storage (Website of Alternative Fuels Data Center 2017). Figure 5. Example of a time-fill CNG station configuration (Website of Alternative Fuels Data Center 2017) Figure 6. Example of a fast fill CNG station configuration (Website of Alternative Fuels Data Centre 2017)

15 15 Figure 7. CNG bus left for filling at station in city of Vaasa. Photo by the author LNG station LNG is natural gas stored as a super-cooled liquid typically between -120 and LNG has a high energy density comparable to other forms of methane, making it more suitable for heavy duty vehicles, extending the travel range and reducing refueling frequency. However, it is very energy intensive to store the natural gas at the required temperature. LNG has become more popular in the US, Japan, the UK and some countries in Europe for heavy duty applications. However, LNG has not been seen currently as a practical option for many developing countries. (Website of Alternative Fuels 2017) LNG filling stations (figure 8) are structured similarly to diesel and gasoline filling stations as the fuel is delivered in a liquid state. The dispenser delivers fuel to the vehicle tank at a pressure of 2 8 bar. Stations can be mobile, containerized or permanent with a greater storage capacity.

16 16 Figure 8. Example of a fast fill LNG station configuration (Website of Alternative Fuels Data Center 2017)

17 17 3 PUBLIC BUS SERVICE IN PORI 3.1 General The local bus service in Pori is divided in 40 bus lanes covering the city with additional routes to nearby towns. The service is operated by Porin Linjat Oy which holds ownership of 90% of the city lanes. The service of Porin Linjat is used by approximately customers on a daily basis. There are 50 buses serving the daily routes and the total length of the bus lanes is around 800 km. Buses are fueled by diesel and annually consuming liters of fuel. The average consumption of a bus is liters per 100 kilometers. The total annual mileage of the buses is around kilometers and around bus lane kilometers. Most of the buses are Scania brand, but there are a few Volvo, Man and Iveco buses (Valtanen 2017). Figure 9. Buses of Porin Linjat at maintenance. Photo by the author.
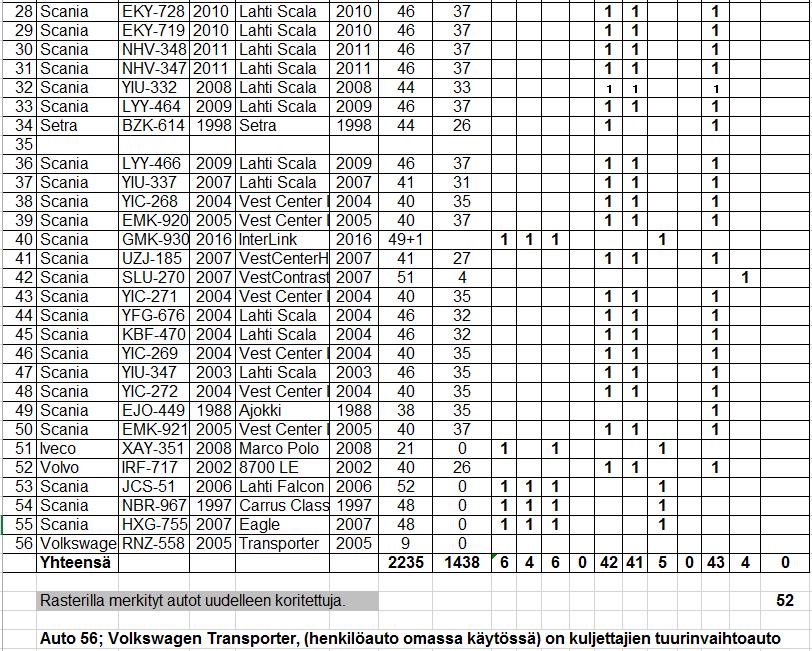
18 NUMBER OF BUSES Bus emission standards The emission regulation standards for heavy duty vehicles started in However, the Euro track started in 1992 strengthening the standards to be implemented in the next few years (Website of Transport Policy). Most of the buses in city comply with Euro III, IV and V emission standards (figure 10) which regulates the amount of CO, NOx, PM and HC in the exhaust gas. The CO2 exhaust emissions of vehicles are not regulated. More detailed information about the buses can be seen in appendix 1. Euro standards and number of buses Before Finland joined EU (before 1993) Euro ll Euro III Euro IV Euro V Euro VI since 2013/2014 STAGE Figure 10. Porin Linjat vehicles and corresponding Euro emission class based on bus registration year 3.3 Theoretical fuel consumption The actual fuel consumption and the emissions of the buses are affected by the characteristics of the journey (traffic and road conditions, number of stops) as well as the driving style, bus occupancy and technical conditions of the bus (Nylund 2007). The other important consideration here is the difference between the engine technology of diesel and CNG buses. By comparing the spark ignition engine (gas fuel) to compression ignition engine (diesel fuel) it has been found that diesel engines are substantially more efficient (Harvey 2010).
19 19 The method used for theoretical value of potential CNG consumption in Pori is based on the ratio of the performance of CNG buses in Vaasa and average diesel fuel consumption in Pori. Most of the data was obtained from Porin Linjat and Vaasa. Corresponding calculation and data explanation are found on appendix 2 and appendix 3. The average diesel consumption of Porin Linjat buses was recalculated neglecting vehicles that do not possess the typical characteristics of an urban passenger bus. The theoretical value of CNG consumption is computed by following equation: CNG (P) = CNG (V) x Diesel (P) / Diesel (V), where CNG (P) = Theoretical CNG consumption in the city of Pori (kg/100km); CNG (V) = Average CNG consumption in the city of Vaasa (kg/100km); Diesel (P) = Average diesel fuel consumption in the city of Pori (kg/100); Diesel (V) = Calculated value of diesel fuel consumption in the city of Vaasa (kg/100km). 3.4 Results on fuel consumption Based on obtained data and assumptions, the computation results (see appendix 3) show that the theoretical value of diesel equivalent for CNG bus in city of Pori would be approximately 38.2 kg of fuel per 100 km which would be by 35% more than current average diesel consumption based on fuel mass. The total CNG demand for the whole bus fleet would add up to kg annually. However, other test studies on fuel consumption conducted by VTT suggest that CNG buses consume on average 30% more energy than diesel buses (Nylund, Erkkilä, Clark & Rideout 2005). 3.5 Carbon dioxide accounting methodology The most extensive studies and calculations of the regulated traffic exhaust emissions (NOx, CO, PM, HC, SO2, CH4) in Finland are assessed by LIPASTO calculation system, which is developed by VTT. The results of software calculation are presented in unit of grams of emissions per kilometer per passenger (Website of VTT 2009).
20 20 In this study, the carbon dioxide emission calculations are based on the tier 1 methodology of IPCC 2006 Guidelines for National Greenhouse Gas Inventories which enables to evaluate carbon dioxide emissions based on the amount of fuel consumed. The aim was to compute the current carbon dioxide emissions of the bus fleet and compare the results to an equivalent bus fleet operated by CNG or CBG. In this case, the number of passengers is not relevant as the use of fuel would not affect the passenger amounts. The mass of carbon dioxide emissions is computed by following equation: Emission amount (CO2) = Fuel x SE x 44/12 x oxidizing factor, where Emission amount CO2 = t CO2 emissions (t); Fuel = amount of fuel used (TJ); SE = Special emissions of carbon (t C/TJ); 44/12=molar mass ratio of carbon dioxide and carbon. 3.6 Factors considered and assumptions The calorific value of diesel and CNG fuel and special emissions of carbon in table 4 were obtained from VTT. The other values, such as annual mileage and number of buses, are provided by Porin Linjat. The annual mileage is considered as distance travelled of lane kilometers plus the rest of the distance when bus is in operation but not on duty. The theoretical fuel consumption of CNG is explained in Chapter 3.4 and calculated in appendix 3. Emissions resulted from bio methane fuel combustion are assumed as 0 as the source of its production is renewable, even though in real life those are almost identical to carbon emissions resulted from natural gas combustion.
21 Results on CO2 emissions Table 4 presents the carbon dioxide emissions based on tier 1 methodology and assumptions explained in Chapters 3.5 and 3.6. Based on all assumptions, the results tell that if biomethane was substituted for diesel fuel, there would be around tonnes of savings for CO2 annually for total fleet, however natural gas equivalent would increase the CO2 emissions by 470 tonnes. Other studies where tested CNG consumption was 39 kg/100 km and 34 kg/100 km (41 l/100 km) of diesel, suggest that natural gas equivalent of urban bus fleet with similar annual mileage as Pori fleet would save around 100 tonnes of carbon dioxide emissions annually and tonnes if biomethane was used (Tonissoo 2012). Table 4. CO2 emissions computation of diesel, CNG, CBG fueled buses Calorifidation Fuel consumption Oxi- Carbon Carbon emission value factor emissions 1 bus All buses MJ/kg gc/mj l/100 km Kg/km g/co2/kg g/km t/yr t/yr Diesel Natural gas Bio methane Annual CO2 cuts if NG is used (t/yr): -470 Annual CO2 cuts if biomethane is used (t/yr): 2 672


22 22 4 BIOGAS SOURCES IN PORI 4.1 Source availability A research conducted in 2012 by Pöyry Finland Oy found that heat production from biogas is not economic, because it would exceed the need of district heating network, and additional capacity would not be required. Also bio methane production was found not viable because of no existing gas - powered vehicle fleet. However, it was mentioned that if the use of LNG increases in the region, biogas production should be reconsidered. In autumn 2016, Finland s first LNG terminal was constructed in port of Tahkoluoto, Pori. The facility is promoting the use of LNG for ships, contributing to the security of gas supply in Finland (Website of Hydrocarbons-technology). New LNG terminal would also support the transition of bio methane fuel utilization, meaning that the produced biogas could be injected in LNG grid as well as the new LNG source would serve as a back-up fuel in case if the demand for biomethane exceeds production rates. 4.2 Raw materials for biogas production Potential biogas sources in Pori Biowaste Sewage sludge 85% Envor Group Oy (bio digester in Forssa) Handling by Kemira Oy, treatment and deposition in landfill Figure 11. Biowaste and sewage sludge handling in city of Pori
23 23 Figure 11 presents current (2017) handling of biowaste and sewage sludge from Pori. Sludge from waste water is one of the potential raw material sources in city of Pori for biogas production. The biogas produced from sewage sludge typically contains 60 to 75% of methane gas. The waste water treatment is operated by Porin Vesi and the sludge treatment is handled by Kemira Oy before it is finally disposed into the landfill. In 2012, Pöyry Finland Oy assessed a scenario of biogas production from sludge after termination of the current contract. The daily flow rate of waste water, dried sludge, suspended solids and biological oxygen demand from 2011 to 2012 are shown in figure Sewage sludge Dried sludge kg ka/d Rate of sewage water Rate of BOD kg/d Rate of SS kg/d FCG 2011 scenario Actual Figure 12. FCG's (consulting company) predicted sludge production in 2011 versus the actual rate of return sludge (Pöyry, 2012) The other available source for biogas production in Pori is biowaste. Around 85% of biowaste produced in Pori is transported to a bio digester in Forssa, which is operated by waste company called Envor Group Oy. The amount of biowaste from city of Pori has increased from 2006 till 2011 from to tonnes (see figure 13). Both biowaste and sewage sludge are reliable sources for biogas production.
24 Mass of biowaste, tonnes Figure 13. Amount of biowaste (Pöyry, 2012)
25 Method of biogas production estimation The purpose of the potential biomethane production calculations was to evaluate if the produced amount of biomethane could supply the demand for CBG fleet in city of Pori. The computations of production are based on data of a previous study, presented in table 5 and table 6. The theoretical demand of CBG equivalent for the bus fleet is discussed in Chapter 3.4 and calculations are found in appendix 3. Table 5. Dimensioning of biogas production from sewage sludge (Pöyry 2012) BIOGAS PRODUCTION FROM SLUDGE Required reactor capacity, m Number of reactors 2 Capacity of one reactor, m Detention time, d 21 Organic load, kg VS/ m 3 d Summer 2.33 Winter 2.27 Specific gas yield, l CH 4 / kg VS in 300 Gas production rate, m 3 / h (CH 4 65%) 270 Gas energy output, kw VS Volatile solids Table 6. Dimensioning of biogas production from sewage sludge and biowaste (Pöyry 2012) BIOGAS PRODUCTION FROM SLUDGE AND BIOWASTE Required reactor capacity, m Number of reactors 2 Capacity of one reactor, m Detention time, d 21 Organic load, kg VS/ m 3 d Summer 2.50 Winter 2.43 Specific gas yield, l CH 4 / kg VS in, sludge 300 Specific gas yield, l CH 4 / kg VS in *, biowaste 430 Gas production rate, m 3 / h (CH 4 65%) 330 Gas energy output, kw VS Volatile solids
26 Results Table 7 presents a theoretical estimate of the biomethane production from waste water sludge and biowaste and the number of CNG buses that could be supplied with fuel. The estimated production of biomethane from sewage sludge and biowaste would supply the need of 59 buses, which is more than there are currently operating on daily service. Estimated biomethane production from sewage sludge alone could fuel 48 CNG buses which is almost the whole fleet. According to data presented in tables 5 and 6 the methane content of the produced biogas is 65% regardless if it is produced only from sewage sludge or from sewage sludge and biowaste. Table 7. Potential of CH4 production in city of Pori and number of CNG buses Nr. Material Generation of gas Generation Amount of Amount of gas CH 4 of CH 4 m 3 /h m 3 /d m 3 /d kg/d Nr of buses 1 Sludge and biowaste Sludge The number of buses was computed by following equation: Nr of buses = Amount of CH4 (kg/d) / CH4 consumption (kg/d/bus), CH4 consumption see appendix Nr of buses =( kg/d) / ( kg/d/bus) = 59 buses 2. Nr of buses = ( kg/d) / ( kg/d/bus) = 48 buses
27 27 Table 8 describes the number of buses that could be supplied with biomethane produced from sludge and biowaste and the corresponding annual carbon dioxide cuts. Biomethane produced from sludge could fuel up 48 buses and cut tonnes of carbon dioxide emissions annually. However, fuel produced from biowaste could fuel up 11 buses saving only 587 tonnes of carbon dioxide emissions on annual basis. Table 8 Potential of biomethane production in city of Pori and CO2 cuts Nr Material Generation of gas Generation of gas Amoun t of CH4 Amount of CH4 Nr of buses CO2 cuts (t/a) 1 m 3 /h m 3 /d m 3 /d kg/d Sludge and biowaste Sludge
28 28 5 CONCLUSIONS Generally, biomethane as a renewable vehicle fuel has a potential to reduce the fossil fuel dependency and improve the local air quality. Therefore it can be considered as a sustainable alternative to diesel fuel. In order to carry out transition to biomethane fuel in bus fleet, investment in infrastructural development is required. Apart from local biogas production and upgrading plant, filling stations would have to be installed as well as new buses would have to be purchased or leased. As for any investment, the fuel transition would have to be financially feasible. It was interesting to find out that the theoretical CNG consumption appeared to be about 35% higher than the average diesel equivalent based on fuel mass. This is so even though the calorific value of CNG is higher. This might indicate the efficiency differences between the gas and diesel engines. However, the calculated CNG consumption is theoretical. Exact consumption values can be obtained by performing reallife testing of CNG buses in the actual routes where buses are daily operating. Naturally the fuel consumption is also affected by the characteristics by the road conditions, traffic and driving style. However, the fuel consumption would be important to consider when assessing the financial feasibility. The results in chapter 4.4 show that there would be enough raw material for biomethane production to supply the fuel demand of the bus fleet in Pori. The total capacity of biomethane production could supply fuel for 59 buses, which is more than required. However, the biowaste from the city of Pori is already used for biogas production but not locally. The data of sewage sludge from waste water treatment and biowaste amounts are from 2012 and those values may have changed by now (2017). It is assumed that there has not been any dramatic change in waste water and biowaste production rates in past years, but in order to obtain more precise results, calculations should be based on updated values. It was estimated that the use of biomethane equivalent for entire bus fleet could reduce CO2 emissions by tonnes annually. However, the carbon calculation results are
29 29 based on fuel combustion reactions. Even though it is assumed that biofuels are carbon neutral, in real life the carbon dioxide emissions from biomethane and natural gas combustion would be almost identical. Based on theoretical assumptions in this study, equivalent amount of combusted diesel fuel for same travel distance would result to less emissions than those from natural gas or biomethane. It would be worth to study further the carbon footprint from biomethane production, transportation and storing to create more comprehensive understanding of the total environmental impact. Also it would be interesting to evaluate the emissions resulted by decomposition process of deposited sludge and biowaste in landfills.
30 30 REFERENCES ANFAC 2015: Vehicles in Use ( ). Referred: European Automobile Manufacturers Association 2016, Manifesto for Clean, Smart and Smart Mobility, Hällilä P., Presentation on biogas buses in city of Vaasa Harvey, D. D. L., 2010 Energy and the New Reality 1, Energy Efficiency and the demand for Energy Services. London: Earthscan. Page 264. Lampinen A., Roadmap to renewable methane economy. Page Lampinen A., Development of biogas technology systems for transport. Page 5. Nylund, N., Erkkilä, K., Clark N. & Rideout G., Buss Emission Evaluation: Summary Report. Page Pöyry Finland Oy, 2012 Porin Vesi. Luotsinmäen keskuspuhdistamon lietteenkäsittelyn ja energiakysymysten esiselvitys. Page 42-44, 54, 60. Tonissoo T, Feasibility study on the introduction and use of biogas buses in the Tartu City. Page Valtanen J., Data of Porin Linjat fleet. Sent: Referred Website of Alternative Fuels Data Center Referred Website of Alternative fuels, Referred Website of CBG Referred Website of Hydrocarbons-technology. Referred: Website of Naskeo Environment Referred Website of VTT Referred

31 APPENDIX 1 31
32 32 APPENDIX 2 Performance of the CNG buses in city of Vaasa and estimation diesel fuel equivalent. Given data: Average CNG consumption per 100 km 41 kg Number of CNG buses 12 Estimated substitution of diesel fuel l Estimated annual CNG consumption kg Used values: Specific weight of natural gas 0.72 kg/m 3 Specific weight of diesel fuel kg/l Calculated values: Consumption of diesel fuel l x kg/l kg Total fleet annual mileage kg CNG x 100 km /41 kgcng km Annual mileage per one bus km / 12 buses km Diesel consumption per 100 km kg Diesel/ km x 100 km kg Diesel consumption per 100km l Diesel / km x 100 km l
33 33 Average diesel consumption per 100 km for Porin Linjat Buses APPENDIX 3 Given data: Total annual mileage of buses: km Average annual mileage of a bus: km Average daily mileage of a bus: 165 km Buses in service on daily basis: 50 Total annual diesel consumption: l Average consumption per bus per 100km l New theoretical average diesel consumption per 100 km excluding vehicle 51 and 56 since they do not possess characteristics of a typical city bus. Annual mileage [km] Annual diesel consumption [l] All 51 buses Bus Bus Excl. 51, New average consumption [l/100 km]: Theoretical average bus CNG consumption in city of Pori per 100 km: CNG (P) = CNG (V) x Diesel (P) / Diesel (V); CNG (P) = 41 kg x l / l CNG (P) = kg Theoretical annual demand of CNG fuel for Porin Linjat buses: CNG (annual) = kg / 100 km x km = kg CNG (daily/bus) = kg x 164 km / 100 km = 62 kg
UNECE Gas Centre/ESCWA Conference
 UNECE Gas Centre/ESCWA Conference T L Fletcher BSc NGVA Europe Chairman 1 Natural Gas as a Vehicle Fuel Natural Gas is a clean burning, abundant fuel; In both compressed (CNG) and liquefied (LNG) form,
Volume 8, ISSN (Online), Published at:
, Published at:") CONTRIBUTION OF TRAFFIC TO ANNUAL AIR POLLUTION WITH NITROGEN DIOXIDE OVER STARA ZAGORA, BULGARIA Nikolay P. Takuchev Trakia University, Stara Zagora 6000, Bulgaria Abstract Introduction. Stara Zagora
CONTRIBUTION OF TRAFFIC TO ANNUAL AIR POLLUTION WITH NITROGEN DIOXIDE OVER STARA ZAGORA, BULGARIA Nikolay P. Takuchev Trakia University, Stara Zagora 6000, Bulgaria Abstract Introduction. Stara Zagora
Emerging Technologies
 UNESCAP UNHABITAT National Capacity Building Workshop on Sustainable and Inclusive Transport Development 3 4 July 2014, Vientiane, Lao PDR Abhijit Lokre Associate Professor Centre of Excellence in Urban
Environmental Analysis of Waste to Fuel Projects Well to Wheel.. Page: 1
 Environmental Analysis of Waste to Fuel Projects Well to Wheel.. Page: 1 How to look Technology at Well Comparison to Wheel Impacts Part Three Break down assessment into three segments, 1. Well (source
Evaluating opportunities for soot-free, low-carbon bus fleets in Brazil: São Paulo case study
 Evaluating opportunities for soot-free, low-carbon bus fleets in Brazil: São Paulo case study Tim Dallmann International seminar Electric mobility in public bus transport: Challenges, benefits, and opportunities
Quantification of GHGs Emissions from Industrial Sector in Mauritius
 1 International Conference on Environmental Science and Technology IPCBEE vol.3 (1) (1) IACSIT Press, Singapore Quantification of GHGs Emissions from Industrial Sector in Mauritius Dinesh Surroop* and
Gas natural Combustible alternativo para automoción
 Gas natural Combustible alternativo para automoción Ecoautomóvil. Marketing o realidad Aranjuez. 27 de julio de 2010 Manuel Lage, Dr. Eng. General Manager Madrid. Mayo 2010 1 Fuel road map Improvement
BIOFUELS IN POLAND STATUS QUO AND PERSPECTIVES
 BIOFUELS IN POLAND STATUS QUO AND PERSPECTIVES Long-term National Program for Biofuels Promotion in Poland Milos oslaw Kozak & Jerzy Merkisz Poznan University of Technology Main data on Poland: Location:
Natural gas/biomethane vehicles` potential: benefits and new infrastructure requirements
 Natural gas/biomethane vehicles` potential: benefits and new infrastructure requirements CARS 21. Public Hearing Brussels, 13th May 2011 Matthias Maedge EU Affairs Manager CARS 21, Public Hearing. Brussels,
Bus and coach transport for greening mobility
 Bus and coach transport for greening mobility Contribution to the European Bus and Coach Forum 2011 The great challenge of decarbonizing transport requires low-carbon technology and decoupling 120% EU-27
Business incentives Low carbon transition
 Clipore Final Conference Key Results 2004-2011 September 22, 2011 Business incentives Low carbon transition Future fuels and hybrids for heavy duty trucks Inge Horkeby Director Volvo Group Headquarters
Successfully switching to CNG buses in Verona
 Successfully switching to CNG buses in Verona (after 11 years) Antonio Piovesan Technical Manager ATV - Verona Athens, 01/03/2016 SUMMARY 1. 2. 3. 4. 5. 6. 7. 8. 9. 10. 11. CNG for heavy transport Pricing
Westport Innovations Inc.
 Energy & Environment Perspectives 2008 1 David Demers, CEO, Westport Innovations Inc. 2 Westport Innovations Inc. Recognized as the world leader in gaseous fuels technology (natural gas, hydrogen, LPG,
BIOGAS PRODUCTION ENHANCEMENT BY USING GLYCERINE AS CO SUBSTRATE
 BIOGAS PRODUCTION ENHANCEMENT BY USING GLYCERINE AS CO SUBSTRATE Rahul Raman 1, Rajneesh Kaushal 2 1 M.Tech. Scholar, Mech. Engg. Deptt. NIT Kurukshetra (India) 2 Assistant professor Mech. Engg. Deptt.NIT
Austria. Advanced Motor Fuels Statistics
 Austria Austria Drivers and Policies In December 2016, the national strategy framework Saubere Energie im Verkehr (Clean Energy in Transportation) 1 was introduced to the Ministerial Council by the Federal
Renewable Fuels: Overview of market developments in the US and a focus on California
 Renewable Fuels: Overview of market developments in the US and a focus on California Cynthia Obadia Cynthia Obadia Consulting Renewable fuel s growth driven by incentives from RFS and LCFS RFS - Federal
California Environmental Protection Agency. Air Resources Board. Low Carbon Fuel Standard (LCFS) Update 2015 CRC LCA of Transportation Fuels Workshop
 Update 2015 CRC LCA of Transportation Fuels Workshop") California Environmental Protection Agency Air Resources Board Low Carbon Fuel Standard (LCFS) Update 2015 CRC LCA of Transportation Fuels Workshop Anil Prabhu October 27-28, 2015 Overview of Presentation
California Environmental Protection Agency Air Resources Board Low Carbon Fuel Standard (LCFS) Update 2015 CRC LCA of Transportation Fuels Workshop Anil Prabhu October 27-28, 2015 Overview of Presentation
Low Emission Strategies Sussex-DEFRA Seminar, March 2011
 Low Emission Strategies Sussex-DEFRA Seminar, March 2011 Andrew Whittles Low Emission Strategies Programme Technical & Strategic Advisor AWhittles@lowemissionstrategies.org web: www.lowemissionstrategies.org
Examining the benefits of using bio-cng in urban bus operations
 Ryan and Caulfield 1 Examining the benefits of using bio-cng in urban bus operations Fearghal Ryan 1 Brian Caulfield 2 * 1 Engineering, Science & Technology Entrepreneurship University of Notre Dame 2
RNG Production for Vehicle Fuel. April 4, 2018
 RNG Production for Vehicle Fuel April 4, 2018 Forward-Looking Statements This presentation contains forward-looking statements within the meaning of Section 27A of the Securities Act of 1933 and Section
No reason to wait: Start the transition to renewable fuels now!
 PRESS info P07908EN / Per-Erik Nordström 5 September 2007 No reason to wait: Start the transition to renewable fuels now! Scania maintains its position that the transition to renewable fuels can and should
Operational eco-efficiency in Refineries
 Operational eco-efficiency in Refineries CONTENTS BACKGROUND 3 STRATEGIC APPROACH 3 RELEVANCE TO STAKEHOLDERS 4 ACTIONS AND MEASURES 5 RESULTS ACHIEVED 5 RESULTS ACHIEVED 5 ECONOMIC IMPACTS 7 SOCIAL IMPACTS
NGC Emissions Calculator Methodology (United Kingdom)
") NGC Emissions Calculator Methodology (United Kingdom) Version 2.1 September 2015 Next Green Car 2015 Next Green Car Limited Unit 62, Spike Island 133 Cumberland Road Bristol BS1 6UX, UK Next Green Car
NGC Emissions Calculator Methodology (United Kingdom) Version 2.1 September 2015 Next Green Car 2015 Next Green Car Limited Unit 62, Spike Island 133 Cumberland Road Bristol BS1 6UX, UK Next Green Car
ALTERNATIVE ENERGIES AND IMPACT ON STATION OF THE FUTURE. Edouard BOURDIN
 ALTERNATIVE ENERGIES AND IMPACT ON STATION OF THE FUTURE Edouard BOURDIN TRANSPORT TRANSPORT OTHER SECTORS OTHER SECTORS TRANSPORT REPRESENTS MORE THAN 50% OF OVERALL OIL DEMAND Total hypothesis Reference
BASELINE STUDY ON VEHICLE INVENTORY AND FUEL ECONOMY FOR MALAWI (KEY FINDINGS)
") BASELINE STUDY ON VEHICLE INVENTORY AND FUEL ECONOMY FOR MALAWI (KEY FINDINGS) TASK TEAM- LEAD INSTITUTION Ministry of Natural Resources, Energy and Mining Mount Soche Hotel, Blantyre. 11 th December 2017
BASELINE STUDY ON VEHICLE INVENTORY AND FUEL ECONOMY FOR MALAWI (KEY FINDINGS) TASK TEAM- LEAD INSTITUTION Ministry of Natural Resources, Energy and Mining Mount Soche Hotel, Blantyre. 11 th December 2017
CNG as a Transport Fuel - Economic Benefits 17 th November 2011
 CNG as a Transport Fuel - Economic Benefits 17 th November 2011 6 Grand Canal Wharf, South Dock Road, Ringsend, Dublin 4, Ireland. Tel: +353 1 6670372 Fax: +353 1 6144499 Web: www.dkm.ie Our scope of work
Riccardo Enei «The coach of the future study : preliminary results» IRU Conference
 Riccardo Enei «The coach of the future study : preliminary results» IRU Conference - 20.10.2017 Introduction to the presentation Presentation of the preliminary conclusions of the study Need to validate
Natural Gas & Biomethane. The alternative to oil derived fuels CNG and L-CNG filling stations infrastructure
 Natural Gas & Biomethane. The alternative to oil derived fuels CNG and L-CNG filling stations infrastructure CARS 21. Working Group 1 Brussels, 28th April 2011 Manuel Lage General Manager CARS 21, WG-1.
A comparison of the impacts of Euro 6 diesel passenger cars and zero-emission vehicles on urban air quality compliance
 A comparison of the impacts of Euro 6 diesel passenger cars and zero-emission vehicles on urban air quality compliance Introduction A Concawe study aims to determine how real-driving emissions from the
Decarbonisation of transportthe Finnish case
 Decarbonisation of transportthe Finnish case ETIP Bioenergy 8th Stakeholder Plenary Meeting 11-12.4.2018 Nils-Olof Nylund, Senior Advisor VTT Technical Research Centre of Finland EU level energy and climate
BIOFUELS AND OTHER ALTERNATIVE FUELS IN ROAD TRANSPORT
 27 February 2012 1 BIOFUELS AND OTHER ALTERNATIVE FUELS IN ROAD TRANSPORT Summary by Adviser Harri Kallberg from Tieliikenteen Tietokeskus Why is there a demand for biofuels in road transport, even though
Agreement with Enbridge for the Installation of Compressed Natural Gas Refuelling Stations at City Facilities
 PW9.3 STAFF REPORT ACTION REQUIRED Agreement with Enbridge for the Installation of Compressed Natural Gas Refuelling Stations at City Facilities Date: October 20, 2015 To: From: Wards: Reference Number:
FUEL ECONOMY BASELINE AND TRENDS- MALAWI INSTITUTIONS
 FUEL ECONOMY BASELINE AND TRENDS- MALAWI INSTITUTIONS Ministry of Natural Resources, Energy and Mining; Ministry of Transport and Public Works; University of Malawi; National Commission for Science and
Curbing emissions and energy consumption in the transport sector how can we deal with it in Warsaw 2012 Annual POLIS Conference
 Curbing emissions and energy consumption in the transport sector how can we deal with it in Warsaw 2012 Annual POLIS Conference Perugia, 29 30 November 2012 1 Covenant of Mayors (under the auspices of
Routes to sustainable transportation system light duty vehicles
 Light-duty vehicles IEA AMF & Bioenergy Joint Workshop Infrastructure Compatible Transport Fuels Copenhagen 20.5.2014 Jukka Nuottimäki VTT Technical Research Centre of Finland Contents Drivers for fuel
Proportion of the vehicle fleet meeting certain emission standards
 The rate of penetration of new technologies is highly correlated with the average life-time of vehicles and the average age of the fleet. Estimates based on the numbers of cars fitted with catalytic converter
Study on Performance and Exhaust Gas. Characteristics When Biogas is Used for CNG. Converted Gasoline Passenger Vehicle
 Contemporary Engineering Sciences, Vol. 7, 214, no. 23, 1253-1259 HIKARI Ltd, www.m-hikari.com http://dx.doi.org/1.12988/ces.214.49155 Study on Performance and Exhaust Characteristics When Biogas is Used
Clean vehicles & fuels in the EU
 19/07/2011 Clean vehicles & fuels in the EU CIVITAS Conference, San Sebastian, 15th of June 2011 Content» VITO» State of the Art» Current & future share of fuels» EU Strategy on Clean Vehicles» Other EU
AALTO UNIVERSITY SCHOOL OF CHEMICAL TECHNOLOGY KE Introduction to biorefineries and biofuels
 AALTO UNIVERSITY SCHOOL OF CHEMICAL TECHNOLOGY KE-40.4120 Introduction to biorefineries and biofuels Assignment 11: Comparison of biofuels vs. fossil fuels Aino Siirala 309141 Assignment submitted 8.12.2013
NATURAL GAS INFRASTRUCTURE LOCITY GAS-POWERED VEHICLE ROADSHOW
 Infrastructure Rob Wood CEO Gasrec NATURAL GAS INFRASTRUCTURE LOCITY GAS-POWERED VEHICLE ROADSHOW Why you should consider natural gas... because its cleaner and cheaper than diesel Lower fuel cost 50%
CAT CG170. Series Gas Generator Sets
 CAT CG170 Series Gas Generator Sets CAT CG170 SMARTER ENERGY SOLUTIONS COMMERCIAL AND INDUSTRIAL FACILITIES Facilities such as manufacturing plants, resorts, shopping centers, office or residential buildings,
Fuels Roadmap for 2020 and beyond - implications for future strategy
 Fuels Roadmap for 2020 and beyond - implications for future strategy Celine Cluzel Principal Consultant Element Energy Jonathan Murray Policy and Operations Director Low Carbon Vehicle Partnership LowCVP
Taking Action on Climate Change. AVL PDiM 2018 Teemu Sarjovaara - Head of R&D, Products and applications
 Taking Action on Climate Change AVL PDiM 2018 Teemu Sarjovaara - Head of R&D, Products and applications Our journey from an oil refining company to the world s largest provider of renewable diesel 1948
Standardization of biomethane as automotive fuel
 Standardization of biomethane as automotive fuel Jaime del Álamo Technical Manager NGVA Europe GGG Workshop. Development of Legislation, Injection and Trade Paris, 5 th March 2013 5 th March 2013 GGG Workshop.
Efficiency and Alternative Fuels Natural Gas: Options for Municipal Fleets Alicia Milner Canadian Natural Gas Vehicle Alliance
 Efficiency and Alternative Fuels Natural Gas: Options for Municipal Fleets Alicia Milner Canadian Natural Gas Vehicle Alliance February 21, 2008 Presentation Overview 2 Why consider natural gas for your
Dual-Fuel TM Technology
 Dual-Fuel TM Technology Dual-Fuel tm Technology Genesis-EDGE Aftermarket Vehicle System The Genesis-EDGE system was developed specifically to be an 100% Diesel Fallback after market product which can be
CONPONENT 3 REGIONAL STUDY OF SUSTAINABLE MOBILITY
 CONPONENT 3 REGIONAL STUDY OF SUSTAINABLE MOBILITY THEMATIC: BIO-FUELS REGION: SMÅLAND (SWEDEN) BEST PRACTICE 1 BIOGASMACK I OSKARSHAMN. DATA COMPILATION TEMPLATE Identifying data of the practice: Name
AUDI SUSTAINABILITY PROGRAM
 Audi Sustainability Report 2017 1 AUDI SUSTAINABILITY PROGRAM The Audi Sustainability Program combines strategic goals in the area of sustainability with concrete measures. It is divided into the four
Carbon Neutral Fuels for efficient ICE: an alternative towards Green Mobility
 Carbon Neutral Fuels for efficient ICE: an alternative towards Green Mobility Dario Sacco FCA Italy Powertrain Engineering Head of Powertrain Research and Technology (CRF) ICE 2017 13 th International
An overview of national, international and state low carbon fuel policies
 An overview of national, international and state low carbon fuel policies Dr. Chris Malins Packard grantees meeting, June 2015 Context: The market for liquid fuels World Energy Council, 2013 2050 symphony
FENEBUS POSITION PAPER ON REDUCING CO2 EMISSIONS FROM ROAD VEHICLES
 FENEBUS POSITION PAPER ON REDUCING CO2 EMISSIONS FROM ROAD VEHICLES The Spanish Federation of Transport by Bus (Fenebús) is aware of the importance of the environmental issues in order to fully achieve
FUEL CELL BUSES - AN UPHILL ROAD TO SUCCESS
 FUEL CELL BUSES - AN UPHILL ROAD TO SUCCESS LONDON, 30 NOVEMBER 2016 PAUL JENNE LIMITS TO THE ENVIRONMENT Air pollution causes substantial environment and health impacts (2013) : 330-940bn including 4bn
INTERNATIONATIONAL CONFERENCE BIOENERGY POLICY IMPLEMENTATION IN AFRICA. Fringilla, Lusaka 26 th -28th May 2009
 Centre for Energy Environment and Engineering Zambia CEEEZ INTERNATIONATIONAL CONFERENCE BIOENERGY POLICY IMPLEMENTATION IN AFRICA Fringilla, Lusaka 26 th -28th May 2009 INTEGRATED APPROACH FOR WELL INFORMED
Energy Independence. tcbiomass 2013 The Path to Commercialization of Drop-in Cellulosic Transportation Fuels. Rural America Revitalization
 Energy Independence The Path to Commercialization of Drop-in Cellulosic Transportation Fuels Rural America Revitalization Forward Looking Statements These slides and the accompanying oral presentation
Trends on Fuels and Lubricants for supporting Thailand Low Carbon Society by ARUNRATT WUTTIMONGKOLCHAI PTT Public Company Limited, Thailand
 Trends on Fuels and Lubricants for supporting Thailand Low Carbon Society by 2030 ARUNRATT WUTTIMONGKOLCHAI PTT Public Company Limited, Thailand PTT RTI Disclaimer -------------------------------------------------------------------------------------------------
Transit Vehicle (Trolley) Technology Review
 Technology Review") Transit Vehicle (Trolley) Technology Review Recommendation: 1. That the trolley system be phased out in 2009 and 2010. 2. That the purchase of 47 new hybrid buses to be received in 2010 be approved with
Transit Vehicle (Trolley) Technology Review Recommendation: 1. That the trolley system be phased out in 2009 and 2010. 2. That the purchase of 47 new hybrid buses to be received in 2010 be approved with
Learning Resources. Part I: Electric Vehicles
 Learning Resources Part I: Electric Vehicles Clean Vehicle Options More information @ Clean Fleets The suitability and technological readiness of the different fuel options varies by vehicle type and field
Martin Flach Alternative Fuels Director UK and ROI
 Martin Flach Alternative Fuels Director UK and ROI Natural Power Vehicles: A manufacturers perspective Dieselgate 6 London ULEZ - 2019 By 2025. Paris, Madrid and Athens want to ban Diesel vehicles in
Toyota s s 5 year Environmental Action Plans: a case study
 Toyota s s 5 year Environmental Action Plans: a case study Environmental Preservation is a valid business case Miltos Tsoskounoglou/Toyota Hellas 1 The environmental challenges facing automakers Miltos
(2) An engine subject to this rule or specifically exempt by Subsection (b)(1) of this rule shall not be subject to Rule 68.
 An engine subject to this rule or specifically exempt by Subsection (b)(1) of this rule shall not be subject to Rule 68.") RULE 69.4. STATIONARY RECIPROCATING INTERNAL COMBUSTION ENGINES - REASONABLY AVAILABLE CONTROL TECHNOLOGY (Adopted 9/27/94; Rev. Effective11/15/00; Rev. Effective 7/30/03) (a) APPLICABILITY (1) Except
RULE 69.4. STATIONARY RECIPROCATING INTERNAL COMBUSTION ENGINES - REASONABLY AVAILABLE CONTROL TECHNOLOGY (Adopted 9/27/94; Rev. Effective11/15/00; Rev. Effective 7/30/03) (a) APPLICABILITY (1) Except
LNG: Legal and regulatory framework. Canepa Monica World Maritime University
 LNG: Legal and regulatory framework Canepa Monica World Maritime University Source: Verisk Maplecroft AIR QUALITY INDEX 2017 Policies and legal instruments for clean energy to support LNG GLOBAL REGIONAL
Paving the way for Renewable Power-to-Gas (P2G) The case of non-individual transport
 The case of non-individual transport") Paving the way for Renewable Power-to-Gas (P2G) The case of non-individual transport David de Jager Operating Agent IEA RETD TCP Revitalising local economies with renewable energy Koriyama-city, Fukushima,
Paving the way for Renewable Power-to-Gas (P2G) The case of non-individual transport David de Jager Operating Agent IEA RETD TCP Revitalising local economies with renewable energy Koriyama-city, Fukushima,
Presented by: T L Fletcher, BSc 17 th April IEA Task 37 UK
 Presented by: T L Fletcher, BSc 17 th April 2008 IEA Task 37 UK Focusing on Gas The times are changing in our quest to reduce CO 2 emissions HARDSTAFF are the most prominent producer and long term participants
Criterias for August 2014 Procurement of small vehicles for municipal cleaning
 Criterias for 05003 19. August 2014 Procurement of small vehicles for municipal cleaning Procurement of small vehicles for municipal cleaning (05003/19.08.2014) 1. Introduction Important objectives regarding
FOR YOUR BUSINESS CONTENTS TCO2 CHAMPION BEST-IN-CLASS POWER BEST-IN-CLASS FUEL RANGE
 NEW NEW NP There is a turning point in any technology when it breaks the barrier of economic payback. There is also a turnaround product that marks that very point and in the case of natural gas, this
SPP TENDER MODEL. Electric buses. 20 Electric buses for Stolichen Avtotransport
 SPP TENDER MODEL Electric buses 20 Electric buses for Stolichen Avtotransport Purchasing body: Contract: Savings: Stolichen Avtotrasnsport EAD Lease of 20 new electric buses and charging infrastructure
Land Transport Demand Analysis and Energy Saving Potentials in Thailand
 Land Transport Demand Analysis and Energy Saving Potentials in Thailand Jakapong Pongthanaisawan 1, Chumnong Sorapipatana 1 and Bundit Limmeechokchai 2,* 1 The Joint Graduate School of Energy and Environment,
Biomethane comparison with other biofuels. Dominic Scholfield. Global Biomethane Congress October 2012
 Biomethane comparison with other biofuels Dominic Scholfield Global Biomethane Congress October 2012 Mint Green Sustainability Freight GHG accounting Alternative fuel vehicle trial design and analysis
Monitoring the CO 2 emissions from new passenger cars in the EU: summary of data for 2010
 Monitoring the CO 2 emissions from new passenger cars in the EU: summary of data for 2010 EXECUTIVE SUMMARY EEA has collected data submitted by Member States on vehicle registrations in the year 2010,
Outline. International Experience in Improving Fuel Efficiency and Reducing Greenhouse Gases. World Transport Vehicle CO2 Emissions By Mode
 International Experience in Improving Fuel Efficiency and Reducing Greenhouse Gases Workshop on Fuel Efficiency Opportunities in São Paulo December, 4 Outline Vehicles Are Important Countries Have Different
BIOFUELS IMPLEMENTATION - LEAP TO 2nd GENERATION BIOFUELS IN FINLAND
 BIOFUELS IMPLEMENTATION - LEAP TO 2nd GENERATION BIOFUELS IN FINLAND Kai Sipilä, VTT - Finland 25 % market penetration of biofuels in 23 EC Biofuels Directive 5.75 % in 21 General trends in Europe Implementation
How to Double Your Dollars for Biogas. MWEA Annual Conference June 19, 2017 David Wrightsman, P.E. Energy Systems Group
 How to Double Your Dollars for Biogas MWEA Annual Conference June 19, 2017 David Wrightsman, P.E. Energy Systems Group Agenda Renewable Natural Gas Renewable Fuel Standard Define Renewable Identification
MARINTEK The Norwegian Marine Technology Research Institute
 MARINTEK The Norwegian Marine Technology Research Institute Ocean laboratory to test out offshore construction and vessel concepts 50 x 80 meter Towing tank 260 meter Engine laboratory Raiser laboratory
Cars and vans CO2 regulations: even ambitious EU standards deliver less than half transport emission reductions needed to meet 2030 climate targets
 Cars and vans CO2 regulations: even ambitious EU standards deliver less than half transport emission reductions needed to meet 2030 climate targets October 2017 Summary Road transport is one of the few
Emission Reduction Technologies towards zero emissions
 Emission Reduction Technologies towards zero emissions 12.10.2018 Heikki Korpi, Chief expert, Environmental expertise Marine Solutions, R&D and Engineering THIS IS WÄRTSILÄ Our business areas SERVICES
Sustainable biofuels and bioliquids 2013
 Sustainable biofuels and bioliquids 2013 Sustainable biofuels The sustainability criteria for biofuels aim to reduce greenhouse gas (GHG) emissions and ensure that no areas with high biological values
Biofuels: The Motor Industry Perspective. Biofuels: Technology meets strategy The Society of Chemical Industry London 20 May 2008
 Biofuels: The Motor Industry Perspective Biofuels: Technology meets strategy The Society of Chemical Industry London 20 May 2008 Presented by: David Lemon Introduction The introduction of biofuels for
DECARBONISATION OF THE TRANSPORT SECTOR CONSIDERING GLOBAL LEARNING AND FLEXIBILITY POTENTIAL FOR THE ELECTRICITY SYSTEM
 DECARBONISATION OF THE TRANSPORT SECTOR CONSIDERING GLOBAL LEARNING AND FLEXIBILITY POTENTIAL FOR THE ELECTRICITY SYSTEM Stephanie Heitel, Dr. Michael Krail - Fraunhofer ISI Katrin Seddig, Dr. Patrick
Environmental and EnergyStrategies for Freight Transport. Dipl.-Ing. Håkan Samuelsson, Chairman of the MAN Nutzfahrzeuge Gruppe
 Environmental and EnergyStrategies for Freight Transport Dipl.-Ing. Håkan Samuelsson, Chairman of the MAN Nutzfahrzeuge Group MAN Nutzfahrzeuge Gruppe FS-MN 30.06.2004 < > Growing freight traffic Expansion
LIFE 03 ENV /S/ August 2006 CLEANOWA. electric-hybrid technology for more environment-friendly waste collection
 LIFE 03 ENV /S/000592 August 2006 CLEANOWA electric-hybrid technology for more environment-friendly waste collection With funding from the EU s Environment Fund Life and in close cooperation with the Committee
Charging Electric Vehicles in the Hanover Region: Toolbased Scenario Analyses. Bachelorarbeit
 Charging Electric Vehicles in the Hanover Region: Toolbased Scenario Analyses Bachelorarbeit zur Erlangung des akademischen Grades Bachelor of Science (B. Sc.) im Studiengang Wirtschaftsingenieur der Fakultät
Road Map for Sustainable Transport Strategy for Colombo Metropolitan Region with Cleaner Air, through Experience
 Workshop on Air Quality and Environmentally Sustainable Transport April 28 th 2011 Don S. Jayaweera Road Map for Sustainable Transport Strategy for Colombo Metropolitan Region with Cleaner Air, through
1 Faculty advisor: Roland Geyer
 Reducing Greenhouse Gas Emissions with Hybrid-Electric Vehicles: An Environmental and Economic Analysis By: Kristina Estudillo, Jonathan Koehn, Catherine Levy, Tim Olsen, and Christopher Taylor 1 Introduction
SUSTAINALBE URBAN MOBILITY PLAN A STRATEGY FOR ELECTRO-MOBILITY IN THE CITY MUNICIPALITY OF LJUBLJANA
 SUSTAINALBE URBAN MOBILITY PLAN A STRATEGY FOR ELECTRO-MOBILITY IN THE CITY MUNICIPALITY OF LJUBLJANA Irena Razpotnik, univ.dipl.ing.str.,univ.dipl.ekon. Mestna občina Ljubljana, Mayor s office, Mestni
Austrian Energy Agency
 Austrian Energy Agency Biomethane & 10% RES in transport RED target Herbert Tretter 13.06.2013, GreenGasGrids Info Day, Bratislava Austrian Energy Agency 20/06/13 Seite 1 Overview EU Studies Proposed EU
Smart, subservient low-carbon public transport. Suvi Rihtniemi
 Smart, subservient low-carbon public transport Suvi Rihtniemi 16.2.2017 1 Esittäjän nimi 17.2.2017 Strategy info action GOALS Smoot journeys Customers travel chain is based on the public transport trunk
Energy Saving Potential Study on Thailand s Road Sector:
 A n n e x 1 Energy Saving Potential Study on Thailand s Road Sector: Applying Thailand s Transport Model SUPIT PADPREM, DIRECTOR OF ENERGY ANALYSIS AND FORECAST GROUP, ENERGY POLICY AND PLANNING OFFICE
NGC Emissions Calculator Methodology (United Kingdom)
") NGC Emissions Calculator Methodology (United Kingdom) Version 2.3 November 2016 Next Green Car 2016 Next Green Car Limited Unit 66, Spike Island 133 Cumberland Road Bristol BS1 6UX, UK Next Green Car Limited
NGC Emissions Calculator Methodology (United Kingdom) Version 2.3 November 2016 Next Green Car 2016 Next Green Car Limited Unit 66, Spike Island 133 Cumberland Road Bristol BS1 6UX, UK Next Green Car Limited
CONVERSION OF GLYCEROL TO GREEN METHANOL IN SUPERCRITICAL WATER
 CONVERSION OF GLYCEROL TO GREEN METHANOL IN SUPERCRITICAL WATER Maša Knez Hrnčič, Mojca Škerget, Ljiljana Ilić, Ţeljko Knez*, University of Maribor, Faculty of Chemistry and Chemical Engineering, Laboratory
Low Carbon Technologies - Focus on Electric Vehicles. 6 mars 2018 ADEME - French Agency for Environment and Energy Management
 Low Carbon Technologies - Focus on Electric Vehicles 6 mars 2018 ADEME - French Agency for Environment and Energy Management Roadmap for the deployment of infrastructure for alternative fuels European
NOW AVAILABLE EXCLUSIVELY IN THE UK. Renewable and GTL Paraffinic diesels from Green Biofuels
 NOW AVAILABLE EXCLUSIVELY IN THE UK Renewable and GTL Paraffinic diesels from Green Biofuels Green D+ is formulated by adding a Nano technology patented performance additive, based on cerium oxide, to
Additional Transit Bus Life Cycle Cost Scenarios Based on Current and Future Fuel Prices
 U.S. Department Of Transportation Federal Transit Administration FTA-WV-26-7006.2008.1 Additional Transit Bus Life Cycle Cost Scenarios Based on Current and Future Fuel Prices Final Report Sep 2, 2008
A Transportation Perspective on Biodiesel and Advanced Biomass Conversion Fuels. California Energy Commission Sacramento, CA March 1, 2005
 A Transportation Perspective on Biodiesel and Advanced Biomass Conversion Fuels California Energy Commission Sacramento, CA March 1, 2005 1 Outline 1. Evolution of: Energy-Environmental-Fuel 2. Renewable
LowC VP. Transport Roadmaps. A guide to low carbon vehicle, energy and infrastructure roadmaps. Prepared by Low Carbon Vehicle Partnership
 LowC VP Low Carbon Vehicle Partnership Connect Collaborate Influence Transport Roadmaps A guide to low carbon vehicle, energy and infrastructure roadmaps Prepared by Low Carbon Vehicle Partnership September
Development of Alternative Fuel for Public Transport in Ho Chi Minh City
 Development of Alternative Fuel for Public Transport in Ho Chi Minh City Trinh Van CHINH Director, Ph.D Center of Environment and Transport Development - CETD QQ 3 Ba Vi Bac Hai District 10, Hochiminh
Please note: This guideline has been updated according to the BPP extension requirements.
 Life Cycle Emission Assessment Guideline Please note: The following guideline may be updated from time to time. If there is a discrepancy between this guideline and the grant agreement, the terms of the
(i) Place a cross in the box next to a pair of greenhouse gases.
 Place a cross in the box next to a pair of greenhouse gases.") 1 First generation biofuels are made from sugars and vegetable oils found in food crops. (a) Some countries are replacing small percentages of petrol and diesel with first generation biofuels to reduce
1 First generation biofuels are made from sugars and vegetable oils found in food crops. (a) Some countries are replacing small percentages of petrol and diesel with first generation biofuels to reduce
CITY AND COUNTY OF SAN FRANCISCO TRANSPORTATION BIOFUELS PLANNING STUDY
 1 CITY AND COUNTY OF SAN FRANCISCO TRANSPORTATION BIOFUELS PLANNING STUDY May 24, 2012 Jason Barbose UC Berkeley Goldman School of Public Policy Yuri Yakubov UC Berkeley Haas School of Business Bill Zeller
A CO2-fund for the transport industry: The case of Norway
 Summary: A CO2-fund for the transport industry: The case of Norway TØI Report 1479/2016 Author(s): Inger Beate Hovi and Daniel Ruben Pinchasik Oslo 2016, 37 pages Norwegian language Heavy transport makes
Amman Green Policies Projects and Challenges. Prepared by: Eng. Sajeda Alnsour Project coordinator Sept. 20, 2017
 Amman Green Policies Projects and Challenges Prepared by: Eng. Sajeda Alnsour Project coordinator Sept. 20, 2017 Amman: Demographics Greater AMMAN Municipality GAM Amman is the capital of Jordan with a