Sustainable Biocatalytic Biodiesel Production A Thermodynamic Analysis
|
|
|
- Percival Hill
- 6 years ago
- Views:
Transcription

1 Sustainable Biocatalytic Biodiesel Production A Thermodynamic Analysis Aarhus University Department of Engineering PhD Thesis September
2 Sustainable Biocatalytic Biodiesel Production A Thermodynamic Analysis PhD Thesis Version 2 Aarhus University Department of Engineering & MBGI September
3
4 SUSTAINABLE BIOCATALYTIC BIODIESEL PRODUCTION Annemin anısına : In memory of my mother iii
5 SUSTAINABLE BIOCATALYTIC BIODIESEL PRODUCTION iv
6 SUSTAINABLE BIOCATALYTIC BIODIESEL PRODUCTION PREFACE As a part of Sustainable Biodiesel Project, the present thesis entitled Sustainable Biocatalytic Biodiesel Production A Thermodynamic Analysis has been written as a partial fulfillment required for obtaining doctor of philosophy (PhD) degree in engineering at the Aarhus University (AU). The corresponding part (content) of the project was establishing the optimal conditions and thermodynamic limits for the process which comprised of the analyses of chemical and physical (phase) equilibria of reactive systems. The work in this study was performed at Agro Biotechnology Science Group (Lipid Group) Laboratory in Department of AU Engineering (formerly the group was located in the Department of Molecular Biology and Genetics) under the supervisions of Prof. Xuebing XU and Dr. Jesper BRASK (at Novozymes A/S Bagsvaerd/DK). The project was co-financed by The Danish National Advanced Technology Foundation (HTF) and Aarhus University for a period from 2008 to September, 2012 Århus/Denmark v
7 SUSTAINABLE BIOCATALYTIC BIODIESEL PRODUCTION vi
8 SUSTAINABLE BIOCATALYTIC BIODIESEL PRODUCTION ACKNOWLEDGEMENTS I am glad to take this opportunity to express my gratitude to all those people who contributed towards the successful completion of this work directly or indirectly. Foremost, my supervisor Dr. Xuebing XU to whom I am forever indebted for his generous spirit, patience and guidance. This thesis could not be completed without his trust in giving me this responsibility, his motivation and support. I would like to thank my co-supervisor Dr. Jesper BRASK from Novozymes A/S (Bagsvaerd / Denmark) for his practical suggestions and support in numerous ways. My special thanks to Dr. Zheng GUO for his helps on building cosmo molecules and being always ready for help. I wish to thank Dr. Sergey N. Fedesov as a project member and coworker during the study. The discussions during Sustainable Biodiesel Project meetings were always fruitful and mind-opening. Thanks to all the people participated to these meetings. I am grateful to Flemming Lund Sørensen for his kind helps and infinite support even on non-technical issues. I would also like to thank Lipid Group members who I worked with for their help and support. Last but not least, I wish to thanks to Mehtap and my parents who constantly inspired me to work better. vii
9 SUSTAINABLE BIOCATALYTIC BIODIESEL PRODUCTION viii
10 SUSTAINABLE BIOCATALYTIC BIODIESEL PRODUCTION TABLE OF CONTENTS ABSTRACT SAMMENFATNING 1. PROJECT OUTLINES AND THESIS STRUCTURE 1. Sustainable Next-Generation Biodiesel Production Project... I The Main Project Outlines... I-1 2. The Major Objectives of Present Thesis... I-2 3. Thesis Structure... I-3 2. BIOCATALYSIS FOR BIODIESEL PRODUCTION USING LIPASE ENZYMES 1. Introduction... II Some Properties of Biodiesel as a Fuel... II-4 2. Feedstock Possibilities... II Oil Sources... II Edible Vegetable Oils... II Inedible Oil Sources... II Microalgae Oil... II Aliphatic Alcohols (MeOH and EtOH) as the Acyl Acceptor Sources... II Methanol vs. Ethanol... II-9 3. Biodiesel Production by means of Biocatalysis... II Lipase Enzymes as the Biocatalyst... II Sources of Lipase Enzymes... II A Few Notes on Catalytic Activity... II Two Selected Enzymes: CALB and TLL... II Factors Affecting Biocatalytic Biodiesel Production... II The Formation of Biphasic Reactive Media... II A Brief Introduction to Methanolysis... II Alcohols vs. Alcoholysis... II Literature Survey on Ethanolysis... II Immobilized Enzyme Preparations... II Advantages of Immobilization... II Immobilization on Hydrophobic Carriers... II Some Key Elements in Immobilization... II Pretreatments and Stability... II Pretreatments with Organic Solvents... II Specificity/Selectivity and Acyl Migration... II Positional Specificities and Substrate Selectivities... II Acyl Migration... II Denaturation/Inactivation vs. Regeneration... II-27 ix
11 SUSTAINABLE BIOCATALYTIC BIODIESEL PRODUCTION Prevention and Regeneration Possibilities... II Inactivation vs. Inhibition... II The use of Organic Solvents... II tert-butanol as a promising Solvent... II Diesel Fuel and FAEE as the Solvent... II Disadvantages of Organic Solvent Use... II Enzyme Inhibition by Glycerol Product... II Elimination Possibilities... II The Impacts of Water Content... II Structural water vs. Bulk Water... II Water Content of Substrates and Reactive Media... II Mass Transfer Resistances In Brief... II Analytical Methods in Phase Equilibria Studies... II Turbidimetric Analysis under Isothermal Condition... II Tie-Line Determination under Isothermal Condition... II SFO-HO EtOl EtOH Ternary System... II EtOl EtOH Glycerol Ternary System... II GC-FID Analysis for Liquid-Liquid Phase Equilibria... II GC-FID Analysis of Partial Glycerides and Triglycerides for Determination of Fatty Acid Alkyl Esters... II Determination of Water Content in Biodiesel using Coulometric KF Titration... II PHYSICAL (PHASE) EQUILIBRIA LLE AND VLE Nomenclature... III-4 0. Concise Evaluation of Chapter Summary... III-7 1. Introduction and Motivation... III A Closer Look to Immiscibility Phenomena... III The Need for Phase Equilibria Studies... III A Few Notes on the Determination Methods... III Chapter Objectives and Structure... III Predictive Modeling of LLE using UNIFAC Group Contribution Method... III UNIFAC Model Variants... III Functional Group Assignments... III Pseudo-Components for Ethanolysis Reactions... III Combinations for Functional Groups... III Liquid-Liquid Phase Equilibria of Vegetable Oil FAEE EtOH Ternary Systems... III Literature Survey on the Application of UNIFAC Model Variants to the Phase Behavior Simulations of Biodiesel Reaction Systems... III Predictive Simulation of LLE by means of UNIFAC Model Variants... III UNIFAC-LLE Model Variant for LLE Estimation... III Cross-comparisons of LLE by means of UNIFAC-LLE Model Variant in Ternary Systems Containing Pseudo- Species... III LLE Prediction using Updated UNIFAC-LLE Table for Vegetable Oil FAEE EtOH Ternary Systems... III Temperature Effect on the LLE Estimation of UNIFAC Model Variants... III Effect of CH 2 Functional Groups and HC=CH/CH 2 Ratio on the LLE Estimations of TAG FAEE EtOH Ternary Systems... III Experimental Study of LLE in Vegetable Oil FAEE EtOH Ternary Systems... III-36 x
12 SUSTAINABLE BIOCATALYTIC BIODIESEL PRODUCTION Literature Survey on Experimental Study of Vegetable Oil FAEE EtOH Ternary Systems Liquid- Liquid Phase Equilibria... III Solubility of Dry and Aqueous Ethanol in Vegetable Oils... III LLE Measurements for Vegetable Oil FAEE EtOH Ternary Systems... III Phase Distribution of EtOH in Ternary Systems... III Statistical Comparison of UNIFAC Model Variants with Experimental LLE Data... III Conclusions... III Liquid-Liquid Phase Equilibria in FAEE EtOH Glycerol Ternary Systems... III Literature Survey on LLE for FAEE EtOH Glycerol Ternary Systems... III Predictive Modeling of LLE Phase Behavior by means of UNIFAC Model Variants... III Experimental Study of LLE in FAEE EtOH Glycerol Ternary Systems Comparisons with Predictive Methods... III Simulation of LLE Phase Behavior using Correlative Activity Coefficient Models: UNIQUAC, NRTL, and Modified Wilson (T&K)... III Binary Interaction Parameters and LLE of EtOl EtOH glycerol Ternary System via Correlative Models... III Conclusions... III Predictive Modeling of LLE Phase Behaviors using Quantum Chemical COSMO-RS Method... III A Few Notes on Quantum Chemical COSMO-RS Method and Parameter Sets... III Parameter Files in COSMO-RS... III LLE Phase Behavior of Vegetable Oil FAEE EtOH Ternary Systems... III LLE Phase Behavior Sim. of TAG FAEE Glycerol and FAAE EtOH Glycerol Ternary Systems... III LLE Simulations for TAG FAEE Glycerol Systems... III Simulations of LLE in FAEE EtOH Glycerol Mixtures... III Solubility of Glycerol and Water in FFA Species COSMO-RS Simulations... III LLE Simulations of Free Fatty Acid Containing (Waste/Used Oil) Ternary Systems COSMO-RS and UNIFAC Model Variants... III Simulations of pseudo-tag FFA EtOH Ternary Systems using UNIFAC Model Variants... III Simulations by means of COSMO-RS Method... III Case 1: TAG FFA EtOH Ternary Systems... III Case 2: TAG FFA Glycerol Ternary Systems... III Case 3: FAEE FFA Glycerol Ternary Systems... III A Realistic Simulation using Waste/Used Oil Feedstocks... III Conclusions... III Liquid-Liquid Phase Behaviors of Reactive Systems Containing Water as a Substrate... III Assessments of Water Solubility in FAME species Experimental vs. COSMO-RS Simulations... III Moisture Absorption by Biodiesel (FAAE) Species Experimental Measurements vs. COSMO-RS Method; UNIFAC Model Variants; and SAFT-HR and ESD Equations of State... III Absorption of Moisture by FAAE Species/Blends... III LLE Phase Behavior of Ternary Systems Containing Water as a Reactive Species... III Simulations via Quantum Chemical COSMO-RS Method... III Case 1: TAG EtOH H 2 O Ternary System... III Case 2: FAEE H 2 O EtOH Ternary System... III Case 3: FFA EtOH H 2 O Ternary System... III Case 4: FAEE H 2 O Glycerol Ternary System... III Case 5: FFA H 2 O Glycerol Ternary System... III Comparison of Reported Experimental LLE Phase Diagrams of FAEE H 2 O EtOH Ternary Systems with Simulations by means of COSMO-RS Method... III-103 xi
13 SUSTAINABLE BIOCATALYTIC BIODIESEL PRODUCTION 5.4. Conclusions...III Multicomponent Liquid-Liquid Phase Equilibria Simulations by means of COSMO-RS Method... III LLE Phase Behavior of Quaternary Systems... III Triolein EtOl EtOH Water System... III Triolein EtOl EtOH Glycerol and Triolein EtOl Glycerol Water Systems... III EtOl EtOH Water Glycerol System... III Triolein OlAc EtOH Water and EtOl OlAc EtOH Water Quaternary Systems... III LLE Phase Behavior of Multinary (Multicomponent) Systems... III Triolein EtOl Glycerol Rectified EtOH (EtOH+Water) System... III Triolein EtOl OlAc Rectified EtOH (EtOH+Water) System... III (Triolein+OlAc) EtOl EtOH Glycerol System... III (Triolein+OlAc) EtOl Rectified EtOH (EtOH+H 2 O) Glycerol System... III (TAG+DAG+MAG) FAEE EtOH Glycerol System... III Conclusions... III Simulations of VLE in Down Processing (Refining) of Enzymatic Transesterification Reactions using QC- COSMO-RS Method... III ANALYSIS OF CHEMICAL EQUILIBRIA - TRANSESTERIFICATION, ESTERIFICATION, AND HY- DROLYSIS REACTIONS 0. Concise Evaluation of Chapter Summary... IV-3 1. Introduction... IV Motivation... IV Objectives and Assumptions... IV Reaction Schema... IV Determination of Independent Reaction Sets... IV Thermophysical Properties of Reacting Species... IV Formation Energies... IV Vaporization Enthalpies... IV Isobaric Specific Heat Capacities at Liquid State... IV Pseudo-empirical Correlative K-value Method... IV Chemical Equilibria Simulations through Minimization Methods... IV Constrained (Nonstoichiometric) Minimization... IV Simulation A: Reaction System Including All Species... IV Simulation B: Reaction System for Absolute EtOH (Water as an inert species)... IV Simulation C: Reaction System for Oleic Acid as an inert species... IV Simulation D: Reaction System for Abs. EtOH (Water + Oleic acid as inert substances)... IV Unconstrained (Stoichiometric) Minimization... IV Simulation through the Equilibrium Temperature Approach... IV Chemical Equilibria Analysis by means of pseudo-empirical K-Value Method... IV Pseudo-empirical Chemical Equilibrium Constant (K-) Models of Reactions... IV Reaction Energies... IV Gibbs free Energies and Chemical Equilibrium Constants of Reactions... IV Enthalpies of Reactions... IV Simulations of Chemical Equilibrium through pseudo-empirical K-value Models... IV Simulation A: Transesterification Reactions using Absolute Ethanol... IV Simulation B: Transesterification and Hydrolysis Reactions using Aqueous Ethanol - Consecutive Solution... IV-47 xii
14 SUSTAINABLE BIOCATALYTIC BIODIESEL PRODUCTION 6. Experimental Analysis of Chemical Equilibrium for Enzymatic Ethanolysis Reactions... IV Ethanolysis with Absolute EtOH using Novozym 435 as the Biocatalyst... IV Some Evaluations of Ethanolysis Reaction in terms of Chemical and Phase Equilibria... IV Ethanolysis, Hydrolysis, and Esterification Reactions with Rectified EtOH using Novozym 435 and TL HC as the Biocatalysts... IV Simultaneous Simulations of Physical and Chemical Equilibria for the Ethanolysis Reaction with Absolute EtOH... IV General Conclusions and Future Prospects... IV GENERAL RESULTS AND CONCLUSIONS... V-1 REFERENCES References for Chapter 2... R-1 References for Chapter 3... R-9 References for Chapter 4...R-15 APPENDICES Appendix 2 Appendix 2-1 (Biodiesel Standards)... A-1 Appendix A-3 1. Calibration Functions for Calculation of Glycerol and Glycerides Compositions... A-3 2. Calibration Functions for Calculation of Ethanol Composition... A-4 Appendix A-7 Appendix 3 Appendix A-9 Supplementary Data Phase-Split Phenomenon... A-9 A. A Thermodynamic Framework in Brief... A-9 B. Equations for Phase-Split Calculation for LLE using Iterative Method (Rachford-Rice Equations)... A-17 C. UNIFAC Models for Liquid Phase Activity Coefficient Prediction... A-19 D. A Few Notes on Correlative Activity Coefficient Models - UNIQUAC and NRTL Local Composition Models... A-17 Appendix 3-2 (Mathematical Expressions used for Statistical Comparison)... A-27 Appendix A-29 Supplementary Data 1. UNIFAC-VLE Variant for LLE Phase Behavior Simulation... A Modified UNIFAC (Do.) Model Variant for LLE Estimation... A-31 xiii
15 SUSTAINABLE BIOCATALYTIC BIODIESEL PRODUCTION 3. Comparisons of Reported Experimental LLE Data for FAEE EtOH Glycerol Ternary Systems with Predictive Methods UNIFAC vs. COSMO-RS... A Binary LLE of Reactive Substrates of Transesterification Reaction... A A Few More Ternary LLE Sim. of Reactive Systems using Predictive Methods... A Solubility of Water in FAAE Preliminary Evaluation of COSMO-RS Simulations... A A few Notes on SAFT-HR and ESD Equations of State...A-40 A. Simulations of LLE for RSO MeOl MeOH and MeOl MeOH Glycerol Ternary Systems using UNIFAC- LLE Model Variant... A-42 B. Predictive LLE Phase Behavior Simulations of FAEE EtOH Glycerol Ternary Systems by means of UNI- FAC Model Variants... A-43 C. LLE Phase Behavior Simulations for EtOl Glycerol Ternary Systems using NRTL Model with different Non-randomness Parameter Values... A-46 D. Simulations of LLE Phase Behavior of MeOl MeOH glycerol Ternary System via COSMO-RS... A-46 E. Solubility of Glycerol in FFA using UNIFAC-LLE and Modified UNIFAC (Do.) Model Variants... A-47 F. Ternary LLE Phase Diagrams of Vegetable oil FFA EtOH H 2 O Quaternary Systems Experimental Measurements... A-47 G. The Conformation Numbers of Species used with COSMO-RS Method and Pure Component Parameters of FAEE Species and Glycerol for ESD and SAFT-HR Equations of State...A-49 H. The LLE Phase Diagrams of FFA EtOH Glycerol Ternary System Simulated via COSMO-RS Method and Reported LLE Data for FAEE EtOH H 2 O Ternary Systems... A-50 I. Quaternary LLE Phase Diagram for Triolein MeOl MeOH Glycerol Systems Simulated by means of COSMO-RS Method... A-52 Appendix A-53 Appendix 4 Appendix A-67 Supplementary Data 1. Reaction Spontaneity and Chemical Equilibrium... A Some Mathematical Background on Chemical Equilibria... A Mass Balance Constraints and Approaches to Chemical Equilibrium... A Gibbs Free Energy Minimization Methods Theoretical... A Functional Groups and Contribution Numbers Assigned to Fatty Species... A-77 Appendix A Formation Energies at New Reference Conditions (arbitrary T; standard P)... A Thermophysical Properties and Reaction Energies Calculated for New Reference Temperatures... A-79 Appendix A-81 Supplementary Data 1. Simulation through the Fraction of Conversion Approach Unconstrained (Stoichiometric) Minimization... A Calculation of Chemical Equilibrium Constant and Reaction Energies using Quantum Chemical COSMO-RS Method... A Analysis of Chemical Reaction Equilibria by means of Pseudo-Empirical Equilibrium Constant Method for Alternative Thermophysical Data Table... A-91 References... A-100 xiv
16 SUSTAINABLE BIOCATALYTIC BIODIESEL PRODUCTION ABSTRACT In the present thesis it was aimed at achieving thermodynamic analysis of reactions involved in enzymatic biodiesel production with specific focus on chemical and phase equilibria of reactive systems. Biodiesel can be produced through several possible processes. However, since vegetable oils and animal fats mainly consist of triglyceride species, the main and industrially preferred reaction for the production of biodiesel (long-chain fatty acid alkyl esters - FAAE) is the transesterification or alcoholysis reaction; whereas esterification is only necessary for feedstocks with higher content of free fatty acids (FFA). The transesterification of an oil or fat with an aliphatic alcohol, in most cases methanol (MeOH) due to its low price and least reactivity, yields the corresponding mono-alkyl esters in the presence of alkaline, acid, or biocatalysts (free or immobilized lipase enzymes). MeOH is the typically preferred alcohol as it is much cheaper than ethanol (EtOH), but in some cases EtOH should be preferred because of its renewable nature, if derived from agricultural resources. Nowadays, most of the commercial MeOH comes from fossil fuel sources; whereas EtOH is from biomass (sugars and starches). Accordingly, the next generation of biodiesel fuel needs to be focused on the ethanolysis reactions through the biocatalytic way of production with the purpose of supplying a more renewable and environmentally friendly alternative fuel to petroleum diesel. Despite to some engineering drawbacks, lipase-catalyzed biodiesel production (biocatalytic ethanolysis) presents significant advantages: Easy recovery of glycerol, no complex down-processing operations for elimination of catalyst and salt, and requires less organic solvent and lower energy consumption compared with conventional chemical methods. The by-product glycerol is practically immiscible with the ester products (FAAE and oil) beside of the partial miscibility problem of oils/fats with MeOH and EtOH. The insoluble parts of alcohol feeds forms emulsion droplets within the reaction media where continuous stirring operations are applied in order to improve mass transfer and thus reaction rates. In all other cases, there occurs a heterogeneous alcohol phase in equilibrium with the fatty phase under equilibrium conditions. As a result, the substrates feed ratio (alcohol to oil ratio) essentially has a significant impact on the maximum process yield, reaction time, and life span of biocatalysts. Indeed, the accumulation of FAEE species makes the reaction mixture homogenous until the synthesis of certain amount of glycerol byproduct which becomes practically immiscible with fatty phases. The system, hence, split again into two equilibrated phases: an alcohol rich lower phase and an ester or fatty rich upper phase. In case of neat vegetable oils as the feedstock -even if each of the FAEE, TAG, DAG, and MAG blends were considered as single species- there are reaction media consisting of 6 kinds of species where TAG-EtOH and fatty -glycerol binary systems, except that of MAG-glycerol, are immiscible with each other. Furthermore, reaction media becomes more complex in case of waste/used oil sources containing significant amounts of FFA and/or water where two types of side reactions (hydrolysis and esterification) need also to be taken into account. Therefore, the immiscibility and/or miscibility drawbacks of reactive systems involved in transesterification, esterification and hydrolysis reactions are the fundamental constraints whereby some crucial circumstances are stem from, such as denaturing impacts of insoluble alcohols on biocatalysts; dominating side reactions and/or reverse reactions; inadequate external mass transfer; longer reaction times; and ultimately low target product yields. Obviously, all of the conditions in question are strictly correlated to such constraints. In practice, due to the reversible nature of involved chemical reactions, some excess amounts of alcohol should be required in order to shift the reaction equilib- xv
17 SUSTAINABLE BIOCATALYTIC BIODIESEL PRODUCTION ria towards the products side. Furthermore, since EtOH has higher affinity for glycerol rich phase, some excess amounts of EtOH is also required in order to provide enough concentration of depleting (reacting) EtOH within the fatty rich phase. Obviously, such excess feeds are obligatory with the purpose of keeping reaction rate(s) efficient towards products side. The excess amounts of alcohol feeds need to be optimized for the reaction processes, biocatalyst types, oils sources and type/form of acyl acceptors involved. In overall, the major aims of this thesis were evaluating and subsequently finding feasible solutions to the questions emerged during the corresponding studies that have been performed worldwide. Some of the questions that were answered as appropriate as possible can be listed as follows: What is the solubility of EtOH in vegetable oils and in FAEE blends and how does it change with temperature? o How does the mutual solubilities of EtOH and vegetable oils change with the formation of FAEE species and glycerol by-product? o What are the miscibility limits of glycerol with the fatty or ester species? o How do the miscibility and/or immiscibility of reactive species be affected due to the feedstock compositions (waste/used oils vs. neat vegetable oils or animal fats; dry or aqueous EtOH)? Is it possible to prevent denaturing impact of EtOH on biocatalysts? o How much excess amount of EtOH feed is the optimum value? o What are the optimum substrate feed ratios (EtOH to oil) for different feedstocks? What are the feedstock content (water and FFA) impacts on glycerol and EtOH miscibility with ester species? Is it necessary removing glycerol by-product simultaneously? o How can it helps to the process yields? o Is it possible preventing the adhesion of glycerol on biocatalyst beads? Is it feasible providing monophasic or homogeneous reaction media that procure lower external mass transfer resistance? o Does it optimum for the whole reaction courses or just for the initial periods of reactions? o What will be the influences of such media on reaction rates and final target product yields? What are the moisture absorption limits of FAAE species? How are the interactions of reactive species in terms of miscibility/immiscibility phenomena? Is it thermodynamically feasible providing monophasic reaction media? o What will be the extents of consecutive or parallel reaction sets (hydrolysis, transesterification and esterification)? How can LLE and VLE phase behaviors help to determine optimum reaction conditions? How can the results of LLE and VLE studies be used so as to determine appropriate refining operations? xvi
18 SUSTAINABLE BIOCATALYTIC BIODIESEL PRODUCTION SAMMENFATNING I den foreliggende afhandling blev det formål at opnå termodynamisk analyse af reaktioner, der er involveret i enzymatic biodieselproduktion med særligt fokus på kemiske og faseligevægte af reaktive systemer. Biodiesel kan fremstilles gennem flere mulige processer. Da vegetabilske olier og animalske fedtstoffer består hovedsageligt af triglycerid-arter, de primære og industrielt foretrukne reaktionstid til fremstilling af biodiesel (langkædede fedtsyrer alkylestere - FAAE) er omestring eller al-coholysis reaktionen, og at esterificering er kun nødvendigt til udgangsmaterialer med højere indhold af frie fedtsyrer (FFA). Transesterificering af en olie eller et fedtstof med en alifatisk alkohol, i de fleste tilfælde methanol (MeOH) på grund af dets lave pris og mindst reaktivitet, giver de tilsvarende mono-alkyl-es-tere i nærvær af basisk, surt eller biokatalysatorer (fri eller immobiliserede lipaseenzymer). MeOH er det typisk foretrukne alkohol, da det er meget billigere end ethanol (EtOH), men i nogle tilfælde EtOH bør foretrækkes på grund af sin vedvarende karakter, hvis de stammer fra landbruget midler. Nowa-dage, det meste af den kommercielle MeOH kommer fra fossile energikilder, og at EtOH er fra biomasse (sukker og stivelse). Følgelig den næste generation af biodiesel brændstof skal være fokuseret på de ethanolysis reaktioner gennem den biokatalytiske form af produktion med henblik på at levere en mere vedvarende og miljøvenligt alternativ brændstof til råolie diesel. Trods nogle tekniske ulemper, præsenterer lipase-katalyseret produktion af biodiesel (biokatalytisk ethanolysis) væsentlige fordele: Nem inddrivelse af glycerol, ingen komplekse down-forarbejdningen i elimine-nering af katalysator og salt, og kræver mindre organisk opløsningsmiddel og lavere energiforbrug kom- menlignet med konventionelle kemiske metoder. Biproduktet glycerol er praktisk taget ikke-blandbart med esterprodukter (FAAE og olie) ved siden af den delvise blandbarhed problemet med olier / fedtstoffer med MeOH og EtOH. De uopløselige dele alkohol feeds danner små emulsionsdråber i de reaktionsmedier, hvor kontinuerlig omrøring operationer anvendes for at forbedre masseoverførsel og dermed reaktionshastigheder. I alle andre tilfælde sker der en heterogen alkohol fase i ligevægt med den»fede«fase under ligevægtsbetingelser. Som følge heraf, i det væsentlige substrater fødeforhold (alkohol til olie forhold) har en væsentlig indflydelse på den maksimale procesudbytte, reaktionstid, og levetiden af biokatalysatorer. Faktisk akkumuleringen af FAEE arter gør reaktionsblandingen "homogen", indtil syntesen af visse mængde glycerol biprodukt, der bliver praktisk taget ikke-blandbart med "fede" faser. Systemet dermed opdeles igen i to ækvilibrerede faser: en "alkohol" rige nedre fase og en ester eller 'fede' rig øvre fase. I tilfælde af rene vegetabilske olier som råmaterialet-selvom hver af FAEE blev TAG, DAG og MAG blandinger betragtes som "enkelt" arts-der reaktionsmedier bestående af 6 typer af arter, hvor TAG-EtOH og "fedt" -glycerol binære systemer, undtagen MAG-glycerol, ikke er blandbare med hinanden. Desuden reaktionsmedier bliver mere kompliceret i tilfælde af affald / brugte oliekilder med indhold betydelige mængder af FFA og/eller vand, hvor to typer af sidereaktioner (hydrolyse og esterificering) skal også tages i betragtning. Derfor er ublandbarhed og / eller blandbarhed ulemper ved reaktive systemer, der er involveret i transesteri-fikation, esterificering og hydrolysereaktioner er de grundlæggende begrænsninger, hvor nogle afgø-rende omstændigheder er stammer fra, såsom denaturering virkninger af uopløselige alkoholer på biokatalysatorer, dominerende sidereaktioner og / eller vist tilbage reaktioner, utilstrækkelig ekstern massetransport, længere reak-tion gange, og i sidste ende lavt mål produktudbytter. Naturligvis er alle de pågældende betingelser nøje korreleret til sådanne begrænsninger. I praksis, på grund af den reversible natur af de involverede kemiske reaktioner bør xvii
19 SUSTAINABLE BIOCATALYTIC BIODIESEL PRODUCTION nogle overskydende mængder af alkohol være nødvendig for at forskyde reaktionsligevægte mod produkterne side. Da EtOH har højere affinitet for glycerol rige fase, er nogle overskydende mængder af EtOH også påkrævet for at tilvejebringe tilstrækkelig koncentration af depletterende (re virkende) EtOH under "fede" rige fase. Det er klart, såsom overskydende feeds er obligatorisk med henblik på at holde reaktionshastighed (s) effektiv til produkter side. De overskydende mængder alkohol feeds skal optimeres til reaktionen processer, biokatalysatorpartikler typer, olier kilder og type / form acyl involverede acceptorer. I samlede, blev de vigtige mål for denne afhandling evaluering og efterfølgende finde mulige løsninger på de spørgsmål kommet frem under de tilsvarende undersøgelser, der er udført på verdensplan. Nogle af de spørgsmål, der blev besvaret så hensigtsmæssige som muligt kan være anført som følger: Hvad er opløseligheden af EtOH i vegetabilske olier og i FAEE blandinger og hvordan det ændre med temperaturen? o Hvordan de gensidige opløseligheder af EtOH og vegetabilske olier ændre sig med dannelsen af FAEE arter og glycerol biprodukt? o Hvad er blandbarhed grænserne af glycerol med den»fede«eller ester arter? o Hvordan blandbarheden og / eller ublandbarhed af reaktive arter blive påvirket på grund af råvare sammensætninger (affald / spildolie vs pæne vegetabilske olier eller animalske fedtstoffer; tør eller vandig EtOH)? Er det muligt at forhindre denaturering indvirkning EtOH på biokatalysatorer? o Hvor meget overskydende mængde af EtOH foder er den optimale værdi? o Hvad er de optimale underlag fødeforhold (EtOH til olie) til forskellige råmaterialer? Hvad er råmaterialet indhold (vand og FFA) indvirkning på glycerol og EtOH blandbarhed med ester arter? Er det nødvendigt at fjerne glycerol biprodukt samtidig? o Hvordan kan det hjælper at processen giver? o Er det muligt forebyggelse af vedhæftningen af glycerol på biokatalysatorpartikler perler? Er det muligt at give monofasiske eller homogen reaktion medier, skaffe lavere ekstern massetransport modstand? o Er det optimale for hele reaktions kurser eller bare for de første perioder af reaktioner? o Hvad vil være de påvirkninger af sådanne medier på reaktionshastigheder og endelige mål produktudbytter? Hvad er fugtabsorption grænser for FAAE arter? Hvordan er samspillet mellem reaktive arter med hensyn til blandbarhed / ublandbarhed fænomener? Er det termodynamisk muligt at give monofasiske reaktionsmedier? o Hvad vil være de omfang af på hinanden følgende eller parallelle reaktions sæt (hydrolyse, transesterificering og esterificering)? Hvordan kan LLE og VLE fase adfærd med til at bestemme optimale reaktionsbetingelser? Hvordan kan resultaterne af LLE og VLE undersøgelser anvendes for at fastslå passende raffinering operations? xviii

20 BIOCATALYTIC BIODIESEL PRODUCTION A THERMODYNAMIC ANALYSIS
21
22 PROJECT OUTLINES & THESIS STRUCTURE I. Chapter 1 Chapter 1 PROJECT OUTLINES AND THESIS STRUCTURE CONTENTS 1. Sustainable Next-Generation Biodiesel Production Project 1.1. The Main Project Outlines 2. The Major Objectives of Thesis 3. Thesis Structure 1. Sustainable Next-Generation Biodiesel Production Project 1.1. The Main Project Outlines The main project has been operated by a platform consisting of two industrial companies and two universities. The companies were Novozymes A/S, world leading enzyme producer, and a biodiesel production company via conventional chemical methods, Emmelev A/S (Otterup DK.) where the main project has been led by the former one. Aarhus University (AU) and two departments of the Technical University of Denmark (DTU), namely Department of Chemical Engineering and Department of Management Engineering were the members of the platform from the academy. The overall project has been executed and controlled by The Danish National Advanced Technology Foundation (HTF). The success criterion for the platform was to establish a world-leading enzyme technology for the next generation of biodiesel production. The main purposes of the platform members, on the other hand, were developing and documenting a biodiesel process which is cost-effective, environmentally superior to conventional chemical processes, and with a complete documentation of the process including a quantitative sustainability assessment. It was expected that the developed technology will allow utilization of low quality and non-food oils with a much lower negative impact on the environment. In that respect, the prominent objectives of main project can be outlined as follows: Establishing the optimal conditions and boundary limits for the process, I-1
23 Designing the most efficient reactors for the process, PROJECT OUTLINES & THESIS STRUCTURE Developing enzymes effective enough to contribute with a catalyst cost of less than 125 DKK/ton of biodiesel, Establishing a pilot plant with a minimum capacity of 10 kg/day, and Analysis of enzymatic process by means of existing and improved life cycle assessment (LCA) tools. The study and development of optimal reaction conditions and boundary limits for the process was the main subject assigned to Aarhus University (to Agro-Biotechnology Group). The objective of this part was developing a clear picture of the reaction systems in terms of phase behaviors and kinetic performance. In this regard, sufficient information required for the rational design of the reactors and processes can be eventually provided. The assigned sub-project can be outlined as follows: Modeling and simulation of chemical and physical (phase) equilibria, Statistical optimization of the key process parameters, Analysis of Reaction Kinetics, and Reaction progress monitoring through spectroscopic methods. 2. The Major Objectives of Present Thesis It was primarily aimed at achieving a comprehensive understanding of phase and chemical equilibria in reaction systems through predictive modeling and simulations amended by experimental measurements where appropriate. It was accordingly expected that detailed understanding of the phase behaviors during the reaction time courses will enable the development of reaction strategies and identification of possible factors that could be significant in the process design and operations. In overall, a comprehensive thermodynamic analysis considering chemical and physical (phase) equilibria of enzymatic ethanolysis reaction systems will be the main objective of the present thesis. The seeking of optimum parameter values for key process parameters in view of phase and chemical equilibria of reactive systems through statistical optimization methods were the succeeding objective. The last part of the project was assessing reaction progress monitoring possibilities by means of spectroscopic methods, such as FT-IR and FT-NIR spectroscopy. The main purpose was looking for robust, easy-to-use and non-destructive analytical method through developing multivariate calibration models in order to estimate the conversion levels of unknown samples applicable to the reaction progress monitoring. However, the last two parts, namely statistical optimization of process parameters and reaction progress monitoring through spectroscopic methods has not been included in the present thesis. Incidentally, the analyses of reaction kinetics and parameter identification I-2
24 PROJECT OUTLINES & THESIS STRUCTURE parts that have been studied by another Lipid Group member, Dr. Sergey N. Fedesov and will not also be mentioned. 3. Thesis Structure The present PhD thesis dealing with the thermodynamic analysis of biocatalytic way of biodiesel production consists of three main chapters and a final chapter outlining general results and conclusions of the overall study performed during this study. Each chapter was written as a separate part however referring to the other chapters where appropriate. Accordingly, chapter pages, references part, and appendices were numbered separately. The chapter references and related appendix parts were given at the end of the main text, each as a distinct part. Evidently, the concise evaluations (summaries) of two main chapters, i.e., Chapter 3 and Chapter 4 were given in the beginning of each chapter in executive summary format. It is worth noting that all solubility data was given in weight based percentages, unless stated otherwise. The biocatalytic way of biodiesel production was comprehensively evaluated through literature survey in Chapter 2. The evaluation starts with the definition of biodiesel fuel and some of its prominent properties. Subsequently a comprehensive assessment of feedstock possibilities both including oil and alcohol (methanol MeOH and ethanol EtOH) substrates has been performed. The next part of chapter deals with the biocatalytic way of biodiesel production. This part starts with the description of lipase enzymes as the biocatalysts, their sources, activities, particularly based upon two selected lipase enzymes, namely Thermomyces lanuginosus lipase (TLL) (formerly Humicola lanuginosus) and Candida antarctica lipase B (CALB) both of which are immobilized on the same type of hydrophobic supports. The major part of chapter was dedicated to the factors and determinants affecting biocatalytic production. In this part, a special section has been devoted to the immobilized biocatalyst, its stability, pretreatment, and regeneration after partial and/or complete inactivation due to MeOH and EtOH. The use of organic solvents, water content and its impact; and mass transfer resistances were the last sub-sections of this part. The final part of Chapter 2 was dealing with the analytical method and procedures applied to ethanolysis reactions in terms of determining mainly phase and chemical equilibria compositions, and also water content of reactive systems. As the largest chapter, the binary, ternary, quaternary and multicomponent liquid-liquid equilibria (LLE) of reactive systems containing vegetable oils, alcohols (glycerol and EtOH or MeOH) fatty acid alkyl esters (FAAE), partial glycerides and free fatty acids (FFA) have been investigated in Chapter 3 through predictive and correlative methods; experimental analyses and measurements, and also through reported experimental data, where available. The predictive methods were based on mainly two methods: group contribution method based UNIFAC activity coefficient model with three variants and quantum chemical COSMO- RS method with 6 different parameter sets (files). This chapter contains 7 sections with the I-3
25 PROJECT OUTLINES & THESIS STRUCTURE first 3 principally devoted to the UNIFAC model variants applied to binary and ternary reactive systems along with experimental verification of binodal curves. The solubility and mutual solubility of substrate and products within each other has been investigated through both methods. On the other hand, the last 3 sections deals with the ternary, quaternary and multinary LLE of water and FFA containing reactive systems in addition to former systems. The last relatively short section amended by a published article (see Appendix 3-4) was devoted to the vapor-liquid equilibria (VLE) of refining operations of biocatalytic ethanolysis reaction process. All the investigations and evaluations were made through realistic simulations of mentioned systems. Beside of some supplementary data, the four appendix parts of the chapter mainly deals with the theoretical and mathematical explanations of phase separation phenomena and thermodynamic models dealing with such non-ideal systems behaviors with the exceptions of last one containing a published paper on LLE and VLE of refining operations. The simulations of chemical equilibria in transesterification, esterification and hydrolysis reactions involved in biodiesel production together with the calculation/estimation of related thermophysical properties were the subject of Chapter 4. Three distinct methods have been applied to simulate chemical equilibria and subsequent equilibrium compositions of reactive systems: The constrained and unconstrained Gibbs free energy minimizations, pseudoempirical correlative equilibrium constant method and also quantum chemical COSMO-RS method. All the simulations were performed through monophasic reaction media assumption with the intention of identifying the impact of homogeneous media on the equilibrium conversions of reaction components and the thermodynamic feasibility of such media in terms of the process yields. Ethanolysis reactions were subsequently evaluated through experimental measurements of reaction yields for two types of biocatalysts mentioned above. The first part of the chapter that follows the introductory part deals with the estimation of thermophysical properties of reactive species by means of several group contribution methods. The successive section was devoted to the pseudo-empirical correlative K-value model applied to simulate reaction energies and equilibrium conversions of consecutive reaction steps. Accordingly, the next three sections deal with reaction equilibria simulations by means of the Gibbs free energy minimization and pseudo-empirical methods for monophasic reaction media followed by some verification studies using experimental analyses. The last parts of Chapter 4 was dedicated to simultaneous preliminary simulations of physical (phase) and chemical equilibria with subsequent evaluation of general results and future prospects. The overall results and conclusions were outlined in Chapter 5. I-4
26 CHAPTER 2
27
28 BIOCATALYTIC BIODIESEL PRODUCTION II. Chapter 2 Chapter 2 BIOCATALYSIS FOR BIODIESEL PRODUCTION USING LIPASE ENZYMES CONTENTS 1. Introduction 1.1. Some Properties of Biodiesel as a Fuel 2. Feedstock Possibilities 2.1. Oil Sources Edible Vegetable Oils Inedible Oil Sources Microalgae Oil 2.2. Aliphatic Alcohols (MeOH and EtOH) as the Acyl Acceptor Sources Methanol vs. Ethanol 3. Biodiesel Production by means of Biocatalysis 3.1. Lipase Enzymes as the Biocatalyst Sources of Lipase Enzymes A Few Notes on Catalytic Activity Two Selected Enzymes: CALB and TLL 3.2. Factors Affecting Biocatalytic Biodiesel Production The Formation of Biphasic Reactive Media A Brief Introduction to Methanolysis Alcohols vs. Alcoholysis Literature Survey on Ethanolysis Immobilized Enzyme Preparations Advantages of Immobilization Immobilization on Hydrophobic Carriers Some Key Elements in Immobilization Pretreatments and Stability Pretreatment with Organic Solvents Specificity/Selectivity and Acyl Migration Positional Specificities and Substrate Selectivities Acyl Migration Denaturation/Inactivation vs. Regeneration Prevention and Regeneration Possibilities II-1
29 BIOCATALYTIC BIODIESEL PRODUCTION Inactivation vs. Inhibition The use of Organic Solvents tert-butanol as a Promising Solvent Diesel Fuel and FAAE as the Solvent Disadvantages of Organic Solvent Use Enzyme Inhibition by Glycerol Product Elimination Possibilities The Impacts of Water Content Structural Water vs. Bulk Water Water Content of Substrates and Reactive Media Mass Transfer Resistances In Brief 4. Analytical Methods in Phase Equilibria Studies 4.1. Turbidimetric Analysis under Isothermal Condition 4.2. Tie-Line Determination under Isothermal Conditions SFO-HO EtOl EtOH Ternary System EtOl EtOH Glycerol Ternary System 4.3. GC-FID Analysis for Liquid-Liquid Phase Equilibria 5. GC-FID Analysis of Partial Glycerides and Triglycerides for Determination of Fatty Acid Alkyl Esters 6. Determination of Water Content in Biodiesel using Coulometric KF Titration II-2
30 BIOCATALYTIC BIODIESEL PRODUCTION 1. Introduction As an alternative to petroleum-based diesel fuel, biodiesel can be defined as the mono alkyl esters from long chain fatty acids (FAAE) derived from renewable lipids such as vegetable oils or animal fats. Analogous to diesel fuel it can be used in compression spark ignition engines. 1 The term biodiesel can be attributed to both long-chain fatty acid methyl (FAME) and ethyl (FAEE) ester forms. Nowadays, FAME is the most commercially available biodiesel thanks to relatively lower price of methanol (MeOH) in EU countries; whereas in countries such as in Brazil and Argentina where biobased ethanol (EtOH) is abundantly available with lower prices FAEE leads the biodiesel markets. Although vegetable oils can be directly used as a fuel source, they present high viscosity, acid contamination and FFA that lead to gum formation by oxidation, polymerization and carbon deposition. 2 The idea of using biodiesel as an alternative fuel is not new. However, it has recently been taken seriously because of the escalating petroleum prices and, more significantly, the approaching exhaustion of current fossil fuel sources within the next years. In addition, the emerging concern about global warming that is associated with burning fossil fuels also has considerable impacts. 3 Some recent global market surveys have shown a tremendous increase in biodiesel production. 4 Biodiesel can be produced through several possible processes: pyrolysis, the use of microemulsions, transesterification, and supercritical transesterification. However, since vegetable oils or animal fats mainly consist of triacylglyceride (TAG) species, the conventionally preferred 5 reaction for the production of biodiesel or in general FAAE is the transesterification or alcoholysis reaction; whereas esterification is only necessary for feedstocks with higher content of free fatty acids (FFA). Therefore, it is produced mainly from alcoholysis reaction of aliphatic alcohols with substrates (oils) extracted from seeds of conventional oleaginous plants; from palm and coconut oils; animal fats, and waste/used oils. The main purpose of alcoholysis is to reduce the viscosity of the oil/fat and increase the volatility and, hence, biodiesel combustion in a diesel engine without any engine modification. In terms of chemical reactions, the transesterification for biodiesel production is the exchange of alkoxy group of an ester compound (lipid species - oil or fat) with an aliphatic alcohol (MeOH or EtOH) in the presence of an alkaline catalyst (such as KOH or NaOH), an acid catalyst (H 2 SO 4 ), or biocatalysts (lipase enzymes in free or immobilized forms). The overall reaction is a sequence of three consecutive and reversible reactions in which di- (DAG) and mono-glycerides (MAG) are formed as intermediate products. Each steps of these reactions is theoretically reversible, although in the production of FAAE, the backward reaction does not occur or is negligible largely because the glycerol by-product formed is not miscible with the FAAE-oil mixture, leading to a two-phase system (see Section and Chapter 3). 5 The general reaction scheme is given below: II-3
31 BIOCATALYTIC BIODIESEL PRODUCTION 1.1. Some Properties of Biodiesel as a Fuel Biodiesel produced from lipid species are mainly comprised of six different FAAE, which are palmitic acid (C16:0), stearic acid (C18:0), oleic acid (C18:1), linoleic acid (C18:2), and linolenic acid (C18:3) alkyl esters, with palmitoleic acid (C16:1) alkyl ester present in small amounts. The exact TAG composition of an oil/fat further varies with the sources and growth conditions. The main difference between the oils involved in biodiesel production is their fatty acid (FA) composition where the most abundant ones are palmitic, stearic, oleic and linoleic acids. The main physical and chemical properties of an oil/fat depend on the chemical structures of its FA and they strongly affect some critical properties such as stability to oxidation resistance of the final biodiesel mixture. In this regard rapeseed oil seems to be one of the most suitable sources for biodiesel production. Furthermore, it has been predicted that feedstocks with a high level of oleic acid (C18:1) are the best suited for biodiesel production. 6 Analogously, G. Knothe has reported that FAME containing high amount of the methyl oleate and methyl palmitoleate (C16:1) are the ideal components as the biodiesel fuel. 7 The high content of saturated fatty acids (FA) in lipids, such as myristic, palmitic, stearic acids, increases the turbidity and the cetane number (CN), whereas decreases NO x emissions, but gives better stability. On the other hand, their degree of unsaturation makes biodiesel susceptible to thermal and/or oxidative polymerization, which may lead to the formation of insoluble products that cause problems within the fuel system, especially in the injection system 6. The CN or cetane index is one of the most significant properties specifying the ignition quality of a fuel for use in a diesel engine. The scale is based on two compounds: hexadecane with CN of 100 and heptamethylnonane with CN of 15. High CN is associated with rapid engine starting and smooth combustion. However, low CN causes deterioration in this behavior and results higher exhaust gas emissions and particulate matter. The CN of diesel fuel in the EU is regulated at 51, regulated and specified at 42 in Brazil, whereas it is specified at 40 in the USA. The CN of biodiesels is generally higher than that of the vegetable oil sources (34.6 < CN < 42). It increases with increasing length of both FA chain and ester groups, while it is inversely related to the number of double bonds. 8 The longer the FA car- II-4
32 BIOCATALYTIC BIODIESEL PRODUCTION bon chains and the more saturated the molecules, the higher the CN. 9 In general, the CN of FAEE is higher than that of FAME species. Since, the volatility of FAME is higher than that of FAEE, diesel engines using FAME produces slightly higher power and torque than that of using FAEE, as reported by Encinar and coworkers. 10 Besides, FAEE tend to produce more injector coking, but it has significantly lower smoke opacity, lower exhaust temperatures, and lower pour point than FAME. Biodiesel (FAME or FAEE) are less volatile than No. 2 diesel fuel. 11 An outline of the biodiesel standards based mainly on FAME species accompanied by the specifications of biodiesel fuel according to ASTM 6751 and EN were given in Appendix Feedstock Possibilities 2.1. Oil Sources Research on renewable and environmentally sustainable alternative fuels have shown that the two main concerns with any renewable fuel are the raw materials cost and supply, and the processing technologies. It has been generally reported that from 70% to 80% of the biodiesel production cost is due to the use of edible vegetable oils as the feedstocks. 12 For instance, it has been reported that the cost of soybean oil can account for up to 75% of the final cost per gallon of conventionally produced biodiesel Edible Vegetable Oils Vegetable oils are chemically defined as the esters of glycerol and fatty acids or as the triglycerides of fatty acids. Most natural lipids (fats and oils) are composite mixtures of several different TAG species. Rapeseed and soybean oils are the most commonly used feedstocks. The former is the most extensively used feedstock in EU countries; whereas the latter is mainly used in the USA. Besides, palm and palm kernel oils are used in tropical regions, such as in Indonesia and Malaysia. The EU countries, the largest producer and user of biodiesel, produce biodiesel mostly from rapeseed oil and sunflower oil feedstocks, along with waste/used oils. Accordingly, the EU countries are still the world leader in the development of the biodiesel sector by producing ca. 54% of the global biodiesel production. The USA, the second largest producer and user of biodiesel, employs soybean oil and recycled restaurant grease sources. Soybean oil alone accounts for about 90% of all feedstocks used in the US. In overall, palm, soybean, and rapeseed oils are the three vegetable oils with the highest production. The worldwide production of such kind of oils has been rising rapidly over the past few decades, driven not only by nutritional needs but also by feedstock demands arising from biodiesel industries. This has resulted in crops being sold as fuel crops with plausible shortages in the food supply and leading to a worldwide increase in food prices. The annual global production of these major oils has reached 140 million tons (Mt) in 2010 with II-5
33 BIOCATALYTIC BIODIESEL PRODUCTION palm oil and soybean oil comprising 50% of the production. 14 More specifically, the global production of natural oils and fats has grown from 79.2 Mt in 1990 to nearly 165 Mt in the year It has been reported that ca. 80% of these oils is used for food and feed applications, while about 20% is used industrially. Furthermore, Gupta and Demirbas 11 have reported that the world production of vegetable oils is approximately 0.13 billion tons per year which is very small when compared with the world petroleum consumption at about 4.25 billion tons. The increasing demand for vegetable oil stocks has led to an increase in price of these oils. As stated in the World Bank commodity price data sheet, 15 soybean oil prices is increased from 849 to 1328 US$/tonne while the palm oil price is increased from 683 to 1159 US$/tonne from 2009 to September, 2011, respectively. On the other hand, according to OECD-FAO Agricultural Outlook projections 4, crude vegetable oil prices will continue to advance in 2011 and to remain constant over the remainder of the outlook period. In nominal terms, crude vegetable oil prices are projected to reach 0.673US $/l by A. Demirbaş has recently reported a comparative costs usually over 0.50 US$/l for vegetable oil-based biodiesel (FAME) and 0.35 US$/l for petroleum-based diesel fuels. 16 Consequently, a decrease in production cost requires the reduction in the cost of feedstocks and improved processing technologies. However, with regard to technological improvements in processing, since it is already a mature technology, no major reductions in cost can be expected. 12 It is also of concern that competition with the food supply is a significant disadvantage of biodiesel industries using edible oils. Moreover, the additional competition with the food grains may occur when farmers switch from grain crops to oleaginous crops. 11 As a consequence of this competition, the production and use of biodiesel has not expanded, particularly, in developing countries mostly due to the high production cost which is associated with the expensive edible oil feedstocks. 17 This in turn requires the development of alternative feedstocks not directly linked to the food supply. Therefore, biodiesel production through multi-feedstocks could play a huge role in ensuring security and sustainability for the future. As mentioned by M. Mittelbach 18 multi-feedstocks based local plants seem to be the most plausible approach in the near future of biodiesel industry leading to optimum biodiesel blends for all types of diesel engines, all climates and ultimately all kinds of applications Inedible Oil Sources Nowadays, many research activities have focused on the development of new non-food grade or inedible vegetable oil sources as the alternative feedstocks. In this aspect, it has been reported that inedible oils and animal fats has reached to ca. 31 Mt of production in The major inedible oil sources include Jatropha curcas; Pongamia pinnata (karanja); Calophyllum inophyllum; Hevea brasiliensis and Ficus elastica (rubber seed tree); Azadirachta indica; Madhuca indica and Madhuca longifolia; Ceiba pentandra; Simmondsia chinensis (jojoba); Nicotina tabacum (tobacco seed oil) and babassu tree etc. These are mainly tree species II-6
34 BIOCATALYTIC BIODIESEL PRODUCTION that can grow in harsh environments. Vegetable oils from all of these resources have an FFA content of 3 20%. Jatropha curcas has the most significant potential attributable to its characteristics and growth requirements. The oleaginous Jatropha curcas (euphorbiaceae) species is a plant that grows in harsh soils and the oil content of its seed kernel 19 ranges from 45 to 60 wt. % with 14% FFA 20. The major FA found in jatropha oil are the oleic and linoleic acids. The possibility of using genetically modified species should also be considered, with the aim of optimizing the properties of the biodiesel produced, as is the case with high oleic sunflower oil. 12 There has also been considerable research on the use of low-value feedstocks, such as waste/used oils (grease and waste frying oils) from restaurants and by-products (distillates) of edible oil refining processes. In addition, animal fats including tallow, lard, yellow grease, chicken fat and the by-products of the production of ω-3 fatty acids from fish oil can also be used as the oil feedstocks. The yellow grease, a mixture of oils and fats obtained from rendered animals with up to 15% in FFA and brown grease with more than 15% of FFA obtained mainly from traps installed in commercial, municipal or industrial sewage facilities and trap grease, a very low-quality feedstocks that can approach 100% FFA, have the potential of being employed as the oil sources. 5 For instance, the production of rendered fats in the USA is estimated as 5.0 Mt/year, and Mt/year of used frying oils is produced in Europe. 21 Hoque and coworkers 17 have demonstrated a high potential of producing economically viable biodiesel from such low-cost feedstocks (beef fat, chicken fat and used cooking oil) with proper optimization of the process conditions (parameters). The principle problem associated with the use of waste/used oils is the necessity for preliminary treatments to render the oil/fat suitable for processing. They usually contain particulates that require filtration or separation. It is also worth noting that such oil sources contain water as an impurity and considerable amounts of FFA both of which are drawbacks to the conventional (chemical) production processes. Such drawbacks can be easily overwhelmed by means of biocatalysis (lipase enzymes). Conversion of soapstock (acid oils/olein) to biodiesel has attracted a great deal of attention. 22 Soapstock is a by-product generated in alkali refining of vegetable oils consisting of mixtures of TAG and more than 50% FFA. However, it exposes the requirement of a more aggressive purification treatment and discoloration of the resulting biodiesel to ensure compliance with its quality specifications. 12 Analogously, though the feedstock impact on the biodiesel cost can be reduced by the use of collected waste oil or animal fat, biodiesel from such sources needs to be blended with diesel to comply with biodiesel specifications for sale attributable to oil/fat composition and quality. 12 II-7
35 BIOCATALYTIC BIODIESEL PRODUCTION Microalgae Oil As another alternative feedstock the microalgae with reasonable yield of oily biomass as the most significant difference from the oil-bearing crops seems to have promising potential for the next-generation of biodiesel industry. According to Chisti 23 and Manzanera, 24 some species can produce oil over 80% of their dry weight. However, it is often reported that balancing the demand for higher growth rates and high oil content to the total amount of biomass grown is very challenging and cumbersome. In addition, the oil production from microalgae has several other engineering problems ranging from the optimization of high density and large surface units of production to the location of the microalgae production unit Aliphatic Alcohols (MeOH and EtOH) as the Acyl Acceptor Sources The choice of the acyl acceptor (alcohol) depends mainly on economic and process parameters. Even though the alcohol substrate is always significantly cheaper than the oil feedstocks, a proper evaluation is needed when selecting the alcohol where cost and supply; recovery and recycling possibilities; toxicity, and also the amount of alcohol needed for near-complete conversions are the major factors determining the suitable choice. The conventional (chemical) reactions typically take place with a high molar ratio of alcohol to oil of about 6:1 with MeOH and 12:1 for EtOH. As a result, the reactive mixtures in the commencement of reactions consist of two equilibrated liquid phases or form emulsions under continuous stirring/agitation because of the partial solubility of such alcohols in oil. On the other hand, since the conventional processes are troubled with EtOH giving lower yields due to technical issues, 25,26 it gives further advantage to the biocatalytic way of processing. Moreover, the partial solubility of alcohols in oil results in different lag phases during the initial formations of alkyl esters. Another important factor in alcohol selection is its water content. Since, water interferes with transesterification reactions (hydrolysis/soap formation vs. transesterification) and hence can result in lower yield, higher amount of FFA, and unconverted acylglycerides (TAG, DAG and MAG) in the final biodiesel product. Contrary to biocatalytic processes, a water content of merely 0.5 wt. % can stop the reaction in conventional (chemical) catalysis; therefore, water content should be much less than that amount. Moreover, commercially sold absolute EtOH forms typically contain up to 2% (v/v - depending on the purification level) of water which may help to improve enzymatic activity. II-8
36 BIOCATALYTIC BIODIESEL PRODUCTION Methanol vs. Ethanol It has often been claimed that EtOH is relatively less toxic to biocatalysts than MeOH. The rate of transesterification reaction by means of biocatalysis increases with the alcohol carbon chain length, implying that the use of EtOH over MeOH increases the reaction rate. 27 In addition, the replacement of MeOH with less polar alcohols resulted in only slight increase in retained activity, but the significant inactivation of biocatalysts still occurs. Since, the high ratios of substrates (excess feeds of alcohols) usually lead to the denaturation and thus inactivation of lipases and the decreased FAAE yield in case of biocatalysis. This might be due to the inactivation caused by alcohol and the negative effect caused by glycerol by-product adsorbed on the surface of the immobilized catalysts. 28 The biobased EtOH (bioethanol) has a great potential for use in biocatalytic processes mainly in developing countries with warm climates like Brazil, where it is a cheap and abundant commodity produced from the fermentation of sugarcane. 29 As another renewable resource, EtOH can be derived from cellulosic feedstocks using enzymatic hydrolysis. However, this operation requires much greater processing than from starch or sugar-based feedstocks, but feedstocks costs for such biomasses (grasses and trees) are generally lower than for grain and sugar crops. Beside of being preferred because of its renewable nature if derived from agricultural resources, EtOH is a relatively larger and heavier alcohol than MeOH which means a gain in weight yield of the FAEE biodiesel is possible. For instance, processing of 1 ton of triolein requires 109 kg of MeOH, whereas the required EtOH is 156 kg. 11 This means that a 4.7 wt. % of FAAE weight gain is possible in case of complete conversion with EtOH. This extra gain could become an important sales argument, particularly for the Brazilian biofuel market. Furthermore, recent research on low-temperature properties and diesel engine performance of selected FAAE derived from tallow and spent restaurant grease strongly suggested that FAEE from grease might be an excellent source of biodiesel. 30 They have lowtemperature properties, including cloud point, pour point, could filter plugging point, and low-temperature flow test, closely resembling those of FAME from soybean oil, the predominant form of biodiesel currently marketed in the USA. Finally, an interesting and cheap alternative to MeOH consisting of C 3 -C 5 linear and branched alcohols from fusel oil, a low-value residue from EtOH distillation, can be used as the acyl accpetor. Fusel oil mainly comprises on a molar basis: isoamyl alcohol (64.4%), 2- butanol (27.6%), 2-methyl-1-propanol (12.3%), 1-propanol (5.6%) and 1-butanol (1.3%). These alcohols are not enzyme denaturing and their esters, mainly the branched ones, improve the low-temperature properties of biodiesel blends. 31 Salis and coworkers 32 have reported the biocatalytic alcoholysis of triolein with a fusel-oil like mixture where the absence of MeOHmakes the whole process more environmentally friendly. II-9
37 BIOCATALYTIC BIODIESEL PRODUCTION 3. Biodiesel Production by means of Biocatalysis At present, industrial production of biodiesel has been performed by means of conventional (basic chemical) catalysis with, e.g., sodium or potassium hydroxide, commonly called as first generation biodiesel. However, this process is energy consuming and not environmentally friendly. Alternatively, despite to some engineering drawbacks the use of biocatalysts offer important advantages, such as easy purification process with no or relatively minor water washing step, synthesis of higher quality glycerol by-product with minimal amounts of down-processing and potential energy savings. Biocatalysis refers to catalysis by highly complex proteins called as enzymes. Relative to chemical catalysis fast modifications of some unique functional groups, among several similar groups in a mixture of similar substrates, are possible under milder conditions through biocatalysis. 33 In overall, the potential biocatalytic production processes could be more efficient, highly selective, involves less energy consumption, and produces less side products or waste compared to the conventional chemically-catalyzed processes. The main bottleneck in industrialization of enzymatic (biocatalytic) is believed to be attributable to the high price/low worldwide availability (esp. for immobilized forms) or nonoptimal operational features of the naturally available enzymes. 34 However, nowadays, three industrial-scale pilot plants operating through enzymatic production processes have been established in China. The pioneering one lead by Tsinghua University has been built in Hunan province (Hai Na Bai Chuan Co. Ltd.) has an annual capacity of tons with conversion rate >90%. The second pilot plant (Lv Ming Co. Ltd.) established in Shanghai has an annual production capacity of tons operating with waste cooking oils as the feedstocks. The last one Ling Xian Ke ji Co. Ltd. established in Hebei province has an annual capacity of tons Lipase Enzymes as the Biocatalyst Lipases are enzymes that catalyzes the formation or cleavage (hydrolysis) of lipids (fats and oils). 35 Thus far, the extensive and generally accepted definition of lipases is the carboxylesterases catalyzing hydrolysis and synthesis of long-chain acylglycerols. This definition seems to be the most adequate and descriptive for all known lipases. 36,37 These enzymes are classified as acyl glycerol ester hydrolases (EC ). Their molecular masses (M r ) are typically between 18 and 60 kda. However, most lipases have molecular masses of about kda. Lipase enzymes have a growing potential in industrial processes thanks to their exclusive versatility in the use of substrates and in the reactions performed. They have been exploited as catalysts for a number of transformations of fats and oils since the mid-1980s. Several lipases are commercially available for applied biocatalysis. The majority of them are em- II-10
38 BIOCATALYTIC BIODIESEL PRODUCTION ployed as immobilized preparations; while free lipases (in powder or liquid form) are also available. Immobilized forms are commercially accessible, and in a number of cases the enzymes immobilized on different supports in research laboratories have been used. Their main applications have been in modifying the fatty acid composition of triglycerides by interesterification or acidolysis (acyl exchange), the hydrolysis of triglycerides, and the direct synthesis of esters (esterification and transesterification). The involvement of biocatalysis in FAAE synthesis was proposed some 20 years ago mostly as free lipases (liquid solutions), but has been pursued more extensively only quite recently, particularly in Japan. Since then, studies on enzymatic transesterification for biodiesel production have increased by leaps and bounds. Industrial lipases are generally produced by the controlled fermentation of Aspergillus niger var., Aspergillus oryzae var., Candida rugosa, and Rhizomucor miehei as a liquid solution or a powder after the lyophilization process. 38 Accordingly, the processed enzyme s physical state might be crystalline, lyophilized or precipitated. 39 The supply of commercially available lipases are in two forms: lyophilized powders, which contain other components along with the lipase, or immobilized preparations. 40 The former (lyophilized or free) form of lipases has the advantage of easy preparation procedure and low preparation costs, but, in many cases, they can be used only once as they are inactivated and their recovery is not feasible. 2, Sources of Lipase Enzymes Lipases used in bioprocessing are generally of microbial (bacterial and fungal ) origin and are usually produced by fermentative processes, as mentioned above. 42 Microbial lipases have numerous advantages over lipases from animal and plant sources. Such lipases are readily available at low cost and do not require co-factor for reaction. They have the greatest potential as industrial catalysts since they are usually robust, easy to produce and recover using conventional fermentation processes. In general, lipases from microbial sources are produced extracellularly and are almost homogeneous in terms of lipolytic activity. In contrast, crude mammalian, fungal and plant lipases preparations can contain several other interfering enzymes, including proteases and esterases. 43 However, Al-Zuhair and coworkers have reported in this regard that fungal lipases have better transesterification activity with TAG species compared to those from bacterial ones. 44 The most effective lipases for transesterification reaction have been produced by Candida antarctica, Candida rugosa, Pseudomonas cepacia, Pseudomonas fluorescens, Rhizomucor miehei, Rhizopus chinensis, Rhizopus oryzae and Thermomyces lanuginosa microorganisms. 45 The majority of lipases are excreted in two isoforms (iso-enzymes), usually denoted as A and B. Crude technical-grade lipase preparations usually contain both isoforms; the only notable exception is Candida antarctica lipase, for which both pure isoforms A and B have been made available through genetic engineering. 39 In overall, most of bacterial lipases are II-11
39 BIOCATALYTIC BIODIESEL PRODUCTION sourced from Pseudomonas, Alcaligenes, Acinetobacter, Bacillus and Chromobacterium species; whereas extensively used fungal lipases are produced by Candida, Thermomyces (Humicola), Penicillium, Yarrowia, Mucor, Rhizopus and Aspergillus sp A Few Notes on Catalytic Activity Most of lipases have a specific reaction mechanism due to the fact that active site of the enzyme is covered by amphiphilic peptide loops or helices that act like a lid. Lipase enzymes are the most typical enzymes showing induced-fit mechanism. Here, it is assumed that the formation of enzyme-substrate complex requires a conformational change under the influence of substrate structure where new conformation acts as a wrap covering itself around the substrate. 39 As a result of the conformational changes (i.e., lid opening and partial unfolding-refolding) of the enzyme during the formation of the enzyme substrate complex, numerous hydrogen bonds are reversibly broken and reformed. It occurs easily in aqueous medium where the quick replacement of broken bonds by H- bonds to the surrounding water is ensured. Therefore aqueous media serve as a molecular lubricant in lipase-catalyzed reactions. 39 Lipase enzymes have weak binding forces in their inner parts and strong bonds (H-bonds) on the surface. Therefore, they are not entirely rigid, but rather represent delicate and soft structures. 46 Weak binding forces facilitate conformational movements during catalysis which is attributed to the dynamic character of enzyme catalysis Two Selected Enzymes: CALB and TLL Candida antarctica B lipase (CALB) in immobilized form (mainly Novozym 435 ) has been the most studied lipase for biodiesel production in various reaction systems. 47 It catalyzes acyl transfer reactions of various oils and acyl acceptors (alcohols or esters) showing high stability in organic solvents and broad substrate specificity. It has been reported that Novozym 435 is stable for at least two years which suggests that the cost of producing biodiesel fuel by a three-step or optimized single step continuous reaction may become lower than that by chemical processing. 48 On the other hand, it has been often reported that the immobilized forms of R. miehei and T. lanuginosus lipase on the same kind of carrier material catalyze conversion of TAG to DAG faster; whereas C. antarctica catalyzes DAG to MAG and MAG to FAEE conversions faster. 49,50 Currently, CALB is mainly supplied by Novozymes (Denmark), Fluka Chemie (Switzerland), and Roche Molecular Biochemicals (Germany) under respective commercial names. The CALB immobilized on hydrophobic macroporous polymeric carriers that are based on methyl and butyl methacrylic esters cross linked with divinylbenzene (Lewatit VP OC 1600) is II-12
40 BIOCATALYTIC BIODIESEL PRODUCTION named as Novozym 435 (previously SP435). 51 As the most versatile 39 heterogeneous biocatalyst of significant stability and activity in biotransformations, Novozym 435 is produced by Novozymes A/S (Denmark). It was previously supplied in two forms 39 : SP525 as a powder containing about 40 wt. % of protein and SP435 as the same enzyme immobilized on macroporous polypropylene carriers containing about 1 wt. % of protein. The reported activity of Novozym 435 in PLU term (propyllaurate units) is ca per gram. 52 It is commonly accepted that the existence of a lid controlling the active site access in CALB is somewhat uncertain 53. U. Hanefeld 54 has discussed that when CALB enzyme is immobilized on a hydrophobic carrier it should be inactive, since the active site might be inaccessible. Though, in connection with the likely conformational modifications, he mentioned that the enzyme instead orients itself in such a way that the active site is still readily approachable. Consequently, two different lipolytic enzymes in immobilized forms were used in this study. They are Thermomyces lanuginosus lipase (TLL) (formerly Humicola lanuginosus) and Candida antarctica lipase B (CALB) both of which are immobilized on the same type of hydrophobic supports. The reason for using this relatively hydrophobic support material (such as acrylic resin) is to prevent the hydrophilic interaction with glycerol and the immobilized enzyme matrix (see Section 3.2.4). In addition, TLL is much faster in alcoholysis or hydrolyzing the reaction from TAG to DAG and MAG than CALB. CALB on the other hand has higher specificity in converting MAG and DAG into FAEE. As a result, it might also be interesting to combine TLL and CALB lipases both immobilized on the hydrophobic carrier materials it is possible to decrease the rate limiting effect, which is the conversion from TAG to DAG Factors Affecting Biocatalytic Biodiesel Production According to the literature the major bottlenecks to biocatalytic processing include the high cost of biocatalysts 34 (e.g., the price of immobilized form could reach ca US$/kg) compared to conventional catalysis without effective schemes for their multiple use and stabilization; substrate inhibition or inactivation especially with aliphatic alcohols; and also the inactivation of the lipase by contaminants in the oil feedstocks. However, it is of concern to emphasize at this point that the stable and reasonably high productivity of the enzyme (kg of biodiesel/kg of immobilized enzyme) during a relatively long life span is more important than the sole price comparison. Therefore, a significant improvement in the biocatalyst operational life is required with the intention of substantially reduce the production cost of a biocatalytic biodiesel production. 55 In that aspect, immobilization of lipases and its repeated use, which is the major factor determining catalyst efficiency, can be considered as one of the strategies. On the other hand, it is obvious that a detailed screening of free and immobilized biocatalysts (lipase enzymes) considering principally the crucial determinants of catalytic activity is desirable in order to exhibit the potential industrial use of biocatalysis involved in biodiesel production. Such a survey should take into account the type; form (free or immobilized) and amount/load of lipase; the kind of alcohol and its feed; the ratio of the II-13
41 BIOCATALYTIC BIODIESEL PRODUCTION substrates; the presence of organic solvents; the water content in the oil; the presence of glycerol and also various operating conditions such as reaction temperature, time (typically 4 16 h) and stirring/agitation method. 2,22,27,41,56-62 Even though it has been often reported that lipases can be inhibited by both substrate and products of alcoholysis and some other substances contained in the oil feedstocks, such inconveniences can be overwhelmed through several methods that have been proposed (see Section 3.2.9). However, it is noticeable that in case of bulk (industrial) production where high degrees of conversions are required such inhibition patterns can become very detrimental. Accordingly, the optimal parameters in a potential industrial process depend on the origin and type of lipase; type of oil source; and also on the reactor type. The pioneering biocatalytic studies have been performed by means of lipases dissolved in liquid solutions. However, despite to their outstanding catalytic properties industrial use of free enzymes (as lyophilized powder or in liquid solution) have several bottlenecks to surmount. They present low stability; inhibition by high concentrations of substrates and products; low activity and selectivity toward non-natural substrates under non-conventional conditions, to name a few. 33 It is known that enzymes in lyophilized powder form tend to clump together in anhydrous media where they are mostly insoluble. Such characteristics of enzymes are not very suitable for their industrial use. Besides, it is commonly assumed that free lipases that have a lid covering their active site will only change into the active conformation (lid open and active site accessible) when they are in contact with a lipophilic interface. Accordingly, it is expected that the lid should ideally be fixed in an open conformation by adsorbing them onto lipophilic surfaces. Likewise, it is often claimed that lipases tend to retain the highest degree of activity when immobilized on hydrophobic supports. Their improved activities in both cases have been attributed to increased concentrations of hydrophobic substrate at the interface. It has been mentioned that successful industrial application of enzyme preparations essentially requires rather active and stable immobilized forms with simplicity and costeffectiveness as the key properties of involved techniques. 33 Lipases in immobilized forms are more stable to thermal deactivation because immobilization restricts movement and can reduce the degree of unfolding and denaturation. As a result, it is generally expected that the kinetic pattern in biocatalysis of the reactions is altered considerably upon immobilization onto solid supports. Therefore, much of the observed kinetics in catalysis with immobilized enzymes will be controlled by the substrate and product partitioning (in biphasic reaction media) and mass transfer effects. As presented by the reaction scheme in the first section, the chemistry of transesterification reaction stoichiometrically requires a 3 to 1 molar ratio of alcohol to lipid for complete conversion. However, some excess amounts of alcohols are generally required in order to shift II-14
42 BIOCATALYTIC BIODIESEL PRODUCTION reversible reactions towards products side. On the other hand, since aliphatic alcohols (MeOH and EtOH) are only partially miscible with vegetable oils at ambient conditions, the immiscibility phenomena consequently play significant roles in biocatalytic production. It has been postulated that the immiscible or excess amount of alcohols, particularly MeOH, leads to the inactivation or denaturation of the lipases by modifying their folded protein structure. 2,6,27,41,49,59,61,63 Moreover, alcohols in excess amount form a barrier around the lipase structure that may involve the active site, thereby hindering its contact with the acyl donor. Consequently, there exist several factors and determinants influencing enzymatic biodiesel production. The important factors can be divided into two categories: operational factors influencing the process and determinants affecting the catalyst and its activity. It is of concern to notice that the former and latter factor categories do evidently have impacts upon each other. Hence, such a categorization does not indicate distinct factors affecting biocatalytic way of biodiesel production and biocatalyst alone. The most important processing factors having significant influences can be given as follows: The key processing factors The prominent operational determinants can be ordered as follows: i. Oil source, quality and composition; ii. Choice of acyl acceptors (alcohol); iii. Alcohol to oil molar ratio and feeding method (single-shot, stepwise or continuous); iv. Reaction temperature; v. Immiscibility of substrates and products; vi. Water content of reaction media; vii. Presence of organic solvent, and viii. Mass Transfer resistances. Even though the first and the second factors were evaluated in Section 2 from the feedstock aspect, some further evaluation of alcoholysis reactions will be given considering their impacts on product yields and inactivation of biocatalysts in the following subsections. The optimal temperature, on the other hand, has been determined for various lipases ranging between 303 and 328 K for transesterification reactions. 2,22,27,59-61,64 Therefore, further evaluations of this factor is not needed. As mentioned in Chapter 3 that there are limited solubilities of MeOH and EtOH with feeds in excess amounts in vegetable oils. Moreover, glycerol as the by-product of transesterification and hydrolysis reactions is not miscible with ester species. Therefore, the reactions II-15
43 BIOCATALYTIC BIODIESEL PRODUCTION involved in biodiesel production proceed in biphasic (two-phase) liquid reaction media. Accordingly, the distributions of related species between separated phases need to be known accurately in order to develop effective reaction and separation systems. The formation of biphasic reaction media will also be briefly pointed out. Further details can be found in Section 1 and subsequent sections of Chapter 3. On the other hand, it is often claimed that some very small amount of water is necessary for the biocatalyst to maintain an active conformation. Consequently, beside of being crucial for enzyme activity, since waste/used oil feedstocks and rectified EtOH contain some certain amount of water, water content and its impacts on biodiesel production will be assessed. The use of organic solvents and their influences on reaction systems were also evaluated. Major determinants affecting biocatalyst and its catalytic activity Beside of all seven factors given above all these parameters do have significant influences on the both biocatalysis and catalytic activity of enzymes: i. Immobilization and support characteristics; ii. Pretreatment of immobilized preparations; iii. Enzyme specificity/selectivity; iv. Alcohol denaturation/inactivation; v. Product inhibition Glycerol adsorption Accordingly, some major determinants influencing biocatalytic activity such as glycerol adsorption that inhibits enzyme activity; mass transfer resistances that hinder rate of reactions and thus product yields; substrate specificities of biocatalysts; impacts of enzyme immobilization, enzyme denaturation and possible ways of regeneration were evaluated through related literature studies in the subsequent sub-sections. It is worth noting that the factors and determinants outlined above will not be assessed in the given order. Instead, a logical order considering the relationship of factors will be followed, where appropriate The Formation of Biphasic Reactive Media Even though transesterification is principally a reversible reaction, the backward reaction does not occur or is negligible in biodiesel production largely because the glycerol (free) formed is not miscible with the ester products, leading to equilibrated biphasic systems. Free glycerol may remain either as suspended droplets or as some little amounts that does dissolve in the ester phase. It is worth, however, noting that the dissolved amount of free glycerol exceeds the allowed limit in the current standards. II-16
44 BIOCATALYTIC BIODIESEL PRODUCTION As an advantage of enzymatic biodiesel production the insoluble by-product glycerol phase is relatively neat and almost all glycerol can be easily removed by settling or centrifugation. On the other hand, alcohols in excess amount can act as co-solvents to increase the solubility of glycerol in the biodiesel. In such cases, most of the dissolved free glycerol should be removed from the biodiesel product during the water washing process. Further details and evaluations can be found in Chapter A Brief Introduction to Methanolysis As mentioned above, biodiesel is defined as the long chain fatty acid alkyl (methyl or ethyl) esters of vegetable oils/fats in terms of commercial or market value (as an alternative to diesel fuel). MeOH is the most widely used alcohol (acyl acceptor) in transesterification processes on account of its relatively low price and availability in comparison to other alcohols. The first application of lipases in biodiesel (FAME) production dates back to Choo and Ong, filing a patent application on lipase catalyzed methanolysis in the presence of water. 65 The transesterification of sunflower oil with MeOH and EtOH using lipases from Pseudomonas, Candida sp, and Mucor miehei have been later conducted by Mittelbach. 66 He showed that the lipase from Pseudomonas fluorescens was superior to those from other two sources for sunflower oil alcoholysis which was carried out both in the presence of solvent (petroleum ether) and in solvent free conditions, and using five homologous alcohols with or without the addition of water. A vast amount of literature including extensive reviews has been published on enzymatic methanolysis using both free and immobilized forms of lipases. Therefore, further details of methanolysis reaction involving different alcohol to oil ratios, organic solvents, and several forms of lipase enzymes from different sources can be found elsewhere. 27,41,49,59-61,67 Accordingly, the main focus of this section will be on ethanolysis reactions. It is crucial at this point to underline that the optimum alcohol to oil molar ratios are significantly dependent on the individual system employed and the alcohol, feedstock and the type and form of enzyme used Alcohols vs. Alcoholysis Nelson et al. 68 have investigated the abilities of lipases in transesterification with aliphatic alcohols and found that M. miehei lipase gave highest yields with primary alcohols while C. antarctica lipase was the most efficient with secondary alcohols. In case of B. cepacia (P. cepacia) lipase, the highest yield for the alcoholysis of palm kernel oil in a solvent-free system was reported by Abigor and coworkers 69 for EtOH as 72%; whereas the yield was lower for C 4 alcohols. Analogously, Deng and coworkers have reported a critical evaluation of six commercially available immobilized lipases and seven simple aliphatic alcohols (including primary and secondary alcohols) in solvent-free synthesis of FAAE from sunflower oil. In this II-17
45 BIOCATALYTIC BIODIESEL PRODUCTION study they have reported considerable differences in alcoholysis performance. The highest FAAE yields above 90% were observed with a commercially available CALB lipase (Novozym 435 ) using MeOH, absolute EtOH and 1-propanol. 58 Furthermore, the rectified EtOH (96 v %) was the preferred alcohol for all lipases in overall, except Novozym 435, and ethanolysis reactions reached the maximal conversion efficiency. Furthermore the increase in water content resulted with an increase in oil conversion for all lipases except Novozym 435. On the other hand, the transesterification of refined cottonseed oil with primary and secondary alcohols by means of immobilized C. antarctica biocatalysis (Novozym 435 ) in a solventfree system has been studied by Köse and coworkers where they have reported 91.5% of FAME yield at 323 K after 7 h. 70 Salis and coworkers 32 have also studied the alcoholysis of triolein by means of P. cepacia lipase in a solvent free medium with a multitude of alcohols. They have reported that higher alcohols i.e., alcohols higher than C 1 and C 2, give better conversions. The lowest conversion of 40% was obtained with MeOH. In case of EtOH a 93% conversion has been obtained; whereas propanol, 1-butanol, 2-methyl-1-propanol, and a mixture of pentanol isomers resulted with 99% conversion. On the other hand, 2-butanol showed 83% of conversion. In addition, the alcoholysis of three vegetable oils (soybean, sunflower and rice bran) catalyzed by three commercial immobilized biocatalysts have been presented by Rodrigues et al. 29 Novozym 435, Lipozyme TL-IM from T. lanuginosus and Lipozyme RM-IM from R. miehei presented higher activity in methanolysis (with an alcohol to oil molar ratio of 5:1), ethanolysis (7:1) and butanolysis (9:1), respectively, in the T range of K. Finally, the methanolysis and ethanolysis in a solvent free system reported by Noureddini and coworkers using P. cepacia give a 67% and 65% of conversions, respectively Literature Survey on Ethanolysis To the best of our knowledge the number of reported studies on enzymatic ethanolysis reaction is relatively low. Nelson and coworkers 68 were the first researchers who studied the alcoholysis of TAG species with short-chain alcohols in solvent-free system. They have reported the ethanolysis of beef tallow with R. miehei lipase reached 65.5% of yield. Selmi and Thomas have successively reported ethanolysis of sunflower oil by means of the same lipase (Lipozyme RM IM ) with above 80% of conversion. 72 They assessed substrate molar ratio; reaction temperature and time; and enzyme load as the process conditions. However, the FAEE yields did not exceed 85%, even under the optimized reaction conditions. The involvement of water (10 wt. %) decreased ester yields significantly. Alternatively, they have reported that the addition of silica to the reaction medium could help to improve FAEE yields. The positive impact of silica on conversion was attributed to the adsorption of the hydrophilic glycerol by-product onto the silica particles, which prevented enzyme inhibition by glycerol. Enzyme reuse has also been investigated, but ester yields decreased significantly with enzyme recycle (4 cycles), even in the presence of added silica. II-18
46 BIOCATALYTIC BIODIESEL PRODUCTION Incidentally, it has been reported that Novozym 435 has efficiently catalyzed ethanolysis of TAG with ca. 60 moles of EtOH, and that fatty acids at the sn-1 and sn-3 positions of TAG species were preferentially converted to FAEE. 73,74 Their results evidenced that the lipase is stable in the presence of very large amounts of EtOH (MeOH). On the other hand, the use of immobilized C. antarctica lipase (Novozym 435 ) led to success in efficient ethanolysis of sardine oil, though the reuse of biocatalyst was not studied. 75,76 Analogously, Watanabe and coworkers have reported the stepwise ethanolysis of tuna oil using the same biocatalyst. 77 As an alternative oil feedstock recycled restaurant grease was used as the substrate through P. cepacia lipase catalyzed ethanolysis reaction by Wu and coworkers. 78 According to their results the concentration of EtOH does not have any significant effect on FAEE yield within the range of mole ratios of EtOH to grease of 3:1 to 6: 1, and water activity had modest effects. Although it is not produced for bulk operations but for cosmetic applications enzymatic alcoholysis of blackcurrant oil in rectified EtOH (96%) at 303 K mediated by P. fluorescens lipase resulted in a maximum yield of 52% FAEE after 8 h and a maximum conversion of 95.4% TAG to partial glycerides, FAEE and FFA after 16 h. 79 Shah et al. 80 have studied the transesterification of jatropha oil at 313 K using 4:1 EtOH to oil molar ratio as standard substrate feed ratio. They have studied C. viscosum, C. rugosa and Porcine pancreatic lipases (in free and immobilized on Celite 545 forms) in a solvent-free medium and found an increased ester yield from 62% obtained with the free lipase to 71% with immobilized C. viscosum lipase on Celite 545. Likewise, a successful four-step ethanolysis of sunflower oil catalyzed in a solvent-free medium by an immobilized 1,3-specific porcine pancreatic lipase was reported by Y. Yeşiloğlu. 81 Alternatively, A. Nag 82 has reported efficiently catalyzed ethanolysis of various TAG species and soybean oil using commercial C. rugosa lipase and its isoenzyme lipase 4 immobilized on Celite 545. Lipozyme TL IM catalyzed ethanolysis of soybean oil using 7.5:1 EtOH to oil ratio; 15 wt.% of enzyme load, and 4 wt. % of initial water (both based on oil weight) at K has been studied by Rodrigues and coworkers. 83 They have reported 96% of reaction yield in a solvent-free medium. Analogously, in an attempt to produce biodiesel from used palm oil and EtOH using immobilized lipases, Tongboriboon and coworkers 84 have verified that higher conversions could be achieved using the combination of Lipase AK (from P. fluorescens) and Lipase AY (from C. rugosa). They have also studied solvent-free ethanolysis of waste palm oil with T. lanuginosa and C. antarctica lipases immobilized on porous polypropylene powder. In their study the best yield was achieved at an EtOH to oil ratio of 3:1, and the yield decreased when the molar ratio was increased to 4:1 at 318 K where they have pointed to the inhibition of the enzymes by an excessive amount of EtOH. In overall, some selected solvent-free ethanolysis studies with yield/conversion levels higher than 80% were presented in Table 2-1 below. II-19
47 BIOCATALYTIC BIODIESEL PRODUCTION Table 2-1 Selected studies on enzymatic ethanolysis reactions in organic solvent-free media employing different oil and enzyme sources. *: see the references for corresponding explanations. References: Breivik et al ; Kumari et al., ; Shah and Gupta, ; Moreira et al., ; Hsu et al., 2004a 88 ; Rodrigues et al., ; Hsu et al., 2004b 89 ; Shimada et al., ; Hsu et al., ; Shah et al., ; Tongboriboon et al., ; Wu et al., ; Selmi and Thomas, ; Mittelbach, ; Yeşiloğlu, II-20
48 BIOCATALYTIC BIODIESEL PRODUCTION Immobilized Enzyme Preparations Advantages of Immobilization The productivity of a reactive system involving immobilized preparations is evaluated through both, activity and stability of biocatalyst. Immobilized enzyme preparations have been generally claimed to give better catalytic performances in non-aqueous media. 86 Likewise, the immobilized preparations are stable as the lipase adsorbed onto the carrier unfolds slightly by allowing several points of interaction between the lipase and support. 91 A natively dispersible lipase enzyme turns into a heterogeneous solid catalyst with increased stability when immobilized. 92 Consequently, an increase in catalyst lifetime, and a decrease in the cost of lipase per unit of product becomes available by that means where the latter allows their use in continuous processes. In addition, immobilized lipases are more stable to thermal deactivation because of the restriction of movement which reduces the degree of unfolding and, thus, its denaturation. For instance, CALB is deactivated only at around K in its free form, whereas the upper operational limit increases to K in immobilized form. 39 Lipase enzymes can be highly dispersed when they are immobilized. 93 Therefore, immobilization can be accepted as an appropriate way of enhancing the surface area of the biocatalyst. Since, the deposition of an enzyme onto a solid surface can increase the interfacial surface area between the protein and the reaction medium, thus increasing the reaction rate. 94,95 It has been stated that a better distribution of the biocatalyst can be generated via adsorption of lipases onto the surface of a macroscopic carrier material which generally gives significantly enhanced reaction rates, in some cases up to one order of magnitude. 96 The method used in lipase immobilization, which allows its stability and reusability, is rather essential in order to make them more feasible for industrialization. Adsorption is the most widely used method for immobilization of lipases employed in biodiesel production thanks to the relatively easy and cheap procedure with milder conditions requirement. 71,94, However, it has been also reported that lipase enzymes can be easily released due to fixation onto the surface of carriers by weak forces (van der Walls, hydrophobic interactions, hydrogen bonds). 97 Such a phenomenon leads to severe loss of catalytic activity which is not stemmed from enzyme inactivation. Therefore, the immobilization of lipases by adsorption is not the best solution for industrial application Immobilization on Hydrophobic Carriers The use of hydrophilic supports in lipase immobilization have numerous disadvantages including prevention of access of hydrophobic substrates, high losses of activity due to changes in conformation of the lipase attributable to polar MeOH and EtOH species; steric hindrance; 101 the adsorption of hydrophilic glycerol by-product inhibiting enzyme activity; and ultimately possible inactivation as a consequence of structural water removal. II-21
49 BIOCATALYTIC BIODIESEL PRODUCTION It has been reported that the catalytic properties of lipase enzymes such as activity, selectivity, and stability are strongly affected by the nature of support. 102 It is often reported that lipases are better adsorbed onto hydrophobic (lipophilic) carriers due to their exceptional physicochemical characteristics. 40,96, Such carrier materials also changes the amount of water required for the catalytic activity. D.S. Clark has noted that the chemical nature of the support can affect the partitioning of both the water and the substrate. 108 In view of that, it has been elucidated that lipases tend to retain the greatest degree of original activity when immobilized on hydrophobic supports. 102,104,109 The retention of activity has been mainly attributed to increased concentrations of hydrophobic substrate at the enzyme-substrate interface. 101,109 As an example, during hydrolysis reactions when the immobilized lipase is contacted with an oil and water emulsion, the oil phase tends to associate with and diffuse towards carrier s pores. Hence, an ordered hydrophobic network of lipid molecules surrounding the support can be assumed in case of lipases immobilized onto hydrophobic carriers. 110 It is commonly supposed that lipases are in their active conformation when immobilized on hydrophobic surfaces. Since the hydrophobic surface of the supports is able to stimulate the interfacial activation of the lipases, this adsorption method is selective. It yields enzyme preparations existing in open conformations. This fixed open conformation of lipases does not depend on the presence of external hydrophobic interfaces as in free forms. 111 Therefore, it is claimed that during immobilization procedure the hydrophobic lid which is known to be present in most lipases moves aside by an interfacial activation caused by the carrier and the immobilization procedure, providing improved substrate access to the active center of enzyme. In other words, the adsorption phenomenon onto lipophilic (hydrophobic) surfaces is expected to fix the lid of many lipases in its open conformation and ensuring the right orientation of the active site during the reactions. 110, Some Key Elements in Immobilization The internal structure of carriers has in essence significant influences on the efficiency of immobilization processes and hence on their catalytic performances. 113 For instance, the internal mass transfer resistance can be prevented by using carrier materials with narrow pore sizes. Since, in that case most of the enzymes will be immobilized onto the surface of the supports. 113 Particle size and pore distributions for those reasons are significant factors so as to minimize the risk of substrate mass transfer limitations. On the other hand, it is generally expected that the kinetic pattern in biocatalysis is altered considerably upon immobilization onto solid supports. In essence, after immobilization, much of the observed kinetics will be controlled by the substrate and product partitioning and mass transfer effects. 113 It has been reported that the basic kinetic parameters K m (the Michaelis constant), V max (the maximum reaction speed), and k cat (the rate constant) values will be changed and the apparent values of these parameters can only be observed. 114,115 II-22
50 BIOCATALYTIC BIODIESEL PRODUCTION The substrate and carrier (polymer) with identical charges could result in a higher apparent K m values due to repulsive electrostatic forces; if they are of opposite charge, a lower K m could be observed. 115 The expressed activity of the immobilized enzymes can be significantly decreased as a result of internal mass transfer limitation which is quantitated by an effectiveness factor. This factor is defined as the ratio of the actual reaction rate and the rate expected without diffusional limitations. It is inversely proportional to particle size. 115 Therefore, internal mass transfer limitation can be the rate-limiting step in heterogeneous biocatalytic processes. It has analogous impact on the kinetic behavior of the catalyst owing to the changes occurred in the surrounding microenvironment. 115 In this regard, It has been reported that the activity of immobilized enzymes in reactions involving high molecular weight substrates is expected to be limited due to steric hindrance effects. 113,115 In essence, steric hindrance can have a much greater negative impact on the rate of reaction than the nucleophilicity of substrate. 113 Moreover, The composition of the substrate(s) having steric hindrance impedes the access to the active site and hence any improvements in the nucleophilicity will not improve the activity. 116 It is obvious that the immobilized lipase will be acting on different substrates at the same time during the courses of heterogeneous reactions (transesterification, hydrolysis, and esterification). The TAG, MAG, DAG, FFA, and FAAE species are all substrates for lipase catalyzed reactions. Hence, the relative amount of all these species will be changing in time during the course of reactions, both increasing and decreasing in time. The affinity of the enzyme for each of these substrates might be different. Furthermore, the conformation of the substrate can also have an effect on the rate of reaction. For instance, the hydrophobic tunnel in the lipase enzymes accepts aliphatic chains and aromatic rings more easily than branched structures. 117,118 The conformational changes in the structure of the lipase and hence the possibility of direct contact with inhibiting substrates, such as aliphatic alcohols can be attributed to this loss of activity. In order to prevent the decrease in catalyst activity, a reliable technique of carrier pre-coating with dummy, non-lipase protein prior to adsorption of the lipase has also been suggested. 119,120 In concluding this section, a feasible immobilization method using hydrophobic support materials with feasible physicochemical characteristics which assure the enhanced operational stability, catalytic activity, and often compensates the activity loss of enzyme due to repeated uses has crucial impact on the engineering of biocatalytic biodiesel production Pretreatments and Stability In order to improve the activity, stability, and alcohol (MeOH and EtOH) tolerance against denaturation of lipase preparations where the latter is particularly important in alcoholysis reactions, various methods and procedures of pretreatment for immobilized and also for II-23
51 BIOCATALYTIC BIODIESEL PRODUCTION free forms of lipases have been suggested. In essence, the major purpose of pretreatments with different substrates/reagents is the activation of lipases by keeping them in their most suitable active conformation with the highest possible catalytic activity. In other words, it can be simply defined as a change in conformation from closed inactive to open active form. The most promising results on activity, MeOH tolerance against inhibition, and operational stability of immobilized lipase were achieved when the lipase was treated with 1 mm salt solutions of CaCl 2 and MgCl 2. The possible incorporation of salt molecules with enzymes which could resist conformational change induced by high alcohol concentration was suggested as the cause of forming more stable molecules with drastic improvement of lipase activity, MeOH tolerance, and operational stability Pretreatment with Organic Solvents In general, pretreating the immobilized preparations in (polar) organic solvents is thought to transform the lipases hydrophobic closed active site to a hydrophobic open active site, thus keeping them in active conformation. 97 Novozym 435 lipase has been pretreated with iso-propanol, 2-butanol, tert-butanol alcohols where it was shown that the activity of pretreated biocatalyst increased about tenfold in comparison to the non-treated ones. 122 The reported biodiesel (FAME) yield was about 7 to 10 times higher. As an alternative, the same biocatalyst which has been pre-incubated in methyl oleate for 0.5 h and subsequently in soybean oil for 12 h achieved a faster methanolysis with 97% biodiesel yield in 3.5 h of reaction time course. 123 It could be considered that both of the pre-incubation steps reduced the inactivation due to MeOH by keeping the active conformation via attachment to respective active site residues and, thus, preventing further unfolding of the protein. Alternatively, it might also be due to covering the hydrophobic parts of the surface of protein and, as a result preventing the loss of water micro-layer surrounding the lipase, which is essential for the optimal conformation of the enzyme. Besides of their stability, the utilization of biocatalysis in bulk production requires nonspecificity and non-selectivities toward the TAG species. It is clear that these procedures can significantly improve productivity, stability, non-selectivity, and non-specificity of industrial enzyme preparations and make biocatalytic processes for industrial biodiesel production economically more feasible. II-24
52 BIOCATALYTIC BIODIESEL PRODUCTION Specificity/Selectivity and Acyl Migration Positional Specificities and Substrate Selectivities Lipases display selectivity/specificity for their substrates at three different aspects: fatty acyl chain type, position of the scissile chain on the glycerol backbone, and stereo-isomer of the ester substrate. It is often stated that the regio-specificity of individual lipases - particularly in free form- can change due to micro-environmental impacts on the reactivity of functional groups or substrate molecules. 113 In view of that, lipase enzymes -both in free and immobilized forms- can be placed into two groups according to their positional or regio-specificity: 1,3-specific and nonspecific. 27 The 1,3-specificity is common among microbial lipases where the most common ones are R. oryzae, T. lanuginosus, A. niger, R. delemar and R. miehei. 27,60,61,124,125 It has been stated that this positional specificity is the result of the inability of the sterically hindered ester bond of the sn-2 position at glycerol backbone to enter the active site of the enzyme. The substrate selectivity of lipase enzymes has been investigated through mapping of the binding site of TAG species in order to acquire an understanding of the selectivity determinants. Two structural elements were determined in this regard as being the major elements of lipase specificity: the substrate binding site and the lid. Four binding sites (pockets) for the substrate have been identified after a detailed structural analysis of the binding of a lipid analogue to B. cepacia lipase: the oxyanion hole and three pockets lined by hydrophobic amino acids that accommodate the sn-1, sn-2 and sn-3 fatty acid chains. 37 The H-bonding between the ester oxygen atom of the sn-2 chain and the histidine of the active site presents the key interaction and the sn-2 pocket is identified as the major determinant of the enzyme s stereo-preference. 126 The function of the amphipathic lid (loop) structures in free form of lipases -either dry (powder) or liquid solution- is not only to act as a gate that regulates access to the active site. 37 Their hydrophilic side faces the solvent and the hydrophobic face is directed towards the protein core in the closed enzyme structure. The shift of enzyme to the open conformation exposes the hydrophobic site and contributes to the formation of a larger hydrophobic surface and the substrate binding region. On the other hand, in addition to the scissile fatty acid binding site, the chain length specificity of lipases depends on other structural elements, such as the alcohol binding site and the lid. Although it can be concluded that the size, shape and hydrophobicity/hydrophilicity of the various substrate binding pockets are key players in determining lipase enantio- and regiopreferences, the regio- and enantio- selectivity information of microbial lipases that is obtained from studies in aqueous or biphasic media is inherently unreliable. In addition, T. Yamane 127 has reported that the positional specificity of lipases cannot be divided clearly into two categories. He has claimed that the specificity of lipases changes continuously from very distinctly specific to very weakly specific or completely non-specific where this phe- II-25
53 BIOCATALYTIC BIODIESEL PRODUCTION nomenon becomes more complicated due to non-enzymatic acyl migration in acylglycerides and physical conditions of reaction media Acyl Migration The biocatalysis of methanolysis reactions with yields often greater than 90%, exceeding the estimated 66% yield, has been reported with such regio-selective lipases. 27 Fukuda et al. have suggested that the reason for the unexpectedly high yield is spontaneous acyl migration 60 which has been later verified by thin layer chromatography 128. TAG species are potentially chiral molecules and contain stereo-chemically different positions termed sn-1, sn-2, and sn-3 where sn stands for stereospecific numbering. The sn-1 and sn-3 carry acylated primary hydroxyl groups and the esterified secondary hydroxyl group occupies sn-2 position. The first and last (sn-1 and sn-3 positions) in TAG species are sterically distinct and thus enzymes might have different affinities. Additionally, it is known that partial glycerides exist in isomeric forms. DAG species can exist in three isomeric forms, a symmetrical (sn-1,3-) derivative and two enantiomers (sn-1,2 and sn-2,3). The last two forms are thermodynamically less stable than the symmetrical molecules and can undergo acyl group migrations, resulting in equilibrium mixtures in favor of the symmetrical, achiral sn-1,3-isomer. Analogously, two isomeric forms can be identified for MAG species where two enantiomeric forms (sn-1 and sn-3) are more thermodynamically stable than sn-2 derivative. In partial acylglycerides (DAG and MAG) the acyl moieties migrate from the sn-2 position to either the sn-1 or sn-3 positions particularly in aqueous or micro-aqueous environments (see also Chapter 4). 128 In other words, substrates with glycerol backbone stored in protic media or in the presence of traces of acids or bases exhibit rapid acyl group migrations. In contrast, they are quite stable in aprotic organic solvents of low water contents (<2%). 129,130 Besides, it has been reported that in hydrolysis reactions taking place in biphasic reaction media using free lipases (in liquid solution), the presence of a hydroxyl group in the sn-2 position has a negative inductive effect, therefore TAG species are hydrolyzed at a faster rate than DAG that are hydrolyzed at a faster rate than MAG species. 117 It is known that free (soluble) form of enzymes are able to undergo aggregations and interactions with hydrophobic interfaces 33 where the substrate specificity of free forms of lipases (powder and in liquid solution) is different. Reaction system with liquid lipase solution is a two-phase (biphasic) system consisting of aqueous phase with dissolved enzyme and an organic phase with dissolved substrates. However, the immobilized form of lipase enzymes would behave in a completely different fashion, because they already are bound to a surface. As mentioned above, in that case substrate and product partitioning (in biphasic media) and mass transfer phenomena control much of the observed kinetics. In contrast, the conformation of enzymes can be affected during immobilization, and parts of the catalyst can be made inaccessible to the substrate due to steric hindrance. As a final point, it has II-26
54 BIOCATALYTIC BIODIESEL PRODUCTION been suggested that the involvement of polar carrier materials for immobilization supports and the addition of silica gel to the reaction media promote acyl migration and, thus, reaction productivity. 57,61 In conclusion, all three types of selectivity have been widely studied for various lipases, particularly in free forms, with the general conclusion being that lipases do not display welldefined specificities but rather show selectivity for certain substrates. 127 Therefore, most data in the literature describing regio-selectivity of lipases are at best of qualitative nature. However, many more structural data are needed to gain an understanding of the specificity of lipases. This is especially important for reactions catalyzed in organic solvents, in which the stereo-selectivity may be different than in water Denaturation/Inactivation vs. Regeneration Dissolved (free) enzymes are intrinsically unstable in aqueous media and can be deactivated by denaturation, caused by increased temperature, extreme ph, or an unfavorable dielectric environment, such as high salt concentrations (ionic strength) or new H-bond formations. The latter cause results with unfolding of enzyme due to short chain aliphatic alcohols (MeOH and EtOH) and its possible interaction with structural water surrounding the protein s surface. Moreover exhaustive drying of an enzyme by chemical means would force the protein to change its conformation resulting in a loss of activity. Consequently, it can be generalized that thermal degradation and alcohol inactivation are often the major causes of the loss of enzyme activity over time. 131 The presence of water on the other hand is also important as fundamental studies showed that water is involved in many enzyme inactivation processes. This may explain the improved stability of free enzymes in nonaqueous organic media. 132 It has been often stated that the inactivation of lipases in biodiesel production essentially has a physical origin and is due to the immiscibility of low alcohols and triglycerides (oil) species. Nonetheless, lipases sourced from Pseudomonas sp. have shown more resistance to alcohol inactivation than lipases from T. lanuginosus and R. miehei. 59 The degree of inactivation because of alcohols is estimated to be inversely proportional to the number of carbon atoms in the alcohol which means that MeOH is the most deactivating alcohol. 2,49,122 Soumanou and Bornscheuer have claimed that particularly water-miscible alcohol substrates, such as MeOH and EtOH, can strip water required to maintain lipase structure thus leading to lower activity and eventual biocatalyst inactivation. 133 However, it has been reported that when a MeOH to oil molar ratio below 3 is used or an EtOH to oil ratio below 11 is used there is little to no deactivation of lipase enzymes. 61 II-27
55 BIOCATALYTIC BIODIESEL PRODUCTION Prevention and Regeneration Possibilities In general, two solutions have been suggested to overcome the inactivating impacts of lower chained alcohols: Stepwise (or sequential) addition of alcohol aliquots 63,124, and the use of appropriate organic solvents (see Section 3.2.8). 2,27,59,61,66,68,136 Additionally, a very interesting but not promising way of preventing the inactivation of enzymes has been reported in which extremely high amounts of enzyme is employed. However, this solution is impractical since it would drastically increase production cost. 59 The choice of lipase also has an influence on denaturation. In case of stepwise methanolysis, a mixture of MeOH, FAME, MAG and DAG is formed after the first addition step (1/3 of the stoichiometric amount) where the system thus composed has been stated to be less aggressive toward the enzyme compared to the initial conditions when only the oil and alcohol were present. 63 On the other hand, Bélafi-Bakó et al. 137 have suggested performing a three-step flow reaction in order to overcome MeOH inactivation. They have reported the highest conversion (97%) obtained via continuous feed as compared to the stepwise procedure where MeOH is added in eight steps (94% conversion). Analogously, Bernardes and coworkers 138 have reported a similar trend in the transesterification of soybean oil with EtOH using Lipozyme RM IM as the immobilized biocatalyst. Although repeated use of lipase becomes possible after immobilization, it loses its activity in e.g., 100 days of usage. 59,139 The assessment of enzyme stability over repeated batches was carried out by washing immobilized enzymes with different solvents. In other words, several cases have shown that washing biocatalysts between cycles (uses) helps to increase its endurance: When washing commercial immobilized biocatalysts (Novozym 435, Lipozyme TL IM, and Lipozyme RM IM ) with n-hexane, approximately 90% of the enzyme activity remained after 7 cycles. 29 Contrarily, washing of lipase from a novel strain of R. oryzae immobilized on Celite 545 with the same solvent between cycles proved inefficient, only keeping the lipase sufficiently active for three cycles during the esterification reaction of acetic acid with butanol. 140 Furthermore, the possibility of regenerating deactivated immobilized preparations by washing with higher alcohols (C 3 -C 4 ) is equally important. The treatment (wash) with tert-butanol following the complete inactivation by MeOH successfully regenerated the enzyme and restored up to 75% of its original activity level. 122 In addition, it was reported that washing Novozym 435 and Lipozyme TL-IM enzyme mixtures with tert-butanol after each reaction cycle allowed the reuse of same preparation for 20 cycles without any loss of activity during the transesterification of lard as the oil feedstock. 141 Likewise, Li and coworkers 142 washed immobilized lipase (R. oryzae IFO 4697 whole cell) with tert-butanol between uses and found no obvious lose in FAAE yield even after 200 cycles of use. Besides, in case of using iso-propanol + water as the washing media between cycles allowed the reuse of the mixture II-28
56 BIOCATALYTIC BIODIESEL PRODUCTION of immobilized R. oryzae and C. rugosa lipases for 5 cycles with conversion over 80%. 143 It is worth noting that a maximum FAME conversion of 98.92% was reported in the mentioned study Inactivation vs. Inhibition In principle, inactivation is an inherent characteristic of any enzyme in which especially temperature is important. Therefore, the possible poisoning of immobilized lipases by lower alcohols does not allow complete regeneration of its initial activity. However, Chen and Wu 122 have proposed a procedure for enzyme regeneration that is claimed solving the inactivation caused by MeOH. They have claimed that an alcohol with three or more carbon atoms, preferably 2-butanol or tert-butanol, can regenerate deactivated immobilized enzyme. Their procedure consists of an immersion pre-treatment of the biocatalyst in alcohol by which the activity of Novozym 435 was increased about 10-fold compared to the untreated enzyme. That is to say, washing with 2-butanol or tert-butanol successfully regenerated completely deactivated enzyme by MeOH species. It has been claimed that about 56% and 75% of its original activity was restored, respectively. As a result, although their results are contradictory with the literature, the denaturation or inactivation by alcohols might be considered as substrate inhibitions allowing the recovery of initial activity. There have been several reports on esterification of FFA with MeOH or EtOH For instance, Bloomer and coworkers have achieved an efficient organic solvent system of producing FAEE with immobilized R. miehei lipase. 144,145 It has been reported that formation of partial glycerides (MAG and DAG) can lead to an increase in the rate of reaction during interesterification of two triglycerides; whereas the presence of high levels of FFA can inhibit initial hydrolysis of TAG species. 150 The lipase activity loss in the presence of high concentrations of FFA has been attributed to several factors, such as high FFA levels would produce significant amounts of free or ionized carboxylic acid groups which would acidify the microaqueous phase surrounding the lipase or cause desorption of water from the interface The use of Organic Solvents In organic solvents, lipases can catalyze the transfer of acyl groups from suitable donors to a wide range of acceptors other than water. Moreover, beside of reducing inhibitive/inactivating impacts of MeOH and EtOH on biocatalysts, a suitable organic solvent or an emulsifier can help to overcome the possible external mass transfer problems. Furthermore, it ensures a homogeneous reaction media and, thus, reduces the reaction mixture viscosity and ultimately stabilizes the immobilized biocatalysts. 2,27,59,61 Homogeneous reaction media decreases problems associated with a multiple phase reaction mixture and a reduced viscosity decreases external mass transfer problems of substrates to the catalyst sur- II-29
57 BIOCATALYTIC BIODIESEL PRODUCTION face. 59 Therefore, the majority of reported biocatalytic studies on biodiesel production have been performed in organic solvents. The use of organic solvent considerably influences the yield of biodiesel. Soumanou and Bornscheuer have reported that the immobilized lipases show high degree of efficiency in the presence of non-polar solvents. 133 In their study the most suitable organic solvents were found to be hydrophobic ones, such as iso-octane, n-heptane, petroleum ether, n- hexane and cyclohexane. Solvent hydrophobicity is characterized by log P value. In this respect, it has been indicated that in hydrophobic solvents with 2 < log P < 4 lipases show a good stability and activity. 151 Analogously, P. Villeneuve 152 has stated that in organic solvents with log P > 3 enzymes generally remain active and will not be rapidly deactivated tert-butanol as a Promising Solvent Some hydrophobic solvents with low log P value (< 2) may deactivate the enzyme in the way of disrupting the functional structure of enzyme or stripping off the essential water from the enzyme. On the other hand, tert-butanol (log P = 0.584) is also frequently used organic solvent for enzymatic production. It has the ability to dissolve both, polar and nonpolar species. tert-butanol is only moderately polar, has stabilizing effects 67 on the enzyme and is not easily influenced by the polarity of other solvents (like water) or by any of the substrates or products. 59 It has been shown that the presence of tert-butanol significantly reduces the negative impacts caused by both MeOH and glycerol, because of dissolving both MeOH and glycerol. For instance, Li and coworkers have reported 90% yield under optimal condition in the transesterification of rapeseed oil with Lipozyme TL IM and Novozym 435 as catalyst. 153 In addition, tert-butanol was used as a solvent in cotton seed oil transesterification with lipase from C. antarctica, in the batch and packed bed reactors with the yields above 90% in both cases. 154 The pioneering industrial scale pilot plant with t/a capacity in China (Hai Na Bai Chuan Co.Ltd. in Hunan province) is operating using tert-butanol as solvent, MeOH as the alcohol substrate, and Lipozyme TL IM as biocatalyst Diesel Fuel and FAAE as the Solvent Kojima et al. 155 have proposed an interesting solvent process. The enzymatic methanolysis of waste oil from activated bleaching earth (ABE) was performed by means of diesel fuel as solvent (0.6 ml/g of waste ABE). In this system, the lipase from C. cylindracea showed high stability and activity reaching approximately 100% yield of FAME in 3 h. Furthermore, it has been reported that inactivation of immobilized lipase enzymes can be avoided in the presence of a fatty acid alkyl ester (FAME or FAEE). 27,59 Therefore, a pre-mixed solution of FAAE and alcohol can be fed in batch or continuous operation in order to protect enzymes and also increase the initial solubility of excess alcohols in vegetable oils (cf. Chapter 3). In this II-30
58 BIOCATALYTIC BIODIESEL PRODUCTION regard, Park and coworkers 156 have investigated the feasibility of FAME as a co-solvent used to increase the mass transfer between oil and MeOH. Although the use of such solvents improves the enzyme stability and removes likely mass transfer limitation problems, they require a priori availability beside of decreasing the capacity of reactors Disadvantages of Organic Solvent Use However, despite the promising results, such as faster reaction rates 66, the involvement of organic solvents for industrial scale production should be avoided because of their flammability, toxic effects on the environment and consequential requirement for solvent removal. Besides, from the process economics aspect, the use of organic solvents is unfavorable due to the necessity of their recovery and removal from the final product which further increases production cost. Nielsen and coworkers 49 have reported that the presence of organic solvents introduces problems like reduction in capacity, environmental issues and costs (recovery and losses). As a consequence, industrial scale enzymatic solvent-free processes need to be developed in order to allow enzymatic processes to be competitive. It has been shown that there are many benefits in using solvent-free processes in comparison with processes involving organic solvent(s), including the costs reduction and the improvement in the process control. 49,70,72 Additionally, it has been stated that similar yields can be obtained with or without solvent in case of methanolysis reactions. 85, Enzyme Inhibition by Glycerol Product Glycerol is formed as a by-product during the alcoholysis of triglycerides. It was observed that in case of lab-scale batch reactions or if reactions are performed in packed-bed reactors glycerol tends to adsorb particularly onto the hydrophilic supports. In other words, the activity of lipases immobilized on hydrophilic matrices will drop considerably when exposed to glycerol both in lab-scale batch or pecked-bed reactors. Glycerol molecules are adsorbed on the surface of these carriers and form a hydrophilic coating layer which made enzyme molecules inaccessible to hydrophobic substrates, thereby preventing the lipase from interacting optimally with the substrate. On the other hand, Watanabe and coworkers 48 have reported the inhibition of immobilized Candida antarctica lipase enzyme activity immobilized on hydrophobic acrylic resin supports caused by the by-product glycerol during the continuous methanolysis of a mixture of soybean and rapeseed oils in a packed-bed reactor. Analogously, Bélafi-Bakó et al. 137 have reported that while FAME does not inhibit the biotransformation, the by-product glycerol adsorption hindered both the rate and extent of conversion. Accordingly, two plausible inhibition mechanisms have been proposed for the adsorption of glycerol: the adsorbed glycerol may cause a decrease in the (thermodynamic) water activity of the biocatalyst, or glycerol may form a layer around the enzyme that impedes transfer (diffusion) of hydrophobic substrate(s). II-31
59 BIOCATALYTIC BIODIESEL PRODUCTION Elimination Possibilities In order to retain the high initial enzymatic activity various procedures have been reported. The prominent methods are the addition of silica gel to the reactor bed in order to address the preferential adsorption of the glycerol; the involvement of suitable organic solvents; and a semi-continuous process consisting of a transesterification reaction and rinsing of the catalyst so as to remove the adsorbed glycerol out of the reactor. Dossat and coworkers 157 have reported the restoration of initial enzymatic activity by using a rinsing solution amended with water with the thermodynamic water activity adjusted to an optimum value. It has been alternatively proposed that glycerol inhibition could be eliminated by continuous operation in a membrane bioreactor equipped with a suitable dialysis membrane. Bélafi-Bakó and coworkers 137 have reported that 85 ml/l flow rate at 323 K with a flat sheet membrane gives good results and 100% glycerol recovery rate is achieved after ca. 150 min. In brief, it is crucial preventing the hydrophilic glycerol from covering the biocatalyst bead surfaces and thus disallowing the access of the acyl donor to the active sites of biocatalysts The Impacts of Water Content Structural Water vs. Bulk Water Some very small amount of water is needed for the expression of enzyme catalytic activity. This residual water, or structural water, accounts for about 5-10% of the total dry weight of a lyophilized (freeze-dried) enzyme. 158 The structural water differs significantly in its physical state from the bulk water of the surrounding solution. 39 As a characteristic part of the enzyme, the former water is tightly bound to the outer surface by hydrogen bonds. It is necessary to retain enzyme s 3D structure and thus its catalytic activity. This bound water layer that cannot be removed even by lyophilization covers the outer surface of the enzymes. Moreover, the rotation of bound water is restricted and it cannot easily be reorientated upon freezing. On the other hand, the interaction between a protein molecule and the surrounding water leads to a greater conformational mobility of enzymes. Any further increase of hydration level results in the enhancement of protein flexibility and, thus, affecting enzyme stability. As a consequence, the hydration degree of reaction medium and biocatalyst is a critical parameter to take into account in order to optimize non-aqueous enzymatic processes. 43,159 In overall, the reaction media compositions are very decisive regarding to the equilibrium state of reactions and substrate specificity. Lipases perform synthetic reactions in low water containing media. However, an increase in bulk water content favors oil hydrolysis reactions, rather than transesterification. 60,133 In other words, in an aqueous medium with an emulsified TAG substrate, hydrolysis is the dominant lipase catalyzed reaction. Accordingly, such properties of lipase enzymes make them suitable for use in both hydrolytic and synthetic reactions. II-32
60 BIOCATALYTIC BIODIESEL PRODUCTION Water Content of Substrates and Reactive Media Since water is usually added to these systems to increase catalytic efficiency of enzyme and to optimize water concentration, results of numerous studies indicate that in practice it is more convenient to present the transesterification yield as a function of water content (%) in the reaction mixture. 63,86,99,160 Moreover, the majority of studies reporting water influence on reactions cites water concentration instead of water activity. Water is slightly soluble in neat oil where the solubility amounts to about 0.7 and 1.4 at 273 K and 305 K, respectively (cf. Chapter 3). It has been often reported that there is a considerable increase in biodiesel synthesis with increased addition of water, showing the improvement in the activity of the enzyme. In contrast, some researchers have reported that biodiesel synthesis decreases with the addition of water. 161,162 Shah et al. 80 have reported that in case of the lipases, an increase in water content above the optimum level promotes hydrolytic activity and transesterification yield drops successively. Likewise, Salis and coworkers 32 have reported that diffusive limitations of the substrate can occur at high water content and water can promote the hydrolysis of the substrate thus decreasing the yield of the biodiesel. Therefore, the synthesis of fatty acid esters is usually performed in low-water medium to avoid hydrolysis of the ester formed, as observed in the synthesis of biodiesel from triolein by Iso and coworkers 64 using immobilized P. fluorescens lipase. Water content of reactive media higher than 1% can produce high degrees of hydrolysis; whereas water levels lower than 0.01% can prevent full hydration of the lipase and reduce the initial rate of hydrolysis. 163 At the optimum water content, the hydrolysis of ester linkages is kept at the minimum level and this ensures the highest degree of transesterification and yield of biodiesel synthesis. 27 Analogously, several studies have revealed that addition of a small aliquot of water to reaction media increases the rate of ester synthesis and thus there observed an increase in biodiesel (FAME) production with increased addition of water. 64,86,99,133,164 Accordingly, the optimum water content is a compromise between minimizing hydrolysis and maximizing enzyme activity for the transesterification reaction. 71,165 For instance, Robles-Medina et al. 61 have reported that the reaction equilibrium is altered and low enzyme activity was observed with the increase of water content in case of vegetable oil methanolysis. Moreover, the transesterification of soybean oil with MeOH and EtOH in solvent-free media using P. cepacia lipase have revealed that an increase in the initial water content from 0.01 g to 2 g (in the reaction media containing 10 g of soybean oil and 3 g of MeOH or 5 g of EtOH) increased the concentration of FFA. 71 Additionally, in case of ethanolysis, they observed a decreased synthesis of esters when water content was above the optimum ( g) while the addition of g of water for the methanolysis reaction II-33
61 BIOCATALYTIC BIODIESEL PRODUCTION resulted in an increased FFA concentration, but did not decrease transesterification yield. Therefore, the amount of optimum aliquot must be determined precisely. Around 5% of initial water content has been proposed as the optimum by Shah and Gupta 86 in their work using various lipases with jatropha oil. They determined the effect of water content on transesterification of jatropha oil with EtOH catalyzed by P. cepacia lipase and found that a rise in the amount of water added in the range of 1 10% (w/w enzyme), increases transesterification yield. The yield reached to 98% after 5 h for water content of 5% and was only 70% when water was not added. In contrary, it has also been shown that Novozym 435 works under much lower water concentrations than other lipases. It displays the highest activity with low availability of water, 58,86,166 while other lipases, such as P. cepacia lipase, 58,86 show higher activity with higher water activities (a w ). Methanolysis activity of Novozym 435 was inhibited at a much lower water content of only 0.1%. 161 This effect of water on lipase activity is attributed to the fact that lipase acts at the interface between aqueous and organic phases. However, in case of free lipases, Kaieda et al. have tested C. rugosa, P. cepacia, and P. fluorescens lipases and have claimed that if the system is water free, no reaction take place while the rate of reaction increases with increased water content (1 20 wt. % of water). Consequently, the optimum level of initial water (moisture) has been verified to be based on the type of biocatalyst used. A neat vegetable oil and its waste differ significantly in water and FFA contents. Determination of optimum water content (%) in transesterification system is necessary since waste oils are usually contaminated with water. Shimada and coworkers 63 have investigated methanolysis of waste vegetable oils catalyzed by C. antarctica lipase B in a solvent-free system and found that water generated through ester synthesis from FFA contained in these oils was bound by glycerol and did not impair the transesterification process. Moreover, the concentration of FAME gradually increased during the process. Chen and coworkers 167 have more recently reported an optimum water content of 10 wt. % for the FAME synthesis from waste cooking oil in a fixed-bed reactor system. The maximum FAME amount reached was about 138.4% higher than that in absence of water. The importance of removing water during esterification of high-ffa feedstock has been demonstrated in a novel approach by Watanabe et al. 149 In their study, glycerol was added to absorb water from the esterification of an acid oil hydrolysate with MeOH. Analogously, Du and coworkers 168 have demonstrated the positive effect of adding molecular sieves for water removal in esterification of soybean oil deodorizer distillate with methanol and achieved significantly higher conversion rates compared to control experiments without water elimination. In conclusion, the influence of water content on the production of biodiesel from soybean oil using R. oryzae, 160 C. rugosa and P. fluorescens, 164 Novozym 435, 161 and B. cepacia 71 lipases have all shown that enzyme activity was low in the absence of water, which supports II-34
62 BIOCATALYTIC BIODIESEL PRODUCTION the fact that a minimum amount of water is required to activate the enzyme. Therefore, water removal is a balance, as very low water activity will inactivate the enzyme. Additionally, low water content in the oil phase is required driving the biodiesel reaction to higher yields. Finally, the optimal water content must be evaluated for each given lipase with regard to optimal yield as well as enzyme stability and activity. It is also worth noting that according to P. Halling the behavior of the enzyme is likely to depend only on the amount of water bound to it Mass Transfer Resistances In Brief In general, lipases efficiently catalyze the reactions when the substrates dissolve each other. However, in case of transesterification reactions involving MeOH/EtOH and vegetable oils biphasic reaction media occur where species phase distributions are the vital determinants. Phase distributions of species are measured by means of the respective partition coefficients which are dependent on the solubilities of substrate(s) and product(s) within the two phases and this represents a potential rate-limiting factor. Further details of phase behaviors were given in Chapter 3. Therefore, in biphasic reaction media the partition coefficient (a thermodynamic dimension) and the mass-transfer coefficient (a kinetic dimension) will dominate the k cat of the biocatalyst. Besides, the apparent K m in the reactions with a lower substrate concentration near the support (immobilized lipase) will appear higher compared to the bulk phase and hence the activity will appear lower than its actual values. The opposite will occur with a higher substrate concentration at the interface. 169 Diffusion resistance becomes controlling at high enzyme loading on the surface, low bulk substrate concentration, low substrate diffusivity, low K m, high enzymatic specificity, low rate of stirring or agitation, and large average particle diameter. 170 As a result of immobilization, external and internal mass transfer resistances hinder the accessibility of the substrates to the enzyme surface. The former occurs when the rate of substrate diffusion from the bulk medium to the surface is less than the rate of reaction. This generally depends on reaction mixture s degree of agitation and thus the thickness of stagnant film surrounding the enzyme particle. For instance, in case of conventional transesterification a reaction mechanism for sunflower oil has been proposed involving an initial region of mass transfer control followed by a second region of kinetic control. The initial mass transfer controlled region is not significant using 600 rpm of agitation speed. 171 Analogously, Bambase and coworkers 172 have reported effectively minimized mass transfer limitation at agitation speeds of rpm with no apparent lag period in the case of conventional crude sunflower oil methanolysis. Consequently, it is well known that the external mass transfer limitations in packed-bed reactors can be effectively reduced using several operations, such as by increasing the flow rate, reducing the viscosity of the substrate, and increasing the substrate concentration. II-35

63 BIOCATALYTIC BIODIESEL PRODUCTION The internal mass transfer resistance, on the other hand, arises when the rate of substrate diffusion from the support surface to the enzyme becomes rate limiting or controlling. This happens since the substrate has to diffuse through the pores of the support to reach the enzyme surface. Though most of the supports are porous in nature, the diffusion of the substrate through the pores may also play considerable role in the reaction rates. In overall, it depends on the shape of the particles, pore size distribution, shape of the pores, porosity, tortuosity, the effective diffusivity of the reactants and products within the pores, and the degree of uniformity of the enzyme s distribution within the particles. Finally, the enzyme activity in diffusion-limited systems follows a linear decay in time, as enzymes on the surface of the support are inactivated and the substrate diffuses further into the pores to reach enzyme molecules that have not been inactivated. In systems free of diffusional limitations, however, enzyme inactivation follows first-order decay. What is more, the half-life of the immobilized enzyme can be used to determine the productivity of the system which is crucial in biodiesel production. 4. Analytical Methods in Phase Equilibria Studies 4.1. Turbidimetric Analysis under Isothermal Condition The solubility boundaries were determined by turbidimetric analysis using the titration method under isothermal conditions. Two jacketed equilibrium cells with inlets at different levels (see Fig. 2-1 as an example) of ca. 60 ml of volume similar to one depicted by Sandler 173 with four inlets (a main inlet on the top, one inclined inlet located at the upper part of the cell, and two orthogonally placed side inlets) sealed using screw lids with rubber septum containing a PTFE layer on the inner side were used for liquid-liquid phase equilibria measurements. The cell was placed onto a magnetic stirring plate and the temperature was controlled by a thermostatic water bath equipped with a temperature controller having an uncertainty of 0.1 K. The water-bath was connected to equilibrium cell via short-silicon tubings. Figure 2-1 Equilibrium cell used for liquid-liquid phase equilibria measurements. II-36
64 BIOCATALYTIC BIODIESEL PRODUCTION High oleic sunflower oil (SFO-HO) was titrated to EtOH using a set of µ-syringes in a wellilluminated setup under vigorous stirring (800 rpm) for precise determination. EtOH was also titrated in SFO-HO analogously. The points when the solution changed from transparent to a permanent turbidity were considered to be the saturation points of binary systems. The same titration method was also used in case of EtOl-glycerol binaries with a larger µ- syringe Tie-Line Determination under Isothermal Conditions SFO-HO EtOl EtOH Ternary System Different amounts of SFO-HO with a fatty acid profile of C18:1 91.2; C18:2 2.94; C18:0 2.76; C16:0 1.95, and others 1.15% and anhydrous EtOH of HPLC grade with a minimum purity of 99.8 vol. % (GC) in higher amounts than the solubility limit determined a priori were added into the equilibrium cell. Ethyl oleate (EtOl) (>91 wt. %) in different amounts was added in steps, as the third component, with the aim of obtaining phase compositions for different tie-lines. All of the weighing operations were performed through an analytical balance with an uncertainty of 10-4 g. SFO-HO EtOl EtOH ternary systems were mixed under isothermal vigorous stirring condition for 2 h and then allowed to phase separation under the same isothermal condition for 16 h. After this treatment the two phases became clear and transparent, and the phase interface was well defined. In other words, the equilibrated mixtures which split into two phases were obtained. The upper layer was enriched with EtOH, and the lower one with SFO-HO. Carefully taken samples of 50 µl with the help of µ-syringes from respective inlets of each phase were collected into 1.2 ml glass vials and diluted with 0.25 ml heptane to prevent further phase separation prior to silylation. Syringes were rinsed several times with n-heptane before each sampling operation EtOl EtOH Glycerol Ternary System Analogously, the same procedure was performed for EtOl EtOH Glycerol ternary system. Glycerol of biotechnical grade with a purity of 99.9 % (GC) was used. In that case the upper layer was EtOl rich phase and the lower one was rich in glycerol. An obviously better phase separation was obtained due to immiscibility of glycerol and EtOl. The sample aliquots were 100 µl due to higher viscosity of glycerol rich phase. The samples collected in 1.2 ml glass vials were diluted with 0.40 ml 1,4-dioxane in order to prevent further phase separation GC-FID Analysis for Liquid-Liquid Phase Equilibria The samples were analyzed by using gas chromatography (GC). The analysis method was based on the recommended testing method of EN 14105:2003 for the determination of free and total glycerol and mono-, di-, triglyceride contents in biodiesel through established calibration models for mixture components (see Appendix 2-2 for calibration models). N- II-37
65 BIOCATALYTIC BIODIESEL PRODUCTION methyl-n-trimethylsilyltrifluoroacetamide (MSTFA) (reagent grade %) was used as the silylating agent. Silylation eliminates the presence of polar OH groups in glycerol, acylglycerides and ethanol. It imparts volatility to compounds with low-volatility which may result from the size of the molecule and the resultant large dispersion forces holding the molecule together. Besides, smaller molecules may also have a low volatility due to the strong intermolecular attractions between polar groups. Silylation produces silyl derivatives which are more volatile, less stable, and more thermally stable. 1,2,4-butanetriol (intended for the determination of the free glycerol) and 1,2,3-tricaproylglycerol (tricaprin) (intended for the determination of the glycerides) dissolved in pyridine (99.5% biotech. grade) were used as the internal standards. EtOH was also analyzed using the same GC equipment as in the determination of glycerol and EtOl with the same oven temperature programing using 1-propanol as the internal standard. 174 The analyses were performed using a Hewlett-Packard 5890 series-ii GC equipped with a flame-ionization detector via the cold on-column injection port. The capillary GC column was the MET-Biodiesel capillary column (Supelco Co., USA) with a length of 14 m, an internal diameter of 0.53 mm, and a film thickness of 0.16 µm with integrated 2 m x 0.53 mm I.D. guard as the pre-column. Helium of 99.99% purity was used as the carrier gas with N 2 gas (98.5%) as the make-up. The silylated samples were further diluted to 1 ml with n-heptane (1,4-dioxane in case of EtOl EtOH Glycerol ternary system) and 2 µl of silylated samples were injected with the help of an auto-sampler system directly into the column. Three separate silylation samples were prepared per measurements and each was analyzed at twice. The inlet temperature of the GC column was set to 308 K. The temperature program ramped in five steps (see Fig. 2-2): The initial column temperature was kept constant at 308 K for 15 min. In the second step, the temperature was increased at a rate of 2 K/min to 323 K. In the third step, the temperature was raised to 528 K at a rate of 15 K/min and held at 528 K for 3 min. Then, the temperature was raised to 653 K at a rate of 14.5 K/min and held at 653 K for 5 min. Finally, the column was cooled back to 308 K at a rate of 39 K/min. The total time required to analyze one sample was ca. 1 h. The detector temperature was held constant at 653 K during the analyses. II-38
66 BIOCATALYTIC BIODIESEL PRODUCTION Figure 2-2 Temperature programming for liquid-liquid phase equilibria analysis. 5. GC-FID Analysis of Partial Glycerides and Triglycerides for Determination of Fatty Acid Alkyl Esters The inlet temperature of the GC column was set to 318 K. The initial column temperature was kept constant at 318 K for 0.25 min. The temperature program ramped in three steps. In the first step, the temperature was increased at a rate of 10 K/min to 453 K. In the second step, the temperature was raised to 513 K at a rate of 10 K/min and held at that temperature for 2 min. Finally, the temperature was raised to 653 K at a rate of 10 K/min and held at 653 K for 2 min. Finally, the column was cooled back to 318 K at a rate of 40 K/min. This way of GC analysis is suitable for FAAE (FAME and FAEE) which contains alkyl esters between C14 and C24. Due to possible overlapping of FAEE and monoglycerides peaks in the chromatography, a mixture of monopalmitin, monostearin and monoolein was used to aid in peak identification. The sequence of analyzed compounds eluting in derivatized form from the column in ASTM D6584 and EN is glycerol, 1,2,4-butanetriol (internal standard-1), ethyl esters, monoacylglycerides, 1,2,3-tricaproylglycerol (internal standard-2), diacylglycerides and, finally, underivatized triacylglycerides with a total run time of ca. 35 minutes including the cooling part (see Appendix 2-3 for GC chromatogram samples). 6. Determination of Water Content in Biodiesel using Coulometric KF Titration The same experimental setup explained in Section 4.1 was used for the determination of solubility limits of water in FAME and FAEE samples at different temperatures. The equilibrium cell was filled with biodiesel and distilled water in equal volumes and stirred via magnetic stirrer at 800 rpm for 2 h at respective temperatures. The mixture (dispersion) was allowed to phase separation under the same isothermal condition for 10 h. After this treatment the two phases became obvious, and the phase interface was well defined. The upper layer was enriched with biodiesel, and the lower one with water. Sampling from biodiesel part was done using µ-syringes and collected sample was simultaneously analyzed in order II-39
67 BIOCATALYTIC BIODIESEL PRODUCTION to prevent further phase separation or condensation of water droplets due to decrease in biodiesel sample s temperature. Coulometric measurements of water content were carried out by direct injection of saturated samples in a cell with a diaphragm containing the solution (KFS Titrino 720, Metrohm AG, Herisau/CH.) according to EN ISO prescriptions. All the measurements were performed using one-component pyridine-containing KF titrating agent (Karl-Fischer reagent) and HYDRANAL -Methanol dry as the working medium. II-40
68 CHAPTER 3
69
70 PHYSICAL (PHASE) EQUILIBRIA LLE and VLE III. Chapter 3 Chapter 3 PHYSICAL (PHASE) EQUILIBRIA LLE AND VLE CONTENTS Nomenclature 0. Concise Evaluation of Chapter Summary 1. Introduction and Motivation 1.1. A Closer Look to Immiscibility Phenomena 1.2. The Need for Phase Equilibria Studies A Few Notes on the Determination Methods 1.3. Chapter Objectives and Structure 1.4. Predictive Modeling of LLE using UNIFAC Model based on Group Contribution Method UNIFAC Model Variants Functional Group Assignments 1.5. Pseudo-Components for Ethanolysis Reactions 1.6. Combinations for Functional Groups 2. Liquid-Liquid Phase Equilibria of Vegetable Oil FAEE EtOH Ternary Systems 2.1. Literature Survey on the Application of UNIFAC Model Variants to the Phase Behavior Simulations of Biodiesel Reaction Systems 2.2. Predictive Simulation of LLE by means of UNIFAC Model Variants UNIFAC-LLE Model Variant for LLE Estimation Cross-comparisons of LLE by means of UNIFAC-LLE Model Variant in Ternary Systems Containing Pseudo- Species LLE Prediction using Updated UNIFAC-LLE Table for Vegetable Oil FAEE EtOH Ternary Systems Temperature Influence on the LLE Estimation of UNIFAC Model Variants Effect of CH 2 Functional Groups and HC=CH/CH 2 Ratio on the LLE Estimations of TAG FAEE EtOH Ternary Systems 2.3. Experimental Study on LLE of Vegetable Oil FAEE EtOH Ternary Systems Literature Survey on Experimental Study of Vegetable Oil FAEE EtOH Ternary Systems Liquid- Liquid Phase Equilibria Solubilities of Dry and Aqueous Ethanol in Vegetable Oils LLE Measurements for Vegetable Oil FAEE EtOH Ternary Systems Phase Distribution of EtOH in Ternary Systems III-1
71 PHYSICAL (PHASE) EQUILIBRIA LLE and VLE Statistical Comparison of UNIFAC Model Variants with Experimental LLE Data 2.4. Conclusions 3. Liquid-Liquid Phase Equilibria in FAEE EtOH Glycerol Ternary Systems 3.1. Literature Survey on LLE for FAEE EtOH Glycerol Ternary Systems 3.2. Predictive Modeling of LLE Phase Behavior by means of UNIFAC Model Variants 3.3. Experimental Study of LLE in FAEE EtOH Glycerol Ternary Systems Comparisons with Predictive Methods 3.4. Simulation of LLE Phase Behavior using Correlative Activity Coefficient Models: UNIQUAC, NRTL, and Modified Wilson (T&K) Binary Interaction Parameters and LLE of EtOl EtOH glycerol Ternary System via Correlative Models 3.5. Conclusions 4. Predictive Modeling of LLE Phase Behaviors using Quantum Chemical COSMO-RS Method 4.1. A Few Notes on Quantum Chemical COSMO-RS Method and Parameter Sets Parameter Files in COSMO-RS 4.2. LLE Phase Behavior of Vegetable Oil FAEE EtOH Ternary Systems 4.3. LLE Phase Behavior Simulations of TAG FAEE Glycerol and FAAE EtOH Glycerol Ternary Systems LLE Simulations for TAG FAEE Glycerol Systems Simulations of LLE in FAEE EtOH Glycerol Mixtures 4.4. Solubility of Glycerol and Water in FFA Species COSMO-RS Simulations 4.5. LLE Simulations for Free Fatty Acid Containing (in Waste/Used Oil) Ternary Systems COSMO-RS and UNIFAC Model Variants Simulations of pseudo-tag FFA EtOH Ternary Systems using UNIFAC Model Variants Simulations by means of COSMO-RS Method Case 1: TAG FFA EtOH Ternary Systems Case 2: TAG FFA Glycerol Ternary Systems Case 3: FAEE FFA Glycerol Ternary Systems A Realistic Simulation using Waste/Used Oil Feedstocks 4.6. Conclusions 5. Liquid-Liquid Phase Equilibria in Reactive Systems Containing Water as a Substrate 5.1. Assessments of Water Solubility in FAME species Experimental vs. COSMO-RS Simulations 5.2. Moisture Absorption by Biodiesel (FAAE) Species Experimental Measurements vs. COSMO-RS Method; UNIFAC Model Variants; and SAFT-HR and ESD Equations of State Absorption of Moisture by FAAE Species/Blends 5.3. LLE Phase Behavior of Ternary Systems Containing Water as a Reactive Species Simulations via Quantum Chemical COSMO-RS Method Case 1: TAG EtOH H 2 O Ternary System Case 2: FAEE H 2 O EtOH Ternary System Case 3: FFA EtOH H 2 O Ternary System Case 4: FAEE H 2 O Glycerol Ternary System Case 5: FFA H 2 O Glycerol Ternary System Comparison of Reported LLE Diagrams for FAEE H 2 O EtOH Ternary Systems with Simulations by means of COSMO-RS Method 5.4. Conclusions 6. Multicomponent (Multinary) Liquid-Liquid Phase Equilibria Simulations by means of COSMO-RS Method 6.1. LLE Phase Behavior of Quaternary Systems Triolein EtOl EtOH Water System Triolein EtOl EtOH Glycerol and Triolein EtOl Glycerol Water Systems EtOl EtOH Water Glycerol System III-2
72 PHYSICAL (PHASE) EQUILIBRIA LLE and VLE Triolein OlAc EtOH Water and EtOl OlAc EtOH Water Quaternary Systems 6.2. LLE Phase Behavior of Multinary (Multicomponent) Systems Triolein EtOl Glycerol Rectified EtOH (EtOH+Water) System Triolein EtOl OlAc Rectified EtOH (EtOH+Water) System (Triolein+OlAc) EtOl EtOH Glycerol System (Triolein+OlAc) EtOl Rectified EtOH (EtOH+H 2 O) Glycerol System (TAG+DAG+MAG) FAEE EtOH Glycerol System 6.3. Conclusions 7. Simulations of VLE in Down Processing (Refining) of Enzymatic Transesterification Reactions using QC- COSMO-RS Method References Appendix 3-1 Appendix 3-2 Appendix 3-3 Appendix 3-4 III-3
73 PHYSICAL (PHASE) EQUILIBRIA LLE and VLE Nomenclature w i p i ( σ ) measured mean weight percentage value of component i partial vapor pressure, kpa p i probability distribution function (σ-profile) { x } set of liquid phase mole fractions x 1, x 2,..., x n 0 p i the vapor pressure of pure component i, kpa tn, α A (1 α)100% percentile of the two-tailed t-distribution with N-1 degrees of freedom. a mn, b mn,c mn group-group interaction parameters A wk the Van der Waals group surface area BP-SVP-AM1 Becke-Perdew (BP) functional for density functional theory calculations with a split valence plus polarization function (SVP) with a semi-empirical quantum chemical method for (AM1) molecular structures. BP-TZVP BP-TZVP+ HB2010 BP-TZVPD-FINE BP-TZVP-ISOCAV COSMO COSMO-RS CPA d DMOL3-PBE E(x) EoS ESD EtLi EtLn EtOH EtOl EtPa EtSt FA FAAE FAEE FAME FFA Becke-Perdew (BP) functional for density functional theory calculations with a triple valence plus polarization function (TZVP) basis set. Becke-Perdew (BP) functional for density functional theory calculations with a triple valence plus polarization function (TZVP) basis set in combination with a hydrogen bonding (HB) term (HB2010). Becke-Perdew (BP) functional for density functional theory calculations with a triple valence plus polarization function including Diffuse basis functions (TZVPD) basis set and a FINE grid for cavity construction in combination with a new hydrogen bonding (HB) term (HB2012). Becke-Perdew (BP) functional for density functional theory calculations with a triple valence plus polarization function (TZVP) basis set employing a novel type of molecular surface cavity construction (Scaled Isodensity Surface - ISOCAV) COnductor-like Screening MOdel COnductor-like Screening Model- Real Solvents cubic plus association equation of state total number of HC=CH functional groups density functional theory with PBE functional and numerical DNP basis set for PBE/DNP quantum chemical level calculated by the DMOL3 program. expected value of x equation of state Elliott-Suresh-Donohue equation of state ethyl linoleate (linoleic acid ethyl ester) ethyl linolenate (linolenic acid ethyl ester) ethanol (ethyl alcohol) ethyl oleate (oleic acid ethyl ester) ethyl palmitate (palmitic acid ethyl ester) ethyl stearate (stearic acid ethyl ester) fatty acid fatty acid alkyl ester fatty acid ethyl ester fatty acid methyl ester free fatty acid III-4
74 PHYSICAL (PHASE) EQUILIBRIA LLE and VLE GC group contribution GCM group-contribution method GfE Gibbs free energy g excess molar excess Gibbs energy G excess excess Gibbs energy h excess molar excess heat of mixing (enthalpy) K i tendency of evaporation or distribution value for component i. LiOlPa Triglyceride species holding linoleic acyl group in sn-1, oleic in sn-2 and palmitic in sn-3 positions. LiAc linoleic acid cis, cis-9,12-octadecadienoic acid LLE liquid-liquid equilibria M number of FAEE components in the separated phases m total number of methylene (CH 2 ) functional groups M.W. molecular weight in g.mol -1 MAD% mean absolute deviation percentage MeLa methyl laurate (lauric acid methyl ester) MeLi methyl linoleate (linoleic acid methyl ester) MeMy methyl myristate (myristic acid methyl ester) MeOH methanol (methyl alcohol) MeOl methyl oleate (oleic acid methyl ester) MePa methyl palmitate (palmitic acid methyl ester) MePo methyl palmitoleate (palmitoleic acid methyl ester) MeSt methyl stearate (stearic acid methyl ester) MRE% mean relative error percentage MSD mean squared deviation N number of source for experimental FA composition in oils n/n mole per mole based NF number of fatty acids in the oil source n i number of moles of component i NRTL Non-Random Two Liquids correlative thermodynamic model n T total number of moles OlAc oleic acid (9Z)-Octadec-9-enoic acid OlLiOl triglyceride species holding oleic acyl group in sn-1 and sn-3 positions and linoleic in sn-2 position. OlLiPa triglyceride species holding oleic acyl group in sn-1, linoleic in sn-2 and palmitic in sn-3 positions. P total pressure, kpa PaAc palmitic acid - hexadecanoic acid PR Peng-Robinson equation of state q i pure component molecular-surface (area) parameter of component i Q k group surface (area) parameter of group k QC quantum chemical QM quantum mechanical R gas constant r i pure component molecular-size (volume) parameter of component i R k group size (volume) parameter of group k RMSD root mean squared deviation RSO rapeseed oil (edible canola oil) s standard deviation SAFT-HR Statistical Associating Fluid Theory Huang & Radosz equation of state SBO soybean oil SFO-HO high oleic sunflower oil SLE Solid-Liquid Equilibria SoG Solution-of-Group concept SP Standard Pressure (1 atm) SRK Soave-Redlich-Kwong equation of state III-5
75 StAc STP T TAG U mn UNIQUAC VLE VLLE V wk w/w w i x i X k y i z z i z i PHYSICAL (PHASE) EQUILIBRIA LLE and VLE stearic acid - octadecanoic acid Standard Temperature ( K) and Pressure (1 atm) absolute temperature, K triacylglyceride or triglyceride a measure of the energy of interaction between groups m and n UNIversal QUAsi-Chemical correlative thermodynamic model vapor-liquid equilibria vapor-liquid-liquid equilibria the Van der Waals group volume weight per weight based weight percentage of component i liquid phase mole fraction of component i group mole fraction for group k vapor phase mole fraction of component i lattice coordination number overall (global) mole fraction the mole fractions of FA composition of vegetable oil feedstocks Greek letters γ i S γ i activity coefficient of component i activity coefficient of component i in the system (solvent system) S pure µ chemical potential in a hypothetical solution of pure i groups i µ chemical potential of component i i S µ i chemical potential of component i in the system (solvent system) S 0 µ i chemical potential of pure component i α ij φ i relative volatility segment fraction (or volume fraction) of component i α the probability (risk) of making a type I error (level of significance) () Γ i group residual activity coefficient of group k in a reference solution containing only k molecules of type i Γ k group residual activity coefficient of group k θ i surface (area) fraction of component i (i) ν k number of groups of type k in molecule i σ screening (polarization) charge density group-interaction parameter Ψ mn Superscripts expt estm infinite dilution experimental data point estimated data point III-6
76 PHYSICAL (PHASE) EQUILIBRIA LLE and VLE 0. Concise Evaluation of Chapter Summary Immiscibility and Phase Separation There are limited solubilities of ethanol (with feeds in excess amounts) and methanol (MeOH) in vegetable oils. Moreover, glycerol as the by-product of transesterification and hydrolysis reactions is not miscible with fatty species. Insoluble alcohol forms droplets in emulsion where continuous stirring operations are applied in order to improve mass transfer and thus reaction rates. In all other cases, there occurs a heterogeneous alcohol phase in equilibrium with the ester phase. The substrates feed ratio (alcohol to oil ratio) has a significant impact on the maximum process yield, reaction time, and life span of biocatalysts. In practice, some excess amounts of alcohol should be required in order to shift the reaction equilibria towards the products side due to the reversible nature of involved chemical reactions. Besides, since EtOH has higher affinity for glycerol rich phase, some excess amounts of EtOH is also required in order to provide enough concentration of depleting (reacting) EtOH within the fatty (ester) rich phase. Obviously, such excess feeds are obligatory with the purpose of keeping reaction rate(s) efficient towards products side. For instance, after 55% of reaction completion it was calculated that the LLE of the system gives ca. 74% molar composition of EtOH in glycerol rich phase and ca. 32% in FAEE rich phase as the EtOH phase distribution for 30% molar excess amount of EtOH feed. Therefore, the excess amounts of alcohol feeds need to be optimized for the reaction processes, biocatalyst types, oils sources and type/form of acyl acceptors involved (cf. Chapter 2). On the contrary, reaction product(s) may help to decrease such miscibility gap of substrates, thus changing phase behavior and affecting the reaction kinetics. For instance, the progressive formation of FAEE species makes the reaction mixture homogenous until the synthesis of certain amount of glycerol by-product which becomes practically immiscible with fatty phases. The system, hence, split again into two equilibrated phases: an alcohol rich lower phase and ester or fatty rich upper phase. In case of neat vegetable oils as the substrate -even if each of the FAEE, TAG, DAG, and MAG blends were considered as single species- there are reaction media consisting of 6 kinds of species where TAG-EtOH and fatty -glycerol binary systems, except that of MAG-glycerol, are immiscible with each other. Furthermore, reaction media becomes more complex in case of waste/used oil sources containing significant amounts of FFA and/or water where two more side reactions (hydrolysis and esterification) need also to be taken into account. The reaction media at the beginning and end of such a process will bear some more immiscible binary systems, fatty -H 2 O, besides of fatty - glycerol and TAG-EtOH ones. Indispensability of Phase Equilibria Studies The points (species concentrations) at where phase separations occur and, hence, the distributions of related species between separated phases need to be known accurately in order to develop effective reaction and separation systems. In overall, the immiscibility and/or miscibility drawbacks of reactive systems involved in transesterification, esterification and hydrolysis reactions are the central constraints whereby some crucial circumstances are stem from, such as inhibitory effects of insoluble alcohols on immobilized lipase enzymes (biocatalysts); dominating side reactions and/or reverse reactions; inadequate external mass transfer; longer reaction times; and ultimately low target product conversions/yields. Obviously, all of the conditions in question are strictly correlated to such constraints. III-7
77 PHYSICAL (PHASE) EQUILIBRIA LLE and VLE General Purpose In this chapter it was aimed at evaluating LLE and VLE phase behaviors and solubilities of species involved in enzymatic biodiesel (FAEE) production mainly through predictive thermodynamic models; experimental measurements where applicable, and also through reported studies for comparisons where available. The global objective can be outlined as the assessments of possible phase separation of reactive components and related mutual solubilities within each other that ultimately defines the boundary lines of reaction media. In that respect, two general predictive approaches were considered, namely functional group contribution method based UNIFAC activity coefficient model with its two variants and quantum chemical COSMO-RS method. The conditions required for phase separation, and related mathematical expressions on phase composition determination were outlined in Part 1 of Appendix 3-1. LLE Simulation via UNIFAC Activity Coefficient Model An assessment of UNIFAC model and its variants accompanied by a practical method developed for the modeling of pseudo- fatty species were the subject of Section 1. Subsequently, the assignments of functional groups in order to represent reactive species in mixtures that generate possible combinations were the last part of this section. In Section 2, the evaluations of three UNIFAC model variants for the LLE phase behavior simulation of Vegetable Oil FAEE EtOH ternary systems were accomplished through the assignment of different functional group combinations to pseudo- biodiesel and -vegetable oil species. Pseudo-species were modeled using measured FA composition of oils. It was found that the assignment of functional groups and their quality (i.e. group values from VLE or LLE parameter tables) determines the ultimate efficiency of the phase equilibria simulations. The assignment of CH 2 COO sub-group to the ester fragment of biodiesel species did not provide appropriate Type I ternary phase diagrams which is the expected and experimentally evidenced type. Instead, COO functional group should be used. It was estimated that the assignments of 3 or even 2 CH 2 COO subgroups to the ester fragment of oils did not provide appropriate estimations. As a good engineering approximation, the representation of the ester fragments at sn-1 and sn-3 positions of backbone with 1 CH 2 COO, 1 CH 2 and 1 COO sub-groups is more feasible than with 2 COO + 2 CH 2 or 2 CH 2 COO. Ultimately, the assignments of 3 CH 2 COO groups or 3 COO plus 2 CH 2 and 1 CH functional groups to sn positions of the backbone do not result with appropriate LLE phase behavior simulations (see the dashed rectangular box in Fig. 3-1). Nevertheless, it is of concern to note that here the assigned functional groups represent the ester fragments (on acyl groups) of oil species. To put it in brief, the third combination of pseudovegetable oils (SFO-HO-3 and SBO-3) gives the most appropriate combination with following assigned functional groups to the backbone : 1 CH, 1 CH 2, 2 COO, and 1 CH 2 COO sub-groups (Indeed, the glycerol backbone has only 1 CH and 2 CH 2 assigned functional groups). Experimental Verification of LLE in Vegetable oil FAEE EtOH Ternary Systems The LLE of same ternary systems were measured experimentally at three T values. It was observed that the addition (formation) of FAEE increases the mutual solubility of oil and EtOH species and thus improves the homogeneity of the reactive medium. Besides, it was evidenced that temperature has a moderate influence on decreasing the size of two phase region and, thus, increasing the homogeneity of the reactive mixtures. The initial solubility of absolute EtOH in vegetable oils allows using excess amount of EtOH up to 1.15 molar equivalents at 313 K; whereas that of aq. EtOH allows up to ca molar equivalent at the same T value. Therefore it is convenient feeding aq. EtOH up to 2.0 kmol/h per 1 kmol/h of oil feed in order to provide a single phase (or homogenous) media for III-8
78 PHYSICAL (PHASE) EQUILIBRIA LLE and VLE the initiation of reactions. Even though it is possible feeding up to 3.45 kmol/h of dry EtOH feed, the inactivating impact of EtOH on immobilized enzymes should be taken into account and, therefore, the optimizations of enzymatic processes for all parameters needs to be accomplished by considering the type(s) of enzyme(s)/enzyme supports; amount of enzymes added (load); and also the pairs of EtOH and vegetable oil. In addition, it is worth noting that the formation of FAEE provides homogeneous reaction media even for higher excess amounts of dry EtOH; say 3.90 kmol/h after 15% of reaction completion. On the other hand, the homogeneity of reaction media can be provided only for some certain concentration of glycerol by-product. Lastly, it was evidenced in case of UNIFAC model based simulations that the LLE of ternary systems pertaining to the ethanolysis reaction at a temperature range of K can be well simulated via the UNIFAC-LLE variant. Inclusion of Glycerol by-product in LLE Simulations It was both predictively and experimentally evidenced that the solubility of the by-product glycerol in FAAE species is significantly low which results with the formation of equilibrated two-phase formation (see Section 3). In that respect, it was measured that the amount of dissolved glycerol for reaction completions above 90% reaches to ca. 1% even at 293 K. On the other hand, this proportionally low solubility of glycerol (in FAME and FAEE) still generates technical problems. The small amount of dissolved glycerol obviously exceeds the specified limit of max. 0.02% (w/w). Although the estimations performed through UNIFAC-LLE variant (with EtOl-2 combination) give the most appropriate binodal curves, it was observed that UNIFAC variants underestimate the solubility of glycerol in EtOl and the impact of EtOH addition on the mutual solubilities of EtOl and glycerol. On the other hand, predictions by means of COSMO-RS with BP-TZVP parameter set could properly represent LLE of FAEE EtOH glycerol ternary systems containing single ethyl ester species. There observed significant agreements between COSMO-RS simulations and experimental data points for the phase distributions of EtOH between EtOl rich and glycerol rich phases, particularly for higher conversion levels (> 90%). As a result, it was evidenced that the LLE predictions by means of COSMO- RS method could efficiently represent experimental LLE measurements. In other words, both phase distributions and mutual solubilities can be estimated quantitatively by means of this predictive method even at higher T values up to 323 K. Nonetheless, the solubility estimation of glycerol in EtOl and the impact of EtOH addition on this solubility for conversions beyond 95% by means of UNIFAC- LLE model can be considered as quantitatively reasonable. Finally, it was clarified that glycerol has relatively lower solubility in ester rich phases containing saturated single FAEE species. For instance, the amounts of dissolved glycerol in EtOl rich phase under equilibrium conditions were measured at 293 and 308 K as 1.03% and 1.22%, respectively; whereas it was calculated ca. 0.66% at 313 K for the system containing EtSt component. In addition, it was found that UNIQUAC is the best model among three correlative models studied. Besides, the most appropriate LLE simulation via NRTL model can be obtained with α ij = LLE Phase Behavior Simulations using Quantum Chemical COSMO-RS Method The LLE simulations of binary to multinary reactive systems were performed by means of mainly COSMO-RS method with different parameter sets in addition to via UNIFAC method (see Section 4). The highest EtOH solubility value in triolein at 303 K predicted using COSMO-RS method was ca. 7.22% with DMOL3-PBE parameterization, while the BP-TZVP and BP-TZVPD-FINE parameterizations predicted the lowest but equal values (ca. 3.42%). Therefore, it was concluded that none of the parameterization files could efficiently simulate the solubility of MeOH and EtOH in simple TAG (triolein) species. However, they can be effectively used for the representations of species phase distributions. In contrast, COSMO-RS method can appropriately estimate -even better than UNIFAC-LLE- the III-9
79 PHYSICAL (PHASE) EQUILIBRIA LLE and VLE initial solubility of oils in EtOH as observed in case of LLE simulations for TAG FAEE EtOH ternary systems. Nonetheless, it is worth mentioning that COSMO-RS method with BP-TZVP and BP-TZVPD- FINE parameterizations can only be used for species phase distributions in such ternary systems. In overall, LLE simulations via COSMO-RS method using both of the parameterization files underestimate the solubility and mutual solubilities of ternary systems with simple TAG species, particularly in oil rich phases. On the other hand, the LLE simulations of ternary (quaternary) systems containing rectified EtOH revealed that there is a significant decrease in mutual solubilities with aqueous EtOH. In the multicomponent LLE simulations representing veg. oil FAEE EtOH ternary system, a better demonstration was obtained when it is compared with experimental results, particularly with the formation of FAEE species. It is noticeable that in the absence of excessive EtOH concentration, the statement of practically immiscible for glycerol species is valid even below 30% of reaction completion. It was evidenced for the solubility of FAEE species in glycerol that EtLn as the most unsaturated member studied has the highest affinity for glycerol rich phase followed by EtLi species; whereas the lowest affinity was exerted by the long-chained saturated FAEE (EtSt). In this regard, it can be deduced that the removal of glycerol rich phase with the progress of reaction might help to increase the cetane number and oxidative resistance of the biodiesel. Moreover, such a removal might help to shift the reversible reactions towards product(s) side. The Impact of Free Fatty Acid Content on the LLE Phase Behavior of Reactive Systems it was observed in binary LLE simulation of glycerol FFA and water FFA systems that there is an inverse relation between the saturated FFA carbon number and its miscibility with water and glycerol; while a linear solubility relation with the numbers of double bond in unsaturated FFA (see Section 4). It was predicted that glycerol has significant affinity for FFA than water has. In contrast to COS- MO-RS method, the solubilities of glycerol in oleic, linoleic, and linolenic acids predicted via UNIFAC variants at 308 K revealed significantly lower values. Accordingly, if the predictions by COSMO-RS method are accepted as reliable, reactive systems comprising waste/used oils as the substrate may form homogenous mixtures during the initial periods of reaction courses which may (or may not) prevent higher product yields depending on the mixture compositions and reaction conditions. In that respect, it was demonstrated that none of UNIFAC model variant employed could appropriately simulate the measured mutual solubility impacts of FFA (OlAc) in TAG FFA EtOH ternary systems. However, according to both LLE simulations and measurements, the use of waste/used oils containing substantial percentage of FFA as the feedstocks may improve the homogeneity of reaction media even at rather excess amounts of EtOH feeds. It was found in LLE simulations of similar systems for three case studies using COSMO-RS method with five parameter sets that OlAc added prefer predominantly the EtOH rich phase. However, its K-value approach exponentially to 1.0 which indicates that high FFA content in oil may help to the formation of single-phase reaction medium. However, the examination of experimental ternary LLE phase diagrams of water containing Veg. Oil FFA EtOH H 2 O quaternary systems revealed that water has an antagonistic impact on the LLE of the reactive systems. Therefore, the use of waste/used oils having considerable amount of water beside of FFA may prevent the formation of homogeneous reaction media. Furthermore, it was considered through the LLE simulations of TAG FFA glycerol ternary systems that glycerol becomes slightly more soluble with the increase in FFA concentration. However, it has been ultimately verified that glycerol species has a significant tendency to split from fatty phases, even with oils containing very high amounts of FFA so as to create a second liquid phase for the given T range under equilibrium conditions. Since glycerol passing ca. 1% of concentration is not misci- III-10
80 PHYSICAL (PHASE) EQUILIBRIA LLE and VLE ble with fatty medium (FAEE + TAG) for the T range of K, the system eventually turns into a biphasic media with further increase in glycerol concentration. The FFA content of oil source can, however, increase the amount of dissolved glycerol in fatty medium up to 2 5% depending on the composition of reaction media (mainly of FFA content) and temperature. To conclude, though it was considered that reaction medium has the tendency to become single phase up to 30% of TAG conversion, the formation of glycerol dominantly prevents such an occurrence. However, if the consumption of TAG and simultaneous formation of FAEE in which glycerol has slightly higher solubility were considered; reaction medium may remain homogenous up to 40% of FAEE formation. The reaction media can, however, easily become biphasic even at 323 K with the increase in water concentration, such as in reactions involving rectified EtOH (95.63%). Since glycerol has relatively high affinity for FFA and FAEE than for TAG species the use of dehydrated waste/used oil helps to the occurrence of single-phase media up to some certain compositions where glycerol concentration reaches to the limit initiating the formation of second liquid phase under equilibrium conditions. Lastly, even if a homogeneous reaction medium can help to surmount the external mass transfer problems; high concentration of glycerol and/or water in fatty phase can also promote the reverse reactions and, thus, can decrease the final product yield. Nevertheless, such single phase formations (regions) can be effectively used for the optimization of immobilized enzyme amounts in order to make reactions faster. LLE of Reactive Systems with Water Containing Substrates The solubility of water in fatty acid alkyl esters (FAAE) was simulated by means of quantum chemical COSMO-RS method and group contribution based UNIFAC model variants (see Section 5). Subsequently the assessments of experimental and predictive solubility determinations in FAME and FAEE species were performed. It was observed that moisture content in both single unsaturated FAME and FAEE species follow the same increasing order as in the LLE simulations of water-ffa binaries. The solubility simulations by means of three UNIFAC model variants were also accomplished and the most appropriate results were obtained using modified UNIFAC (Do.) variant with the 2 nd combinations of biodiesel species (see Fig and 3-45 in Section 5.1). On the other hand, in case of COS- MO-RS method it was noticed that the novel BP-TZVPD-FINE could not appropriately predict water absorption in FAAE species. However, solubility simulations by means of the updated BP-TZVP parameter set (COSMOtherm v.c3.0_12.01) contrary to BP-TZVPD-FINE parameterization have resulted with more appropriate predictions of equilibrium moisture content in the same species. In addition, the moisture absorption capabilities of three species (EtOl (>91%); rapeseed oil biodiesel (FAME), and soybean oil biodiesel (FAEE) species) measured in our laboratory were also evaluated. The highest moisture content, say at 313 K, was obtained with a commercial biodiesel (FAME) product obtained from RSO. The equilibrium moisture content of EtOl, e.g., at 298 K was measured as ±12.08 ppm. The quantitatively closest predictions in case of UNIFAC model variants were obtained by means of modified UNIFAC (Do.) variant with EtOl-2 combination. Besides, the most appropriate prediction using QC COSMO-RS method was performed with BP-TZVP+HB2010 parameterization. Analogous to the results obtained with the EtOl case, the most quantitatively appropriate solubility was estimated using modified UNIFAC (Do.) variant with FAME-2, but equally well results with FAEE-1 and FAEE-2 species. Furthermore, the simulations of moisture content in FAEE species via COSMO-RS method employing BP-SVP-AM1 parameterization set that is recommended for solubility prediction was the most appropriate. Since moisture content determines the final product quality supplied to the market, it is more appropriate considering moisture contents at lower T values. Therefore, either COSMO-RS with BP- III-11
81 PHYSICAL (PHASE) EQUILIBRIA LLE and VLE TZVP+HB2010 /BP-TZVP (the updated version) or modified UNIFAC (Do.) models can be used equally well for predicting absorbed water content in FAEE (EtOl) species. In overall, the comparisons of updated and old versions of BP-TZVP parameterization sets have revealed that the former has improved ability of predicting moisture content in FAAE species. Nonetheless, the novel BP-TZVPD- FINE parameter set including an updated H-bonding term (HB2012) has resulted with considerably high moisture content predictions. It was plausible to deduce that the degree of unsaturation is strongly correlated with moisture absorption content of homologous FAAE species. Lastly, it was observed that the best predictive approach for water solubility in these three kinds of FAAE species was COSMO-RS method with the updated BP-TZVP parameterization set. On the other hand, the LLE phase behavior simulations of FFA EtOH H 2 O ternary systems containing saturated and unsaturated FFA components via COSMO-RS method have evidenced that neither saturated nor unsaturated FFAs are miscible with water at the T values studied. However, EtOH addition increases the solubility of water in FFA rich phase and, thus, can help to the homogeneity of reaction media in case of waste/used oil substrates. The influence of feedstocks water content on the mutual solubilities of glycerol and FFA were simulated through predictive ternary LLE simulations. Accordingly, it was observed that an increase in water concentration considerably decreases the solubility of glycerol in FFA rich phase. Moreover, it was revealed that the increase in EtOH concentration increases the mutual solubility of FFA and glycerol, particularly in FFA rich phase. Therefore, the initial feed rate (concentration) of EtOH can promote the homogeneity of reaction media containing waste/used oil feedstocks. The case study simulation with FAEE H 2 O EtOH ternary systems has shown that FAEE will be miscible with the aqueous EtOH up to 35% at the T range of K. To conclude, it was evidenced through the LLE phase diagrams of ternary systems involved in biodiesel (FAEE) production and refining processes that COSMO-RS method with BP-TZVP parameterization can effectively be used for the simulation of LLE phase behavior and phase distribution of H 2 O between two liquid phases. Finally, it was observed in case of FAEE H 2 O glycerol ternary system that the system is practically immiscible and water addition does not affect the solubility of glycerol in FAEE rich phase. Even though 15 K of temperature increase did not affect the mutual solubilities, it is well-known that such an increase in temperature noticeably increases the moisture content absorbed in FAAE phase. LLE Simulations for Multicomponent Reactive Systems The multinary LLE phase behaviors of enzymatic ethanolysis reaction (including hydrolysis and esterification as the side reactions) were simulated by means of a case scenario using neat vegetable oil feedstocks containing an initial amount of 0.25% FFA and aq. EtOH (96%) as the acyl acceptor (see Section 6). The final TAG conversion was accepted as 95% where there assumed 1% of final FFA (based on oil feed weight) and 3.76% of final water (based on aq. EtOH feed weight) contents. It was evidenced that there are possibilities of homogenous (single-phase) reaction media formation in the commencement and until some extents of reactions, mainly with the use of dehydrated waste/used oil feedstocks comprising noticeable amounts of FFA. However, the increase in by-product glycerol concentration and simultaneous decrease in EtOH concentration initiates more pronounced phase separations for the enzymatic reactions at appropriate T values. It was predicted that glycerol is miscible with 1(3)-Monoolein at the T values employed in enzymatic reactions, while water has a predicted solubility value of 3.03% in the same species. As a result, the formation of MAG species increases the likelihood of homogeneous reaction media formation, particularly in the commencement of reactions. It was estimated that EtOH is miscible with both MAG and DAG species. In case of the most plausible reactive mixture including oil, FAEE, FFA, aq. EtOH III-12
82 PHYSICAL (PHASE) EQUILIBRIA LLE and VLE and glycerol (excluding intermediate acylglycerides) the amount of dissolved free glycerol at 303 and 318 K were estimated as 0.48% and 0.71%, respectively, where even that of predicted at lower T value substantially exceeds the allowed limit in the current standards. Moreover, the amount of corresponding absorbed moisture contents were predicted as and ppm and it was evidenced that moisture content increases with the increase in FFA content. Current biodiesel standards restrict the maximum amount of moisture to 500 ppm. Therefore, even though cold-water can be used for the removal of dissolved glycerol from biodiesel by liquid-liquid extraction operation, a dehydration step is always necessary. Finally, since intermediate acylglyceride products (DAG and MAG) have higher affinity for glycerol, the simultaneous removal of glycerol may decrease final biodiesel yields. Simulation of VLE and LLE as an Approach to the Refining Operations of Biocatalytic Biodiesel Production VLE calculations were performed both isothermally and isobarically and the results were outlined in Section 7 (see also Appendix 3-4). It has been reported that purified biodiesel fuel (FAME) and glycerol are susceptible to the thermal decomposition above 523 K 1 and 423 K 2, respectively. As a result, temperature values of 413 (for glycerol purification), 423, and 473 K (for biodiesel purification), were chosen for the isothermal VLE computations with the purpose of preventing separated biodiesel and glycerol phases from decomposition. In order to provide a realistic simulation, the mixture of FAEE species was considered as a near-ideal solution which was pointed out for the mixture of FAME species by Goodrum and coworkers. 3 Thus, the total vapor pressure of the FAEE species in the system was calculated from the sum of vapor pressure of individual FAEE components weighted by their corresponding FA compositions (of the oil source). Subsequently, VLE simulations were performed for multinary systems: 5 FAEE + EtOH + Glycerol for EtOH recovery and 5 FAEE + glycerol for the VLE of purification operations. The total biodiesel (FAEE) mole fraction at vapor phase was calculated as the sum of individual mole fractions of ethyl esters. Considering the purity of recovered EtOH, isobaric operation under 50 kpa of vacuum was chosen as the most suitable option for striping excess EtOH from biodiesel phase. It was found that is very achievable removing the dissolved glycerol from the biodiesel through isothermal simple unit operations, such as flash distillation or evaporation for conversions above 89% to 99.5%. However, since the temperature exceeds the critical temperature limit (523 K) reported for FAME decomposition 1, isobaric operations seems to be completely unsafe. Besides, neither 10 nor 50 kpa of vacuum levels perform better than isothermal cases for such simple unit operations. On the other hand, the VLE simulations of glycerol purification step through isothermal operations at 413 K showed yet again relatively better results than isobaric simple operations, even that at 1 kpa of vacuum. Besides, at such a significantly low vacuum, the temperature still exceeds (ca. 430 K) the critical limit. Despite the fact that glycerol has lower boiling points than FAEE mixture, in general, the K-values of FAEE were rather higher than of glycerol. As a consequence, further purification of glycerol requires using vacuum distillation or rectification operations. Nonetheless, it is worth noting that as an advantage of enzymatic biodiesel production, glycerol after the stripping of EtOH should theoretically have a purity of 98.3 wt. % to 98.8 wt. % for the conversion levels of 74.4% and 99.5%, respectively. In conclusion, binary VLE of individual FAEE components and glycerol showed minimum boiling azeotropes where the highest azeotrope mole fraction of was observed for EtPa at 423 K. Similar pseudo-azeotrope points were also observed with FAEE-Glycerol binaries. At low conversions (ca. 39% to 44%) EtLi -as the major constituent of soybean oil derived FAEE blend- had sufficient concentration for the formation of azeotropy. III-13
83 PHYSICAL (PHASE) EQUILIBRIA LLE and VLE 1. Introduction and Motivation Substrates involved in biodiesel production have different physicochemical nature: Lipids are hydrophobic in nature; whereas the acyl acceptors (alcohols) are hydrophilic, in the contrary. For that reason, there are limited solubilities of methanol (MeOH) and ethanol (EtOH) in vegetable oils, particularly with feeds in excess amounts. Moreover, glycerol as the byproduct of transesterification and hydrolysis reactions is not miscible with ester species. Insoluble alcohols form emulsion droplets where continuous stirring operations are applied in order to improve mass transfer and, thus, reaction rates. In all other cases, there occur heterogeneous alcohol phase in equilibrium with the fatty phase. Hereafter, fatty phase will refer to the ester species, oil substrate in the beginning; mixture of yet unconverted oil; intermediate products (mono- and di-acylglycerides) and free fatty acids (FFA) -if availableduring the reaction course; and it denotes mainly biodiesel towards the end of a nearcomplete reaction. As shown in Fig. 3-1 the stoichiometry of transesterification reaction requires 3 moles of alcohol per mole of oil to synthesize 3 moles of FAAE and 1 mole glycerol by-product. Essentially, the alcohol to oil ratio has a significant impact on the maximum process yield, reaction time, and life span of biocatalysts. In practice, some excess amounts of alcohol are required in order to shift the reaction equilibria towards the products side due to the reversible nature of involved reactions. 4,5 As an example, the conventional transesterification reactions are usually performed with a molar ratio of alcohol to oil of ca. 6:1 for MeOH and double the amount (12:1) for EtOH. 6 Conversely, enzymatic ethanolysis reactions require relatively lower excess EtOH feeds (cf. Chapter 2). 7 It is of concern to state at this point that the excess amounts of alcohol feeds need to be optimized for the reaction processes, biocatalyst types/forms, oils sources and type/form of acyl acceptors involved. Figure 3-1 Overall reaction scheme for biodiesel (FAEE) production represented using pseudo-components. It was evidenced by means of the mathematical modeling of chemical equilibria, assuming single-phase reactive media that (cf. Chapter 4) it is thermodynamically conceivable achieving higher FAEE conversions even with the continuous feed of 0.67 molar equivalent III-14
84 PHYSICAL (PHASE) EQUILIBRIA LLE and VLE amount of EtOH (2:1). Nevertheless, since EtOH has higher affinity for glycerol rich phase, some excess amounts of EtOH is almost always required in order to provide enough concentration of depleting EtOH within the fatty rich phase. Obviously, such excess feeds are required with the purpose of keeping reaction rate(s) efficient towards products side. For instance, the formed LLE of the system gives the EtOH phase distribution ca. 74% molar composition in glycerol rich phase and ca. 32% in FAEE rich phase for 30% molar excess amount of EtOH feed after 55% of reaction completion (see Fig in Section 3.3 and Fig in Section 4.3.2). Consequently, this phenomenon again proves that EtOH feed needs to be in excess. Moreover, since the enzymatic ethanolysis reaction with some certain excess amounts of EtOH, say in 1:3.6 molar ratio of oil to EtOH, initiates in the presence of twoliquid phases, information on the phase composition and related behavior is crucial for the reasons given below. Some researchers have reported the respective solubility of MeOH and EtOH in a mixture of soybean (SBO) and rapeseed (RSO) oils being only 1 and 2 of the stoichiometric amount 2 3 (temperature degrees were not mentioned) for stepwise enzymatic transesterification reactions. 8 According to the authors the occurrence of equilibrated biphasic system is expected to occur beyond these ratios (this point will be assessed in Section below). In liquid systems phase separation phenomenon occurs most commonly when the species are of different chemical natures or when the species differ in both size and chemical nature. 9 On the contrary, reaction product(s) may help to decrease such miscibility gap of substrates, thus changing phase behavior and affecting the reaction kinetics. 10 For instance, the advancing formation of FAEE species makes the reaction mixture homogenous until the synthesis of certain amount of glycerol by-product which becomes practically immiscible with fatty phases. The system, hence, again split into two equilibrated phases: an alcohol rich lower phase and an ester or fatty rich upper phase A Closer Look to Immiscibility Phenomena In case of transesterification reaction through biocatalysis at the T range of K employing neat vegetable oil and excess amount of dry EtOH as the substrates generates for, say 96.5% of reaction completion, the main (target) product FAEE; the by-product glycerol; some trace amounts of intermediate acylglycerides (DAG and MAG); TAG species; and excess EtOH. Even if each of the FAEE, TAG, DAG, and MAG species (blends) were considered as single species, there is a reaction medium consisting of 6 kinds of species where TAG- EtOH and fatty -glycerol binary systems, except that of MAG-glycerol, are immiscible with each other. The reaction media becomes more complex in case of waste/used oil substrates containing significant amounts of FFA and/or water where two more side reactions (hydrolysis and esterification) need also to be taken into account. The reaction media at the end of such a process will bear some more immiscible binary systems, fatty -H 2 O, besides of fatty - glycerol and TAG-EtOH ones (see also Fig presented in Section 6). Consequently, the III-15
85 PHYSICAL (PHASE) EQUILIBRIA LLE and VLE points (species concentrations) at where phase separations occur and, hence, the distributions of related species between separated phases need to be known accurately in order to develop effective reaction and separation systems. To put it in brief, the miscibility/immiscibility phenomena of alcohols (EtOH and glycerol) and water with fatty species can be outlined as follows: EtOH needs to be miscible with oils in order to provide homogeneous reaction media procuring lower external mass transfer resistances (cf. Chapter 2). Dissolved EtOH has no denaturing impact and relatively lower inhibitive effects on immobilized preparations. 4,8,11,12 Furthermore, it provides higher reaction rates and shifting of reversible reactions towards product(s) side. The very excess amount of EtOH (e.g., above 1.2 molar equivalent amount at 308 K) which is initially immiscible with fatty phase but becomes miscible with the help of formed FAEE species. It helps to dissolve glycerol within the reactive mixture. Since it has higher affinity for EtOH, higher amounts of glycerol is expected to be miscible with fatty phases because: o Glycerol adheres onto the biocatalyst beads and hinders the transfer (diffusion) of EtOH and oil into the catalyst pores (internal mass transfer resistance) (cf. Chapter 2). 13 o Separated glycerol phase removes higher proportions of EtOH feeds from the fatty phase and thus decreases the reaction rates, as mentioned above. On the other hand, such a phase separation helps to shift reactions towards product(s) side (see Section 4.5 for further discussions). Even though the very excess feeds of EtOH 14 can eliminate such adhesive problems, they have significant denaturing influence on the lipase enzymes. o In essence, the inactivation of biocatalysts is more crucial than the formation of two-liquid phases. EtOH and oil feed rates need to be optimized in accordance with the type, form, and load of biocatalyst involved. Water is not miscible with fatty species including FAAE, FFA, and intermediate acylglyceride species. Therefore, the presence of biphasic reactive media through the use of waste/used oil feedstocks and/or aqueous EtOH is obvious The Need for Phase Equilibria Studies In overall, the immiscibility and/or miscibility drawbacks of reactive systems involved in transesterification, esterification and hydrolysis reactions are the central constraints whereby some crucial circumstances are stem from, such as denaturing and/or inhibitory impacts of insoluble alcohols on biocatalysts; dominating side reactions and/or reverse reactions; inadequate external mass transfer; longer reaction times; and ultimately low target product conversions/yields. Obviously, all of the conditions in question are strictly correlated to miscibility vs. immiscibility constraints. Therefore, once such bottlenecks were sur- III-16
86 PHYSICAL (PHASE) EQUILIBRIA LLE and VLE mounted, all the correlated constraints would also be overcome, accordingly. Consequently, the phase equilibria (LLE and VLE) studies of enzymatic biodiesel reaction systems are required for the conception and characterization of the systems mixture thermodynamics, elaboration of the optimum process conditions and their influence on reaction kinetics, selectivity of the desired product(s), and, in particular, for refining (down-streaming) operations. It is also essential to know the compositions of the fluid phases in equilibrium for rigorous analysis of the process or the design and operation of separation units A Few Notes on the Determination Methods The compositions of phases in equilibrium are measured either by means of rigorous experimental setups with subsequent analyses using analytical methods or through predictive and/or correlative thermodynamic models. For the former option, it is required using high purity components with precisely planned experimental setups. Often there are relatively large discrepancies between equilibrium data reported by researchers for the same system, even for the same samples. In this regard, the presence of impurities in the species and way of analysis might be the prominent reasons for such circumstances. Besides, vegetable oils and their alkyl ester derivatives are naturally blends of several non-polar and residual polar species (particularly in case of oils). For these reasons, the experimental way is rather rigorous and not easily adjustable to each case. Moreover, to date, there is no well-proved way of analysis for all components involved in the biodiesel reaction systems Chapter Objectives and Structure In this chapter it was aimed at evaluating LLE and VLE phase behaviors and solubilities of species involved in enzymatic biodiesel (FAEE) production either through predictive thermodynamic models or experimental measurements. In this regard, the predictive and correlative models were mainly employed and were subsequently compared with reported experimental studies, where available. Two general predictive approaches were considered, namely UNIFAC activity coefficient model based on functional group contribution method and quantum chemical COSMO-RS method. In the beginning (Section 1), an assessment of UNIFAC model and its variants accompanied by a practical method developed for modeling of pseudo- fatty species was mentioned. The assignments of functional groups in order to represent species that generate possible combinations in reactive mixtures were the last part of Section 1. The conditions required for phase separation, and related mathematical expressions on phase composition determination were outlined as supplementary data (Part 1) in Appendix 3-1. The detailed LLE phase behavior analyses and simulations of Vegetable Oil FAEE EtOH pseudo-ternary systems by means of three UNIFAC model variants were the second part of Section 2 that follows the evaluation of related literature on such predictive models. This part has been fol- III-17
87 PHYSICAL (PHASE) EQUILIBRIA LLE and VLE lowed by experimental studies on pseudo-binary and ternary systems (Section 2.3) including some statistical comparisons of UNIFAC model based simulations with experimental measurements. The LLE phase behavior simulations by means of UNIFAC-VLE and modified UNI- FAC (Do.) model variants were given in as supplementary data (Part 1 and 2) in Appendix 3-3. In Section 3, the LLE phase behaviors of FAEE EtOH glycerol ternary systems were evaluated analogously. Moreover, the LLE of such ternary systems were further assessed through three correlative activity coefficient models (UNIQUAC, NRTL and modified Wilson (T&K)) after determining the required binary interaction parameters by means of experimental tie-line data points. A sub-section concerning the comparisons of reported LLE data with predictive methods (UNIFAC and COSMO-RS) was given as Part 3 in Appendix 3-3. The predictive modeling of LLE phase behaviors through quantum chemical COSMO-RS method was the main subject of Section 4. The corresponding binary LLE of reaction components, such as triolein, EtOH, MeOH, and glycerol were given in Part 4 in Appendix 3-3. In this section the LLE of binary, ternary and multicomponent reactive systems were investigated through the involvement of different parameter sets (files) that are required in order to produce reliable, high quality calculations of physicochemical data (activity coefficients). All the calculations were performed by means of COSMOtherm software (with three versions) through considering appropriate case studies for the utilizations of neat or waste/used vegetable oils together with dry (absolute) or aqueous (rectified) EtOH as the substrates. Some UNIFAC model based simulations and reported experimental LLE data on Vegetable Oil FFA EtOH ternary systems were also mentioned. The LLE of reactive systems containing water as a substrate were the subject of Section 5. At first the moisture absorption capabilities of FAAE species were assessed through both predictive simulations and reported experimental measurements. This section was followed by the LLE of ternary systems investigated through case study based simulations and reported experimental studies. The final section (Section 6) was on the LLE phase behavior simulations of quaternary and multinary (multicomponent) systems through quantum chemical COSMO-RS method. In this section the LLE of relatively simple quaternary and more complex multinary systems containing up to 6 components were evaluated through case studies. Finally, the VLE phase behaviors involved in refining operations were briefly mentioned in Section 7. Further evaluations of VLE can be found in the paper attached as Appendix 3-4. III-18
88 PHYSICAL (PHASE) EQUILIBRIA LLE and VLE 1.4. Predictive Modeling of LLE using UNIFAC Model based on Group Contribution Method UNIFAC Model Variants Predictive models allow calculations of thermodynamic properties, without previous information or knowledge of the system that is studied, such as the phase behavior of non-ideal mixtures. As the theoretical understanding of liquid mixtures is still limited, few reliable prediction methods have been established where the available ones are essentially empirical. 15 The predictive methods most extensively used for the calculation of activity coefficients are based on the contributions of functional groups of components to the multicomponent mixture of functional groups, called as group-contribution method (GCM). 16 The central assumption of GCM is the assumption of independency of the contributions made by different functional groups within the same component. In these models, component component interactions are considered to be appropriately weighted sums of group-group interactions. The most widely known GCM based predictive model is called the UNIversal Functional Activity Coefficient (UNIFAC) model. It is a semi-empirical method developed for the prediction of non-electrolyte activity coefficients in non-ideal mixtures. GCM based UNI- FAC method is the modification of the correlative UNIQUAC model toward a group contribution form with the combination of the solution-of-groups (SoG) concept. 17 Similar to UNIQUAC, it also consists of a combinatorial part, essentially pertaining to differences in size and shape of the molecules in the mixture, and a residual part relating to the energy interactions. The functional group sizes and interaction surface areas are introduced from independently obtained, pure-component molecular structure data. 15,18 Group-interaction parameters describing energetic interactions between functional groups in the molecules are obtained from experimental equilibrium data. 16,19,20 All UNIFAC model variants are defined as additive models consisting of two terms: combinatorial and residual as expressed by Eq.(1) below. Model variants differ in their formulation of combinatorial part and the expression of the temperature dependence of the residual part. 21 The combinatorial term depends on the group surface area, volume parameters, and composition; whereas the residual term depends on the temperature; composition; the group surface area and volume; and group-interaction parameters. The primary application of UNIFAC model was to estimate vapor-liquid equilibria (VLE) of multi-component mixtures of non-electrolytes. 15 UNIFAC-VLE (the first original UNIFAC model) and UNIFAC-LLE model variants have identical formulation for the two terms. γ = γ + γ (1) Combinatorial Residual ln i ln i ln i The only difference is the group-interaction parameters where each of them uses different parameter sets. Both of the models have temperature independent interaction parameters (a mn ); though in order to improve the performance of the original UNIFAC model in the prediction of VLE, LLE, excess enthalpy (h E ), and infinite-dilution activity coefficient (γ ), the III-19
89 PHYSICAL (PHASE) EQUILIBRIA LLE and VLE modified UNIFAC (Dortmund) (hereafter Do. in short) variant has a quadratic type linear temperature dependency. In addition, this model uses a modified expression for the combinatorial part by the use of a different volume quotient 22 ( φ ) (see Eq. (38) and (39) in Section C of Appendix 3.1) and related group surface area and volume parameters also regressed from phase equilibrium (VLE, LLE), h E, and γ data. 19 In overall, these three UNIFAC models should not be considered as different models, but three variants of a single model. Even though some details of UNIFAC model variants were given in Section C of Appendix 3-1, further mathematical and theoretical details can be found elsewhere. 15,23 ' i Predictive UNIFAC model variants have been efficiently applied for a broad range of systems. 24,25 However, they still do have several limitations: It has been observed that UNIFAC with parameters based on VLE data (UNIFAC-VLE) does not give reliable prediction of LLE. 20,24,26 In VLE calculations, the primary quantities are pure-component vapor pressures; activity coefficients play only a secondary role as the corrections to Raoult s law. However, unlike their role in VLE, the activity coefficient are the only thermodynamic contribution to the LLE calculations. 27 Hence, LLE calculations are much more sensitive to small changes in activity coefficients than VLE. As a matter of fact, in calculating LLE, small inaccuracies in activity coefficients can lead to significant errors. 27 Therefore, LLE calculations tend to be more sensitive to the accuracy of the activity coefficient that is strictly related to the functional group assignments and their quantities than calculations in VLE Functional Group Assignments Although the engineering utility of UNIFAC model (variants) can be demonstrated, group interaction parameters assignment, their quality, and quantity determine the ultimate efficacy of all UNIFAC models. 28 However, to some extent, a molecule is arbitrarily divided into functional groups. 15 According to Fredenslund et al. 28 in order to achieve a concession on the accuracy of estimations and engineering utility, the assignment of functional groups should depend on the judgment. Accuracy of predictive methods improves with the increase in dissimilarity of groups. 15 However, at the ultimate situation with maximum allowable distinctions made, it is inevitable to recover the molecule itself. That is to say, a general compromise is required so as to keep the advantage and feasibility of using such predictive group-contribution methods. Oishi and Prausnitz remarked that the number of distinct groups should remain small but not so small as to neglect significant effects of molecular structure on physical properties. 29 Moreover, Smith and coworkers stated that, as a rule of thumb for assigning functional groups set: when it is possible to construct a molecule from more than one set of subgroups, the set containing the least number of different subgroups is the correct set. 27 Even so, Marrero and Gani commented that the expectation of a minimal set of functional groups is not always a good practice to look for. 30 Usually, esters are described by two sub-groups, CH 3 COO and CH 2 COO, both belonging originally to the same main group (CCOO). 19,31 Besides, in UNIFAC-VLE variant parameter tables III-20
90 PHYSICAL (PHASE) EQUILIBRIA LLE and VLE one special main group (HCOO) is used for formates, and a special COO main group is used for other esters (acrylates), both of which cannot be represented by the two subgroups given above. 32 Larsen and coworkers 32 attempted to describe different esters by a single COO group while developing another variant of UNIFAC model for better representation of temperature effect on VLE. It was, however, observed that the CH 2 COO group as used in UNIFAC-VLE 20,31,33 gives better results than with this single COO group could give. According to Marrero and Gani very large functional groups are not desirable; each should be as small as possible. 30 They commented in contrast that, as observed at earlier studies, 32,34 the impact of defining excessively small-sized functional groups on the performance of the predictive methods (GCM) is unfavorable. They also reported that, based on their assumption of comprisal of more information on molecular structure with the heavier groups than the lighter ones, assigning only a single COO group to describe the commonly encountered esters does not give results as good as the one obtained by using several ester groups such as CH 3 COO, CH 2 COO, CHCOO and CCOO. They have concluded with a statement of golden rule for GCM based physical property estimations that: The heavier group must be chosen rather than the lighter one, if the same fragment of a species is related to more than one functional group. The assigned functional groups and their group-group interaction parameter values were tabulated in Section C (sub-section a) of Appendix Pseudo-Components for Ethanolysis Reactions Because of being natural triacylglyceride mixtures, it is challenging to characterize vegetable oils and their ester derivatives as single components. Though, it is obvious that for the purpose of phase equilibria calculations, it is needed to describe vegetable oils and biodiesel species as single components. As reported in Section 2.1 that in LLE simulations species usually are represented as a simple-tag and simple-faae component. 10,35-39 However, representing mixtures with a single (simple) component as the major constituent of their composition has the discrepancy of being unrealistic. In order to overcome such problems, two different approaches have been mentioned. The first is the rigorous method reported by Zong and coworkers called as fragment based approach. Here, mixed TAG molecules are considered as a sum of four fragments glycerol fragment and three fatty acid fragments (acyl groups). The contribution of each fragment is obtained by correlating the experimental fatty acid (FA) composition and FA distribution profiles in TAG molecules. 40 The second method is relatively simpler. Like the first one, this is also based on the experimental FA compositions. Since all the TAG molecules are consisting of a glycerol backbone and FA fragments, the difference in TAG molecules for commonly used vegetable oils can be described by the number of methylene (CH 2 ; d) and HC=CH (m) double bond functional groups. 41 Espinosa and coworkers defined the simple TAG molecules as the sum of CH 2 and HC=CH groups coming from their corresponding fatty acids (e.g., three oleic acids for a triolein molecule) attached to a glycerol+esters backbone ((CH 2 COO) 2 CHCOO). Consequently, III-21
91 PHYSICAL (PHASE) EQUILIBRIA LLE and VLE the average values of d and m in a pseudo-triacylglyceride species which represent the mixture of FA in TAG species (in vegetable oils) can be calculated as follows: d = N NF j= 1 i= 1 N dx i i (2) m = N NF j= 1 i= 1 N mx i i (3) where N is the number of sources for vegetable oils FA composition analysis with NF representing the number of fatty acid coming from the composition analysis. These values of d and m should be rounded to the nearest integer numbers. Chang and Liu compared the fragment based and pseudo-component approaches for the physical property estimation of biodiesel process modeling and simulation. 42 According to their study both approaches give similar results for prediction, but it is more preferable choosing the simplest approach of pseudo-component as a good engineering approximation. As an implication of essentially identical reactivity of the various FA chains of the TAG species towards alcohols, it is reported that the FA compositions of biodiesel fuels are essentially identical to those of their corresponding vegetable oils. 43,44 Indeed, it is expected that the catalyst used do not possess substrate- or regio-specificity towards TAG components, particularly in case of enzymatic catalysis while considering very short life span for intermediates products (MAG and DAG). Consequently, FAAE derivatives were considered to have 1/3 of the CH 2 and HC=CH group quantities of their oil sources rounded to the closest integer values (see Fig. 3-1). The values of CH 2 and HC=CH groups calculated using measured FA compositions of high-oleic sunflower (SFO-HO) and soybean (SBO) oils were presented in Table 3-1. The results with the average d and m values for FA compositions obtained from several sources were rounded to the nearest integer values. SFO-HO pseudo-component illustrated in Fig. 3-1 has d = 3 and m = 42 ; whereas SBO has d = 5 and m = 38 CH 2 and HC=CH functional groups, respectively, which were marked in bold (see Table 3-1). The fragments pertain to the acyl acceptor were marked in italic for FAEE and glycerol species. It is worth noting that the average numbers of d and m of SFO-HO are the same as in a simple triolein molecule. III-22
92 PHYSICAL (PHASE) EQUILIBRIA LLE and VLE Table 3-1 Calculated methylene (CH 2 ) and double bond containing (HC=CH) functional group numbers in vegetable oils. (References: Gunstone et al., ; Ramos et al, ; Lanza et al, ; Lidefelt, ) Abbreviations: EtOl: Ethyl Oleate; EtOH: Ethanol; SFO-HO: High Oleic Sunflower Oil; SBO: Soybean Oil 1.6. Combinations for Functional Groups In any group-contribution method the contribution of a functional group in one species is always approximate and does not require being the same as that in another molecule. 29 As mentioned above, the performance of the GCM is rather dependent on the representation of the species in terms of functional groups. 49 It is possible to represent ester fragments (functional groups) of oil and FAEE species: i. As the CH 2 COO sub-group under the main group of CCOO; ii. As the main groups of COO and CH 2, plus the sub-group of CH; iii. As the combinations CH 2 COO sub-group; main group COO, and sub-group of CH within the main group of CH 2, particularly for sn-2 position of oils (see Fig. 3-1 and 3-2). Due to several combination possibilities as illustrated in Fig. 3-2, it is likely to have combinations of the functional groups to represent the same species. Pseudo-TAG species were represented with 4 and FAEE derivatives with 2 different combinations. The assignments of functional groups for the pseudo-components given above were presented in Table 3-2 for SFO-HO, EtOH and the FAEE derivative (ethyl oleate), and in Table S-1 (see Appendix 3-3) for SBO and FAEE derivatives, respectively. III-23

93 PHYSICAL (PHASE) EQUILIBRIA LLE and VLE Figure 3-2 Illustrations of possible functional group assignment on a pseudo-tag component. Two alternative assignment schemes are displayed. CHOCO or COOCH functional group in sn-2 position as shown at LHS illustration is available in none of UNIFAC group-group interaction tables. Group interaction parameter values (a mn ) for UNIFAC-VLE variant were taken from Hansen and coworkers. 15,31 and those of UNIFAC-LLE model were taken from Magnussen et al. 50 The modified UNIFAC (Do.) model has three group interaction parameters (a mn, b mn and c mn ) and all the parameter values were collected from Gmehling and coworkers. 19 In addition, the interaction parameter values for the main-group COO not included in UNIFAC-LLE parameter table were taken from UNIFAC-VLE table. The parameter tables for UNIFAC-LLE (Table A3-1) and modified UNIFAC (Do.) (Table A3-3) model variants were given in Section C of Appendix 3-1. An alternative UNIFAC-LLE table constructed by implementing the group-group interaction parameter values for some of the functional groups reported by Batista and coworkers 51 was also prepared (see Table A3-2 in Section C of Appendix 3-1). These interaction parameter values have been regressed from experimental measurements of Vegetable Oil FFA EtOH ternary systems intended for liquid-liquid extraction purposes at three T values for a range of K. Table 3-2 Assigned functional groups for SFO-HO, EtOl, and EtOH species. (Abbreviations: See Table 3-1) III-24
94 PHYSICAL (PHASE) EQUILIBRIA LLE and VLE 2. Liquid-Liquid Phase Equilibria of Vegetable Oil FAEE EtOH Ternary Systems In order to investigate the mixture thermodynamics of ethanolysis reaction through predictive models, i.e. vegetable oil EtOH FAEE ternary systems, the requirement for a detailed evaluation is obvious. Therefore, in this sub-section, it was aimed at evaluating the estimation efficiency of three variants of UNIFAC activity coefficient models (hereafter UNIFAC models or model variants), namely UNIFAC-VLE, UNIFAC-LLE and modified UNIFAC (Do.) through the assignment of several functional group combinations to pseudo-vegetable oil and -biodiesel (FAEE) species determined using experimental FA compositions. Since the first and the last model variants based LLE simulations give relatively inappropriate results the corresponding sub-sections were presented in Appendix 3-3 (see the corresponding Part 1 and 2). The influence of different functional group assignments to the ester fragments bonded to the glycerol backbone of oils and also to the ester fragment of biodiesel species will be evaluated along with the number of methylene (CH 2 ) and functional groups holding double bond (HC=CH). Solubilities of aqueous and absolute EtOH in vegetable oils will be evaluated through reported experimental data and UNIFAC-LLE model variant based simulations. The experimental measurements of the ternary systems containing SBO and SFO-HO species as the oil components and EtOl representing the FAEE component performed at 300 K and at 308 and 313 K, respectively, and a few more comparative studies will be the last parts of this section (cf. Section 2.3) Literature Survey on the Application of UNIFAC Model Variants to the Phase Behavior Simulations of Biodiesel Reaction Systems Negi and coworkers have used CH 3 COO functional group as the ester group for methyl oleate (MeOl) species and CH 2 COO for monoolein in order to estimate the LLE of biodiesel (FAME) reaction systems. 10 Although the same functional group (CH 3 COO) has also been used by Tizvar et al. 39, its introduction was assessed as being incorrect by Kuramochi and coworkers. 37 Predictive quaternary system of FAME glycerol hexane MeOH was studied by Tizvar and coworkers by using UNIFAC-LLE and modified UNIFAC (Do.) models. Since MeOl is the major component derived from canola oil methylation, they considered this component to represent the FAME mixture during estimations. 39 Maeda et al. have compared their experimental results with the estimations performed using UNIFAC-LLE and modified UNIFAC (Do.) variants. They concluded that all UNIFAC model variants are able to represent the complex phase equilibrium of biodiesel reaction systems for the VLLE, of the triolein FFA MeOH dimethyl ether quaternary system. 38 Furthermore, Kuramochi and coworkers have reported estimations of the VLE of MeOH FAME/ glycerol binary systems and LLE of the water FAME binary system and the ternary systems of FAME MeOH glycerol and MeOH water FAME using several UNIFAC model variants: original UNIFAC-VLE variant ; UNIFAC-VLE variant with Kikic's 22 and Fornari's 52 mod- III-25
95 PHYSICAL (PHASE) EQUILIBRIA LLE and VLE ified segment fraction terms ( φ i ) of combinatorial part (see Eq.(39) in the Section C of Appendix 3.1); modified UNIFAC (Do.); and UNIFAC-LLE variants. 37 They reported that either of the UNIFAC-VLE or modified UNIFAC (Do.) model variant could be used for the MeOH recovery process. They concluded that UNIFAC-LLE and modified UNIFAC (Do.) model are more useful for the recovery and water-washing step of crude biodiesel and purification process of water-washed biodiesel (FAME), respectively. Cheng and coworkers have compared their experimental measurements with the general predictions of the modified UNIFAC (Do.). They represented canola oil as a simple TAG component (triolein) containing three COO functional groups assigned to the ester fragments of the species, beside of other respective functional groups (equivalent to SFO-HO-2 combination presented in Table 3-2 above). They concluded that modified UNIFAC (Do.) model is not adequate so as to represent the LLE of triolein MeOl MeOH ternary system. 36 In addition, Ceriani and coworkers optimized the interaction parameter values for CH 3, CH 2, HC=CH, COO, and CH 2 -CH-CH 2 functional groups representing oils and CH 3, CH 2, CH, COO groups representing esters in order to predict vapor pressures in conjunction with the ultimate goal of VLE estimation through UNIFAC models 53 and to predict viscosity of fatty systems/compounds Predictive Simulation of LLE by means of UNIFAC Model Variants UNIFAC-LLE Model Variant for LLE Estimation The binodal curves predicted at 308 K using UNIFAC-LLE model variant were illustrated Fig The pattern of the phase diagram at LHS is similar to the case simulated via UNIFAC-VLE variant (see Part 1 of Appendix 3-3) with the exceptions of being very typical Type II ternary diagrams. Again, the smallest two-phase region in size was obtained for the combination of SFO-HO-2 in which the ester fragments were assigned to 3 COO and 3 CH 2 functional groups. In this combination, the mutual solubility of SFO-HO and EtOH binary is utterly unrealistic, particularly for binodal curve parts in oil rich phases. The pattern of binodal curves in oil rich phase at LHS diagram is almost similar to the case with UNIFAC-VLE variant with the exceptions of higher initial EtOH solubility predictions. The EtOl-2 combination was used as the third (biodiesel) component instead of EtOl-1 for the RHS ternary diagram of Fig Obviously, the binodal curves obtained with this combination is more realistic and represent the expected typical Type I phase diagrams. 55,56 Likewise, there observed significant increases in mutual solubilities of oils and EtOH at higher amounts of EtOl-2 addition. In brief, the smallest two-phase region was obtained for the SFO-HO-2 combination, but the initial solubilities of EtOH and oil species within each other were unrealistic as can be seen for oil rich and EtOH rich phases. III-26
96 PHYSICAL (PHASE) EQUILIBRIA LLE and VLE In the LLE simulations by means of the UNIFAC-LLE model variant, the SFO-HO-4 combination which has 3 CH 2 COO sub-groups assigned to ester fragments have resulted with the largest two-phase regions. On the other hand, the SFO-HO-1 combination holding 2 CH 2 COO sub-groups, 1 CH 2 group, and 1 COO group with interaction-parameter values (of CCOO main group) taken from UNIFAC-VLE table have relatively smaller two-phase regions in size. Therefore, it is possible to conclude that the inclusion of even a single COO functional group have more pronounced impact on the size of two-phase region. Alternatively, even though a single COO group was assigned to SFO-HO-1, the influence of 2 CH 2 COO sub-groups is less considerable in increasing the size of two-phase regions. On the other hand, the assignment of CH 2 COO sub-group to FAEE species has significant impact on decreasing the mutual solubility of oil and EtOH species, as is seen in LHS diagram of Fig In overall, it was observed that as in the case with UNIFAC-VLE variant, the size of two phase region decreases significantly with the increase in the number of assigned COO groups and the impact of FAEE addition on the mutual solubilities becomes more pronounced. Indeed, the COO group was only meant to be used for benzoates or other compounds where the carbon atom of COO is attached to a functional group containing π- electrons. 49 Nonetheless, it was found more appropriate using at least 2 COO (plus 2 CH 2 groups) and 1 CH 2 COO groups assigned to the ester fragments of pseudo-vegetable oil species (see also Section 2.3 for comparisons with experimental measurements). Besides the LLE behavior of the ethanolysis reaction was more realistically represented using this functional group instead of using CH 2 COO group in pseudo-biodiesel species. It is obvious that the patterns of binodal curves and the size order of heterogeneous (two-phase) regions in all combinations are analogous to UNIFAC-VLE variant with the exceptions of relatively smaller two phase regions in this case. Furthermore, even though it is seldom to represent LLE in the neighborhood of the plait point with such models, it was possible to obtain plait points for the cases with SFO-HO-1 and SFO-HO-3 combinations. Finally, the LLE simulations of ternary systems containing SBO and FAEE pseudo-species (see Fig. S-6 in Appendix 3-3) have resulted with analogous phase diagrams demonstrated in Fig On the other hand, the same system simulations performed by means of modified UNIFAC (Do.) model variant have resulted with completely different, but inappropriate phase diagrams. Further details of these simulations were given in Part 2 of Appendix 3-3. Analogously, the LLE phase diagrams of RSO MeOl MeOH ternary system at 303, 308 K, and 313 K simulated using UNIFAC-LLE variant were illustrated in Fig. A3-1 (see Section A of Appendix 3-3). The functional groups assigned to pseudo-rso species were as follows: 41 CH 2 ; 3 CH 3 ; 1 CH; 4 HC=CH; 1 CH 2 COO; and 2 COO; whereas those of MeOl were 13 CH 2 ; 2 CH 3 ; 1 HC=CH; and 1 CH 2 COO. It was found that MeOH, as expected, has lower solubility in vegetable oils (RSO) than EtOH. Moreover, MeOl has relatively low impact on the mutual solubility of vegetable oils (RSO) and MeOH, but it decreases the solubility of RSO in MeOH which is completely unrealistic. III-27
97 PHYSICAL (PHASE) EQUILIBRIA LLE and VLE Figure 3-3 UNIFAC-LLE estimated SFO-HO-(x)-EtOl-(y)-EtOH ternary systems LLE diagrams at T = K (x: 1 to 4; y: 1 to 2). Abbreviations: SFO-HO: High oleic sunflower oil; EtOl: Ethyl oleate. III-28
98 PHYSICAL (PHASE) EQUILIBRIA LLE and VLE It was also observed that contrary to EtOH case, an increase of 10K in temperature does not significantly affect the size of two-phase regions and, thus, the mutual solubilities of MeOH and RSO Cross-comparisons of LLE by means of UNIFAC-LLE Model Variant in Ternary Systems Containing Pseudo- Species It was evidenced that pseudo- species based LLE simulations for SFO-HO and SBO (see Appendix 3-3) as the source of vegetable oils show significant differences. The 3 rd combination of pseudo-sfo-ho (which corresponds to triolein) has 4 more CH 2 but 2 less HC=CH functional groups than pseudo-sbo; whereas EtOl-2 has 1 more CH 2 but 1 less HC=CH functional groups than FAEE-2 species. It was observed that SBO-3 FAEE-2 EtOH ternary system has a larger twophase region (lower impact of FAEE species on mutual solubility) than SFO-HO-3 EtOl-2 EtOH one. As illustrated in Fig. 3-4, an analogous situation was also verified in cases of SFO-HO-3 FAEE-2 EtOH and SBO-3 EtOl-2 EtOH ternary systems (cross-comparisons) for two distinct T values. Therefore, it is essentially important to consider that a pseudo-faee species containing 1 more HC=CH but 1 less CH 2 functional groups than a simple FAEE species (EtOl) shows less marked impact on the mutual solubilities of vegetable oils and EtOH. Besides, it is also plausible to conclude that the initial solubility of EtOH in triolein (SFO-HO-3) is higher than that in pseudo- SBO (SBO-3) species. This situation evidenced that the number of CH 2 functional group has higher impact on EtOH solubility than that of HC=CH group. Figure 3-4 Cross-comparisons of ternary LLE phase diagrams for pseudo-tag pseudo-faee EtOH reaction systems through UNIFAC-LLE model variant simulations at K and K. The corresponding functional groups assigned to each pseudo- species were tabulated in Table 3-2 and Table S-1 (see Appendix 3-3). III-29
99 PHYSICAL (PHASE) EQUILIBRIA LLE and VLE LLE Prediction using Updated UNIFAC-LLE Table for Vegetable Oil FAEE EtOH Ternary Systems The updated LLE table (Table A3-2 in Appendix 3-1) through implementing parameter values for some functional groups that have been reported by Batista and coworkers 51 were used for LLE estimations by means of UNIFAC-LLE model variant. Although the parameters were regressed using experimental LLE data points of Vegetable Oil FFA EtOH ternary systems at three T values, it was not possible obtaining phase-splits (LLE formations) for Vegetable Oil FAEE EtOH ternary systems even at the T values used in their experimental measurements. It might be due to the algorithm used or due to incompatibility of the implemented group interaction parameters. On the other hand, as shown in Fig presented in Section 4.5 below, the measured ternary systems show rather small two-phase regions. As a result, it was considered that the regression of functional group-interaction parameters using such LLE data showing smaller two-phase regions is not appropriate for predicting even the LLE of a similar fatty system. However, the researchers 51 have reported that UNIFAC model (original UNIFAC variant) with updated parameter set excellently simulates the LLE of the measured ternary systems. To put it simply, this situation evidenced that LLE prediction through a modified group-interaction parameter set prepared for a special fatty system may obstruct the universality of UNIFAC models Temperature Influence on the LLE Estimation of UNIFAC Model Variants The attempt to elucidate the impact of temperature increase on the LLE of the ternary systems may assist to see the boundary lines of the heterogeneous regions and feasibility of optimum reaction conditions. SFO-HO-3 EtOl-(y) EtOH ternary systems were chosen as the example combination and LLE simulations were performed at 300 and 313 K. Since the UNIFAC-LLE parameters are limited only for the temperature range of K 50, it was not reasonable to extend the range due to this model s recommended range. 24 The system containing EtOl-1 combination was depicted on LHS diagram and EtOl-2 was on the RHS diagram of Fig It was observed that with the increase in temperature, as expected, the mutual solubilities of EtOH and SFO-HO increased slightly. The effect of temperature on UNIFAC model estimations is slightly higher for the case with EtOl-2 than with EtOl-1 where the modified UNIFAC (Do.) model variant showed an exception. Despite to the fact that this model has three parameters to represent the temperature dependency, significant changes were not observed for a difference of 13 K. Indeed, the first two models were based on temperature independent interaction parameters. Consequently, it was found that the temperature effect on mutual solubility and thus LLE phase behavior could be modeled equivalently with all model variants in question. III-30
100 PHYSICAL (PHASE) EQUILIBRIA LLE and VLE Figure 3-5 Temperature effect on the LLE estimations with UNIFAC model variants for SFO-HO-3-EtOl-(y)-EtOH ternary systems (y= 1 or 2). Abbreviations: SFO-HO: High oleic sunflower oil; EtOl: Ethyl oleate. III-31
101 PHYSICAL (PHASE) EQUILIBRIA LLE and VLE Effect of CH 2 Functional Groups and HC=CH/CH 2 Ratio on the LLE Simulations of TAG FAEE EtOH Ternary Systems As stated above, the miscibility of the components changes with the number of double bond (HC=CH) and methylene (CH 2 ) groups. It is reported that the solubility of free fatty acids (FFA) in EtOH generally increases with an increase in unsaturation and decreases with an increase in the molecular weight. 57 Therefore, with the purpose of analyzing the influence of the number of CH2 functional groups and the ratio of HC=CH/CH2 functional groups on the LLE of ternary phase equilibria and the solubility of EtOH in simple TAG molecules, 3 saturated and 3 unsaturated simple TAG molecule with their respective FAEE derivatives were presented in Table 3-3. In this table, only the 3 rd possible combination of TAG species (as in SBO-3 and SFO-HO-3 presented in Table 3-2 and Table S-1 (see Appendix 3-3), respectively) and 2 nd combination of FAEE were chosen for ethyl ester species. The LLE estimations were accomplished through UNIFAC model variants at 308 K for unsaturated simple TAG and at 348 K for saturated ones. Since, saturated TAG components are in solid state at 308 K and the lowest possible normal melting point temperature for all the TAG species was taken as 348 K. This T value was also below the boiling point of EtOH species ( K) at standard conditions. Essentially, it is not recommended to extrapolate the UNIFAC-LLE model outside of the defined range. 24 However, as it was achieved by Negi and coworkers 10 using UNIFAC-LLE with extrapolation still gives acceptable results. Therefore, the LLE simulations by means of UNIFAC-LLE variant for ternary systems containing saturated TAG species at the specified temperature were performed and binodal curves were depicted in Fig. 3-6 for eight cases. Yet, it was observed that it is not possible to find LLE binodal points with UNIFAC-LLE variant for the ternary system containing trimyristin as the oil substrate. This TAG species seems to be completely miscible with EtOH at that temperature. As is seen from Fig. 3-6, the two-phase region size in saturated TAG species enlarges with the increase in the number of CH 2 functional groups. The addition of corresponding FAEE derivatives with the increasing number of CH 2 groups does affect the mutual solubilities of TAG and EtOH where UNIFAC-LLE and -VLE variants, in particular, demonstrate quite significant solubility difference for a single CH 2 increase in TAG components and also in the corresponding ethyl ester species. The UNIFAC-LLE variant estimates the smallest two-phase regions at this T value; whereas modified UNIFAC (Do.) model does the largest for each ternary system. Consequently, it was deduced that the mutual solubility of EtOH and simple saturated TAG species decreases with the increase in CH 2 number. III-32
102 PHYSICAL (PHASE) EQUILIBRIA LLE and VLE Table 3-3 Assigned functional groups to saturated and unsaturated simple triglyceride species, and related FAEE derivatives. Abbreviations: EtMy Ethyl Myristate; EtPa Ethyl Palmitate; EtSt Ethyl Stearate; EtOl Ethyl Oleate; EtLi Ethyl Linolate; EtLn Ethyl Linolanate; M.W. Molecular Weight III-33
103 PHYSICAL (PHASE) EQUILIBRIA LLE and VLE Fig. 3-7, on the other hand, illustrates LLE phase diagrams for the ternary systems containing unsaturated TAG species at 308 K. It is obvious to infer that the mutual solubility in unsaturated TAG containing systems decreases with the increase in HC=CH/CH 2 ratio. The addition of third components (FAEE) of increasing HC=CH/CH 2 ratio does decrease the mutual solubility of unsaturated TAG and EtOH species, particularly with UNIFAC-LLE and -VLE model variants. Similar to the saturated cases the lowest two-phase regions were estimated using UNIFAC-LLE model and the highest with the modified UNIFAC (Do.) variant. Remarkably, the UNIFAC-VLE model estimates the relatively highest solubility of triolein in EtOH rich phase. Besides, the influence of HC=CH/CH 2 ratio in simple unsaturated TAG and their corresponding FAEE derivatives were not considerable on the mutual solubility of TAG and EtOH species estimated using the modified UNIFAC (Do.) variant. Since the binodal curves estimated by this model were overlapping, it was not possible to infer from the ternary diagrams that the deduction is analogous for all UNIFAC model variants studied. Consequently, in order to understand the influence of CH 2 group quantity and HC=CH/CH 2 ratio, the solubility of EtOH in each simple TAG was estimated via three UNIFAC model variants at 348 K for saturated and 308 K for unsaturated TAG species. The solubility of EtOH in simple TAG species was depicted in Fig None of the facts stated on FFA solubility in EtOH was analogously evidenced to be valid for EtOH solubility in simple TAG species except that the solubility in saturated oils decreases with an increase in molecular weight. Nonetheless, FFA solubility in EtOH might be attributed to the well-known self- and crossassociative interactions between carboxylic (COOH) group of fatty acids and OH group of alcohols. It was observed that the solubility of EtOH decreases linearly with the increase in the number of CH 2 group for saturated TAG components (part A in Fig. 3-8). The rate of decrease in solubility estimated via modified UNIFAC (Do.) variant was slower than in the other two variants. The solubility of EtOH in unsaturated TAG species (part B in Fig. 3-8) also decreased with the increase in HC=CH/CH 2 ratio. However, the solubility was slightly increasing with the increase in HC=CH/CH 2 ratio for estimations performed by means of modified UNIFAC (Do.). It was concluded that the influence of HC=CH/CH 2 ratio on UNIFAC-LLE, UNIFAC-VLE, and modified UNIFAC (Do.) model variants based LLE simulations are not equivalent. Finally, it is noteworthy that the solubility of EtOH in trilinolenin estimated by UNIFAC-LLE and UNIFAC- VLE model variants was in close proximity. III-34
104 PHYSICAL (PHASE) EQUILIBRIA LLE and VLE Figure 3-6 Estimated LLE ternary diagrams of simple saturated TAG and FAEE species (TAG-FAEE-EtOH systems) at K. Saturated TAG species represent the oil in mixtures. See Table 3-4 for the assigned functional groups to FAEE and TAG species. Abbreviations: TAG: Triglycerides. Figure 3-7 Estimated LLE ternary diagrams of simple unsaturated TAG and FAEE species (TAG-FAEE-EtOH systems) at K. Saturated TAG species represent the oil in mixtures. See Table 3-4 for the assigned functional groups to FAEE and TAG species. Abbreviations: TAG: Triglycerides. III-35
105 PHYSICAL (PHASE) EQUILIBRIA LLE and VLE Figure 3-8 Estimation of EtOH solubility in simple saturated (A) (at T= K) and unsaturated (B) (at T= K) TAG species through UNIFAC models. Pseudo-SBO is SBO-3 component as given in Table S-1 (see Appendix 3-3). (n pertains to the number of functional groups.) 2.3. Experimental Study on LLE of Vegetable Oil FAEE EtOH Ternary Systems In general, predictive modeling of phase equilibria (LLE and VLE) represents a reasonable approach for obtaining practical insights into the reaction system thermodynamics. Despite to the fact that such methods provide an attractive approach, it is of concern to indicate that high-quality experimental data is always more reliable. 58 Therefore, a strategy of using predictive models and confirming some of its results later by reliable definitive experiments seem to be the most feasible approximation from process engineering perspectives. Since, the evidence of substantial variance in LLE estimations (see Section 2) compelled the experimental analyses of the ethanolysis reaction system for SFO-HO EtOl EtOH and SBO EtOl EtOH ternary systems (cf. Section 3 for experimental analyses of glycerol containing ternary systems). In this section, at first a small survey of reported studies on LLE phase behavior of biodiesel reaction system will be given. This section will be followed by a detailed analysis of EtOH solubility in vegetable oils and experimental determination and succeeding evaluation of LLE phase behavior of mentioned two reactive systems. Finally, a statistical evaluation of measured and simulated (via UNIFAC models) LLE phase behavior of SFO-HO EtOl EtOH ternary system at 308 K will be performed, as an example. The most feasible UNIFAC models together with related functional group assignments will also be assessed Literature Survey on Experimental Study of Vegetable Oil FAEE EtOH Ternary Systems Liquid-Liquid Phase Equilibria In essence, experimental LLE data on ethanolysis reaction concerning oil ester alcohol ternary systems is very scarce and exhibits contradictory results. 55,56,59,60 In contrast, several studies for the cases concerning methanolysis reaction have been reported. 10,35-37,39,55,59-69 Complete miscibility of rapeseed oil ethyl and methyl esters in both ethanol and diesel fuel at 293 K have been reported by Makareviciene and coworkers. 70 They also reported that an increase in moisture content of ethanol decreases mutual solubility of EtOH (aqueous) and ethyl (or methyl) ester species. Zhou and Boocock 60 studied phase behavior of the base- III-36
106 PHYSICAL (PHASE) EQUILIBRIA LLE and VLE catalyzed transesterification (methanolysis and ethanolysis) of soybean oil (SBO) and Liu and coworkers reported the LLE phase behavior of the ternary system containing the same kind of oil. A comparison of experimental data measured through GC-FID with three UNIFAC model variants (UNIFAC-VLE, -LLE, and modified UNIFAC (Do.)) for the glycerol MeOH MeOl and glycerol monoolein MeOl ternary systems have been reported by Negi and coworkers. 10 Cheng and coworkers measured experimental LLE data for the canola oil- FAME MeOH at 293, 313, and 333 K. 36 Besides, experimental binodal curves measured at 323 K for the LLE of sunflower oil (SFO) FAAE alcohol ternary systems (SFO FAME MeOH, SFO-FAEE-EtOH, and SFO isopropyl esters isopropanol) and FAEE alcohol glycerol ternary systems (of the same esters and alcohols) have been reported by Jachmanian and coworkers. 55 The phase equilibria of mentioned ternary systems were measured aiming at achieving the process efficiency of lipase-catalyzed continuous process for transesterification of SFO Solubilities of Dry and Aqueous Ethanol in Vegetable Oils EtOH solubility in RSO (canola oil) and corn oil was measured by da Silva and coworkers 71 for dry (99.9%) and aqueous EtOH forms where they prepared aq. EtOH (ca. 93.9%; containing 6 wt. % of H 2 O) instead of the available rectified form (95.63%). The solubilities of dry and aqueous forms of EtOH in two types of vegetable oils were illustrated in Fig Moreover, Follegatti-Romero et al. 72 have reported EtOH solubility in a series of vegetable oils (6 sorts of oil). Both sets of measurements were performed at the same T range with the exception of palm oil. The measurements reported by them evidenced that the FA compositions, particularly polyunsaturated FA and short-chained FA, have a significant impact on EtOH solubility. Follegatti-Romero and coworkers reported the highest EtOH solubility in cottonseed oil for the T range of K and the lowest one was in palm olein which has major FA compositions of 35.11% C16:0 and 46.55% C18:1. Although the major compositional differences of RSO and corn oil are in the FA amounts of C18:1 and C18:2, da Silva et al. 71 have reported considerable solubility difference (ca. 3%) for these two oils. This difference should be attributable to the higher compositions of C18:2 and probably to C16:0 content in corn oil (Cx:y refers to alkylated FA molecule having x carbon (C) atom and y double bonds). According to Batista and coworkers results the average EtOH solubility in vegetable oils at, for instance, 308 and 318 K is ca wt. % and wt. %, respectively. Hereafter, all of the reported solubility values are based on weight percentage, unless stated otherwise. These weight percentages correspond to and molar equivalent amounts of EtOH feeds. Likewise, the respective (average) EtOH solubilities at the same T values measured by Follegatti-Romero and coworkers 72 are 19.12% and 24.03% which correspond to and molar equivalents. On the other hand, analogous to dry EtOH, significant differences but in lower extent was also observed between the aqueous EtOH solubilities in RSO and corn oil. As illustrated in Fig. 3-9, significantly lower solubility was observed in case of aqueous EtOH. The corre- III-37
107 PHYSICAL (PHASE) EQUILIBRIA LLE and VLE sponding average aq. EtOH solubilities for the same T values given above are 10.40% and 12.19%. These values correspond to and molar aq. EtOH feeds, respectively. The initial solubility of EtOH comprising different water amounts were also illustrated in Fig. A3-10, A3-11, and A3-12 in Section F of Appendix 3-3 by means of ternary LLE phase diagrams. Figure 3-9 Solubility changes of absolute EtOH and aqueous EtOH (abs. EtOH + 6 wt. % H 2 O) in vegetable oils with respect to temperature Experimental versus predictive data. Solubility predictions were performed by means of UNIFAC-LLE model variant for two functional group combinations where the assigned functional groups for pseudo-sfo-ho and pseudo-sbo species were presented in Table 3-2 and Table S-1 (see Appendix 3-3), respectively. (The main differences in assigned functional groups to pseudo-rso species were as follows: RSO-3: 41 CH 2 and 4 HC=CH; RSO-2: 42 CH 2 and 4 HC=CH. The remained groups were analogous to the SBO and SFO-HO species combinations) Similarly, it was measured in this study that dry EtOH (99.9%) has an average solubility of 16.08% and 19.27% in SFO-HO at 308 and 313 K, respectively; whereas EtOH solubility in SBO was measured as 15.63% at 300 K. The EtOH solubility value in SFO-HO at 308 K corresponds to molar equivalent amount of EtOH which is slightly above the required (stoichiometric) amount; while that of measured at 313 K corresponds to ca molar equivalent amount of EtOH. On the other hand, as it can also be seen in Table 3-5, the solubility of EtOH in SBO corresponds to molar equivalent. The measurements pertaining to SFO- HO are in good agreement with the values reported by Batista and coworkers for triolein and anhydrous EtOH of 99% and 99.8% respective purities. 51 They reported 11.41% of dissolved EtOH (min. 99%) at 293 K and 13.97% at 303 K. They also reported 14.27% dissolved EtOH of the same purity in corn oil at 298 K. In another study, they reported that EtOH has 15.56% solubility in RSO (canola oil) at 303 K and 12.65% at 293 K. 73 Furthermore, EtOH solubility in three pseudo-vegetable oils (RSO, SBO, and SFO-HO) modeled by assessing two different combinations of functional groups (see Table 3-2 and Table S-1) were also simulated with the aim of assessing prediction quality of UNIFAC-LLE model variant. As shown in Fig. 3-9, there is a considerable consistency among the measured and predicted data points for the T range of K with the 3 rd functional group combination and for the T range of K with the 2 nd combination. It was observed that the number of CH 2 group provides promoting impact on EtOH solubility, while that of double bonds (HC=CH) was found as antagonistic for the three pseudo- species modeled. Even III-38
108 PHYSICAL (PHASE) EQUILIBRIA LLE and VLE though EtOH solubility simulation by means of this predictive model variant do not result with consistent data points, especially at high T values, UNIFAC-LLE variant can be effectively used for the prediction of EtOH solubility by assigning different functional groups at the T values suitable for enzymatic transesterification reactions. For instance, the solubility estimation of EtOH in 3 rd combination of pseudo-sfo-ho (which is equivalent to triolein) at 308 K (16.10%) was in significant agreement with the experimental value. On the other hand, as shown in Fig (and Fig. 3-11), the solubilities of EtOH in SFO-HO (and SBO) and vice versa are apparently different. EtOH has higher solubility in oil than the reverse case. All UNIFAC model variants slightly underestimate the solubility of SFO-HO in EtOH (2.70% at 308 K and 2.73% at 313 K) where the best estimation through UNIFAC-LLE variant for the same combination of oil was 1.10%. Contrarily, Batista and coworkers 51 reported 4.28% of EtOH solubility in triolein measured at 303 K. Consequently, the solubility corresponding to 2/3 of stoichiometric amount reported by Shimada and coworkers 8 for EtOH in a mixture of RSO and SBO is not realistic and thus appropriate. It is apparent that the solubility limit can exceed the theoretical (stoichiometric) molar amount of EtOH required for the enzymatic transesterification for a T range of K. In conclusion, it was evidenced that is suitable using absolute EtOH up to 1.20 and aqueous EtOH up to ca molar equivalent amounts for the initiation of transesterification reactions (of neat vegetable oils) in a single phase homogeneous media at e.g. 308 K. As discussed in detail below, the formation of FAEE has fostering impact on EtOH solubility; whereas the accumulation of by-product glycerol which separates into a second liquid phase has antagonistic impact on the stability of single liquid phase reaction media. Nevertheless, the inhibitive and possible inactivation effects of EtOH on biocatalysts (immobilized lipases) should also be of concern. It is also noteworthy that water composition in aq. EtOH may or may not have promoting impact on product (FAEE) yield depending on the feed compositions and reaction conditions (cf. Chapter 2 for related discussions). In overall, these rather complex impacts should be optimized for each reaction system including the biocatalyst involved. III-39
109 PHYSICAL (PHASE) EQUILIBRIA LLE and VLE LLE Measurements for Vegetable Oil FAEE EtOH Ternary Systems In this study, the samples were analyzed by means of gas chromatography (GC-FID). The analysis method was based on the recommended testing method of EN 14105:2003 through established calibration models for mixture components. The molecular weights of SFO-HO, SBO and EtOl were calculated as 882 g.mol -1, g.mol -1 and 310 g.mol -1, respectively. Several mixtures of oils and EtOH exceeding the solubility limits were prepared and global EtOl weight percentages given in Table 3-5 were added in steps, as the third component, with the aim of obtaining phase compositions for different tie-lines. Further details of experimental analyses have been given in Chapter 2. In order to establish a profound LLE analysis, 6 global compositions of SFO-HO EtOl EtOH ternary system were determined for 5 tie-lines and a trivial-plait point composition. However, in case of SBO EtOl EtOH ternary system 5 global compositions were prepared where one of them determined to be agaın a trivial-plait point composition. It is of concern to emphasize that since it is likely to find several global compositions having phase stability (single phase) such plait points do not pertain to the real single plait points. Instead they refer to a trial composition that does not split into two or more phases that have higher stability than a single phase. The iso-thermal measurements of SFO-HO EtOl EtOH ternary system were performed at 308 and 313 K, whereas that of SBO EtOl EtOH ternary system was measured only at 300 K. The samples were prepared and analyzed subsequently according to the procedures explained in Chapter 2. Every tie-line composition was reproduced for 3 times and 2 distinct analyses were performed to each. In overall, 36 experimental measurements were accomplished at isothermal condition for each T value. The global compositions and average values of each tie-line composition were presented as weight percentages in Table 3-4 accompanied by 95% confidence interval (CI) values (α = 0.05) for the mean values of each tie-line composition specified in parenthesis. The confidence intervals were calculated through Eq.(1) given in Appendix 3-2. The largest CI (±0.443) was determined for EtOl composition of second tie-line at SFO-HO rich phase. Fig illustrates the experimental mean values of binodal curves for SFO-HO EtOl EtOH ternary system and selected appropriate estimations prepared using UNIFAC variants for comparison. The left hand side diagram corresponds to the binodal curve measurement at 308 K and the diagram at right hand side to the binodal curve measured at 313 K. For the sake of explicitness, three experimental tie-lines and the global compositions (shown by + symbol) were also demonstrated. As is seen from the ternary diagrams, the closest LLE estimation was obtained for the SFO-HO-3 EtOl-2 EtOH ternary systems performed using the UNIFAC-LLE model variant; whereas that of SFO-HO-2 EtOl-2 EtOH one was also considerable. The LLE phase diagram of SBO EtOl EtOH ternary system at 300 K was presented in Fig together with the most appropriate binodal curves estimated by means of three UNIFAC III-40
110 PHYSICAL (PHASE) EQUILIBRIA LLE and VLE model variants. The global compositions and average values of each tie-line composition are presented as weight percentages in Table 3-5 accompanied by 95% CI values for the mean values of each tie-line composition. The CI values were specified in parenthesis under each data point. In this case, the largest CI (±0.302) was determined for EtOH composition of 4 th tie-line at EtOH rich phase. The most feasible representation of the experimental LLE diagrams depicted in Fig can be done using SBO-2 FAEE-2 EtOH combination with UNI- FAC-LLE model simulation. Since the solubility line tends to approach to the line with SBO-2 than with SBO-3 in oil rich phase for particularly lower amount of EtOl addition, the assignment of three COO functional groups to vegetable oils ester fragments is more appropriate. Actually, as is seen in Fig. 3-4 (in Section 2.1) the simulation of SBO-3 EtOl-2 EtOH ternary combination showed unrealistically lower solubility of SBO in EtOH rich phase which evidenced again that this combination is not feasible. On the other hand, none of UNIFAC variants could effectively represent the experimental solubility line representing the part of binodal curve in EtOH rich phase. Although the composition of SBO is considerably different than SFO-HO, a comparison of three LLE phase diagrams illustrated in Fig and 3-11 evidenced that temperature has a moderate impact on the solubility behavior of reaction components. It is obvious to infer that higher T values allow using excess amount of EtOH without the formation of two-liquid phases. In overall, the systems become progressively homogenous with the concentration (accumulation) of EtOl added. This phase behavior could not be appropriately represented by any of UNIFAC model variants. However, measurement errors, substrate impurities in experimental setups and also blend nature of oils and FAEE derivatives exhibiting complex interactions should be considered. Based on this comparison it was deduced that using the 3 rd combination of SFO-HO together with the EtOl-2 is the most appropriate choice in order to realistically simulate LLE behavior of ethanolysis reaction system using UNIFAC-LLE variant. On the other hand, the 2 nd combination of SBO together with the EtOl-2 is the most appropriate choice for realistically simulating the LLE behavior at 300 K. Besides, as seen from RHS diagram in Fig that none of the UNIFAC variant can represent the LLE behavior properly at higher T values, such as at 313 K. This might stem from shorter FA fragments in TAG and FAEE species which are relatively more soluble in EtOH. SBO-3 EtOl-2 EtOH ternary system with UNIFAC-LLE variant or UNIFAC-VLE variant with SFO-HO-2 EtOl-2 EtOH ternary system can also be used for a rough evaluation and simulation of LLE phase behavior. Further statistical comparisons of predictive and experimental studies were mentioned in Section for SFO-HO containing ternary systems. III-41
111 PHYSICAL (PHASE) EQUILIBRIA LLE and VLE Table 3-4 Experimental tie-line data points for the LLE of SFO-HO-EtOl-EtOH ternary system with 95% CI at K and K. Table 3-5 Experimental tie-line data points for the LLE of SBO-EtOl-EtOH ternary system with 95% CI at K. Abbreviations: EtOl: Ethyl Oleate; EtOH: Ethanol; SFO-HO: High Oleic Sunflower Oil; CI: Confidence Interval. III-42
112 PHYSICAL (PHASE) EQUILIBRIA LLE and VLE Figure 3-10 Comparison of experimental and estimated LLE ternary phase diagrams of SFO-HO-(x)-EtOl-(y)-EtOH ternary systems at T = K (A) and at T = K (B) (x = 2, 3 or 4; y = 1 or 2, see the figure legend). Abbreviations: SFO-HO: High Oleic Sunflower Oil; EtOl: Ethyl Oleate; EtOH: Ethanol. III-43
113 PHYSICAL (PHASE) EQUILIBRIA LLE and VLE Figure 3-11 Experimental and predictive ternary LLE diagram for SBO FAEE EtOH ternary system at K. Experimental points were measured for SBO-EtOl-EtOH ternary system. FAEE species: FAEE-1 in modified UNI- FAC (Do.) model and FAEE-2 in UNIFAC-LLE and -VLE models. Tie-lines for experimental measurements along with global compositions were also given. Abbreviations: SBO-soybean oil; FAEE-fatty acid ethyl ester; EtOHethanol; LLE-liquid liquid equilibrium; VLE-vapor liquid equilibrium Phase Distribution of EtOH in Ternary Systems It is explained in Section 1 that in case of EtOH addition more than the stoichiometric requirement that is needed for shifting reversible reactions towards product side and also towards completion, the reactive mixture turns into a biphasic system. Consequently, despite to continuous mixing, external mass transfer limitations and, thus, lower reaction rates leading to lower product yield may arise. In contrast to conventional transesterification reaction, the biocatalytic reaction occurs in oil or in general in fatty phase. Hence, alcohol substrate should have enough concentration in this phase. As a result, it is ineluctable to detect the solubility of EtOH in fatty phase and observe its change with the progress of reaction. The phase distribution ratio of EtOH is illustrated in Fig As can be seen, it increases exponentially with the increase in FAEE formation. FAEE species helps on the mutual solubility of EtOH and vegetable oils. A comparison of simulated and experimental distribution ratios showed that there is a significant agreement on the EtOH distribution particularly at the beginning of reaction. However, in contrast to UNIFAC-LLE estimations, experimental results showed smaller distribution ratio values and lower increase rates with EtOH feeds. III-44
114 PHYSICAL (PHASE) EQUILIBRIA LLE and VLE Figure 3-12 A comparison of the change of EtOH distribution ratio (K) with the global EtOH compositions. Black curves pertain to measurement at K for SBO EtOl EtOH ternary system and to the measurements at K and K for SFO-HO EtOl EtOH ternary system. The blue curves represent LLE simulations done using UNIFAC-LLE model for SFO-HO-3 EtOl-2 EtOH ternary system combination at K and K. The LLE simulation at K pertains to SBO-3 FAEE-2 EtOH ternary system. See Table 3-1 and Table S-1 (see Appendix 3-3) for abbreviations and assigned functional groups Statistical Comparison of UNIFAC Model Variants with Experimental LLE Data As an example, the overall statistical comparison of estimated and experimental tie-line (LLE) data points for SFO-HO FAEE EtOH ternary system measured at 308 K was presented in Table 3-6 for the mean relative error percentage (MRE %); mean absolute deviation (MAD); mean squared deviation (MSD), and root mean squared deviation (RMSD). Their corresponding 95% CI ranges were specified within parenthesis. The expected values (confidence intervals) for each overall mean term was calculated through the corresponding equations given in Appendix 3-2. Total number of data points for this measurement was 180 (5 tie-lines * 6 replications per tie-line * 3 components per phase * 2 phases). The trivial plait point data was excluded from calculations. It is obvious from the mean statistical error data that the estimations made by UNIFAC-LLE model for the combination of SFO-HO-3 EtOl-2 EtOH ternary system have the least overall MRE%, MAD, and MSD values with 95% CI. The second closest estimations were performed by UNIFAC-VLE model for the same ternary system. On the other hand, the estimation statistics of the SFO-HO-4 EtOl-1 EtOH ternary system was better than of SFO-HO-3 EtOl-2 EtOH ternary for the modified UNIFAC (Do.) model. The estimation statistics of UNIFAC-VLE model for the ternaries of SFO-HO-2 EtOl-2 EtOH and SFO-HO-3 EtOl-2 EtOH were in close proximity. To bring this section to an end, the thermodynamic consistency test, as it is done with VLE analysis, is not suitable for LLE. 74 Hence, the reliability of experimental data measured at III-45
115 PHYSICAL (PHASE) EQUILIBRIA LLE and VLE 308 K was tested via the Othmer-Tobias correlation, as an example. 75 According to this correlation, the experimental tie-line data should give a proper linear fit with the correlation as an indication of the experimental data consistency. Fig depicts the tie-line correlation for the average values of experimental measurements accompanying by the 95% CI indicated with dashed lines. The adjusted R 2 value for the linear fit was calculated as Table 3-6 Overall mean statistics of experimental and estimated LLE data point for T = K with 95% CI values. Abbreviations: EtOl: Ethyl Oleate; EtOH: Ethanol; SFO-HO: High Oleic Sunflower Oil; CI: Confidence Interval; MRE: Mean Relative Error; MAD: Mean Absolute Deviation; MSD: Mean Squared Deviation; RMSD: Root Mean Squared Deviation. Figure 3-13 Othmer-Tobias correlation plot for the average experimental LLE data of the SFO-HO-EtOl-EtOH ternary system at K. a i : weight fraction of ethanol in alcohol rich phase; o i : weight fraction of SFO-HO in oil rich phase. Dashed lines denote 95% confidence interval. Horizontal lines in red indicate the error bars of o i data points. Adjusted R 2 = III-46
116 PHYSICAL (PHASE) EQUILIBRIA LLE and VLE 2.4. Conclusions In this section, first the evaluations of three UNIFAC model variants for the LLE of Vegetable Oil FAEE EtOH ternary systems were accomplished through the assignment of different functional group combinations to modeled pseudo-biodiesel and -vegetable oil species. Pseudo-species were simulated using measured FA composition of oils. It was found that the assignment of functional groups and their quality (i.e. group values from VLE or LLE parameter tables) determines the ultimate efficiency of the phase equilibria estimations. There was no significant variation in mutual solubility for a temperature difference of 13 K with UNIFAC model variants. The assignment of CH 2 COO sub-group to the ester fragment of biodiesel species did not provide a Type I 74,76 ternary phase diagram which is the expected and experimentally evidenced phase diagram type. Instead, COO functional group should be used. The functional groups assigned to the ester fragment bonded to the backbone (represented in the dashed box in Fig. 3-1) of the third combination of pseudo-vegetable oils (SFO-HO-3 and SBO-3 (see Appendix 3-3 for details) are as follows: 1 CH, 1 CH 2, 2 COO, and 1 CH 2 COO sub-groups. It has been estimated that the assignments of three or even two CH 2 COO subgroups to the ester fragment of oils did not provide appropriate estimations. As a good engineering approximation, the representation of the ester fragments at sn-1 and sn-3 positions of backbone with 1 CH 2 COO, 1 CH 2 and 1 COO sub-groups is more feasible than with 3 COO; 2 CH 2 COO or 3 CH 2 COO groups. Although the COO group was only meant to be used for benzoates or other compounds where the carbon atom of COO is attached to a functional group containing π-electrons 49, the LLE phase behavior of the ethanolysis systems was more realistically represented using this functional group instead of CH 2 COO, especially in FAEE components. As it can be seen from the LHS diagrams illustrated in Fig. 3-3 and Fig. 3-4 (for EtOl-1 component) the ester fragment of biodiesel species should be assigned to COO rather than CH 2 COO. Moreover, it was deduced through the UNIFAC model variant based predictive comparisons that using the 3 rd combination of pseudo-vegetable oil together with EtOl-2 (or FAEE-2) is the most appropriate choice in order to realistically simulate LLE in ethanolysis reaction system by means of UNIFAC-LLE variant. Besides the 2 nd combination of pseudo-oils also give appropriate results for the binodal curve part in EtOH rich phases. The overall statistical comparison of estimated and experimental data revealed that UNIFAC-LLE is the best model with the MAD value of ± However, the modified UNIFAC (Do.) and UNIFAC-VLE variants underestimate the LLE of the same ternary combinations (SFO-HO-3 EtOl-2 EtOH and SBO-3 FAEE-2 EtOH). From the process engineering perspective, in those cases where correlative models binary interaction parameter values which need to be determined empirically, such as in UNIQUAC and NRTL activity coefficient models, are not available, predictive UNIFAC model should be used in the simulation of LLE phase behavior. It was evidenced that the increase in the of CH 2 groups number in ternary systems containing saturated simple TAG species decreases the mutual solubility of TAG and EtOH. Analogously, the influence of the increase in the ra- III-47
117 PHYSICAL (PHASE) EQUILIBRIA LLE and VLE tio of HC=HC/CH 2 at unsaturated ternary systems was also negative (decreasing) with the exception of estimations via modified UNIFAC (Do.) model. In the second part (Section 2.3), the LLE of same ternary systems were measured experimentally at three T values. It was evidenced that temperature has a moderate influence on decreasing the size of two phase region and, thus, increasing the homogeneity of the reactive mixtures. The initial solubility of absolute EtOH in vegetable oils allows using excess amount of EtOH up to 1.15 molar equivalents at, say 313 K; whereas that of aq. EtOH allows up to ca molar equivalent at the same T value. Therefore it is necessary feeding aq. EtOH up to 2.0 kmol/h in order to provide a single phase (homogenous) media during the initial period of reactions until sufficient formation of FAEE species. Even though it is possible feeding up to 3.45 kmol/h of dry EtOH feed, the inactivation of immobilized enzymes should be taken into account and, hence, the optimizations of enzymatic processes for all parameters needs to be accomplished by considering the type(s) of enzyme(s)/enzyme supports; the amount of enzymes added (load); and pairs of EtOH and vegetable oil. It is worth noting that the formation of FAEE provides homogeneous reaction media even for higher excess amounts of dry EtOH; say 3.90 kmol/h after ca. 15% of reaction completion. On the other hand, this homogeneity can be provided only for some certain concentration of glycerol by-product (see next section - Section 3). Since, glycerol amount exceeding the maximum dissolution limits initiates another two-phase formation (phase separation) one with fatty rich phase and the other as glycerol rich phase which has higher affinity for EtOH. The alcohol rich phase forms suspended droplets within the reaction medium under continuous stirring/agitation operations. Although the phase distribution ratios of EtOH increase exponentially with the increase in FAEE formation, glycerol formation definitely inverts this situation. Nevertheless, FAEE species obviously helps on the mutual solubility of EtOH and vegetable oils. In overall, the comparison of experimental and simulated LLE data evidenced that none of the UNIFAC variants can properly represent the LLE phase behavior at higher T values, such as at 313 K and for higher amount of FAEE addition (formation) even at lower T values. Nevertheless, it is possible to state that the LLE of ternary systems pertaining to the ethanolysis reaction at a temperature range of K can be adequately simulated via the UNIFAC- LLE model variant. Furthermore, though the errors in estimations are not small, especially with UNIFAC-VLE and modified UNIFAC (Do.) variants, this relatively straightforward technique may be useful as a guide in obtaining approximate LLE phase behavior with appropriate functional group assignments should no experimental data be available. III-48
118 PHYSICAL (PHASE) EQUILIBRIA LLE and VLE 3. Liquid-Liquid Phase Equilibria in FAEE EtOH Glycerol Ternary Systems Even though it is reported that FAEE and FAME of rapeseed oil are completely miscible with ethanol and methanol, 70 the solubility of the by-product glycerol in FAAE is significantly low which results with the formation of equilibrated biphasic (two-phase) systems when brought into contact by mixing. Despite to the fact that this essentially insoluble free glycerol can be easily removed by settling or centrifugation, it may remain either as suspended droplets or as a rather small amount that does dissolve in the biodiesel. Besides, the acyl acceptors (alcohols) can act as co-solvents so as to increase the solubility of glycerol in the biodiesel. On the other hand, this comparably low solubility of glycerol (in FAME and FAEE) still generates technical problems. For instance, free and bonded glycerol (in acylglycerides) content reflects the quality of biodiesel where high total glycerol content can cause injector fouling. 36 Therefore, there are standardized specifications with the aim of controlling the quality of the biodiesel supplied to the market: EN in European countries and a few of its variants in some other countries, such as Brazil, and S. Africa; and ASTM-D6751 in USA, Canada, and Australia (see Appendix 2-1). According to both standards, the content of free glycerol must be less than 0.02% (w/w). However, as it will be shown by means of LLE diagrams in subsequent sections, this small amount of dissolved glycerol exceeds the specified limit which corresponds to ca % (n/n). Since neat vegetable oils contain ca. 10.5% of glycerol which corresponds to a 97.7% of reaction completion, there are, therefore, maximum limits also for total glycerol amount (free + bonded in acylglyceride species) in the final biodiesel product supplied to the market. Both ASTM D6751 and EN standards require a total glycerol amount less than 0.24% and 0.25% by weight in the final biodiesel as measured using a gas chromatographic (GC) method described in ASTM D 6584 and EN , respectively (cf. Chapter 2). It is important to emphasize that vegetable oils from different sources (seeds, plants, or kernels) have some major FA species which primarily determine their thermophysical properties. Accordingly, the FAEE species obtained from soybean and palm oils may exhibit considerable differences. Therefore, in this part of study both ternary systems including individual FAEE species and FAEE blends (the mixture of ethyl ester species) were evaluated in terms of their LLE phase behavior either by means of predictive methods or experimentally. In case of experimental study 4 different ethyl ester (FAEE) species were evaluated using measurements performed with EtOl species for this study and also using reported studies for ternary systems containing each of the four FAEE species as the ester component. These ethyl ester species were two saturated, EtPa and EtSt; and two unsaturated, EtOl and EtLi, species. III-49
119 PHYSICAL (PHASE) EQUILIBRIA LLE and VLE 3.1. Literature Survey on LLE for FAEE EtOH Glycerol Ternary Systems Analogous to vegetable oil FAEE alcohol ternary system there are only a few reported LLE measurements for FAEE EtOH glycerol ternary systems of ethanolysis reaction. It is noteworthy to mention that in these pioneering studies mostly GCM based UNIFAC model variants were applied. However, several studies including different thermodynamic models can be found for the methanolysis case. In view of that, it may worth to name some of the pioneering ones: The first study on the ternary LLE of biodiesel (FAME) MeOH glycerol system has been reported by Komers and coworkers. 39 Negi et al. 10 have reported LLE data for the MeOl MeOH glycerol ternary system through GC-FID analysis and compared with three estimative model variants: UNIFAC-VLE, UNIFAC-LLE, and modified UNIFAC (Do.). They applied UNIFAC-LLE model outside of the recommended temperature range for comparison with the experimental values and with the estimations of modified UNIFAC model where they have concluded that both models are capable of predicting the phase equilibria at 333 K. Besides, they have applied two different OH groups (OH p and OH s ) in case of modified UNIFAC (Do.) variant. However, these two functional groups were indeed introduced particularly for improving the estimations made for multicomponent systems containing secondary and tertiary alcohols. 19 Subsequently, Kuramochi and coworkers have reported LLE estimations of biodiesel (FAME) MeOH glycerol ternary system using several UNIFAC model variants: UNIFAC-VLE, UNIFAC-VLE with Kikic's 22,32 and Fornari's 52 modified segment fraction terms of combinatorial part ( φ i ); modified UNIFAC (Do.), and UNIFAC-LLE. 37 Besides, França et al. have presented experimental data on the LLE for the ternary system of castor oil biodiesel glycerol EtOH (and MeOH) at T values of 298 and 333 K. 64 Recently, Csernica et al. 77 have measured the LLE data for a commercial FAME MeOH glycerol ternary system at 293 K using HPLC method. The LLE behavior of MeOl MeOH glycerol ternary system at three T values (313, 333, and 373 K); and that of the MeLa EtOH glycerol ternary system at 303 K was simulated by Shah and Yadav 78 using quantum chemical Cosmo-SAC method. Moreover, Mesquita and coworkers 79 have reported LLE data for systems containing soybean oil FAME glycerol EtOH at 293 and 323 K and sunflower oil FAME glycerol EtOH at 298 K and 313 K. On the other hand, to the best of our knowledge, the first study on the LLE phase behavior of FAEE EtOH glycerol ternary system has been reported by Liu and coworkers. They have investigated LLE of soybean oil FAEE EtOH glycerol ternary system at 300, 333, and 343 K through turbidimetric measurements under isothermal conditions. 56 The same ternary system was also investigated by Jachmanian and coworkers where they have reported LLE phase diagram measured at 323 K. 55 The binodal curves for systems involved in the production of FAEE, including those for soybean oil (SBO) at several T values (298, 333, and 343 K) and for castor oil biodiesel at (298 and 323 K) with EtOH and glycerol ternary systems was reported by Ardila and coworkers. 80 In addition, the LLE measurement data for the canola III-50
120 PHYSICAL (PHASE) EQUILIBRIA LLE and VLE oil FAEE EtOH glycerol ternary system was performed by Oliveira et al. at 303 and 333 K. 81 The LLE measurements of the EtLa/EtPa/EtOl/EtLi EtOH glycerol ternary systems at 323 K and 333 K using HPLC method for the analysis of both phases was performed by Follegatti- Romero and coworkers. 82 Analogously, Andrade et al. 83 have reported LLE data of the EtSt EtOH glycerol ternary system at 313 and 323 K by measuring the equilibrium compositions via headspace gas chromatography. They also correlated experimental LLE data with NRTL and UNIQUAC activity coefficient models. Recently, Machado et al. 84 have reported LLE data for soybean oil biodiesel (FAEE) EtOH glycerol ternary systems at 298 K and 333 K using GC and potentiometric titration for the composition analysis of the two phases. They have concluded that EtOH distributes preferably to the glycerol-rich phase and that biodiesel solubilizes more EtOH than glycerol where an increase of 35 K in temperature generates an EtOH FAEE Glycerol wetoh wetoh increase in EtOH phase distribution constant ( K = ). They have also correlated experimental LLE data in order to calculate binary interaction parameters (BIP) for the same ternary system using correlative NRTL activity coefficient model Predictive Modeling of LLE Phase Behavior by means of UNIFAC Model Variants Analogous to the method mentioned in Section 1.4.2, two combinations of assigned functional groups for each individual FAEE species were used (see Table 3-3). Although it is possible using two different functional group combinations assigned to 3 OH groups in glycerol component, such as 3 OH p groups or 2 OH p groups to sn-1 and sn-3 positions and an OH s to sn-2 position, the LLE simulations using UNIFAC-VLE and LLE variants evidenced that there is no significant difference in the estimated LLE (tie-line) data. Besides, as mentioned above these modifications of OH functional group were originally developed for modified UNIFAC (Do.) variant with optimized R k and Q k values peculiar to each of three groups (see Table A3-3 in Section C of Appendix 3-1). Consequently, OH s was preferred for sn-2 position instead of using OH p for all three positions with modified UNIFAC (Do.) variant, while single OH functional group was preferred for UNIFAC-VLE and LLE model variants. The LLE simulations for EtOl EtOH glycerol ternary system were performed at 293 and 308 K and ternary phase diagrams were depicted in Fig It was observed that in the LLE simulations via UNIFAC-LLE variant the impacts of using COO and one more CH 2 group or a single CH 2 COO group assigned to ester fragment in EtOl species show considerable differences. As is seen in Fig. 3-14, the decrease in the size of two-phase region is the highest with this model variant; whereas that of with UNIFAC-VLE is relatively lower. In essence, it was evidenced that using EtOl-2 combination as the FAEE species reduces the size of two-phase region in case of UNIFAC-VLE and LLE variants. The size of two-phase region and LLE phase behavior predicted by means of these two model variants were almost equivalent. The simulation of LLE phase behavior using EtOl-1 species with UNIFAC-VLE and modified UNIFAC (Do.) model variants generated almost overlapping binodal curves at both T values. However, the use of EtOl-2 and EtOl-1 combinations as the FAEE components with modified III-51
121 PHYSICAL (PHASE) EQUILIBRIA LLE and VLE UNIFAC (Do.) model variant generated the opposite LLE behavior where the size of twophase region was predicted higher with the former combination. Even though the effect of temperature on LLE is more pronounced, 85 there observed only some slight decreases for an increase of 15 K. Meanwhile, the largest heterogeneous (two-phase) regions were observed with UNIFAC LLE variant in case of EtOl-1 combination as the FAEE component. Likewise, the LLE phase diagrams containing the two combinations of unsaturated (EtOl and EtLi) and saturated (EtSt and EtPa) FAEE species in FAEE EtOH glycerol ternary systems simulated by means of UNIFAC model variants at relatively higher T values were illustrated in Fig. A3-3 to A3-6 in Section B of Appendix 3-3. Finally, the ternary LLE phase diagram of MeOl MeOH glycerol system simulated at 303 and 308 K using UNIFAC-LLE variant was illustrated in Fig. A3-2 in Section A of Appendix 3-3. The EtOl EtOH glycerol ternary system was also simulated using quantum chemical (QC) COSMO-RS method where the recommended BP-TZVP parameter set for high-quality prediction is preferred. For the sake of a realistic simulation, the LLE diagrams were estimated for an enzymatic transesterification reaction achieving a theoretical conversion of up to 99.5%. The substrate EtOH with 30% of molar excess amount and stoichiometric amounts of produced EtOl and glycerol by-product were used in the global composition. In these simulations, the oil phase was supposed to be a medium completely miscible with EtOH in the beginning of reaction and changing into separated biphasic system having a fatty phase (triolein + EtOl) and an alcohol phase (EtOH + glycerol) with the reaction progress. Since EtOl is miscible with EtOH at these T values, the homogeneous media assumption for triolein-etoh binary mixture is valid above ca. 15% of conversion (see also Section 2.3). Hence, initially the mole fraction of EtOH was taken as 1.0 which diminishes to with the reaction course (for 99.5% of reaction completion). At that conversion level, mole fractions of EtOl and glycerol were calculated as and 0.203, respectively. The variation of global composition from 0 to 99.5% EtOl, so-called conversion line, was presented in Fig Meanwhile, the LLE simulations for the global compositions chosen for the experimental measurements were also performed by means of COSMO-RS method. As expected, both of the simulations via COSMO-RS method are overlapping for each T values. This situation again verifies that the choice of global compositions is certainly arbitrary (see Section B of Appendix 3.1). The comparison of experimental and predicted LLE phase diagrams via GCM based predictive (UNIFAC model) and quantum chemical COSMO-RS methods will be performed in the next section and following sub-section. III-52
122 PHYSICAL (PHASE) EQUILIBRIA LLE and VLE Figure 3-14 Ternary LLE phase diagrams of EtOl-(x) EtOH Glycerol ternary systems predicted at K and K through UNIFAC model variants ( x = 1 or 2). EtOl Ethyl Oleate; EtOH Ethanol; LLE Liquid-Liquid Equilibria; VLE Vapor-Liquid Equilibria III-53
123 PHYSICAL (PHASE) EQUILIBRIA LLE and VLE 3.3. Experimental Study of LLE in FAEE EtOH Glycerol Ternary Systems Comparisons with Predictive Methods Although GCM based UNIFAC model variants can often provide good results, it has been reported that such simulations are not ultimately reliable, especially for liquid mixtures where the molecules of one (or more) components have two or more close-by polar groups, such as in glycerol. Hydrogen bonding observed in such molecules (self-association in EtOH and glycerol and cross-association between species) is responsible for the most common form of association in their liquid solutions. Here self-association refers to formation of chemical aggregates or dimers, trimers, etc. consisting of identical monomers. Therefore, due to such associative behaviors LLE simulations performed using GCM based predictive models underestimate phase distributions and mutual solubilities of species. In this study as a model ternary system, the LLE of EtOl EtOH glycerol system was measured using GC-FID method at 293 and 308 K. Experimental procedures and details of analysis methods were given in Chapter 2. The mean values of measured compositions with a 95% confidence interval for tie-lines representing the connection of binodal curve for the separated two phases were presented in Table 3-7. Such tie-line data points are based on arbitrarily chosen global (or overall) compositions. In this part of study 7 global compositions with 6 repetitions (2 trials*3 measurements) representing reaction completion above 60% were chosen and subsequently analyzed for two T values. In these measurements the highest CI range was calculated for the 7 th tie-line point of glycerol rich phase. The average binodal curves with a few tie-lines accompanied by the most appropriate LLE simulations obtained by means of UNIFAC-LLE model variant and QC COSMO-RS method were illustrated in Fig As mentioned above, although the estimations performed through UNIFAC-LLE variant (with EtOl-2 combination) give the most appropriate binodal curves, it was observed that UNIFAC model variants underestimate the solubility of glycerol in EtOl and the impact of EtOH addition on the mutual solubility of EtOl-glycerol binary system. However, for conversions beyond 95% the estimation of glycerol solubility in EtOl and EtOH addition impact on this solubility were quantitatively reasonable (see Fig. 3-16). In contrast, LLE predictions by means of COSMO-RS method using BP-TZVP parameter set could properly represent LLE phase behavior of the same ternary system. Nonetheless, there can be observed some deviations from experimental binodal curves which indicate that the solubilities of glycerol in EtOl rich phase are higher than the predicted ones. This might be attributable to impurities in EtOl species (>91%) or as a result of measurement errors. III-54
, and COSMO-RS simulated (COSMOtherm v.c2.1_01.")
124 PHYSICAL (PHASE) EQUILIBRIA LLE and VLE Figure 3-15 LLE phase diagrams of EtOl EtOH Glycerol ternary systems at K and K Comparisons of experimental, UNIFAC-LLE simulated (EtOl-2 EtOH Glycerol), and COSMO-RS simulated (COSMOtherm v.c2.1_01.11 with BP-TZVP parameterization) LLE phase diagrams. III-55
125 PHYSICAL (PHASE) EQUILIBRIA LLE and VLE Table 3-7 Experimental tie-line data points for the LLE of EtOl EtOH Glycerol ternary system with 95% CI measured at K and K. RMSD value for statistical comparison of COSMO-RS method and experimental tie-line points is also given. A comparison of experimental LLE data for 15 K of temperature difference evidenced that there are some slight increases in mutual solubilities. Consequently, further separation of glycerol and FAEE phases can be practically obtained using settling tanks or by washing reaction outlet with cold water. Phase distributions of EtOH between EtOl rich and glycerol rich phases at two T values were illustrated for experimental and predictive LLE data in Fig As is seen in this figure, there are significant agreements between COSMO-RS simulations and experimental data points, particularly for higher conversion levels (> 90%). Furthermore, the slope upward to the left of the distribution curves verifies that EtOH has a higher affinity for the glycerol rich phase. In contrast, the predictions made by means of UNIFAC-LLE model can only be used for evaluations above 95% of reaction completion. Even though the term thermodynamically consistent data is used to refer the data that obeys the Gibbs-Duhem equation, opposite to VLE measurements LLE data cannot be tested for thermodynamic consistency. Since, individual activity coefficients cannot be determined directly and an extension of LLE data over a continuous composition range is not possible. 86 Therefore, as applied in Section the Othmer-Tobias correlation plots were III-56
126 PHYSICAL (PHASE) EQUILIBRIA LLE and VLE illustrated in Fig for 293 and 308 K accompanied by their CI for 95% of reliability. Consequently, although one of the tie-line data point remains outside of CI, the adjusted correlation coefficient (adj. R 2 ) value for the linear fit was calculated as at 293 K; while that of 308 K was calculated as 0.984, as can be seen in Fig These values indicate that there is a significant consistency among the experimental tie-line data. To conclude this sub section, some comparisons of measured (reported) LLE data at higher T values with UNIFAC model and COSMO-RS method were mentioned in Part 3 of Appendix 3-3. Figure 3-16 Distribution of EtOH in glycerol and EtOl rich phases at K and K Comparisons of experimental, UNIFAC-LLE simulated (EtOl-2 EtOH Glycerol), and COSMO-RS simulated (COSMOtherm v.c2.1_01.11 with BP-TZVP parameterization) LLE data. Figure 3-17 Othmer-Tobias correlation plots for the average experimental LLE data of the EtOl EtOH Glycerol Gly EtOl ternary system at K and K. w Gly : weight fraction of glycerol in glycerol rich phase; w Gly : weight fraction of glycerol in EtOl rich phase. Dashed lines denote 95% confidence interval. Horizontal lines in black indicate the error bars of w data points. (Adj. R 2 = for T = K and adj. R 2 =0.984 for T = K) EtOl Gly III-57
127 PHYSICAL (PHASE) EQUILIBRIA LLE and VLE 3.4. Simulation of LLE Phase Behavior using Correlative Activity Coefficient Models: UNIQUAC, NRTL, and Modified Wilson (T&K) Even though impurities, sometimes, play a role as mentioned above for LLE measurements, temperature is the only property that significantly affects mutual solubilities. However, it is practically impossible measuring LLE of reactive systems for several or wider T ranges. On the other hand, correlative models expressing empirical dependence of the excess GfE function, G excess, to temperature and composition through binary interaction parameters, such as UNIQUAC, 15,18,87 NRTL, 15,87,88 and modified Wilson (T&K) 15,87,89 are the most widely used thermodynamic models. Such activity-coefficient correlations (hereafter correlative models) are essential and significantly effective methods to simulate LLE phase behavior of reaction systems for wider T ranges. Activity-coefficient correlations or correlative models are based on the local composition theory which allow for a certain degree of nonrandomness and they can, thus, be expected to represent more realistically the phase behavior of non-ideal mixtures. 87,88 In this sub-section, the binary interaction parameters (BIP) pertinent to LLE phase behavior of the refining steps of enzymatic biodiesel production processes will be calculated for three correlative models and the LLE of EtOl EtOH glycerol ternary system will be calculated subsequently using these three models. Some notes on local composition theory and mathematical details of models, mainly UNIQUAC and NRTL models pertinent to binary systems have been outlined in Section D of Appendix Binary Interaction Parameters and LLE of EtOl EtOH glycerol Ternary System via Correlative Models Since the BIP of the correlative models are highly sensitive to the method used for minimization and to the data points chosen, the results with such models are less convincing for LLE. For that reason, the method of data reduction is crucial especially for multicomponent LLE simulations. Kontogeorgis and Folas 87 reported that the accuracy of multicomponent LLE prediction, say via UNIQUAC model essentially depends on the type of system considered, the quality/accuracy of the binary data, but also on the method used to obtain BIP values. They have consequently recommended using some experimental LLE data (ternary or multinary), preferably in the form of tie-lines, away from the plait point so as to obtain appropriate predictions of LLE using UNIQUAC and NRTL models. 87 Binary interaction parameters of three correlative models, namely UNIQUAC, NRTL, and modified WILSON (T&K) were regressed using experimental ternary LLE (tie-line) data (84 tie-line data point pairs) measured in our laboratory at 293 and 308 K and also including the data measured by Follegatti-Romero and coworkers 82 at 323 K (7 tie-line data point pairs). Non-linear least squares regression method of Levenberg-Marquardt was preferred. 90 The III-58
128 PHYSICAL (PHASE) EQUILIBRIA LLE and VLE objective function (π) used for minimizing the differences between measured and calculated compositions of all the tie lines is expressed by Eq. (4): t= 1 i= 1 k= 1 π T N 2 k,calculated k,experimental 2 ( xit, xit, ) (BIP) = 2NT min. (4) where i refers to the number of component; k refers to two phases; and t refers to the number of tie-line data points. The parameter values for six binary pairs in accordance with the common DECHEMA LLE data collections were presented in Table 3-8 for NRTL and UNIQUAC models and in SI units for modified WILSON (T&K) model. As are seen from the table, the MAD values are rather insignificant which evidences that data regressions have been converged successfully. it is worth noting that the DECHEMA LLE Data Collection reports the correlation of binary data in terms of only the UNIQUAC equation and the NRTL equation with a constant nonrandomness parameter α ij = 0.2 (see Section D of Appendix 3-1). Since the regression of experimental data using such non-linear models typically results in multiple sets of parameters that can represent the binary data equally well, it is, therefore, of concern to notice that such parameter sets and their values are not unique. Table 3-8 Correlative model parameters for three activity coefficient models. BIP values are in accordance with common DECHEMA LLE Data Collection format for NRTL and UNIQUAC models. BIP of modified WILSON (T&K) model were given in SI units (K). Phase diagrams simulated at 293 and 308 K by means of three correlative models accompanied by experimental binodal curves were demonstrated in Fig As a result, the modified WILSON (T&K) among these three models could not appropriately represent the shape of two-phase region (Type II); whereas all three models simulated the mutual solubility of species in ester rich phase appropriately. As is seen apparently, UNIQUAC is the best among these three models. It was observed, on the other hand, that significant deviation with binodal curves in glycerol rich phase with NRTL model where the non-randomness parameter has been optimized manually, by trial-error method, for the three most recommended values. As is seen in Fig. A3-7 (see Section C in Appendix 3-3) and Fig the most appropriate simulation via NRTL can be obtained using α ij = III-59
129 PHYSICAL (PHASE) EQUILIBRIA LLE and VLE Figure 3-18 Ternary LLE diagrams of EtOl EtOH Glycerol ternary system simulated using correlative UNIQUAC, Modified WILSON (T&K), and NRTL activity coefficient models at K and K. NRTL data was simulated using optimized α ij value (α ij = 0.20). III-60
130 PHYSICAL (PHASE) EQUILIBRIA LLE and VLE Nevertheless, the recommended value for non-polar alcohol systems (α ij = 0.47) resulted with a definitely unrealistic LLE simulation, though the use of α ij values above are claimed to be impossible for the immiscibility calculation (see Fig. A3-7). In conclusion, correlative models can be effectively used for the calculation of LLE at a T range of K, particularly above 90% of reaction completion. It is also important that all three models can be used equally well for the calculation of glycerol solubility in ester rich phase, and conversely Conclusions It was evidenced that the solubility of the by-product glycerol in FAAE is significantly low which results with the formation of equilibrated two-phase system when brought into contact. It was measured that the amount of dissolved glycerol in FAME or FAEE reaches to ca. 1.00% even at 293 K. This comparably low solubility of glycerol still generates technical problems. The dissolved glycerol obviously exceeds the specified limit of 0.02% (w/w). The LLE phase behavior of ternary systems comprising two saturated (EtPa and EtSt); and two unsaturated (EtOl and EtLi) species as the ester components were evaluated through predictions and experimental measurements. Two combinations of assigned functional groups for each individual FAEE species were used in the LLE simulations performed by means of UNIFAC models. It was observed in case of UNIFAC-LLE variant that the impacts of using COO plus CH 2 group or a single CH 2 COO group assigned to ester fragment in EtOl species have considerable differences. Accordingly, it was evidenced that using EtOl-2 combination as the FAEE species reduces the size of two-phase region than using EtOl-1 in case of UNIFAC-VLE and LLE variants based LLE simulations. However, the use of EtOl-2 and EtOl-1 combinations with modified UNIFAC (Do.) model variant generated the opposite behavior where the size of two-phase region was predicted higher with the former combination. Although the estimations performed through UNIFAC-LLE variant (with EtOl-2 combination) give the most appropriate binodal curves, it was observed that UNIFAC model variants underestimate the solubility of glycerol in EtOl and the impact of EtOH addition on the mutual solubilities of EtOl-glycerol binary system. The LLE simulations at relatively higher T values through UNIFAC-VLE and -LLE variants for ternary systems containing saturated FAEE components showed remarkably different patterns where their 1 st combination (EtPa-1 and EtSt- 1) generated the smallest two-phase regions, as in case of modified UNIFAC (Do.) variant (see Part 3 of Appendix 3-3). It was observed in LLE simulations by means of UNIFAC model that both type of ternary systems (containing ethanol or methanol as the acyl acceptor) have analogous LLE phase behavior. Lastly, the solubility estimation of glycerol in EtOl and the impact of EtOH addition on this solubility for conversions beyond 90% by means of UNI- FAC-LLE model were quantitatively reasonable. The LLE predictions by means of COSMO-RS with BP-TZVP parameter set, on the other hand, could properly represent the phase behavior of FAEE EtOH glycerol ternary systems III-61
131 PHYSICAL (PHASE) EQUILIBRIA LLE and VLE containing single ethyl ester species. There observed significant agreements between COSMO-RS simulations and experimental data points for the phase distributions of EtOH component between EtOl rich and glycerol rich phases, particularly for higher conversion levels (> 90%). It was presented that the LLE predictions by means of COSMO-RS method could efficiently represent experimental LLE measurements. In other words, both the phase distributions and mutual solubilities can be estimated quantitatively via this predictive method even at higher T values up to 323 K. Besides, the LLE of ternary systems containing saturated FAEE species can be simulated efficiently using UNIFAC-LLE model variant with the 1 st combination of such species (EtPa-1 and EtSt-1). It was evidenced that glycerol has relatively lower solubility in ester rich phases containing saturated single FAEE species. For instance, the amounts of dissolved glycerol in EtOl rich phase were measured at 293 and 308 K as 1.03% and 1.22%, respectively; whereas the same composition was calculated ca. 0.66% at 313 K for the system containing EtSt component through interpolation of experimental data points reported by Andrade and coworkers. 83 In conclusion, the BIP pertinent to LLE phase behavior of the refining steps of enzymatic biodiesel production processes were calculated for three correlative models and the LLE of EtOl EtOH glycerol ternary system were subsequently calculated using these three models. It was found that UNIQUAC is the best model among these three correlative models. Besides, the most appropriate LLE simulation via NRTL model can be obtained with α ij = As a final point, it was proved that all three models can be used equally well for the calculation of glycerol solubility in ester rich phase and vice versa. III-62
132 PHYSICAL (PHASE) EQUILIBRIA LLE and VLE 4. Predictive Modeling of LLE Phase Behaviors using Quantum Chemical COSMO-RS Method Some LLE simulations of ternary systems containing single FAEE species by means of COS- MO-RS method with BP-TZVP parameterization have been mentioned in Section 3.3. In this section, however, the LLE simulations of ternary and multinary (multicomponent) systems will be further evaluated through the same method. In that respect, 6 different parameterization sets (files) in total will be evaluated with the aim of finding the best one(s) simulating the LLE phase behaviors more appropriately. The binary LLE of reactive substrates in transesterification reactions, such as EtOH-triolein; MeOH-triolein, and glycerol-triolein were mentioned in Part 4 of Appendix A Few Notes on Quantum Chemical COSMO-RS Method and Parameter Sets Phase equilibria of highly non-ideal mixtures containing polar-associating and nonpolar components can be evaluated through methods based on quantum chemical (QC) calculations. 91 One of the most extensively used QC based method is the COnductor-like Screening Model (COSMO) which belongs to the class of quantum mechanical dielectric continuum solvation (or polarizable) models. 92,93 COSMO has become popular in computational chemistry since its first publication and following implementation in MOPAC (Molecular Orbital PACkage). 92 In QC COSMO approach the solute molecules are considered in a virtual conductor environment where each solute molecule induces a screening (polarization) charge density, σ, on the interface between the molecule and the molecular surface (conductor). 94 The screening charge density distribution on the surface of each component i is converted into a probability distribution function known as σ-profile, p i (σ), which represents the relative amount of surface with polarity σ on the surface of the molecule i. 94 There are two thermodynamic model theories based on the implementation of the descriptors from the QC COSMO method: COSMO-RS 95 and Cosmo-SAC 96. The COSMO-RS method where RS pertains to Real Solvents or Realistic Solvation has the basis of statistical thermodynamics approach combined with QC COSMO calculations. It is based on the theory of interacting molecular surface charges which combines statistical thermodynamics methods with an electrostatic theory of locally interacting molecular surface descriptors derived from the dielectric continuum model COSMO. 94 Accordingly, the COSMO-RS method can be defined as the statistical thermodynamics treatment of molecular interactions. In this thermodynamic model theory a compound s polarization charge density, which is described by its σ-profile, is used for the quantification of the interaction energy of pairwise interacting surface segments, resulting in the compound s chemical potential (or its partial GfE). 95,97 The activity coefficient of component i in the system S, Eq.(5): III-63 S γ i then can be calculated through
133 PHYSICAL (PHASE) EQUILIBRIA LLE and VLE S pure S µ i µ i ln( γ i ) = (5) RT where µ is the chemical potential in the solvent (or solvent system) S, and µ pure is the S i chemical potential of the pure component i Parameter Files in COSMO-RS The parameter files (sets) in COSMOtherm software (a software package developed for computational chemistry and fluid thermodynamics calculations based on COSMO-RS method) are required in order to produce reliable, high quality calculations of physicochemical data. 98 In this study, COSMO files of components with their conformers, where available, that are calculated on three different quantum chemical levels were employed: BP- TZVP, BP-SVP, and DMOL3-PBE. Moreover, three different parameterization files based on BP-TZVP (Becke-Perdew (BP) functional for density functional theory (DFT) calculations with a triple valence plus polarization function (TZVP) basis set) quantum chemical level were used: the main BP-TZVP parameter set; BP-TZVP-ISOCAV representing calculation level for parameterization by means of a new type of molecular surface cavity construction method (the scaled iso-density - ISOCAV) which is based on optimized molecular structures on the BP-TZVP quantum chemical level; and another parameterization file (BP-TZVP + HB2010) using the same quantum chemical level involving a Hydrogen Bond interaction term (HB2010). All of these parameterizations in COSMOtherm software are based on quantum chemically optimized geometries at the given method or basis set level. The BP- TZVP parameter set is recommended for high-quality calculation requirements for mixture properties (VLE, LLE) of small to medium sized molecules up to 25 non-hydrogen atoms. 94,99 However, it has been stated that an equal quality of prediction can also be obtained using DMOL3-PBE (DFT with PBE functional and numerical DNP basis set for PBE/DNP quantum chemical level calculated by the DMOL3 program) parametrization. 94 Besides, BP-SVP-AM1 (BP functional for DFT calculations with a split valence plus polarization function (SVP) with a semi-empirical quantum chemical method for (AM1) molecular structures) parameterization recommended for larger molecules and screening level sigma-profile purposes was also used. Recently, a new high quality quantum chemistry level (including diffuse basis functions) in association with a novel hydrogen bonding term (HB2012) and parameter set has been released (BP-TZVPD-FINE parameterization file in COSMOtherm software v.c3.0_12.01). 100 The main characteristic of this parameterization file is called as the COSMO single point calculation which uses the large TZVPD basis set with additional diffuse basis functions and a novel type of molecular surface cavity construction (fine grid marching tetrahedron cavity, FINE). This way of cavity construction creates a COSMO surface whose segments are more uniform and evenly distributed compared to the standard COSMO cavity. Some other im- i III-64
134 PHYSICAL (PHASE) EQUILIBRIA LLE and VLE proved properties in terms of HB2012 term are a better representation of steric hindrance effect for H-bonding and inclusion of some associative effects. 100,101 In overall, 6 different parameterization files, with their updated versions in some cases, were evaluated for LLE phase behavior simulations by means of COSMO-RS method. A small literature survey exposed that COSMO-RS method has been applied to describe the fluid phase equilibria of systems, such as the LLE of water-hydrocarbon mixtures, 102 VLE of mixtures containing polar chemicals, 103,104 VLE of butane + alcohols, 105 and VLE of binary mixtures of 1-propoxy-2-propanol with alcohols and water at reduced pressures. 106 Furthermore, the application of COSMO-RS method to the phase equilibria (VLE and LLE) calculations involved in biocatalytic biodiesel production processes has been recently reported by Güzel and Xu LLE Phase Behavior of Vegetable Oil FAEE EtOH Ternary Systems The LLE phase diagrams of two cases -oleic and linoleic- simulated at 303 K and 318 K were illustrated in Fig for the predictions obtained via BP-TZVP parameterization. As expected, the mutual solubility in linoleic case (trilinolein EtLi EtOH) was found higher than in oleic case. There observed significant impacts of FAEE species formation (addition) on both phases, but particularly on EtOH rich phases. Besides, there noticed considerable initial solubility difference between triolein (1.92%) and trilinolein (3.17%) in EtOH predicted at 303 K. On the other hand, the initial solubilities of dry EtOH in triolein and trilinolein were predicted at the same T value as ca.4-5% which was predicted slightly higher in triolein. Incidentally, the solubilities of SFO-HO oil (min. 91% C18:1) in EtOH were measured at 308 and 313 K as 2.70% and 2.73%, respectively; though Batista et al. 51 reported 4.28% of EtOH solubility in triolein at 303 K. As a result, there is a substantial difference between the two experimental measurements. As is also seen, COSMO-RS method can appropriately estimate, even better than UNIFAC-LLE, the initial solubility of oils in EtOH (see also Fig and 3-11 presented in Section above). Therefore, it is plausible to state that COSMO-RS method with BP-TZVP parameterization can be used only for species phase distributions in such ternary systems. Conversely, it is yet of concern that solubility predictions (initial solubilities in oil or in EtOH) are lower than experimentally measured ones. III-65
135 PHYSICAL (PHASE) EQUILIBRIA LLE and VLE Figure 3-19 LLE phase diagram of TAG FAEE EtOH ternary system predicted using COSMO-RS method (COS- MOtherm C2.1_01.11) at K and K through BP-TZVP parameterization. An oil conversion of 99.5% was assumed with 30% (n) excess amount of EtOH feed. As it can be seen from Fig for a reaction completion of 99.5% that EtOH phase distribution ratio increases with the diminution of global EtOH concentration (30% molar excess initial feed). EtOH concentration within the oil rich phase increases with the increase in EtOl composition (formation). In overall, LLE simulations via COSMO-RS method using both of the parameterization files underestimate the solubility and mutual solubilities of ternary systems with simple TAG species, particularly in oil rich phases. However, they can be used for assessing phase distribution ratios of species. As a conclusion, it was evidenced that the solubility of polar components in non-polar species (solvent) still remain a problem and got even slightly worse with new BP-TZVPD-FINE parameterization. Figure 3-20 Change in phase distribution of EtOH with global EtOH composition for Triolein EtOl EtOH ternary system estimated using COSMO-RS method (COSMOtherm C3.0_12.01) at K and K through BP-TZVPD-FINE parameter set (see Fig. S-14 given in Part 5 of Appendix 3-3). A conversion of 99.5% was assumed with 30% (n) excess amount of EtOH feed. In order to assess the impact of different parameterization sets on the LLE phase behavior of oleic ternary system, four different parameterizations were employed. Fig illustrates III-66
136 PHYSICAL (PHASE) EQUILIBRIA LLE and VLE the binodal curves each accompanied by two tie-lines simulated at 303 and 318 K. According to these simulations the most appropriate simulation in oil rich phase when compared with experimental results depicted in Fig was obtained with DMOL3-PBE parameterization; whereas it gives unrealistic solubility line (depicted as the other part of binodal curve) in EtOH rich phase. The largest two-phase region was obtained with BP-TZVPD-FINE parameter set, as expected. Figure 3-21 LLE phase diagram of triolein EtOl EtOH ternary system predicted using COSMO-RS method (COSMOtherm C3.0_12.01) at K and K through four parameter sets. It has been reported that moisture content in EtOH decreases its solubility in oils and also in FAAE species. 70 The liquid-liquid phase equilibrium simulations of ternary (quaternary) systems containing rectified EtOH that can be employed as the acyl acceptor were performed for stoichiometric and excess amount of EtOH feeds. Here, the purpose was assessing aq. EtOH impact on the LLE phase behavior. By the way, it is noticeable that such LLE simulations shown in Fig were indeed performed for quaternary systems. As can be seen from the phase diagrams depicted in this figure that there is a significant decrease in mutual solubilities with rectified EtOH use where the oleic and linoleic cases exhibit almost equivalent binodal curve pattern as in case of dry EtOH presented in Fig above. The moisture content (4.37 wt. %) in EtOH has significant impact on particularly EtOH rich phases. Although the second simulation temperature value was noticeably high (323 K), there was no significant changes in mutual solubilities which verifies the adverse impact of moisture on mutual solubilities. In Fig a relatively more complex (multicomponent) LLE simulation was illustrated where both oil (SBO) and its FAEE derivative (species) were modeled according to measured FA composition of oil. Beside of triolein and trilinolein three more COSMO compounds representing mixed TAG species were developed (by means of Turbomole v.6.0 software): LiOlPa, OlLiPa, and OlLiOl. Each mixed TAG species was weighted by the arbitrarily III-67
137 PHYSICAL (PHASE) EQUILIBRIA LLE and VLE assigned FA percentages measured for soybean oil (SBO) as given in Fig caption. The FA composition of modeled SBO was as follows: 17.27% LiOlPa; 14.80% OlLiPa; 14.62% OlLiOl; 5.59% triolein, and 47.74% trilinolein as the major component. Likewise, FAEE species (blend) was modeled with 5 single ethyl ester species: EtPa, EtSt, EtOl, EtLi, and EtLn weighed in accordance with soybean oil FA composition. In other words, FAEE species was built through combining single ethyl ester species weighted by the measured FA composition of oil. Consequently, two multicomponent LLE simulations encompassing 5 TAG species, 5 FAEE species and EtOH in case of dry (absolute) EtOH and 1 more component (H 2 O) in aqueous EtOH case were performed. The LLE phase diagrams accompanied by conversion lines (global compositions) were illustrated in Fig for 303 and 323 K. Figure 3-22 Ternary LLE phase diagrams of TAG FAEE Rectified EtOH (96%) quaternary system simulated at K and K using COSMO-RS method (COSMOtherm C2.1_01.11a) through BP-TZVP parameter set. An oil conversion of 99.5% was assumed with stoichiometric and 30% (n) excess amount of EtOH feeds. Global compositions represent the linear (idealized) conversion line for stoichiometric and excess EtOH feeds. A left-side-shift of conversion lines by EtOH feed ratios can be seen. The arrows (in pink and in green colors) on conversion lines represent the direction of reaction courses. In these multicomponent LLE simulations a better representation of phase behavior was obtained when it is compared with experimental results depicted in Fig. 3-10, particularly for the addition (formation) of higher amounts of FAEE. Analogous to Fig there observed a considerable enlargement in the size of two-phase region in case of rectified EtOH. The initial solubility of SBO in EtOH at 300 K was measured as 2.98%; whereas that of EtOH in SBO was 15.63% (see Fig and Table 3-5 in Section 2.2.3). As it can be obviously seen even this multicomponent LLE simulation approach does not accurately represent the phase behavior of SBO FAEE EtOH ternary system particularly in oil rich phase which is crucial for enzymatic transesterification reactions. In Fig phase distribution of EtOH versus its composition in alcohol rich phase was demonstrated for two forms of EtOH. As is seen from this figure, there is a significant increase in EtOH concentration distributed in SBO rich phase for 20 K of temperature change, particularly for rectified form of EtOH. III-68
 through BP-TZVP parameter set. (Both aqueous and pure EtOH were simulated) SBO and FAEE derivative molar compositions 108 were taken as 10.82% C16:0; 4.89% C18:0; 25.21% C18:1; 51.")
138 PHYSICAL (PHASE) EQUILIBRIA LLE and VLE Figure 3-23 Ternary (multinary) LLE diagram of SBO FAEE EtOH reaction system simulated at K and K using COSMO-RS method (COSMOtherm C2.1_01.11a) through BP-TZVP parameter set. (Both aqueous and pure EtOH were simulated) SBO and FAEE derivative molar compositions 108 were taken as 10.82% C16:0; 4.89% C18:0; 25.21% C18:1; 51.61% C18:2, and 7.47% C18:3. An oil conversion of 99.5% was assumed with 30% (n) excess amount of EtOH feed. Global compositions represent idealized conversion line for excess EtOH feed. Figure 3-24 Changes of EtOH and rectified EtOH (96%) phase distribution ratios with respect to its concentration increase in EtOH rich phase for ternary (multinary) LLE phase diagram of SBO FAEE EtOH ternary reaction system simulated at K and K by means of COSMO-RS method (COSMOtherm C2.1_01.11a) at K and K through BP-TZVP parameter set. (see Fig caption for further information) 4.3. LLE Phase Behavior Simulations of TAG FAEE Glycerol and FAAE EtOH Glycerol Ternary Systems LLE Simulations for TAG FAEE Glycerol Systems In contrast to LLE simulations performed by means of COSMO-RS method, it was experimentally verified in Section that there exist single phase reaction media even at the beginning of reactions employing stoichiometric or up to 15% molar excess feeds of absolute EtOH. In that respect, it can be expected that the reaction medium consists of a fatty mixture and dissolved EtOH with decreasing concentration for up to 30% of reaction completion where the formed glycerol is completely miscible due to both its partial miscibility III-69
139 PHYSICAL (PHASE) EQUILIBRIA LLE and VLE with the ester phase and thanks to high EtOH concentration. Here fatty mixture refers to oil and its FAEE derivatives or oil, FFA, and FAEE derivatives in case of waste/used oil as the substrate. In order to check the validity of this expectation for reaction completions above 30%, it is required inspecting phase behavior of TAG FAEE glycerol ternary systems. The LLE phase diagrams simulated at 303 and 318 K employing BP-TZVP parameterization for oleic and linoleic cases were shown in Fig below. It is obvious from these diagrams that glycerol is miscible neither with FAEE derivatives nor with simple TAG species representing neat vegetable oils. Therefore, as it will be shown in Section and in Section 6 for multicomponent cases that practically immiscible statement for glycerol species is valid even below 30% of reaction completion in the absence of excessive EtOH concentration. Accordingly, the fatty statement can also be accepted only for FAEE derivatives throughout of the reaction time course. The ternary LLE simulations containing single FAEE components and FAEE blends were presented in Section 4.3.2; while cases with FFA containing oils and more composite systems will be discussed in Section 6 below. Figure 3-25 Predicted LLE diagram of TAG FAEE Glycerol ternary system using COSMO-RS method (COS- MOtherm C2.1_01.11a) at K and K through BP-TZVP parameter set. An oil conversion of 99.5% was assumed. The LLE simulations of the oleic system employing the novel BP-TZVPD-FINE parameterization set including improved H-bonding term has been mentioned in Part 5 of Appendix 3-3 (see Fig. S-15) Simulations of LLE in FAEE EtOH Glycerol Mixtures The comparisons of experimental and simulated LLE phase diagrams using BP-TZVP parameterization have been reported in Section 3.3 for single ethyl ester (FAEE) species. Therefore, in this sub-section some further details of ternary system simulations through different parameter sets employment and the cases comprising FAEE blend (weighted blend of III-70
140 PHYSICAL (PHASE) EQUILIBRIA LLE and VLE single ethyl ester species) accompanied by reported experimental measurements will be evaluated. The impacts of 4 different parameter sets on the LLE of EtOl EtOH glycerol ternary system predicted at 293 and 308 K were illustrated in Fig It was observed that the smallest two-phase region was predicted using DMOL3-PBE and BP-SVP-AM1 parameterization sets; while the largest was with BP-TZVPD-FINE, as expected. An increase of 15 K in temperature did not affect the mutual solubilities of FAEE and glycerol species in case of adding EtOH as the third component; particularly at the regions pertaining to reaction completions above 90% (see Fig and 3-28 below). Figure 3-26 LLE phase diagrams of EtOl EtOH Glycerol ternary system predicted at K and K via COSMO-RS method (COSMOtherm v.c3.0_12.01) using four parameter sets. The binary LLE simulations of ethyl ester and glycerol species illustrated in Fig. S-13 (see Part 4 of Appendix 3-3) revealed that the solubility order of FAEE species in glycerol for a T range of K using BP-TZVPD-FINE parameterization is as follows: EtLi > EtLn > EtPa > EtSt > EtOl. In contrast, the LLE phase diagrams of ternary systems containing each of these single species which were predicted at 293 and 308 K by means of BP-TZVP parameter set resulted with a significantly different pattern, as is seen in Fig In this case, however, the solubility order in FAEE rich phases was found as follows: EtLn > EtLi > EtPa > EtOl > EtSt. The same pattern was also observed in glycerol rich phases (see also Fig below). Consequently, the size of two-phase regions follows the same increasing order. Even though the differences in solubility order can be attributable to the differences among two parameter sets, it should mostly be considered because of the impact of third component (EtOH) addition. Analogously, the LLE phase behavior of MeOl MeOH glycerol ternary system was also simulated using BP-TZVP parameterization and the phase diagrams predicted at 303 and 318 K were depicted in Fig. A3-8 (see Section D of Appendix 3-3). III-71

141 PHYSICAL (PHASE) EQUILIBRIA LLE and VLE Figure 3-27 LLE phase diagrams of FAEE EtOH Glycerol ternary systems simulated at K and K via COSMO-RS method (COSMOtherm v.c2.1_01.11 with BP-TZVP parameterization) Comparisons of LLE phase behavior for ternary systems containing single FAEE species III-72
142 PHYSICAL (PHASE) EQUILIBRIA LLE and VLE As a matter of fact, biodiesel produced from soybean or rapeseed oil feedstocks are mainly comprised of five different FAAE species that have conventional names of palmitic, stearic, oleic, linoleic, and linolenic acid alkyl esters. Furthermore, the compositions of biodiesel fuels can be considered essentially identical to the fatty acid (FA) composition of the corresponding TAG or FFA sources. 43,44 Accordingly, a multicomponent LLE phase behavior simulation at 303 K was performed for a system comprised of 5 FAEE species weighted with the corresponding FA composition in the oil source (see the caption of Fig. 3-23); EtOH and glycerol was performed using BP-TZVP parameterization. It is well-known that the rotational symmetry of a carbon carbon single bond allows the atoms or groups of atoms connected by that bond to rotate about it. By reason of such rotations, many molecules assume several different 3-D forms. They are called as conformations where some conformations of a particular molecule are more stable than the others are. Consequently, all the simulations were performed using three conformers for saturated FAEE species (EtPa and EtSt); though only one conformer for each unsaturated FAEE species (EtOl, EtLi, and EtLn) was used. Besides, EtOH was simulated using two conformers and the by-product glycerol with 10 conformers. The sigma profiles of FAEE, EtOH and glycerol conformations were given in the Appendix of published paper attached to Appendix 3-4. In LLE simulations, all the conformers were weighted according to their Boltzmann distributions in the system. 94 Moreover, the conformation numbers of all species used throughout of this chapter were presented in Table A3-4 for five parameter sets (see Section G of Appendix 3-3). As is seen from the phase diagrams depicted in Fig. 3-28, there observed significant agreement with the reported measurements, particularly with those of Oliveira and coworkers 81 who used rapeseed oil FAEE as the biodiesel species. It is incidentally worth noting that tieline data reported by Liu et al. 56 were measured at 300 K using FAEE obtained from SBO. Further information and detailed evaluations can be found in the paper given in Appendix 3-4. The distribution ratios of FAEE species between the FAEE rich and glycerol rich phases were illustrated in Fig As it can be perceived EtLn as the most unsaturated member has the highest affinity for glycerol rich phase followed by EtLi species; whereas the lowest affinity was exerted by the long-chained saturated FAEE (EtSt) species. In this regard, it can be deduced that the removal of glycerol rich phase with the progress of reaction might help to increase the cetane number and oxidative resistance of the biodiesel. Moreover, it might help to shift the reversible reactions towards product(s) side. However, the simultaneous removal of EtOH should also be considered. Since, it has higher affinity for glycerol rich phase than the fatty rich one, as shown in Fig III-73
143 PHYSICAL (PHASE) EQUILIBRIA LLE and VLE Figure 3-28 Ternary LLE phase diagram of FAEE EtOH Glycerol ternary systems at K simulated using COSMO-RS method (COSMOtherm v.c2.1_01.11 with BP-TZVP parameterization). Experimental LLE data of Oliveira et al., and Liu et al, were converted into mole percentages. LLE data from Liu et al., 2008 was measured at K. FAEE composition was the same as given in Fig Figure 3-29 Change of phase distribution ratios of fatty acid ethyl ester species simulated in Fig at K through conversion The phase distribution ratios calculated using four reported experimental tie-line data measurements accompanied by the distribution ratio based on multicomponent LLE simulation results were depicted in Fig with the aim of demonstrating their changes with respect to increase in EtOH concentration in glycerol rich phase. Although the results reported by Machado et al. 84 for SBO based FAEE species measured at 333 and 298 K have considerably different pattern which could be attributed to high T effect on EtOH evaporation or measurement errors, it is still obvious to deduce that there is a synergistic relation between K EtOH and EtOH concentration in glycerol rich phase. In other words, EtOH concentration in fatty (FAEE) rich phase decreases with the reaction progress on accounts of EtOH consumption and by-product glycerol formation. III-74
144 PHYSICAL (PHASE) EQUILIBRIA LLE and VLE Figure 3-30 Phase distribution ratios change for EtOH between FAEE and glycerol rich phases with EtOH concentration in glycerol rich phase Experimental LLE data (reported by Liu et al., , Oliveira et al., , and Machado et al., ) versus COSMO-RS simulation (COSMOtherm v.c2.1_01.11 with BP-TZVP parameterization) Solubility of Glycerol and Water in FFA Species COSMO-RS Simulations It was mentioned in Chapter 2 that waste/used oils, as being cheaper feedstocks, have FFA content ranging from 2% up to 71.3% (as in coconut and palm kernel distillates). On the other hand, there is a risk or probability of FFA formation with rectified EtOH involvment as a result of consecutive hydrolysis and esterification reactions, as discussed in Chapter 4. Moreover, waste oil sources also contain considerable amount of water. Therefore, the solubility of reactive substrates or their distribution among the biphasic systems can help to a better understanding of phase behaviors. The pure forms of saturated FFA in vegetable oils are in solid state at STP, for instance, pure lauric acid is solid up to K 109 ; while the pure forms of unsaturated FFA are in liquid state. Therefore, the binary LLE of lauric, myristic, palmitic, and stearic acid species with glycerol or water at 308 K mentioned below should be considered definitely as hypothetical. Instead, SLE simulations need to be performed. However, since we are dealing with FFA content within vegetable oils which are already in liquid mixture forms, the LLE simulation can be used so as to assess their solubility behaviors. Therefore, binary LLE simulations were performed using five parameterization sets and solubility results were illustrated in Fig It was observed that there is an inverse relation between the saturated FFA carbon number and miscibility with water or glycerol; while a linear solubility relation with the numbers of double bond in unsaturated FFA. The highest solubilities of glycerol and water in FFA were obtained with DMOL3-PBE parameterization; while the lowest ones were with BP-TZVPD- FINE in case of glycerol and BP-TZVP in water case. However, the binary LLE simulation with BP-TZVP parameterization in COSMOtherm v.2.1_01.11a was not successful in lauric, linoleic and linolenic acid and water binaries owing to numerical inconsistency among the spinodal and binodal points. The same problems were also observed with BP-TZVPD-FINE in myristic acid and with DMOL3-PBE with palmitic and stearic acid cases. It is noticeable that even III-75

145 PHYSICAL (PHASE) EQUILIBRIA LLE and VLE though the solubility predictions using the old and new versions of BP-TZVP parameter set give almost the same values, they revealed significant difference in case of water solubility. In contrast to COSMO-RS method, the solubilities of glycerol in oleic, linoleic, and linolenic acids predicted via UNIFAC model variants at 308 K revealed significantly lower values as shown in Fig. A3-9 (see Section E of Appendix 3-3). Figure 3-31 Solubilities of glycerol and water in free fatty acids (FFA) at K simulated using COSMO-RS method (COSMOtherm versions C3.0_12.01 and C2.1_01.11a) through five parameter sets (see figure legend for details). Solubilities of saturated FFAs are hypothetical. (The expected solid-liquid equilibria for saturated FFA were not taken into consideration) On the other hand, Knothe and coworkers have stated that in down-processing of conventional biodiesel (FAME) production FFA are not soluble in the glycerol and will rise to the top where they can be removed and recycled afterwards. 44 Marrone et al. 110 have reported the solubilities of palmitic, stearic, and oleic acid in glycerol at a T range of K. According to their results, the corresponding solubilities (expectedly in wt. %) of palmitic, stearic, and oleic acid in pure glycerol were between ; ; and , respectively. However, the predicted solubility of OlAc, for instance, using UNIFAC-LLE model variant was between 0.42 and 0.91 for the same T range. In conclusion, it was predicted that glycerol has very high affinity for FFA than water has. Accordingly, if the predictions by COSMO-RS method are accepted as reliable, reactive systems comprising waste/used oils as the substrate may form more homogenous mixtures during the initial parts of reaction courses which may or may not prevent higher product yields depending on the mixture compositions and reaction conditions. Nonetheless, it is of concern to emphasize that such reaction media are highly complex and depend on several parameters owing to the involved reactions (see Chapter 4 for some further discussions). III-76
146 PHYSICAL (PHASE) EQUILIBRIA LLE and VLE 4.5. LLE Simulations for Free Fatty Acid Containing (in Waste/Used Oil) Ternary Systems using COSMO-RS and UNIFAC Model Variants It was observed that FFA has highly fostering impact on the solubilities of both water and glycerol within fatty systems, especially in the reactions of waste/used oil as the substrate. Consequently, the evaluation of FFA impacts on the mutual solubilities of vegetable oils and EtOH/glycerol binary systems or on FAEE glycerol binary system needs to be performed. In this sub-section, the LLE phase diagrams of ternary systems will be demonstrated by means of two predictive methods: GCM based two UNIFAC model variants and COSMO-RS method. Their comparisons with experimental measurements will also be assessed, where available Simulations of pseudo-tag FFA EtOH Ternary Systems with UNIFAC Model Variants The simulations of LLE at 293 and 308 K by means of UNIFAC-LLE variant was illustrated in Fig for SFO-HO-(x) OlAc EtOH ternary systems accompanied by the experimentally measured binodal curves for analogous systems of triolein and RSO as the oil components. In this regard, the FFA species -Oleic acid (OlAc)- was modeled by assigning 1 CH 3 ; 14 CH 2 ; 1 HC=CH; and 1 COOH functional groups. The functional groups assigned to SFO-HO-(x) and EtOH components were presented in Table 3-2 (see Section 1.6). The phase diagrams pertaining to the same system simulated by means of modified UNIFAC (Do.) model variant were given in Part 5 of Appendix 3-3 (see Fig. S-16). Analogous to LLE phase diagrams demonstrated in RHS of Fig 3-3 and in LHS of Fig. S-7 (see Part 2 of Appendix 3-3) which were predicted by means of corresponding UNIFAC-LLE and modified UNIFAC (Do.) variants, the smallest two-phase regions were obtained with SFO- HO-2 and SFO-HO-4 combinations, respectively. However, none of such GCM based predictive model variant can appropriately simulate the measured mutual solubility impacts of FFA (OlAc). The binodal curves measured by Batista et al. 51,73 exhibit considerably smaller twophase regions which can be interpreted as OlAc has pronounced impact on the mutual solubilities of EtOH and vegetable oils.by the way, it is noteworthy that these reported LLE measurements were accomplished through methods of potentiometric titration for FFA determination and vacuum oven for EtOH; while oil compositions were determined by difference. Nevertheless, according to both simulations and measurements, the use of waste/used oils containing substantial amount of FFA as the feedstocks can improve the homogeneity of reaction media even at highly excess amounts of EtOH feeds. In this regard, LLE simulations of Veg. Oil FFA glycerol or FAEE FFA glycerol ternary systems have also been performed by means of the same UNIFAC model variants. It was observed, however, that the addition of FFA as the third component does affect the mutual solubilities of neither Veg. Oil and glycerol nor FAEE and glycerol species (diagrams were not shown). III-77
147 PHYSICAL (PHASE) EQUILIBRIA LLE and VLE Figure 3-32 LLE phase diagrams of SFO-HO-(x) OlAc EtOH ternary systems predicted at K and K by means of UNIFAC-LLE model variant (x = 1,,4). The assigned functional groups to pseudo-sfo-ho species were presented in Table 3-2. Experimental data points measured at K and K for Triolein OlAc EtOH and RSO OlAc EtOH ternary systems containing commercial oleic acid having 83.12% of C18:1 content have been reported by Batista et al. 51 and Batista et al. 73, respectively. III-78
148 PHYSICAL (PHASE) EQUILIBRIA LLE and VLE Simulations by means of COSMO-RS Method As shown above none of the UNIFAC model variants can effectively simulate the LLE of FFA containing ternary systems. In this sub-section, therefore, the LLE phase behavior will be simulated by means of COSMO-RS method through five parameter sets for three case studies. In these simulations, considering oleic and linoleic cases by means of BP-TZVP parameterization, a relatively neat vegetable oil comprising an initial composition of 0.25% FFA reaching to 1.00% of final composition value (based on oil feed weight) was assumed for an oil (TAG) conversion up to 99.5% where dry EtOH (99.9%) substrate was 30% (n) in excess. Furthermore, the influence of simultaneous esterification reaction was also considered. In addition, a more realistic case study involving the use of waste/used oil containing 9.57% of FFA and 0.03% of water was assumed where 95% of TAG conversion and 85% of FFA conversion were considered for the three concurrent reaction sets (transesterification, hydrolysis, and esterification) Case 1: TAG FFA EtOH Ternary Systems The LLE phase diagrams of oleic and linoleic cases simulated at 303 and 318 K using BP-TZVP parameterization were shown in Fig Based on these simulations, it was observed that there is no substantial difference between two unsaturated FFA on changing mutual solubilities of their corresponding triacylglyceride (TAG) forms and EtOH, especially at lower FFA concentrations. The sizes of two-phase regions increased in cases of BP-TZVP-ISOCAV and BP-TZVPD-FINE parameterizations for oleic case, as shown in Fig for the same T values. The results with BP-TZVPD-FINE can be attributable to the effect of self-associative (or cross-associative) H-bonding mainly in (between) OlAc and EtOH species. It was evidenced that BP-SVP-AM1 parameterization resulted with the smallest two-phase region in size only at 303 K where it was not possible to find tie-line points using DMOL3-PBE at both T values. The phase distribution ratio of OlAc between EtOH rich and triolein rich phases versus global OlAc concentration was depicted in Fig where it was conceivable to deduce that OlAc added prefer predominantly the EtOH rich phase. Nonetheless, its K-value approach exponentially to unity which indicates that high FFA content in oil may help to the formation of homogeneous reaction medium. According to these simulations the global composition lines ( conversion lines ) remain almost in the two-phase regions, as is seen in Fig On the other hand, an examination of experimental ternary LLE phase diagrams of water containing Veg. Oil FFA EtOH H 2 O quaternary systems illustrated in Fig. A3-10, A3-11, and A3-12 (see Section F in Appendix 3-3) have revealed that water has an antagonistic impact on the LLE of the reactive systems. Therefore, the use of waste/used oils having considerable amount of water beside of FFA may prevent the formation of homogeneous reaction media. Additionally, as shown in Fig. 3-9 (see Section 2.3.2); the inclusion of 6% water in EtOH markedly decreases its solubility in vegetable oils. III-79
149 PHYSICAL (PHASE) EQUILIBRIA LLE and VLE Figure 3-33 Simulated LLE binodal curves of TAG FFA EtOH ternary system using COSMO-RS method (COS- MOtherm v.c2.1_01.11a with BP-TZVP parameterization) at K and K. In simulating the LLE diagrams, an initial composition of 0.25% and final composition of 1.00% FFA (based on oil weight) was assumed for an oil conversion of 99.5% (EtOH feed was 30% (n) in excess). Figure 3-34 LLE phase diagrams of Triolein OlAc EtOH ternary system simulated at K and K using COSMO-RS method (COSMOtherm v. C3.0_12.01) through four parameterization sets. In conclusion, a comparison of predictive methods with experimental binodal curves (see Fig and Fig. S-16) revealed that neither COSMO-RS method nor UNIFAC model variants can quantitatively represent the measured binodal curves. However, UNIFAC-LLE variant with SFO-HO-2 combination and COSMO-RS method with BP-TZVP parameterization resulted with the most appropriate binodal curves for the conversion line (global composition) of oleic case depicted in Fig and III-80
150 PHYSICAL (PHASE) EQUILIBRIA LLE and VLE Figure 3-35 Change in phase distribution ratio of OlAc with global OlAc feed for Triolein OlAc EtOH ternary system estimated using COSMO-RS method (COSMOtherm v.c3.0_12.01) at K and K through BP-TZVPD-FINE parameter set. An initial composition of 0.25% and final composition of 1.00% FFA (based on oil weight) was assumed for an oil conversion of 99.5% (EtOH feed was 30% (n) in excess) Case 2: TAG FFA Glycerol Ternary Systems In order to assess phase distribution of FFA between glycerol rich and oil rich phases, LLE simulations analogous to Case 1 were performed for TAG FFA glycerol system where the only difference was the use of by-product glycerol instead of EtOH substrate. The LLE phase diagrams pertain to oleic and linoleic cases were illustrated in Fig for BP-TZVP parameterization and in Fig using four different parameterizations applied only to oleic case. As is seen, the binodal curves obtained through BP-TZVP-ISOCAV and BP- TZVPD-FINE parameter sets giving the largest two-phase regions are almost overlapping. Besides, it was observed in these simulations that glycerol becomes more soluble with the increase in FFA concentration where there is no considerable difference between oleic and linoleic TAG species. Since they are practically insoluble in glycerol, as discussed in Section 4.4 above, FFA addition does not affect the solubility of oils (TAG) in glycerol rich phase. It was observed that LLE prediction using BP-TZVP-ISOCAV and BP-TZVPD-FINE parameterizations generate significantly low impact of FFA addition on the mutual solubility of oil and glycerol thanks to relatively lower solubility of glycerol in oleic acid (see Fig in Section 4.4 for the predictions performed at 308 K). The highest glycerol solubility in oil rich phase with the help of FFA addition was obtained using DMOL3-PBE parameter set. In overall, an increase of 15 K in temperature did not affect the simulated mutual solubilities of species in both phases. It is again possible to consider that the use of waste/used oil with FFA content higher than, say 50% can help to the formation of homogenous reaction media in case of enzymatic ethanolysis reactions employing 30% or higher molar excess EtOH feeds. Since, as mentioned above, neat vegetable oils contain ca. 10.5% of glycerol which corresponds to a 97.7% of reaction completion, the ultimate amount of glycerol formed in this case cannot exceed 5% of the initial oil feed. This point will be further discussed in the next sub-section. III-81
151 PHYSICAL (PHASE) EQUILIBRIA LLE and VLE Figure 3-36 LLE phase diagrams of TAG FFA Glycerol ternary system predicted at K and K by means of COSMO-RS method (COSMOtherm C2.1_01.11a) through BP-TZVP parameter set. See Fig caption for further details. The purple conversion line corresponds to 98% of reaction completion (for both TAG and FFA species) employing waste/used oil containing 30% of FFA. The impacts of EtOH feed and formed/consumed H 2 O was ignored. Figure 3-37 Simulated phase diagrams for LLE of Triolein OlAc Glycerol ternary system at K and K using COSMO-RS method (COSMOtherm v.c3.0_12.01) through four parameter sets Case 3: FAEE FFA Glycerol Ternary Systems A trivial evaluation of Section and Section 3.3 reveals that glycerol has slightly higher solubility in FAEE than in TAG species, owing to less branched molecular structure of FAEE presenting reduced steric hindrance effect and relatively low non-polar surface. The case with ternary system including FAEE components will be evaluated in this sub-section where a fatty phase comprised of FAEE and FFA species was accepted. Phase diagrams of oleic and linoleic cases were illustrated in Fig using BP-TZVP parameterization. Glycerol solubility in fatty rich phase is relatively higher and approaches to the same levels as in Fig representing the cases with TAG species, particularly at low FFA compositions. III-82
 through BP-TZVP parameter set. See Fig. 3-33 caption for further details. The LLE of ternary systems for oleic cases were illustrated in Fig.")
152 PHYSICAL (PHASE) EQUILIBRIA LLE and VLE Figure 3-38 Predicted LLE phase diagrams of FAEE FFA Glycerol ternary system at K and K via COSMO-RS method (COSMOtherm v.c2.1_01.11a) through BP-TZVP parameter set. See Fig caption for further details. The LLE of ternary systems for oleic cases were illustrated in Fig for simulations using five parameterization sets. It was found that parameter sets result with similar patterns observed as in Case 2 of TAG species. DMOL3-PBE parameter set gave the smallest two-phase regions. The binodal curves pertaining to fatty rich phase change non-linearly with FFA addition for each parameter set. Therefore, the formation of FAEE parallel to the decrease in oil (TAG) concentration that comprises excessive amount of FFA as the feedstocks together with constancy or increase in FFA concentrations (depending on the oil and alcohol feeds compositions) improves the possibility of homogeneous reaction media formation by dissolving larger amounts of glycerol in fatty phases. Since, such reaction media could help to surmount the external mass transfer problems that are often observed in biphasic systems. In such cases, it is expected that the initial water concentration(s) of oil and/or EtOH should not pass 4% which is already soluble in FFA (see Fig in Section 4.4 and also Fig.3-32 and 3-34) or in a homogeneous mixture of fatty species and alcohols (glycerol and EtOH). Distribution ratios of glycerol between EtOl rich and glycerol rich phases presented in Fig evidenced that K-value is almost inversely proportional to the glycerol formation. In overall, it was again verified that glycerol species has a significant tendency to split from fatty phases, even with oils containing very high amounts of FFA so as to create a second liquid phase for the given T range. III-83
153 PHYSICAL (PHASE) EQUILIBRIA LLE and VLE Figure 3-39 Simulated LLE phase diagrams of EtOl OlAc Glycerol ternary system at K and K using COSMO-RS method (COSMOtherm v.c3.0_12.01) through five parameter sets. Figure 3-40 Change in phase distribution ratios of glycerol with its global feed for EtOl OlAc Glycerol ternary system simulated at K and K by means of COSMO-RS method (COSMOtherm v.c3.0_12.01) with BP-TZVPD-FINE parameterization. On the other hand, as it was shown in Fig that the homogeneous single phase formation can only be observed in the very beginning of the reaction course. The conversion line given in purple color represents 98% of reaction completion for a waste/used oil feed containing 30% of FFA. Since glycerol passing ca. 1.0% of concentration is not miscible with fatty medium (FAEE + TAG) for a T range of K, the system eventually turns into a biphasic system with the increase in glycerol concentration. The FFA content of oil source can, however, increase the amount of dissolved glycerol in fatty medium up to 2 5% depending on the composition of reaction media (mainly of FFA) and temperature. In addition, as mentioned above, the existence of increasing water concentration enlarges the sizes of two-phase regions (compare Fig. A3-10, A3-11, and A3-12 in Section F of Appendix 3-3). For that reason, though it may improve the activity of immobilized lipase enzymes, high concentration of water increases the likelihood of phase separation. III-84
154 PHYSICAL (PHASE) EQUILIBRIA LLE and VLE A Realistic Simulation using Waste/Used Oil Feedstocks In order to develop a more realistic simulation of enzymatic biodiesel (FAEE) production, waste/used oil containing 9.57% of FFA (30% molar) and 0.03% of water ( ppm; 1.5% molar) both based on oil weight was used. The waste/used oil was considered being originated from soybean having 45% C18:1 and 55% C18:2 as the FA compositions. Therefore, the average molecular weights of TAG, FFA, and FAEE species were calculated through weighing by corresponding FA percentages. In this study, the biocatalysis with non-specific lipase enzymes immobilized on hydrophobic supports involving concurrent transesterification, esterification, and hydrolysis reactions with 65.61% molar excess amount of absolute EtOH (99.9%) (30% (n) for 100% TAG feed) feed was considered. Since both hydrolysis and esterification (reverse side) reactions favors the formation of FFA at high percentages of water content which ultimately decreases target product (FAAE) yield, the oil feedstock was considered being almost dehydrated prior to reactions. Besides, 85.56% of the total amount of water (ca ppm) within the reactive system (oil + EtOH) was considered to be involved in the activation of immobilized biocatalysts, while the rest was consumed via hydrolysis reactions. The ultimate reaction conversions of 95% for TAG species and 85% for overall FFA content were assumed. The conversion lines representing initial, mid, and final conversion levels for each ternary system involved in reactions were illustrated on the LLE diagrams presented in Fig and 3-33; for TAG FFA EtOH system; in Fig. A3-10 to A3-12 (see Section F of Appendix 3-3) for TAG FFA EtOH H 2 O quaternary systems; in Fig 3-36 for TAG FFA glycerol system; in Fig for FAEE FFA glycerol system; in Fig for TAG EtOH H 2 O system; in Fig for FAEE H 2 O EtOH system; in Fig and 3-54 for FFA EtOH H 2 O ternary systems; in Fig for FAEE H 2 O glycerol, and finally in Fig and 3-57 for FFA H 2 O glycerol ternary systems. The corresponding initial and final points were demonstrated by symbols in green and in red, where appropriate. Since LLE predictions by means of COSMO-RS method with BP- TZVP parameterization overestimates the size of two-phase regions (underestimates the binodal curves), the conversion line depicted in Fig remains within two phase regions which means that reactions will permanently proceed within a biphasic media. However, as is seen in Fig. 3-32, the reaction media, for instance, at 303 K will remain as a single phase up to ca. 30% conversion of RSO feed. On the other hand, it was shown in Fig. A3-10 to A3-12 that in case of a reaction medium containing at least 2 to 3% of water (based on EtOH feed weight) the system will remain almost biphasic even at 323 K. Even though it was observed that reaction medium may become a single phase up to 30% of TAG conversion, the formation of glycerol dominantly prevents such an occurrence. As is seen in Fig 3-36 for TAG FFA glycerol system, the existence of a single-phase medium can only be observed in the very beginning of reaction course. Since, the conversion line remains in the two-phase region throughout of the reaction course. However, if we consider III-85
155 PHYSICAL (PHASE) EQUILIBRIA LLE and VLE the consumption of TAG and simultaneous formation of FAEE in which glycerol has slightly higher solubility as shown in Fig 3-38; reaction medium may remain homogenous up to 40% of FAEE formation. On the other hand, since the water content was considered significantly low, the ternary systems composed of TAG, FFA, and FAEE besides of water component will proceed within homogeneous media as is seen in Fig for TAG EtOH H 2 O system; in Fig for FAEE H 2 O EtOH system; and also in Fig and 3-54 for FFA EtOH H 2 O ternary systems (cf. Section below). However, reaction media can easily become biphasic with the increase in water concentration, such as in reactions involving rectified EtOH (95.63%). Analogous to FAEE FFA glycerol system shown in Fig 3-38, the ternary system of FAEE H 2 O glycerol depicted in in Fig may become a single-phase medium up to 40% of FAEE formation. Finally, if the interactions of FFA, glycerol and water species is considered it can be realized thanks to phase diagrams illustrated in Fig and 3-57 that LLE simulation with BP-TZVP parameterization at 323 K generates a reaction media which is homogeneous up to 20% of water and 10 % (molar) of glycerol formed. In overall, it was observed that phase behaviors of such complex multicomponent reaction media involving three concurrent reaction sets require simultaneous evaluation of ternary or multinary phase diagrams of reacting components. Since glycerol has relatively high affinity for FFA and FAEE than TAG species the use of dehydrated waste/used oil helps to the occurrence of single-phase reactive media up to some certain points where glycerol concentration reaches to the limit initiating the formation of second liquid phase. As a result, it is plausible to deduce at this point that the formation of glycerol with enough concentration always forces the reaction media to become phase separated. The phase-split phenomenon, as mentioned above, becomes more pronounced when water is also involved as a substrate having more than 2-3% of concentration based on initial oil feed weight. Indeed, it is crucially important to state that in case of glycerol, the formation of second liquid phase has an important advantage of shifting (reversible) transesterification reaction(s) towards products side; whereas a significant decrease in water concentration in fatty rich phase shifts hydrolysis reactions towards substrates side. Alternatively, such decrease in water concentration favors the formation of FAEE in case of esterification reaction. Therefore, even if a homogeneous reaction medium can help to surmount the external mass transfer problems; high concentration of glycerol and/or water in fatty phase can also promote the reverse reactions and, thus, can decrease the final product yield. Nevertheless, such single phase formations (regions) can be effectively used for the optimization of immobilized enzyme amounts in order to make reactions faster. Some more discussions will be given in Section 6.1 and 6.2 for multicomponent LLE simulations. III-86
156 PHYSICAL (PHASE) EQUILIBRIA LLE and VLE 4.6. Conclusions In this section the predictive LLE simulations of binary to multinary systems were performed by means of mainly COSMO-RS method with different parameter sets and also via UNIFAC method. Besides, all LLE simulations via COSMO-RS method were performed using conformers of species, where available. At first, the solubilities of MeOH and EtOH species in triolein were simulated by means of four parameter sets (see Part 4 of Appendix 3-3). The most quantitatively closest value predicted for EtOH at 303 K was ca. 7.22% with DMOL3-PBE parameterization; while the BP- TZVP and BP-TZVPD-FINE parameterizations predicted the lowest but equal values (ca. 3.42%). The same parameterization set analogously predicted the most quantitatively closest solubility value in case of MeOH as ca. 1.80% at 303 K and ca. 2.10% at 313 K. On the other hand, the worst solubility value for MeOH was predicted by means of BP-TZVPD-FINE parameterization was ca. 0.80% and 1.05% at 303 and 313 K, respectively. Hence, it was concluded that none of the parameterization files could efficiently simulate the solubility of MeOH and EtOH in triolein species. However, they can be effectively used for the representations of species phase distributions. Subsequently, the solubilities of glycerol in single FAME and FAEE species were simulated by means of BP-TZVPD-FINE parameter set. It was evidenced that glycerol has the highest solubility within the smallest FAME member (MeMy) studied followed by the most unsaturated one (MeLn); whereas its lowest solubility was calculated for long-chained saturated MeSt and mono-unsaturated MeOl species. On the other hand, glycerol solubility in FAEE species was calculated for EtLi as the highest and for EtOl as the lowest. It was remarkably observed that glycerol in EtPa, as being the shortest saturated FAEE member evaluated, shows higher solubility than in EtOl. It was evidenced that COSMO-RS method can appropriately estimate, even better than UNIFAC-LLE, the initial EtOH solubility of oils in case of LLE simulations for TAG FAEE EtOH ternary systems. Moreover, there observed considerable initial solubility difference between triolein (1.92%) and trilinolein (3.17%) in EtOH predicted at 303 K, as an example. In the ternary LLE simulations at 303 and 318 K assessing the novel BP-TZVPD-FINE parameterization file a significant left-side shift in binodal curve part representing EtOH rich phase was observed for oleic case. Thus, it was concluded that H-bonding should have significant influence on the mutual solubilities of species. Besides, it was demonstrated that the solubility of polar components in non-polar species (solvent) still remain a problem and got even slightly worse with the new BP-TZVPD-FINE parameterization. Therefore, it is plausible to state that COSMO-RS method with BP-TZVP and BP-TZVPD-FINE parameterizations can be used only for species phase distributions in such ternary systems. In overall, LLE simulations via COSMO-RS method using both of the parameterization files underestimate the solubility III-87
157 PHYSICAL (PHASE) EQUILIBRIA LLE and VLE and mutual solubilities of ternary systems with simple TAG species, particularly in oil rich phases. On the other hand, the simulations of ternary (quaternary) systems containing rectified EtOH revealed that there is a significant decrease in mutual solubilities with aq. EtOH. Besides, some relatively more complex (multicomponent) LLE simulations were also performed where both oil (SBO) and its FAEE derivative (species) were modeled according to the measured FA composition of oil. Consequently, two multicomponent LLE simulations encompassing 5 TAG species, 5 FAEE species and EtOH in case of dry (absolute) EtOH and 1 more component (H 2 O) in aqueous EtOH case were performed. In these multicomponent simulations a better representation of LLE phase behavior was obtained when it is compared with experimental results, particularly for the addition (formation) of higher amounts of FAEE. Nonetheless, in case of aq. EtOH there was a significant increase in EtOH concentration distributed in SBO rich phase for 20 K of temperature increase. The LLE phase behaviors of TAG EtOH glycerol or FAEE EtOH glycerol ternary systems simulated at 303 and 318 K with BP-TZVP parameterization file for oleic and linoleic cases and using BP-TZVPD-FINE parameter set for oleic case alone have revealed that glycerol is practically immiscible either with simple TAG species representing neat vegetable oils or with FAEE derivatives. Therefore, the statement of practically immiscible for glycerol species is valid even below 30% of reaction completion in the absence of excessive EtOH concentration. In addition, the impacts of 4 different parameter sets on the LLE of EtOl EtOH glycerol ternary system were predicted at 293 and 308 K. It was perceived that the smallest two-phase region in size was predicted using DMOL3-PBE and BP-SVP-AM1 parameterization sets; while the largest was with BP-TZVPD-FINE, as expected. The binary LLE simulations of ethyl ester and glycerol species had revealed that the solubility order of FAEE species in glycerol for a T range of K using BP-TZVPD-FINE parameterization was as follows: EtLi > EtLn > EtPa > EtSt > EtOl. In contrast, the LLE diagrams of ternary systems containing each of these species that were predicted at 293 and 308 K with BP-TZVP parameter file resulted with a significantly different pattern. In this case, however, the solubility order in FAEE rich phases was found as follows: EtLn > EtLi > EtPa > EtOl > EtSt. Such a difference should be considered mostly because of the impact of third component (EtOH) addition. It was evidenced that EtLn as the most unsaturated member has the highest affinity for glycerol rich phase followed by EtLi species; whereas the lowest affinity was exerted by the long-chained saturated FAEE (EtSt). In this regard, it can be deduced that the removal of glycerol rich phase with the progress of reaction might help to increase the cetane number and oxidative resistance of the biodiesel. Moreover, it might help to shift the reversible reactions towards product(s) side. In the binary LLE simulation of glycerol FFA and water FFA systems, it was observed that there is an inverse relation between the saturated FFA carbon number and miscibility with III-88
158 PHYSICAL (PHASE) EQUILIBRIA LLE and VLE water and glycerol; while a linear solubility relation with the numbers of double bond in unsaturated FFA. The highest solubilities of glycerol and water in FFA were obtained with DMOL3-PBE parameterization, but the lowest ones were with BP-TZVPD-FINE in case of glycerol and BP-TZVP in water case. It was predicted that glycerol has very high affinity for FFA than water has. In contrast to COSMO-RS method, the solubilities of glycerol in oleic, linoleic, and linolenic acids predicted via UNIFAC model variants at 308 K revealed significantly lower values. Accordingly, if the predictions by COSMO-RS method are accepted as reliable, reactive systems comprising waste/used oils as the substrate may form homogenous mixtures during the initial parts of reaction courses which may or may not prevent higher product yields depending on the mixture compositions and reaction conditions. In addition, it was evidenced that none of UNIFAC model variant employed could appropriately simulate the measured mutual solubility impacts of FFA (OlAc) in TAG FFA EtOH ternary systems. However, according to both LLE simulations and measurements, the use of waste/used oils containing substantial percentage of FFA content as the feedstocks may improve the homogeneity of reaction media even at rather excess amounts of EtOH feeds. The LLE phase behaviors of similar systems were also simulated by means of COSMO-RS method through five parameter sets for three case studies. Based on these simulations, it was observed that there is no substantial difference between OlAc and LiAc on changing mutual solubilities of their corresponding TAG forms and EtOH, especially at lower FFA concentrations. It was found that OlAc added prefer predominantly the EtOH rich phase. However, its K- value approach exponentially to unity which indicates that high FFA content in oil may help to the formation of single-phase reaction medium. Nevertheless, according to these simulations the global composition lines ( conversion lines ) remain almost in the two-phase regions. An examination of experimental ternary LLE phase diagrams of water containing Veg. Oil FFA EtOH H 2 O quaternary systems revealed that water has an antagonistic impact on the LLE of the reactive systems. Consequently, the use of waste/used oils having considerable amount of water beside of FFA may prevent the formation of homogeneous reaction media. Moreover, a comparison of predictive methods with measured binodal curves revealed that neither COSMO-RS method nor UNIFAC model variants can quantitatively represent the measured ones. Nonetheless, UNIFAC-LLE variant with SFO-HO-2 combination and COSMO-RS method with BP-TZVP parameterization resulted with the most appropriate binodal curves for the conversion line (global composition) of oleic case. It was considered through the LLE simulations of TAG FFA glycerol ternary systems that glycerol becomes more soluble with the increase in FFA concentration where there is no considerable difference between oleic and linoleic TAG species. Since they are practically insoluble in glycerol, FFA addition does not affect the solubility of oils (TAG) in glycerol rich phase. The highest glycerol solubility in oil rich phase with the help of FFA addition was ob- III-89
159 PHYSICAL (PHASE) EQUILIBRIA LLE and VLE tained using DMOL3-PBE parameter set. In overall, an increase of 15 K in temperature did not affect the simulated mutual solubilities of species in both phases. On the other hand, it was evidenced that the formation of FAEE parallel to the decrease in oil (TAG) concentration that comprises excessive amount of FFA as the feedstocks together with constancy or increase in FFA concentrations (depending on oil and alcohol feeds compositions) improves the possibility of single-phase reaction media formation by dissolving larger amounts of glycerol in fatty phases. However, it was ultimately verified that glycerol species has a significant tendency to split from fatty phases, even with oils containing very high amounts of FFA so as to create a second liquid phase for the given T range. Since glycerol passing ca. 1.0% of concentration is not miscible with fatty medium (FAEE + TAG) for a T range of K, the system eventually turns into a biphasic media with the increase in glycerol concentration. The FFA content of oil source can, however, increase the amount of dissolved glycerol in fatty medium up to 2 5% depending on the composition of reaction media (mainly of FFA) and temperature. Even though it was observed that reaction medium has the tendency to become single phase up to 30% of TAG conversion, the formation of glycerol dominantly prevents such an occurrence. However, if the consumption of TAG and simultaneous formation of FAEE in which glycerol has slightly higher solubility were considered; reaction medium may remain homogenous up to 40% of FAEE formation. Nevertheless, the reaction media can easily become biphasic even at 323 K with the increase in water concentration, such as in reactions involving rectified EtOH (95.63%). In overall, it was observed that phase behaviors of such complex multicomponent reaction media involving three concurrent reaction sets require simultaneous evaluation of ternary or multinary phase diagrams of reacting components. Since glycerol has relatively high affinity for FFA and FAEE species than for TAG, the use of dehydrated waste/used oil helps to the occurrence of single-phase reactive media up to some certain compositions where glycerol concentration reaches to the limit initiating the formation of second liquid phase. To put it briefly, even if a homogeneous reaction medium can help to surmount probable external mass transfer problems; high concentration of glycerol and/or water in fatty phase can also promote the reverse reactions and, thus, can decrease the final product yield. Nevertheless, such single phase formations (regions) can be effectively used for the optimization of immobilized enzyme amounts in order to make reactions faster. III-90
160 PHYSICAL (PHASE) EQUILIBRIA LLE and VLE 5. Liquid-Liquid Equilibria in Reactive Systems Containing Water as a Substrate Water is an active substrate in hydrolysis and esterification reactions. Both kinds of reaction are natural reactions catalyzed by biocatalysts (lipase enzymes) even in living organisms. Water is also considered as an impurity/constituent in waste/used oils; in rectified EtOH, and more importantly in biodiesel product supplied to the market. Therefore, water solubility in organic or fatty media needs to be examined in depth. By the way, it is also important to underline that in the presence of phase separation (two-phase formations) all type of reactions involved in enzymatic biodiesel production (transesterification, hydrolysis, and esterification) proceed within the fatty phase when immobilized enzymes, particularly on hydrophobic sarriers, are utilized. Because the amounts of fatty (hydrophobic) substrate feeds are generally higher than that of the acyl acceptors (alcohols and water) in such kinds of reactions. Even though biodiesel is practically insoluble in water, it actually takes up considerably more water than diesel fuel. 44 Water in biodiesel can be present in two forms, either as dissolved water or as suspended water droplets. Such suspended droplets are called as reverse micelles, or microemulsions which are defined as nanometer-sized water droplets dispersed in organic ( fatty ) media which may be involved in the activation of enzymes. 111,112 There is a considerable lack of experimental data on equilibrium moisture content in biodiesel fuels, particularly in FAEE 113. However, to name a few reported on FAME, Knothe and coworkers reported that biodiesel can contain as much as 1500 ppm of dissolved water. 44 Besides, in another study He et al. have reported that biodiesel (FAME) can absorb 1000 to 1700 ppm (0.10 to 0.17 wt. %) moisture at temperatures of 277 K to 308 K, respectively. 114 Oliveira et al. have also reported moisture absorption in a series of single FAME species and commercial biodiesel samples. 115,116 In this section, the first sub-section will deal with some comparisons of reported data with predictive ones, predominantly for FAME species. The assessments of experimental and predictive solubility determination in FAME and FAEE species will be the second part. The next part will be about the evaluations of LLE phase behaviors of water containing ternary reactive systems, both using reported studies and COSMO-RS based simulations. A preliminary simulation study on the solubility of water in fatty acid alkyl esters (FAAE) by means of quantum chemical COSMO-RS method has been mentioned in Part 6 of Appendix Assessments of Water Solubility in FAME species Experimental vs. COSMO-RS Simulations In order to assess the accuracy (prediction quality) of equilibrium moisture content predicted via COSMO-RS method, water solubility data in six commercial biodiesel (FAME) samples reported by Oliveira and coworkers have been simulated. 115 Biodiesel samples were modeled using single FAME species weighted by their FA compositions reported by the re- III-91
161 PHYSICAL (PHASE) EQUILIBRIA LLE and VLE searchers. The simulation results accompanied by experimental data points were illustrated in Fig An analysis of reported data for six biodiesel samples evidenced that the polyunsaturated (C18:2) FA composition has significant impact on water solubility. Although the order of equilibrium moisture content of samples have been predicted almost accurately, neither BP-TZVP nor BP-TZVP + HB2010 parameterization can quantitatively represent experimental measurements where the former one overestimates the solubility in contrast to the latter one. Therefore, it is likely to deduce that the real solubility requires a modified form of parameterization set. Same researchers have also reported water solubility in five single FAME species including only MeOl as the unsaturated species. A comparison of predictions performed using three parameter sets in COSMO-RS method with experimental data results was illustrated in Fig Analogous to the predictions obtained for six biodiesel samples none of these parameter sets can quantitatively simulate water solubility. On the other hand, solubility simulations by means of three UNIFAC model variants were accomplished as an alternative predictive approach where two different combinations of assigned functional groups to MeOl species were used (cf. Section 2.2.1). The predicted moisture contents in MeOl were illustrated in Fig accompanied by reported experimental data points and some selected simulations by COSMO-RS parameterization sets. The most appropriate results, as is seen, were obtained using modified UNIFAC (Do.) variant with MeOl-2 combination. However, the predictions by means of neither UNIFAC-VLE nor LLE have resulted with proper representations. Beside of the three old parameter sets, the new BP-TZVPD-FINE could not also appropriately predict water absorption in MeOl species. Figure 3-41 Prediction of water solubility in 6 commercial biodiesel (FAME) samples by means of COSMO-RS method (COSMOtherm v.c2.1_01.11) with BP-TZVP and BP-TZVP+HB2010 parameterizations. The experimental data points have been reported by Oliveira et al., Biodiesel samples were modeled according to their composition reported by Oliveira et al., III-92
162 PHYSICAL (PHASE) EQUILIBRIA LLE and VLE Figure 3-42 Solubility prediction of water in single FAME species using COSMO-RS method (COSMOtherm C2.1_01.11) with BP-TZVP, BP-TZVP+HB2010, and BP-TZVP-ISOCAV parameterizations. Experimental data points for FAME species solubility were reported by Oliveira et al., Figure 3-43 Water solubility in MeOl species Comparisons of experimental measurements with predictions performed by UNIFAC model variants and COSMO-RS method (COSMOtherm v.c2.1_01.11a with four parameterizations and v.c3.0_12.01 with TZVPD-FINE parameterization). Functional groups assigned to MeOl-1 and MeOl-2 are analogous to EtOl-1 and EtOl-2 species given in Table 3-3, respectively. Alternatively, the binary LLE (solubility) simulations by means of the updated BP-TZVP parameter set contrary to BP-TZVPD-FINE parameterization have resulted with more appropriate predictions of equilibrium moisture content in the same species. A recent study reported by Oliveira and coworkers on water absorption by MeLi was also illustrated in Fig in addition to the other five species. A closer look at this new simulation reveals that the new parameter set can relevantly predict the solubility of water in MeOl and MePa species, but it just gives a relatively better approach for solubility in short-chained FAME species. In addition, the predictions pertaining to MeSt and MeLi can, however, be considered as acceptable in the T range ( K) that is suitable for enzymatic reactions. III-93
163 PHYSICAL (PHASE) EQUILIBRIA LLE and VLE Figure 3-44 A comparison of equilibrium moisture content in single FAME species. Experimental data for MeLi was reported by Oliveira et al., and the rest were taken from Oliveira et al., Predictions by means of COSMO-RS method were performed using BP-TZVP parameter set (COSMOtherm v.c3.0_12.01) Moisture Absorption by Biodiesel (FAAE) Species Experimental Measurements vs. COSMO-RS Method; UNIFAC Model Variants; and SAFT-HR and ESD Equations of State The moisture absorption capabilities of three species (EtOl species (>91%), rapeseed oil biodiesel (FAME) and soybean oil biodiesel (FAEE)) measured in our laboratory will be evaluated in this sub-section. All the measurements were performed using Karl Fischer titration outlined in Chapter 2. In addition, a detailed evaluation of simulations via predictive methods -UNIFAC model variants, COSMO-RS Method, and two equations of state based on statistical associating fluid theory (SAFT-HR and ESD)-, will be given. Some explanations related to SAFT-HR and ESD equations of state were mentioned in Part 7 of Appendix Absorption of Moisture by FAAE Species/Blends The experimental water solubility data in biodiesel (FAAE) species accompanied by 95% CI were presented in Table 3-9. The highest moisture content, for instance at 313 K, was observed with FAME as a commercial biodiesel product obtained from rapeseed oil (Emmelev A/S Odense/DK.). FAEE from soybean oil was obtained through enzymatic transesterification using Novozym 435 biocatalyst (immobilized lipase) where FAEE content determined by GC-FID was measured higher than 98.7%. Analogous to the ternary LLE studies all the fatty products were double-purified by passing through activated basic alumina column in order to remove polar impurities and pigments/colorants. The equilibrium moisture content of EtOl and its predictive simulations were illustrated in Fig Water content absorbed by EtOl has also been reported by Follegatti-Romero and coworkers 113 as the initial point of LLE for a ternary system (see Fig. 3-58) at 298 K. Likewise, they have also reported water solubility in a series of ethyl ester species. However, their results have substantial differences for a T increase of 10 K. For instance, they have reported 1440 ppm of moisture in EtPa at 298 K; whereas the moisture content at 308 K for the same III-94
164 PHYSICAL (PHASE) EQUILIBRIA LLE and VLE ethyl ester was 5000 ppm. This unrealistic and excessive difference should probably stem from uncontrollable or analytical errors. On the other hand, EtOl species moisture content at 298 K was reported by the same researchers as 7200 ppm (0.72 wt. %) which was measured in this study as ±12.08 ppm. Table 3-9 Experimental measurements of moisture content in FAME (of rapeseed oil), FAEE (of soybean oil), and EtOl species accompanied by 95% CI. (Abbreviations: ppm - parts per million ( 1 mg 1 kg Acid Methyl Ester; FAEE Fatty Acid Ethyl Ester; EtOl Ethyl Oleate) ); FAME Fatty Figure 3-45 Moisture absorption at different T values by EtOl species Comparison of experimental measurements with predictions performed by UNIFAC model variants; COSMO-RS method (COSMOtherm v.c2.1_01.11a with four parameterizations and v.c3.0_12.01 with TZVPD-FINE parameterization), and SAFT-HR and ESD equations of state. Functional groups assigned to EtOl-1 and EtOl-2 species are given in Table 3-3. The quantitatively closest predictions in case of UNIFAC model variants were obtained by means of modified UNIFAC (Do.) variant with EtOl-2 combination. Besides, the most appropriate prediction using QC COSMO-RS method was performed with BP-TZVP+HB2010 parameterization (see Fig caption for detailed information). Since moisture content determines the final product quality supplied to the market, it is more appropriate considering moisture contents at lower T values. Therefore, either COSMO-RS with BP-TZVP+HB2010 /BP-TZVP (updated version) or modified UNIFAC (Do.) models can be used equally well for predicting absorbed water content in EtOl (see also Fig below for comparison). In contrast, despite to all efforts neither ESD nor SAFT-HR EoS resulted with appropriate predictions of moisture content in EtOl species. III-95
165 PHYSICAL (PHASE) EQUILIBRIA LLE and VLE The equilibrated moisture content in rapeseed oil FAME and soybean oil FAEE were illustrated in Fig and Fig. 3-47, respectively, alongside the estimated results via UNIFAC activity coefficient model variants and COSMO-RS method. Analogous to the results obtained with the EtOl case, the most quantitatively appropriate solubility was estimated using modified UNIFAC (Do.) variant with FAME-2, but equally well results with FAEE-1 and FAEE-2 species. On the other hand, the most appropriate simulation of moisture content via COSMO- RS method was obtained with BP-SVP-AM1 parameterization which is recommended 94 as applicable to solubility predictions. Figure 3-46 Solubility of water in rapeseed oil FAME (biodiesel) Comparisons of experimental measurements with predictions performed by UNIFAC model variants and COSMO-RS method (COSMOtherm v.c2.1_01.11a with four parameterizations). Functional groups assigned to FAME-1 and FAME-2 species are analogous to FAEEs given in Table S-1 (see Appendix 3-3), respectively. (Rapeseed oil FAME composition was as follows: 10.90% C16:0; 0.30% C18:0; 56.20% C18:1, and 32.60% C18:2) In overall, the comparisons of updated and old forms of BP-TZVP parameterizations have revealed that the former has improved ability of predicting moisture content in FAAE species. However, the novel BP-TZVPD-FINE parameter set including an updated H-bonding term (HB2012) has resulted with considerably high moisture content predictions in such species (see also Fig. S-18 in Part 6 of Appendix 3-3). Some predictive and experimental data points of MeOl, MeLi and EtOl species were depicted in Fig for comparisons. As a consequence, the significant difference between the old and updated BP-TZVP parameter sets can be obviously seen. To sum up, it was observed that the best predictive approach for these three kinds of FAAE species is COSMO-RS method with updated BP-TZVP parameterization (see also Fig. 3-44). Besides, it is likely to deduce that the degree of unsaturation is strongly correlated with moisture absorption content of homologous FAAE species. Moreover, a comparison of COSMO-RS predictions with BP-TZVP parameterization for FAME and FAEE species was illustrated in Fig where it is possible verifying that FAEE species have slightly lower water absorption capabilities than FAME species have. This result is attributable to relatively higher non-polarity of FAEE species thanks to having one more CH 2 functional group. III-96
166 PHYSICAL (PHASE) EQUILIBRIA LLE and VLE Figure 5-47 Water solubility in soybean oil FAEE (biodiesel) Comparisons of experimental measurements with predictions performed by UNIFAC model variants and COSMO-RS method (COSMOtherm v.c2.1_01.11a with four parameterizations). Functional groups assigned to FAEE-1 and FAEE-2 are given in Table S-1 (see Appendix 3-3). (Multicomponent FAEE in COSMO-RS is simulated according to the composition given in Fig caption in Section 4.2) Figure 3-48 Comparison of measured water solubility in MeOl 115, EtOl, and MeLi 116 species with simulated solubilities by means of COSMO-RS method with three parameter sets (BP-TZVP and BP-SVP-AM1 with COS- MOtherm v.c3.0_12.01 and BP-TZVP with COSMOtherm v.c2.1_01.11). Figure 3-49 Simulated equilibrium moisture content in FAME and FAEE species by means of COSMO-RS method with BP-TZVP parameterization (COSMOtherm v.c3.0_12.01). III-97
167 PHYSICAL (PHASE) EQUILIBRIA LLE and VLE As a practical approach it is convenient to state that the removal of formed glycerol (rich) phase which has high affinity for water and unsaturated FAEE (see also Fig in Section 4.3.2) may decrease the risk of oxidation attributable to poly-unsaturated species and water. Besides it can help shifting transesterification and esterification reactions towards products side, particularly in case of waste/used oil containing considerable amounts of FFA and water residue LLE Phase Behavior of Ternary Systems Containing Water as a Reactive Species Simulations via Quantum Chemical COSMO-RS Method Case 1: TAG EtOH H 2 O Ternary System According to the LLE phase behavior simulations performed by means of BP-TZVP parameterization, it was observed that water is almost immiscible with TAG species (triolein and trilinolein) at up to 318 K, as is seen in Fig The addition of EtOH can affect mutual solubility of water and TAG species only at significantly high concentrations. The global composition lines representing 95% conversion of TAG species through both hydrolysis and transesterification reactions almost remain within the narrow two phase regions. Figure 3-50 LLE phase diagrams of TAG EtOH H 2 O ternary systems predicted at K and K using COSMO-RS method (COSMOtherm v.c2.1_01.11a with BP-TZVP parameterization). Initial H 2 O composition was considered being 4.37 wt. % based on rectified EtOH (96%) feed reaching to a final composition of 4.15% in accordance with 95% conversion of TAG species where both hydrolysis and esterification reaction are considered Case 2: FAEE H 2 O EtOH Ternary System The LLE phase diagrams of FAEE H 2 O EtOH ternary systems, on the other hand, have relatively lower two-phase regions in size which mean that FAEE will be miscible with aqueous EtOH up to 35% at the T range of K. However, as it can be perceived from Fig and 3-52 the conversion lines (global composition lines; see figure captions for details) will almost remain on the binodal curve bounding the two-phase region. As a result, it is unlikely to state that FAEE (EtOl or EtLi) is immiscible with aq. EtOH which seems to be also unrealis- III-98
168 PHYSICAL (PHASE) EQUILIBRIA LLE and VLE tic. This point requires further experimental analyses (cf. Section 5.3.2). It is also noteworthy that BP-TZVP parameterization gives the smallest two-phase regions in size among three parameter sets studied. Figure 3-51 Simulation of LLE for EtLi H 2 O EtOH ternary system by means of COSMO-RS method (COS- MOtherm v.c2.1_01.11a with 4 parameterization sets). Initial H 2 O composition was considered being 4.37 wt. % based on aqueous EtOH (96%) feed reaching to a final composition (4.15 wt. % of EtOH feed) in accordance with 95% conversion of TAG species where esterification and hydrolysis reactions are not ignored. Global composition lines represent conversions. Figure 3-52 LLE simulation for FAEE H 2 O EtOH ternary systems using COSMO-RS method (COSMOtherm v.c2.1_01.11a with BP-TZVP parameterizations). See Fig caption for further details Case 3: FFA EtOH H 2 O Ternary System Three different parameter files of COSMO-RS method were applied in order to simulate LLE of FFA EtOH H 2 O ternary systems containing saturated and unsaturated FFA components. Since saturated FFAs are in solid state at 293 K, only the simulations at 323 K were reported for PaAc and StAc containing systems. The ternary LLE phase diagrams were illustrated for saturated and unsaturated cases in Fig and 3-54, respectively. It was observed in these III-99

169 PHYSICAL (PHASE) EQUILIBRIA LLE and VLE simulations that neither saturated nor unsaturated FFAs are miscible with water at the T values studied, as expected. However, EtOH addition increases the solubility of water in FFA rich phase and, thus, can improve the homogeneity of reaction media in case of waste/used oil feedstocks. This situation has been presented in Section 4.5 (see Fig and subsequent ones) and in Fig. A3-10 to A3-12 (cf. Section F of Appendix 3-3) for oil and FFA containing ternary systems. Figure 3-53 LLE phase diagrams of FFA EtOH H 2 O ternary system simulated at K via COSMO-RS method with three parameter sets (COSMOtherm v.c3.0_12.01) Saturated free fatty acids (PaAc and StAc). Phase compositions are given in mole percentage. It was observed that, the BP-TZVPD-FINE parameterization does not give the largest twophase regions contrary to the expected, instead BP-TZVP does. It seems that in these predictions H-bonding among the species play a synergistic impact on the mutual solubilities. Figure 3-54 Simulated LLE phase diagrams of FFA EtOH H 2 O at and K by means of COSMO-RS method with three parameter sets (COSMOtherm v.c3.0_12.01) Unsaturated free fatty acids (OlAc and Li- Ac). Phase compositions are given in mole percentage. III-100
170 PHYSICAL (PHASE) EQUILIBRIA LLE and VLE Case 4: FAEE H 2 O Glycerol Ternary System In case of FAEE H 2 O glycerol ternary system, it was evidenced that the system is practically immiscible and water addition does not, of course, affect the solubility of glycerol in FAEE rich phase. Therefore, as it will be discussed below, water washing in the refining operations (down-streaming section) of enzymatic biodiesel (FAEE) production process can easily remove glycerol impurities (dissolved glycerol) from biodiesel (FAEE rich phase). Figure 3-55 LLE phase diagrams for FAEE H 2 O Glycerol ternary systems using COSMO-RS method (COS- MOtherm v.c2.1_01.11a with BP-TZVP parameterization). Initial H 2 O composition was considered being 4.37 wt. % based on aqueous EtOH (96%) feed reaching to a final composition (4.15 wt. % of EtOH feed) in accordance with 95% conversion of TAG species where esterification reaction is not ignored. Phase compositions are given in weight percentage. It is noteworthy that even though 15 K of temperature increase did not affect the mutual solubilities. In addition, it is well-known that such an increase in temperature considerably increases the moisture content absorbed in FAAE phase (see Section 5.3.1). Therefore, it is better using cold water during washing operations of biocatlytic processes, instead of hotwater as recommended for conventional processes Case 5: FFA H 2 O Glycerol Ternary System It was shown in Section 4.4 by means of COSMO-RS method that glycerol has significant solubility in FFA, particularly in short-chained and poly-unsaturated ones, than water species has (see Fig. 3-31). In this sub-section (case), however, the influence of water content on the mutual solubilities of glycerol and FFA -as in case of waste/used oil feedstocks use- will be simulated through predictive LLE simulations. All of the phase compositions were given in mole percentages (x %) in order to clearly exhibit binodal curve patterns and their changes with different parameterization files and also with temperature. Simulation results for LLE phase behavior of ternary systems containing saturated and unsaturated FFA species were illustrated in Fig and 3-57, respectively. It was observed III-101

171 PHYSICAL (PHASE) EQUILIBRIA LLE and VLE that an increase in water concentration considerably decreases the solubility of glycerol in FFA rich phase. As expected, DMOL3-PBE gave the smallest sized two-phase regions in all trials. Figure 3-56 The LLE phase diagrams of FFA H 2 O Glycerol simulated at K by means of COSMO-RS method with three parameter sets (COSMOtherm v.c3.0_12.01) Saturated free fatty acids (PaAc and StAc). Phase compositions are given in mole percentages. It was also clarified that BP-TZVP-FINE and the other two parameterization sets shows different curve patterns in FFA rich phase where the former gives concave curve patterns. Such a pattern means that the increase in water concentration with BP-TZVP-FINE simulation decreases the solubility of glycerol faster than the other two parameterization sets do. Because, the simulations with water have presented relatively lower solubility in FFA while using this parameterization set. Figure 3-57 Simulated LLE phase diagrams of FFA H 2 O Glycerol at and K using COSMO-RS method with three parameter sets (COSMOtherm v.c3.0_12.01) Unsaturated free fatty acids (OlAc and LiAc). Phase compositions are given in mole percentages. Likewise, the LLE of FFA EtOH glycerol ternary systems partaking saturated (at 323 K) and unsaturated FFA were simulated at 293 and 323 K using COSMO-RS method with three parameter sets. The related phase diagrams were illustrated in Fig. A3-13 (see Section H of Ap- III-102
172 PHYSICAL (PHASE) EQUILIBRIA LLE and VLE pendix 3-3). As is seen, the increase in EtOH concentration increases the mutual solubility of FFA and glycerol, particularly in fatty acid rich phase. Therefore, the concentration of EtOH feed can obviously help to the homogeneity in reaction media containing waste/used oil feedstocks. Besides, the conversion line representing the realistic simulation mentioned in Section is far from the two-phase regions Comparison of Reported LLE Diagrams for FAEE H 2 O EtOH Ternary Systems with Simulations by means of COSMO-RS Method Recently, Follegatti-Romero and coworkers 113,117 have reported LLE studies on FAEE H 2 O EtOH ternary systems for a series of ethyl ester species. They have used GC-FID with programmable pneumatics for the quantification of the ethyl esters and EtOH where water content of both phases was determined by Karl Fischer titration. As mentioned briefly in Case 2 (see Section ) that the solubility of FAEE in aq. EtOH (water + EtOH mixtures) needs to be further assessed with the aim of determining phase distribution of EtOH between water rich and FAEE rich phases. It was evidenced, as illustrated in Fig. 3-58, that for unsaturated FAEE species, EtOl and EtLi, at 298 and 313 K, respectively and in Fig for saturated EtPa species measured at 298 and 308 K that the increase in EtOH concentration does not significantly affect the mutual solubilities of FAEE and water species. However, according to the measured data at 313 K by Follegatti-Romero and coworkers, it was detected that EtLi absorbs significantly high moisture even higher than EtPa measured at 308 K (see RHS experimental binodal curve in Fig. 3-59).This occurrence seems to be contradictory with the moisture absorption results reported by Oliveira et al. for analogous FAME species (MePa and MeLi) as shown in Fig (cf. Section 5.1), though there was 5 K of temperature difference among the two LLE measurements with FAEE species. This unrealistic impact can be obviously seen in Fig (LHS figure) which illustrates the change of water distribution ratio with its concentration increase in water rich phase The same ternary systems were also simulated by means of COSMO-RS method with five parameterization sets and the LLE phase diagrams were illustrated in the same corresponding figures (Fig and 3-59). It was observed that the best quantitative predictions can be obtained using BP-TZVP parameterization, while BP-SVP-AM1 parameter set also gives significant results, particularly for the solubilities of water in FAEE rich phases when compared with experimental results. In addition, the distributions of water between two phases were appropriately estimated by means of BP-TZVP parameterization in case of EtOl representing the FAEE component; whereas it was DMOL3-PBE the best in case of EtLi. These results were illustrated in Fig for EtOl and EtLi cases. Meanwhile, it is again of concern to emphasize that experimental results reported by Follegatti-Romero and coworkers 113 seem to be unrealistic which is attributable to analytical measurement errors. III-103
173 PHYSICAL (PHASE) EQUILIBRIA LLE and VLE Figure 3-58 LLE phase diagrams of FAEE H 2 O EtOH ternary systems Comparisons of experimental LLE data reported by Follegatti-Romero et al., at K for EtOl and K for EtLi species with COSMO-RS method predictions (COSMOtherm v.c3.0_12.01 with 4 parameterization sets and BP- TZVP-ISOCAV (from COSMOtherm v.c2.1_01.11)). III-104
174 PHYSICAL (PHASE) EQUILIBRIA LLE and VLE Figure 3-59 LLE phase diagrams of EtPa H 2 O EtOH ternary systems Comparisons of experimental LLE data reported by Follegatti-Romero et al., at K for EtOl and at K for EtLi species with predictions by COSMO-RS method (COSMOtherm v.c3.0_12.01 with 4 parameterization sets and BP-TZVP-ISOCAV (from v.c2.1_01.11)). III-105
175 PHYSICAL (PHASE) EQUILIBRIA LLE and VLE Figure 3-60 The change of phase distribution ratios of water with its concentration in water rich phase for LHS: EtOl EtOH H 2 O ternary system at K; RHS: for EtLi EtOH H 2 O ternary system at K Comparison of experimental LLE data reported by Follegatti-Romero et al., with COSMO-RS method (COSMOtherm v.c3.0_12.01 three parameterization sets). The changes in phase distribution ratio of water with respect to its concentration increase in water rich phases were illustrated in Fig for both experimental and predictive results with EtPa species at 298 and 308 K. In Follegatti-Romero and coworkers measurements, there observed insignificant decrease in K-value for 10 K of difference which introduces that either water at 298 K or at 308 K can be used equally well for the simultaneous removal of EtOH impurities (or excess) and dissolved glycerol (see Case 4 and Fig in Section ) from biodiesel (FAEE) by washing instead of using vacuum evaporation or falling film evaporation columns for EtOH removal, as recommended. 107 However, the selection of optimal unit operations require further evaluation of process economics where EtOH recovery may become more feasible. Figure 3-61 K-value (phase distribution ratio) of water changing with its concentration in water rich phase for EtPa EtOH H 2 O ternary system at K and K Comparison of experimental LLE data from Follegatti- Romero et al., with COSMO-RS method (COSMOtherm v.c3.0_12.01 with three parameter sets). III-106
176 PHYSICAL (PHASE) EQUILIBRIA LLE and VLE On the other hand, the use of hot-water in washing process seems impractical because of the absorption of substantial amount of moisture within FAEE rich phase as shown in Fig. A3-14 for EtPa containing ternary system measured at 333 K (see Section H of Appendix 3-3). Moreover, it was shown in Fig. A3-15 that there is a considerable increase in the K-value of water when compared with Fig It was revealed that none of the simulations via three parameterization sets could quantitatively represent phase distribution of water at 333 K where BP-TZVP was again the best amongst them. In conclusion, it was evidenced through the LLE diagrams of FAEE EtOH H 2 O ternary systems involved in biodiesel (FAEE) production and refining processes that COSMO-RS method with BP-TZVP parameterization can effectively be used for the simulation of LLE phase behavior and phase distribution of H 2 O between two liquid phases. The LLE phase diagrams of ternary systems measured by Follegatti-Romero et al. 113,117 containing 5 ethyl ester species were illustrated in Fig. A3-16 for an inclusive comparison of their phase behaviors Conclusions In this section, the solubility of water in fatty acid alkyl esters (FAAE) was simulated by means of quantum chemical COSMO-RS method and group contribution based UNIFAC model variants. Subsequently the assessments of experimental and predictive solubility determinations in FAME and FAEE species were performed. The final part of study was on the evaluations of LLE phase behaviors of water containing ternary reactive systems, both using reported studies and COSMO-RS based simulations. The equilibrium moisture content (saturation solubility of water) in FAEE blend was predicted as the preliminary study by means of COSMO-RS method employing 4 parameterization sets for a T range of K (see Part 6 of Appendix 3-3). There observed almost linear relations between water solubility and temperature where the lowest solubility was predicted using BP- TZVP parameterization set accompanied by a hydrogen bonding term (HB2010). It was observed that moisture content in both single unsaturated FAME and FAEE species follow the same increasing order as in the binary LLE simulations of water-ffa. A comparison of predictions performed using old versions of three parameter sets in COSMO- RS method (COSMOtherm v.c2.1_01.11a) with experimental results evidenced that analogous to the predictions obtained for six biodiesel samples none of these parameter sets can appropriately simulate water solubility in single FAME species (see Fig and 3-42). As an alternative predictive approach, on the other hand, the solubility simulations by means of three UNI- FAC model variants were also accomplished and the most appropriate results were obtained using modified UNIFAC (Do.) variant with 2 nd (MeOl-2) combination. However, the predictions by means of neither UNIFAC-VLE nor UNIFAC-LLE have resulted with proper representations. In addition to the old versions of three parameter sets, the novel BP-TZVPD-FINE could not also appropriately predict water absorption in MeOl species. On the other hand, solubility simula- III-107
177 PHYSICAL (PHASE) EQUILIBRIA LLE and VLE tions by means of the updated BP-TZVP parameter set -contrary to BP-TZVPD-FINE parameterization- have resulted with more appropriate predictions of equilibrium moisture content in the same species. Moreover, the predictions pertaining to MeSt and MeLi can be, however, considered as acceptable in the T range ( K) that is useful for enzymatic reactions. On the other hand, the moisture absorption capabilities of three species (EtOl (>91%); rapeseed oil biodiesel (FAME), and soybean oil biodiesel (FAEE) species) measured in our laboratory were evaluated. The highest moisture content, say at 313 K, was obtained with the commercial biodiesel (FAME) product obtained from RSO. In this regard, the equilibrium moisture content of EtOl, say at 298 K, was measured as ±12.08 ppm. The quantitatively closest predictions in case of UNIFAC model variants were obtained by means of modified UNIFAC (Do.) variant with EtOl-2 combination. Besides, the most appropriate prediction via QC COSMO-RS method was performed with BP-TZVP+HB2010 parameterization. Since moisture content determines the final product quality supplied to the market, it is more appropriate considering moisture contents at lower T values. Therefore, either COSMO-RS with BP-TZVP+HB2010 /BP-TZVP (updated version) or modified UNIFAC (Do.) models can be used equally well for predicting absorbed water content in EtOl. In contrast, despite to all efforts neither ESD nor SAFT-HR EoS resulted with appropriate predictions of moisture content in EtOl species. Analogous to the results obtained with the EtOl case, the most quantitatively appropriate solubility was estimated using modified UNIFAC (Do.) variant with FAME-2, but equally well results with FAEE-1 and FAEE-2 species. Furthermore, the simulations of moisture content in FAEE species via COSMO-RS method employing BP-SVP-AM1 parameterization set that is recommended for solubility prediction was the most appropriate. In overall, the comparisons of updated and old versions of BP-TZVP parameterization sets have revealed that the former has improved ability of predicting moisture content in FAAE species. However, the novel BP-TZVPD-FINE parameter set including an updated H-bonding term (HB2012) has resulted with considerably high moisture content predictions. Accordingly, it is plausible to deduce that the degree of unsaturation is strongly correlated with moisture absorption content of homologous FAAE species. Lastly, it was observed that the best predictive approach for these three kinds of FAAE species was COSMO-RS method with updated BP-TZVP parameterization. It was also evidenced that FAEE species have slightly lower water absorption capabilities than FAME species. Three different parameter sets of COSMO-RS method were applied in order to simulate LLE phase behavior of FFA EtOH H 2 O ternary systems containing saturated and unsaturated FFA components. It was observed in these simulations that neither saturated nor unsaturated FFAs are miscible with water at the T values studied. However, EtOH addition increases the solubility of water in FFA rich phase and thus can improve the homogeneity of reaction media in case of waste/used oil substrates. The influence of water content on the mutual solubilities of glycerol III-108
178 PHYSICAL (PHASE) EQUILIBRIA LLE and VLE and FFA -as in case of waste/used oil feedstocks utilization- were simulated through predictive ternary LLE simulations. It was observed that an increase in water concentration considerably decreases the solubility of glycerol in FFA rich phase. Likewise, the LLE of FFA EtOH glycerol ternary systems partaking saturated (at 323 K) and unsaturated FFA were simulated at 293 and 323 K using COSMO-RS method with three parameter sets. It was revealed that the increase in EtOH concentration increases the mutual solubility of FFA and glycerol, particularly in FFA rich phase. Therefore, the initial feed concentration of EtOH can help to the homogeneity in reaction media containing waste/used oil feedstocks. The ternary LLE phase behavior simulations performed by means of BP-TZVP parameterization revealed that water is almost immiscible with TAG species (triolein and trilinolein) at up to 318 K. The case with FAEE H 2 O EtOH ternary systems, on the other hand, have relatively lower two-phase regions which means that FAEE will be miscible with the aqueous EtOH up to 35% at the T range of K. It was observed through comparison of experimental and predictive LLE phase diagrams of such ternary systems that the best quantitative predictions can be obtained using BP-TZVP parameterization, while BP-SVP-AM1 parameter set also gives significant results, particularly for the solubilities of water in FAEE rich phases when compared with experimental results. In addition, it was evidenced that the increase in EtOH concentration does not significantly affect the mutual solubilities of FAEE and water species. In conclusion, it was evidenced through the LLE phase diagrams of ternary systems involved in biodiesel (FAEE) production and refining processes that COSMO-RS method with BP-TZVP parameterization can effectively be used for the simulation of LLE phase behavior and phase distribution of H 2 O between two liquid phases. Moreover, in case of FAEE H 2 O glycerol ternary system, it was observed that the system is practically immiscible and water addition does not affect the solubility of glycerol in FAEE rich phase. Even though 15 K of temperature increase did not affect the mutual solubilities, it is well-known that such an increase in temperature considerably increases the moisture content absorbed in FAAE phase. III-109
179 PHYSICAL (PHASE) EQUILIBRIA LLE and VLE 6. Multicomponent (Multinary) Liquid-Liquid Phase Equilibria Simulations by means of COSMO-RS Method In this section LLE of multicomponent systems involved in enzymatic ethanolysis of neat and waste/used oil feedstocks will be evaluated. First, the LLE of quaternary systems will be assessed and the succeeding part will be on the assessments of multicomponent systems. It is technically possible presenting only three dimensional phase diagrams which hold up to 4 components each located on an edge of the regular tetrahedron (pyramid). Each edge of the pyramid represents the corresponding pure species. As a result, in case of LLE simulations with more than 4 components the compositions of similar species (which are miscible with each other) were combined in case of illustrating the LLE phase diagrams of multinary systems. Since it was inadequate converging to non-trivial phase compositions ensuring the constraints mentioned in Part 1 and Section B of Appendix 3-1), the simulations by means of activity coefficient models, such as UNIFAC, UNIQAUC and NRTL, were not presented. All the simulations were consequently performed at 303 and 318 K using QC COSMO-RS method with BP-TZVP parameter set LLE Phase Behavior of Quaternary Systems In this sub-section 6 quaternary LLE phase diagrams representing a single case study where a neat vegetable oil containing 0.25% (based on oil feed weight) of initial FFA which ultimately reaches to 1% (based on oil feed weight) through the use of 26.67% molar excess amount of aqueous EtOH (96%) as the acyl acceptor. The final water content of EtOH was accepted as 3.76% which was 4.00% in the beginning (both based on aq. EtOH feed). A reaction completion of 95% (conversion of TAG species) was assumed where all three reaction sets, transesterification, hydrolysis, and esterification reactions were considered. The conversion lines or global composition lines depicted in black, determine the vector coordinates of species compositions in the phases space Triolein EtOl EtOH Water System The phase diagrams of triolein EtOl EtOH water quaternary system simulated at 303 and 318 K were illustrated in Fig As is seen, both EtOH and water compositions in fatty rich phase increase with the reaction course succeeding the formation of significant amount of EtOl. Even though the solubility predictions by COSMO-RS for both aq. and dry EtOH species are not realistic, it provides adequate phase distributions of EtOH and water between the phases. In other words, LLE simulations by means of COSMO-RS method underestimate the solubility of both types of EtOH (see Fig. 3-9 in Section 2.3.2; Section 4.2 and also Fig. A3-10 to A3-12 in Section H of Appendix 3-3 for comparisons). The final moisture content absorbed in fatty phase at 303 K was predicted as ppm thanks to the dissolved excess amount of EtOH. It is essential to note that phase compositions III-110
180 PHYSICAL (PHASE) EQUILIBRIA LLE and VLE of the components were given in mole percentages with the intention of clearly exhibiting the patterns of binodal curves. Figure 3-62 Quaternary LLE diagram of Triolein EtOl EtOH Water system simulated using COSMO-RS method (COSMOtherm v.c2.1_01.11a with BP-TZVP parameterization) at K and K. Phase composition of species is given in mole percentage Triolein EtOl EtOH Glycerol and Triolein EtOl Glycerol Water Systems The LLE of quaternary systems involving the formation of by-product glycerol will be assessed in this sub-section. It was observed, as is seen in Fig. 3-63, that the composition of dissolved glycerol in fatty rich phase increases with the simultaneous increases in EtOl and glycerol concentrations; while the concentrations of dissolved triolein and EtOl in alcohol (glycerol) rich phase is decreasing, as expected. The composition of dissolved glycerol in equilibrium at 303 K and 318 K were predicted as 0.61% and 0.87%, respectively. Although COSMO-RS method underestimates the LLE of TAG FAEE EtOH systems, as mentioned above, the statement which was mentioned in Section the reaction medium tends to become more homogeneous with the increase in FAEE formation and afterwards it tends towards phase separation with simultaneous increase in glycerol concentration can obviously be seen in Fig III-111
181 PHYSICAL (PHASE) EQUILIBRIA LLE and VLE Figure 3-63 Quaternary LLE diagram of Triolein EtOl EtOH Glycerol system simulated using COSMO-RS method (COSMOtherm v.c2.1_01.11a with BP-TZVP parameterization) at K and K. The LLE of quaternary system including water species, on the other hand, was illustrated in Fig It is evident that water content considerably decreases the solubilities of both EtOH and glycerol in the fatty rich phase. For instance, the estimated equilibrium amounts of dissolved glycerol at 303 and 318 K decreased to 0.37% and 0.55%, respectively (the maximum allowed free glycerol limit in the European standard EN is 0.02% weight based). Since water has higher affinity for glycerol, the ultimate equilibrated moisture contents in fatty rich phase at 308 and 318 K were predicted as and ppm, respectively. Figure 3-64 Simulated LLE diagram of Triolein EtOl Water Glycerol quaternary system simulated using COSMO-RS method (COSMOtherm v.c2.1_01.11a with BP-TZVP parameterization) at K and K. III-112
182 PHYSICAL (PHASE) EQUILIBRIA LLE and VLE For that reason, the addition of cold water into the outlet stream of reactor(s) prior to or after excess EtOH recovery could help to a better separation of dissolved glycerol. This point will be evaluated further in the next section. Analogous to Fig the LLE phase diagrams of triolein MeOl MeOH glycerol quaternary system were illustrated in Fig. A3-17 (see Section I of Appendix 3-3) by means of the same predictive method. It was evidenced in this case that MeOH has significantly lower solubility in triolein and hence there is the likelihood of relatively neat two liquid phase formation throughout of reaction courses (see also Fig. A3-8 presented in Section D of Appendix 3-3) EtOl EtOH Water Glycerol System The LLE phase behavior of reactor(s) outlet streams was illustrated in Fig where the remained triolein species (5%) was assumed equivalent to EtOl in terms of its solubility behavior. Since water has a maximum (initial) global composition of 3.85%, the LLE diagrams of this quaternary case resembles to a 2-D ternary system (see Section 4.2). The amounts of dissolved glycerol in EtOl rich phase at 303 and 318 K subsequent to 95% conversion of TAG species were estimated as 0.57% and 0.84%. Therefore, it is conceivable to deduce that the inclusion of water complemented by the assumption given above (the exclusion of remained triolein) does not alter solubility of glycerol in fatty rich phases (see Section 6.1.2). Likewise, the corresponding maximum contents of absorbed moisture at 303 and 318 K were predicted as and ppm. Thus, the use of cold-water could significantly improve the removal of dissolved EtOH and glycerol from biodiesel (FAEE rich phase). Afterwards, the recovery of EtOH can be practically performed on the glycerol rich phase. However, such decisions require elaborative studies concerning process economics and separation efficiencies. As is seen from the conversion line, the system seems to be homogeneous up to a certain degree of glycerol formation where the impacts of TAG species are ignored. In the next two sub-sections the quaternary systems including FFA (OlAc) species will be evaluated Triolein OlAc EtOH Water and EtOl OlAc EtOH Water Quaternary Systems It was evidenced that the increase in OlAc concentration has increased the solubilities of water and EtOH in fatty rich phases, as are seen in Fig and For instance, the maximum of water content in oil rich phase at 303 K was predicted as ppm. On the other hand, if the LLE phase diagrams of oil FFA EtOH water quaternary systems illustrated in Fig. A3-10 to A3-12 (see Section F of Appendix 3-3) are considered together with the diagrams shown in Fig. 5-85, it can be easily perceived that vegetable oils dissolve substantially larger amounts of aq. EtOH (initially ca. 8-10% aq. EtOH (95.63%) at 303 K; see also Fig. 3-9 presented in Section 2.3.2) with the increase in FFA concentration (addition). It was, however, mentioned in the former sections that the solubility of EtOH and thus LLE phase behavior of systems containing dry and/or aqueous EtOH and vegetable oils are underestimated by means of COSMO-RS method. Consequently, such predictions can be safely used only for considerably higher conversion lev- III-113
183 PHYSICAL (PHASE) EQUILIBRIA LLE and VLE els where FAEE concentration exceeds that of vegetable oil. As is seen in Fig that reaction medium is almost homogenous up to a certain degree of conversion where EtOH concentration decreases below 3 of its initial concentration, while that of water remains practically constant. Therefore, as mentioned in Section that the use of waste/used oils containing 4 substantial amount of FFA can help to the homogeneity of reaction media even with the use of aq. EtOH (95.63%) as the acyl acceptor substrate. Figure 3-65 Simulated LLE diagram of EtOl EtOH Water Glycerol quaternary system simulated using COSMO-RS method (COSMOtherm v.c2.1_01.11a with BP-TZVP parameterization) at K and K. Figure 3-66 Simulated LLE diagram of Triolein OlAc Water EtOH quaternary system simulated using COSMO-RS method (COSMOtherm v.c2.1_01.11a with BP-TZVP parameterization) at K and K. III-114
184 PHYSICAL (PHASE) EQUILIBRIA LLE and VLE In addition, FFA (OlAc) species rather prefer the EtOH rich phase than oil rich phase, particularly at lower T values for triolein OlAc EtOH water system as shown in Fig In contrast, OlAc species at 318 K has higher affinity for EtOH rich phase than at 303 K in case of EtOl OlAc water EtOH quaternary system simulated using COSMO-RS method. There observed substantial difference in phase distribution of OlAc for 15 K of temperature difference which practically inspires that reaction media at higher T values can be more homogeneous in case of waste/used oil feedstocks. Figure 3-67 Phase distribution of OlAc between fatty rich and EtOH rich phases predicted at and K by means of COSMO-RS method (COSMOtherm v.c2.1_01.11a with BP-TZVP parameterization). Figure 3-68 LLE phase diagram of EtOl OlAc Water EtOH quaternary system simulated using COSMO-RS method (COSMOtherm v.c2.1_01.11a with BP-TZVP parameterization) at K and K. Phase composition of species is given in mole percentage. III-115
185 PHYSICAL (PHASE) EQUILIBRIA LLE and VLE 6.2. LLE Phase Behavior of Multinary (Multicomponent) Systems Triolein EtOl Glycerol Rectified EtOH (EtOH+Water) System Analogous to Fig given above (Section 6.1.2) in such a multinary system containing rectified EtOH as depicted in Fig will exhibit relatively larger surface area representing the two-phase volume (instead of an area/region). The equilibrated moisture contents in the beginning of reaction in fatty rich phase at 303 K and 318 K were predicted as and ppm, respectively. Consequently, they reached to the corresponding values of and ppm at the end of 95% reaction completion, where the impact of FFA (OlAc) on water solubility is ignored. The ultimate glycerol concentration dissolved in fatty rich phase at 303 and 318 K was predicted as 0.46% and 0.68%, respectively, for 95% conversion of TAG species. It was verified that the inclusion of EtOH considerably increases the amount dissolved glycerol (cf. Section 6.1.2). Figure 3-69 Simulated LLE diagram of Triolein EtOl Glycerol Rectified EtOH (EtOH+H 2 O) multinary system using COSMO-RS method (COSMOtherm v.c2.1_01.11a with BP-TZVP parameterization) at K and K Triolein EtOl OlAc Rectified EtOH (EtOH+Water) System As observed in case of EtOl EtOH water glycerol quaternary system illustrated in Fig. 3-65, the LLE diagrams of triolein EtOl OlAc rectified EtOH multicomponent system shown in Fig exhibit almost a 2-D ternary diagram due to relatively lower global concentration of OlAc. The maximum of OlAc concentration in fatty rich phase was 0.90% that is reached at the end of 95% reaction completion. There observed relatively larger two-phase regions thanks to lower solubility of rectified EtOH where the water content was supposed to remain practically constant. The initial moisture content at 303 K was predicted as ppm which ultimately III-116
186 PHYSICAL (PHASE) EQUILIBRIA LLE and VLE reaches to ppm thanks to the increase in OlAc concentration and to the excess amount of EtOH. Meanwhile, the impact of glycerol formation was ignored in these calculations. Figure 3-70 LLE phase diagram of Triolein EtOl OlAc Rectified EtOH (EtOH+H 2 O) multinary system using simulated COSMO-RS method (COSMOtherm v.c2.1_01.11a with BP-TZVP parameterization) at K and K (Triolein+OlAc) EtOl EtOH Glycerol System The impact of water concentration (ca. 4% based on EtOH feed weight) on phase behavior can be seen through the LLE of (triolein + OlAc) EtOl EtOH glycerol multinary system where the phase compositions of OlAc and triolein components are combined, as shown in Fig It was observed that OlAc has higher initial affinity for glycerol rich phase that is attributable to H- bonding interactions (cross-association). These kinds of interactions diminish with the reaction course where other electrostatic forces (e.g., van der Waals) become more effective. The value of K OlAc at 318 K for 59.73% of conversion of TAG was calculated as 0.94 (see also Fig. 3-72). Therefore, the corresponding equilibrated (dissolved) glycerol in fatty rich phase of this multinary system (comprising OlAc species) at 303 and 318 K were estimated as 0.27% and 0.49%. Consequently, it was observed that the inclusion of OlAc improves the solubility of all species in fatty rich phase except that of glycerol. III-117
187 PHYSICAL (PHASE) EQUILIBRIA LLE and VLE Figure 3-71 Multicomponent LLE phase diagram of (Triolein+OlAc) EtOl EtOH Glycerol system simulated using COSMO-RS method (COSMOtherm v.c2.1_01.11a with BP-TZVP parameterization) at K and K (Triolein+OlAc) EtOl Rectified EtOH (EtOH+H2O) Glycerol System In this sub-section the most general case comprising 6 components simulated as the concurrent esterification, hydrolysis and transesterification reactions will be evaluated. The amounts of dissolved glycerol in fatty rich phase at 303 and 318 K were estimated as 0.48% and 0.71%, respectively. Similarly, the corresponding absorbed moisture contents were predicted as and ppm. The phase distributions of OlAc and water were presented in LHS diagram of Fig where it was evidenced that OlAc prefers glycerol phase in the beginning of reaction and with the increases in OlAc, FAEE and glycerol concentration it tends towards the fatty rich phase. Moreover, there observed some stable compositions of OlAc in fatty rich phase for the very close proximity of 95% conversion. Although there were no changes for OlAc compositions for 15 K of temperature difference, it was detected that such a temperature difference has substantial impact on the absorbed moisture content ( ppm of difference for the ultimate values). In addition, the phase distribution ratios of glycerol changing with the reaction course were illustrated in LHS diagram of Fig As is seen K Glycerol increases with the increase in glycerol formation (concentration) where there are saturation points around 70% of reaction completion. At these points glycerol reaches to its maximum concentration dissolved in the fatty phase which starts to decrease afterwards. III-118
188 PHYSICAL (PHASE) EQUILIBRIA LLE and VLE Figure 3-72 LLE phase diagrams of (Triolein+OlAc) EtOl Rectified EtOH (EtOH+H 2 O) Glycerol multinary system simulated using COSMO-RS method (COSMOtherm v.c2.1_01.11a with BP-TZVP parameterization) at K and K. Figure 3-73 LHS: Phase distributions of OlAc and water species between fatty rich and alcohol rich phases at K and K for the multinary system of (Triolein+OlAc) EtOl Rectified EtOH (EtOH+H 2 O) Glycerol. RHS: The change of glycerol distribution ratio with respect to the course of reaction for 95% conversion at different T values (z Glycerol represents the mole fraction of formed glycerol by-product) Predictions performed by means of COSMO-RS method with BP-TZVP parameter set (COSMOtherm v.c2.1_01.11a ) III-119
189 PHYSICAL (PHASE) EQUILIBRIA LLE and VLE (TAG+DAG+MAG) FAEE EtOH Glycerol System It is well-known that the concentration maximums for di- and mono-acylglycerides can vary from reaction to reaction depending on conditions. For instance, it has been observed during the enzymatic ethanolysis reactions involving non-specific Novozym 435 immobilized enzymes that DAG species have higher concentrations than MAG ones in the very beginning of reactions where the ultimate concentration of MAG becomes higher than that of DAG. In addition to the case study mentioned above for quaternary and multinary LLE simulations, one more case using neat vegetable oil containing the intermediate DAG and MAG (1,3-DAG and 1(3)-MAG) products was also considered. Initial molar composition of the hypothetical oil feed was as follows: 70% TAG, 20% DAG and 10% MAG; while the final compositions were considered as 15% TAG; 10% DAG, and 5% MAG. As a result, 70% of reaction completion with 30% molar excess absolute EtOH feed was presumed for oleic and linoleic cases where 308 and 323 K were chosen as the reaction temperatures. In such a simulation the most stable isomers of DAG (1,3-DAG) and MAG (1(3)-MAG) species were considered and linear decreases in acylglycerides concentrations for a 70% final conversion level of TAG species were assumed in order to mimic the impacts of intermediate acylglyceride products. The quaternary LLE phase diagrams of multicomponent oleic and linoleic systems were illustrated in Fig using mole percentages. It was interestingly observed that EtOH has lower solubility in linoleic acylglycerides than in oleic ones. In contrast, linoleic mixture has higher solubility in EtOH rich phase. As is seen in Fig. 3-75, 1,3-dilinolein species shows higher affinity for alcohol rich phase than 1,3-diolein. The curvilinear patterns of species phase distributions reveal the compromise between H-bonding and other electrostatic forces during the reactions where the former predominates in the commencement of reactions. As a practical conclusion, it is plausible to state that simultaneous removal of glycerol from reaction medium may decrease the biodiesel product yields. Although the impact of 15 K of temperature difference is insignificant in oleic case, it seems to have considerable effect on linoleic mixture, especially at close proximity of 70% reaction completion. Besides, the amounts of dissolved free glycerol at 308 and 323 K were predicted in oleic case as 0.82% and 1.19%, whereas that of linoleic case at 308 K was 0.99%. It is known that EtOH is miscible with both mono- and di-olein species, 45 as also verified through predictions. However, neither water nor glycerol was predicted as miscible with the latter acylglyceride species at the specified T values; whereas glycerol was estimated as miscible only with 1(3)-Monoolein. The predicted solubilities of water and glycerol were illustrated in Fig As is seen BP-TZVP set estimated significantly low solubilities of both species in 1,3- Diolein; whereas the novel set estimated relatively higher amount of moisture in 1,3-Diolein only at 323 K. Water has up to 3% of solubility in 1(3)-Monoolein species. III-120
190 PHYSICAL (PHASE) EQUILIBRIA LLE and VLE Figure 3-74 Simulated LLE phase diagram of (TAG+1,3-DAG+1(3)-MAG) FAEE EtOH Glycerol multicomponent system simulated using COSMO-RS method (COSMOtherm v.c2.1_01.11a with BP-TZVP parameterization) at K and K. Phase composition of species is given in mole percentage. Figure 3-75 Phase distributions of DAG and MAG species between fatty rich and alcohol rich phases predicted by means of COSMO-RS method with BP-TZVP parameter set (COSMOtherm v.c2.1_01.11a) at K and K for the multinary system of (Triolein+DAG+MAG) EtOl EtOH Glycerol multicomponent system. A: Diacylglyceride case; B: Monoacylglyceride case. Black arrows ( ) show the direction of reactions course. III-121
191 PHYSICAL (PHASE) EQUILIBRIA LLE and VLE Figure 3-76 Solubilities of H 2 O in 1,3-Diolein and 1(3)-Monoolein species (A) and glycerol in 1,3-Diolein species (B) predicted at K and K by means of COSMO-RS method (COSMOtherm v.c2.1_01.11a with BP-TZVP and COSMOtherm v.c3.0_12.01 with BP-TZVPD-FINE parameter sets). Glycerol was predicted as miscible with 1(3)- Monoolein species at and K by means of COSMOtherm v.c2.1_01.11a with BP-TZVP method Conclusions In this section multinary LLE phase behaviors of enzymatic ethanolysis reaction (including hydrolysis and esterification as the side reactions) were simulated by means of a case scenario using neat vegetable oil feedstocks containing an initial amount of 0.25% FFA and aq. EtOH (96%) as the acyl acceptor. The final TAG conversion was accepted as 95% where there assumed 1% of final FFA (based on oil feed weight) and 3.76% of final water (based on aq. EtOH feed weight) contents. It was evidenced that there are possibilities of homogenous (single-phase) reaction media presence in the commencement of reactions, mainly with the use of dehydrated waste/used oil feedstocks comprising noticeable amounts of FFA. However, the increase in by-product glycerol concentration and simultaneous decrease in EtOH concentration initiate more pronounced phase separations for the enzymatic reactions at appropriate T values. Besides, the corresponding solubilities of water and glycerol species within the intermediate 1,3- Diolein species were predicted at 308 K as and ppm (1.55%) using the old version of BP-TZVP parameter set (COSMOtherm v.c2.1_01.11a). In contrast, it was predicted that glycerol is miscible with 1(3)-Monoolein at that temperature, while water has a predicted solubility value of 3.03%. As a result, the formation of MAG species increases the likelihood of homogeneous phase formation, particularly in the commencement of reactions. Moreover, EtOH is miscible with both MAG and DAG species. On the other hand, it was observed that both absorbed moisture and dissolved glycerol contents in fatty rich phase depend strictly on the composition of reaction medium. In case of the most plausible reactive mixture including oil, FAEE, FFA, aq. EtOH and glycerol (excluding intermediate acylglycerides) the amount of dissolved free glycerol at 303 and 318 K were estimated as 0.48% and 0.71%, respectively, where even that of predicted at lower T value substantially exceeds the allowed limit (max. 0.02% (m/m)) in the current standards. Moreover, the amount of corresponding absorbed moisture contents were predicted as and III-122
192 PHYSICAL (PHASE) EQUILIBRIA LLE and VLE ppm and it was evidenced that moisture content increases with the increase in FFA content. Current biodiesel standards restrict the maximum amount of moisture to 500 ppm. Therefore, even though cold-water can be used for the removal of dissolved glycerol from biodiesel by liquid-liquid extraction operation, a dehydration step is always necessary. Finally, since intermediate acylglyceride products (DAG and MAG) have higher affinity for glycerol, the simultaneous removal of glycerol may decrease final biodiesel yields. 7. Simulations of VLE in Down Processing (Refining) of Enzymatic Transesterification Reactions using QC-COSMO-RS Method Even though COSMO-RS method allows for the estimation of pure compound vapor pressures, 103 it is preferable to use experimental data or correlations obtained using such data where available. As a matter of fact, reliable vapor pressure calculations of FAEE components are essential in order to realistically simulate the VLE phase behaviors. Consequently, the extended versions of Antoine equations (DIPPR 101 type equation 118 ) were established and implemented into COSMOtherm software for EtOH, glycerol, and the major FAEE components derived from soybean (or rapeseed) oil feedstocks. The vapor pressure versus temperature data of individual FAEE components were taken from PRO/II v.9.0 chemical process simulation software 119 database and fitted to the extended type Antoine equations using the Levenberg-Marquardt nonlinear least squares method (see Table 1 of Appendix 5-4). 90 Before the regression some of data points were modified with the available experimental ones. It is noteworthy that although they were measured at the same reduced pressures; reported data of different sources also shows considerable inconsistencies for the same species. VLE calculations can be performed both isothermally and isobarically. In order to simulate vacuum evaporation/distillation, isobaric VLE calculations were computed at reduced pressures of up to 10 and 50 kpa for both individual FAEE components and biodiesel fuel; whereas reduced pressure of 1 kpa and 10 kpa were applied for the VLE simulation in glycerol purification step. It has been reported that purified biodiesel fuel (FAME) and glycerol are susceptible to the thermal decomposition above 523 K 1 and 423 K 2, respectively. As a result, temperature values of 413 (for glycerol purification), 423, and 473 K (for biodiesel purification), were chosen for the isothermal VLE computations with the purpose of preventing separated biodiesel and glycerol phases from decomposition. As mentioned above biodiesel is naturally a blend of ethyl (methyl) esters of long-chain fatty acids and the simulation of real processes requires using such mixtures rather than using the major constituent as a pure single component. On the other hand, the calculation of thermodynamic properties, such as vapor pressure, generally requires single component approxima- III-123
193 PHYSICAL (PHASE) EQUILIBRIA LLE and VLE tion. In order to provide a realistic simulation, the blend of FAEE species was considered as a near-ideal solution which was pointed out for the mixture of FAME species by Goodrum and coworkers. 3 Thus, the total vapor pressure of the FAEE species in the system was calculated from the sum of vapor pressure of individual FAEE components weighted by their corresponding FA compositions (of the oil source). As a result, VLE simulations were performed for multinary systems: 5 FAEE + EtOH + Glycerol for EtOH recovery and 5 FAEE + glycerol for the VLE of purification operations. Soybean oil was chosen as the biodiesel feedstock with the molar composition 108 of 10.82% C16:0; 4.89% C18:0; 25.21% C18:1; 51.51% C18:2; and 7.47% C18:3. The total biodiesel (FAEE) mole fraction at vapor phase was calculated as the sum of individual mole fractions of ethyl esters. Considering the purity of recovered EtOH, isobaric operation under 50 kpa of vacuum was chosen as the most suitable option for striping excess EtOH from biodiesel phase. It was found that is very achievable removing the dissolved glycerol from the biodiesel through isothermal simple unit operations, such as flash distillation or evaporation for conversions above 89% to 99.5%. However, since the temperature exceeds the critical temperature limit (523 K) reported for FAME decomposition 1, isobaric operations seems to be completely unsafe. Besides, neither 10 nor 50 kpa of vacuum levels perform better than isothermal cases for such simple unit operations. VLE simulations of glycerol purification through isothermal operation at 413 K showed yet again relatively better results than isobaric simple operations, even that at 1 kpa of vacuum. Besides, at such a significantly low vacuum, the temperature still exceeds (ca. 430 K) the critical limit. Despite the fact that glycerol has lower boiling points than FAEE mixture, in general, the K- values of FAEE were rather higher than of glycerol. Therefore, relative volatility of glycerol to FAEE ( α Gly, FAEE ) which is defined as the ratio of K-value of more volatile to the less volatile component by convention, was lower than unity. As a consequence, further purification of glycerol requires using vacuum distillation or rectification operations. Nonetheless, it is worth noting that as an advantage of enzymatic biodiesel production, glycerol after the stripping of EtOH should theoretically have a purity of 98.3 wt. % to 98.8 wt. % for the conversion levels of 74.4% and 99.5%, respectively. In conclusion, binary VLE of individual FAEE components and glycerol showed minimum boiling azeotropes where the highest azeotrope mole fraction of was observed for EtPa at 423 K. Similar pseudo-azeotrope points were also observed with FAEE-Glycerol binaries. At low conversions (ca. 39% to 44%) EtLi -as the major constituent of soybean oil derived FAEE- had sufficient concentration for the formation of azeotropy. Further discussions were given in Appendix 3-4. III-124
194 CHAPTER 4
195
196 ANALYSIS OF CHEMICAL EQUILIBRIA IV. Chapter 4 Chapter 4 ANALYSIS OF CHEMICAL EQUILIBRIA TRANSESTERIFICATION, ESTERIFICATION, AND HYDROLYSIS REACTIONS CONTENTS 0. Concise Evaluation of Chapter - Summary 1. Introduction 1.1. Motivation 1.2. Objectives and Assumptions 1.3. Reaction Schema 1.4. Determination of Independent Reaction Sets 2. Thermophysical Properties of Reacting Species 2.1. Formation Energies 2.2. Vaporization Enthalpies 2.3. Isobaric Specific Heat Capacities at Liquid State 3. Pseudo-empirical Correlative K-value Method 4. Chemical Equilibria Simulations through Minimization Methods 4.1. Constrained (Non-stoichiometric) Minimization Simulation A: Reaction System Including All Species Simulation B: Reaction System for Absolute EtOH (Water as an inert species) Simulation C: Reaction System for Oleic Acid as an inert species Simulation D: Reaction System for Absolute EtOH (Water + Oleic acid as inert substances) 4.2. Unconstrained (Stoichiometric) Minimization Simulation through the Equilibrium Temperature Approach 5. Chemical Equilibria Analysis by means of Pseudo-Empirical K-Value Method 5.1. Pseudo-empirical Chemical Equilibrium Constant (K-) Models of Reactions 5.2. Reaction Energies Gibbs free Energies and Chemical Equilibrium Constants of Reactions Enthalpies of Reactions 5.3. Simulations of Chemical Equilibrium through pseudo-empirical K-value Models Simulation A: Transesterification Reactions using Absolute Ethanol Simulation B: Transesterification and Hydrolysis Reactions using Aqueous Ethanol - Consecutive Solution 6. Experimental Analysis of Chemical Equilibrium for Enzymatic Ethanolysis Reactions 6.1. Ethanolysis with Absolute EtOH using Novozym 435 as the Biocatalyst Some Evaluations of Ethanolysis Reaction in terms of Chemical and Phase Equilibria Ethanolysis, Hydrolysis, and Esterification Reactions with Rectified EtOH using Novozym 435 and TL HC as the Biocatalysts 7. Simultaneous Simulations of Physical and Chemical Equilibria for the Ethanolysis Reaction with Absolute EtOH IV-1
197 ANALYSIS OF CHEMICAL EQUILIBRIA 8. General Conclusions and Future Prospects References Appendix 4-1 Appendix 4-2 Appendix 4-3 IV-2
198 ANALYSIS OF CHEMICAL EQUILIBRIA 0. Concise Evaluation of Chapter Summary The Need for Chemical Equilibrium Studies The analysis of reactive systems in terms of chemical thermodynamics can provide significant and useful information on the extent and/or yield associated with a reaction. It is plausible to state that the study of chemical thermodynamics in equilibrium reactions has two main purposes: the thermodynamic analysis of reactive systems and prediction of the equilibrium compositions from the thermophysical properties of its components. It is generally a good approximation to assume that a reaction to be irreversible when standard state Gibbs free energy (GfE) of reaction is much smaller o than zero, G rxn 0. The description of a reaction as irreversible simply means that the equilibrium constant is so large that forward reaction rate is significantly higher than the rate of backward reaction. The highest attainable conversion in reversible reactions is the equilibrium composition which may take an infinite period of time to be achieved. On the other hand, it is important to note that real systems do not necessarily achieve this level of conversion; therefore the conversions calculated from thermodynamics are only suggested attainable values. In other words, equilibrium concentrations are a set of fake or artificial values for most intents and purposes. They almost always represent an upper limit on the expected concentration at the temperature in question. Moreover, from the standpoint of obtaining sufficient products of economic value, a final state of equilibrium is almost always undesirable. Other chemical reactions, kinetic effects, and temperature variations in the system may render these calculations valueless. Nonetheless, equilibrium calculations serve a useful purpose since they do provide a reasonable estimate of the attained equilibrium concentrations. Study Objectives The reaction systems involved in biodiesel production are virtually heterogeneous where equilibrated alcohol (+ water) rich and fatty rich phases exist together after some certain levels of conversion. It is in essence commonly known that in heterogeneous media (equilibria) in which reactants and products are present in more than one phase can definitely go to completion. In this study it was primarily aimed at achieving the reaction equilibria of transesterification, hydrolysis and esterification reactions through homogeneous reaction media assumption. In that respect, the nonideality of reactive species was modeled by means of UNIFAC-LLE group contribution based activity coefficient model. On the other hand, the second purpose was the corresponding assessments of thermodynamic feasibility and limits of reversible reactions performances for different substrate feed ratios (from 1:2 molar oil to EtOH feed ratio up to 30% of excess EtOH feeds). In overall, the thermodynamic feasibility of single liquid phase or homogeneous reaction media assumption has been evaluated in order to verify the necessity of generating the homogeneous media or useless of such attempts. In other words, the additional aim was determining the thermodynamic limits of all three reactions in terms of reaction (chemical) equilibria analysis by changing the feed ratios and reaction temperatures all through homogenous reaction media assumption. Furthermore, the thermophysical properties were estimated using different suitable group contribution approaches and subsequently have been compared with experimental ones, where available. Methods Applied to Chemical Equilibria Simulations and Assessments Since reaction and product specifications can be applied to impose constraints on such analyses, the reactions were first studied through Gibbs free energy (GfE) minimization of reaction systems ( G rxn, i min. ) through both constrained and unconstrained minimizations. In case of GfE minimization methods, the regular Newton-Raphson method implemented in RAND and VCS algorithms IV-3
199 ANALYSIS OF CHEMICAL EQUILIBRIA was chosen on account of its speed of convergence and simplicity to solve the systems of nonlinear equations. In that respect, the GfE minimization problem can be formulated as follows: 1. The stoichiometric equations are not used in the non-stoichiometric formulation but, instead, the closed-system constraint is treated by means of Lagrange multipliers. 2. The closed-system constraint in the stoichiometric formulation is treated by means of stoichiometric equations in order to result in an essentially unconstrained minimization problem. Besides, analyses via pseudo-empirical correlative chemical equilibrium constant (K-value) models and quantum chemical COSMO-RS method (see Part 2 of Appendix 4-3) were accordingly achieved. The experimental investigations of chemical equilibria employing both absolute and aqueous EtOH and neat vegetable oil substrates by means of two different types of immobilized biocatalysts were successively performed with the intentions of identifying the thermodynamic boundary lines and evaluating thermodynamic performances of reaction systems. In addition, simultaneous phase and chemical equilibria studies accomplished through predictive method and then subsequently verified by means of experimental measurements were correspondingly assessed. On the other hand, it is worth emphasizing that the accuracy of calculated equilibrium states and compositions depends critically on the data sources/values used. Hence, accurately measured thermophysical properties of reactive components need to be used, where available. However, neither a few of available data points reported on fatty species nor the thermophysical data of other species involved in reactions have internal consistency. They, instead, demonstrate considerable differences depending on the data sources used. Therefore, it is obvious to consider a compromise that represent internal consistency of data points among the thermophysical properties employed throughout of simulations. In that respect several group contribution (GC) methods appropriate for estimating the pertinent thermophysical properties of fatty species were also evaluated. In overall, the thermophysical properties of reactive species, reaction energies, and ultimately the apparent biphasic equilibrium constants of transesterification, hydrolysis and esterification reactions including the intermediate reaction steps were calculated. The spontaneity of each reaction was subsequently evaluated by means of two ultimately determined thermophysical data sets at appropriate T values. The reaction schema and its mathematical expressions for multiple reaction systems were mentioned in the first few sub-sections of Section 1. The theoretical background of chemical equilibrium analysis and the methods employed for the analysis of chemical equilibria has been briefly explained in Appendix 4-1. Besides, the theoretical and to some extent mathematical background information required for the evaluated methods were mentioned. In addition, the constraints applied throughout of Gibbs free energy (GfE) minimization methods accompanied by some appraisals of the concept were the final parts of this section. Thermophysical Properties and their Estimations The main subject of Section 2 was the estimations of thermophysical properties; their conversions from the ideal gas to liquid state and their comparisons with available experimental data so as to assess the most appropriate estimative methods. Since all reactions in consideration take place in liquid phase at the temperature range of 308 K to 333 K, thermophysical properties of reacting species needs to be given for condensed (liquid) phase at standard conditions (P 0 = 1 bar and T o = K) or an arbitrarily chosen reference temperature, but at standard pressure, (P 0 ). The thermophysical properties studied were the formation energies, vaporization enthalpies, isobaric liquid specific heat capacities, and normal boiling temperatures of species. In that respect, it is of concern to point out that there is a significant lack of experimental data accessible for fatty species either in ideal gas or liquid states. Moreover, to the best of our knowledge, there is also a lack of even predictive IV-4
200 ANALYSIS OF CHEMICAL EQUILIBRIA data for the formation energies of fatty species; nonetheless, there can be found some exceptions either predictive or experimental. Consequently, the majority of thermophysical data has been estimated through appropriate GC predictive methods. It is again worth emphasizing that the accuracy of calculated equilibrium states and compositions depends critically on the data sources used. Therefore, the liquid Gibbs free formation energies calculated by means of predictive methods for values at ideal gas state and data points obtained from different sources for liquid formation enthalpies have been used for tri-, di-, and mono-olein species in order to have internal consistency among the data points. Moreover, instead of using reported liquid formation enthalpy of triolein, datum (predicted) taken from DIPPR 801 database was preferred. There observed some significant inconsistencies among the normal boiling point temperatures obtained from process simulation software and those obtained by means of predictive methods which bring further ambiguity on having some optimal decisions. It is analogously preferable to decide on a single data source so as to have consistency among the corresponding data points and thus among the calculated thermophysical properties. Furthermore, it is expected that this approach might decrease the relative uncertainty attributable to different data sources. Lastly, the polynomial models built using non-hierarchical GC method of Kolská et al. were chosen so as to represent fatty species specific heat capacities (see Section 2). Reaction and Formation Energies of Partial Glycerides It is of concern to note that the heat and the GfE of reactions, for the last steps of transesterification and hydrolysis reactions (Reaction 3-1 and 3-2) at T o and formation energies of monoolein at 293, 298, and 303 K should be considered with cautions. Since, the heat and GfE of reactions are defined for an unmixed situation and pure monoolein is in solid state at these temperature values. However, formation energies of diolein and its reaction energies for the second steps of transesterification and hydrolysis reactions (Reaction 2-1 and 2-2) can be considered as on the limit at 293 K. Nonetheless, it is worth pointing out that in a fatty system/mixture both of these species will be at liquid state due to freezing point depression phenomenon in a solution (depending on their corresponding concentrations). Selections of Thermophysical Data Points The available literature data were preferred for alcohols (glycerol and EtOH), water, and OlAc species, to some extent. In case of fatty species, however, the choice of appropriate set of each thermophysical property was done through pseudo-quantitative comparisons of the related predictions with the experimental data points where available. For instance, the heat of vaporization predictions at T o and T b were compared with the corresponding data points of PRO/II v.9.0 database together with the related normal boiling data points comparisons. As a result, the data points obtained from PRO/II v.9.0 process simulation software database were decided as the most appropriate T b values by keeping the internal consistency of data points in mind, as a priori requirement. Thus, it was expected to have the most appropriate data set with internal consistency. Since there are several options on the determination of possible data sets, two data sets have been ultimately decided in order to use mainly with the pseudo-empirical K-value method (see Table 4-4 and Table A4-7 given in Appendix 4-3). Furthermore, two alternative tables of formation and reaction energies for new reference temperatures (293 and 303 K) were also built (see Table A4-5 and A4-6 given in Appendix 4-2). IV-5
201 ANALYSIS OF CHEMICAL EQUILIBRIA Simulations through Constrained and Unconstrained Minimizations The simulations of constrained and unconstrained GfE minimizations for determining the chemical equilibrium compositions of reaction systems were performed (see Section 4). In these and subsequent simulations it was aimed at achieving the analysis of chemical equilibria of reactions involved in biodiesel (FAEE) production at three molar equivalent feeds of aqueous EtOH (0.67, 1.00, and 1.30) and at different T values for the range of K. The constrained minimizations were performed through four scenarios. It was evidenced that thermodynamics of reaction systems favors the hypothetical EtOl formation at lower EtOH feed rates and higher T values; whereas that of OlAc shows the opposite pattern. Although it is definitely hypothetical, EtOl formation could not exceed 72% of its theoretically possible conversion level for homogeneous reaction media assumptions. On the other hand, quantitative glycerol formation was obtained only for Simulation B (OlAc is assigned as an inert species) at the lowest T value (308 K), but for all aq. EtOH feeds studied. Therefore, it was evidenced that the presence of water thermodynamically favors the reverse side hydrolysis reactions. Two approaches were applied in case of unconstrained GfE minimization: The equilibrium temperature approach (with ΔT of 1 K) and the fraction of conversion approach for the base component with three mole fraction values: 0.80, 0.90, and 0.95 (see Part 1 of Appendix 4-3). Analogous to constrained minimization cases three molar equivalent amounts of aqueous EtOH (0.67, 1.00, and 1.30) were fed into the CSTR reactor, but only simulations with 0.67 and 1.30 molar equivalent feeds were demonstrated. Since the solution of neither 7 nor 6 simultaneous reactions were successful, the ultimate solution procedure executed can be defined as follows: Esterification reaction (Reaction 5) has been excluded and the system proceeded with a reaction system in 3 steps consisting of 2 simultaneous reactions per step, such as simultaneous solution of Reaction 1-1 and Reaction 1-2 and then subsequent solution of Reaction 2-1 and Reaction2-2 pair followed by the solution of last successive reaction set. The inlet temperature of each reaction pair was kept at 298 K which signifies that simulation results through this method represent the theoretical limits of the reaction steps in terms of thermodynamic feasibility. The simultaneous solution of reaction sets through equilibrium temperature approach showed that it is more thermodynamically feasible to operate reactions at higher aq. EtOH feeds, but at lower T values with the obligation of a subsequent esterification step (Reaction 1-1 to Reaction Reaction 5), in order to reduce FFA composition in the final biodiesel product. On the other hand, the reaction systems simulated through fraction of conversion approach have converged for all three fractions which mean that when the system reaches to chemical equilibrium the initial expectations of 0.80, 0.90, or 0.95 of triolein to be converted through transesterification reaction are thermodynamically feasible. The multiplication of these fractions with the corresponding converged equilibrium compositions represent the real (ultimate) equilibrium concentrations. Since there are differences between equilibrium compositions at different temperatures, it evidences that there are some particular phase-splits/separations (LLE), even though homogeneous reaction media were assumed within the reactor. Thus, it was concluded that this assumption has to be considered with cautions. Besides, in order to attain more realistic and thermodynamically feasible equilibrium compositions, it is better to couple some appropriate phase-splitting algorithms to the non-ideal VCS algorithm used for chemical equilibrium calculations so as to determine possible physical (two-phase) equilibrium. Analogous to the constrained minimization through monophasic reaction media assumption ca. 70% of the theoretically possible conversion level for EtOl was obtained as the maximum by means of two approaches performed (see Section 4.2). In that aspect, it was again verified that reaction system thermodynamically favors lower aq. EtOH feed rates, but higher T values for the first reaction pair (Reaction 1-1 and Reaction 1-2). However, the opposite was valid for the other two reaction pairs. IV-6
202 ANALYSIS OF CHEMICAL EQUILIBRIA Reaction Energies through Pseudo-Empirical K-value Method It was calculated through pseudo-empirical K-value method that the equilibrium constants of hydrolysis reaction steps have exceptionally high values with respect to their counterparts in the transesterification reaction set (see Section 5.1). Such high equilibrium constants reveal that hydrolysis reactions will proceed spontaneously in the directions written. Moreover, it was found that all the reaction energies, except those of Reaction 5, are negative and their absolute values increase with temperature. On the contrary, the corresponding K-values decreased despite to more negative,. values of their G o liq rxn ( T) at higher temperatures. The fastest decrease in equilibrium constant value with the increase in T was observed for Reaction 1-1 (of transesterification reaction set). In hydrolysis reactions the impact of higher T on the equilibrium constants was rather significant with the highest value in Reaction 1-2 case. In overall, all the equilibrium constants can be considered as the weak functions of T with slight changes at higher T values. On the other hand, all the reaction steps have negative reaction enthalpies with again the exception of Reaction 5. It is obvious that Reaction 5 requires energy input in order to surpass the reaction energy barrier and proceed in the written direction. The reaction enthalpy of Reaction 1-1 at 313 K was calculated as kj per mole of EtOl (l) produced. It should be recognized that this value of reaction enthalpy stands for an unmixed condition where 1 mole of triolein and 1 mole of EtOH react to produce 1 mole of EtOl and 1 mole of diolein. In addition, the enthalpies of Reaction 2-1 and 3-1 were calculated as kj and kj per mole of EtOl (l), respectively. In overall, the enthalpy of Reaction 4-1 was calculated as kj per mole of EtOl (l) which is in significant agreement with the reported value (-9.3±0.7 kj/mol ) through the isothermal microcalorimetric measurement of reaction enthalpy at the same T for transesterification of rapeseed oil via EtOH as the acyl acceptor. Likewise, the reaction enthalpy of Reaction 5 was calculated through K-value method as kj/mol (as the average value for the T range of K); whereas it was reported by Bucalá and co-workers 1 as kj/mol (in average). This considerably high value should be attributed to the fact that reactive mixture forms two equilibrated liquid phases throughout of the reaction course (water rich and fatty rich phases). Therefore, instead of assuming a single liquid phase it is indispensable to couple and compute physical and chemical equilibria simultaneously. It seems that partition of reacting species and hence the phase-split phenomena have significant impacts on chemical equilibrium. Simulations through Pseudo-Empirical K-value Method Simultaneous solution of linear equation sets for the transesterification of triolein with absolute and aqueous EtOH feeds were simulated by means of the pseudo-empirical K-value method (see Section 5). The same monophasic reaction media was assumed and all calculations were performed using equilibrium temperature approach. In this case EtOl formation with ca. 79% of its theoretically possible conversion was obtained for 0.67 molar equivalent of dry EtOH (Case 1) at 328 K as the highest (see Table 4-12). The case of 1.30 molar equivalent dry EtOH feed at the same T has resulted with the second highest percentage of EtOl. It was deduced that stoichiometric or higher EtOH feed rates favor both the formation of EtOl and monoolein (Reaction 2-1) or more practically Reaction 3-1 seems to be the rate limiting step in terms of thermodynamics. For instance, the 30% molar excess amount of EtOH feed yielded 5.65% (in average) more biodiesel in all three T values than the stoichiometric feed. There observed some slight increases in EtOl amounts at all feed rates with the increase in T values. However, it was concluded that lower dry EtOH feeds gave better biodiesel yields than the excess or stoichiometric feeds. On the other hand, it was not possible to simulate all 7 reactions or 6 reactions proceeding simultaneously in case of aq. EtOH feed. There observed some technical and mathematical problems that IV-7
203 ANALYSIS OF CHEMICAL EQUILIBRIA hinder the convergence of the linear equation sets, such as inappropriate initial conditions, matrix singularity problem at some points, etc. Nevertheless, the pairwise (transesterification + hydrolysis reaction steps) simulation results for aq. EtOH feeds were quite similar in performance to those with dry EtOH. The highest EtOl formation in this case was reached to 54.5% of its theoretically possible amount at 308 K for 1.30 molar equivalent of aq. EtOH feed; while the lowest EtOl formation was obtained at 318 K. Indeed, the percentages of EtOl at 318 and 328 K were similar and were calculated as around 30%. Hence, Reaction 1-1 and 1-2 pair should be considered as the rate limiting step at higher T values. Furthermore, the highest glycerol formation was obtained at 328 K as 32% of the theoretically possible amount. In overall transesterification and hydrolysis reactions have different patterns at different T values. The thermodynamically optimal transesterification and hydrolysis reactions with 30% molar excess of aq. EtOH can be achieved at 308 K; while hydrolysis reaction can be performed equally well at 318 and 328 K values. Since the amount of glycerol produced at 308 K was the lowest one, it was deduced that the backward reaction for Reaction 3-1 should be significant at that or lower T values. An Overall Evaluation of Three Ways of Simulations In conclusion, it was observed through the assessments of three methods (constrained and unconstrained GfE minimization and pseudo-empirical K-value model) applied for the analysis of chemical equilibria of reaction systems that homogeneous reaction media does not favor the formation of FAEE (EtOl) higher than 70% (see Section 4 and 5). To be precise, the thermodynamic feasibility study of reaction systems has revealed that 70% to 80% of the maximum amount of biodiesel (EtOl) formation could be achieved through the single liquid phase reaction media assumption. It is of concern to emphasize that all of the thermodynamic feasibility evaluations have been performed by means of the related thermophysical property data sets that are partly presented in Table 4-4 (see Section 3). It was evidenced that the quality of thermophysical properties has rather significant influence on the equilibrium constants and hence on the equilibrium compositions (cf. Section 5.2 and Appendix 4-3 for comparisons). If the corresponding steps of transesterification and hydrolysis reactions are compared it can be easily seen that the latters are more exothermic than the former ones. This means that transesterification reactions require relatively higher heat duty in order to proceed in the written directions. As a practical approach in case of pseudo-homogeneous reaction media, lower T values should be preferred in the transesterification reaction with aq. EtOH in order to produce higher amounts of EtOl. Experimental Analysis of Chemical Equilibria In order to measure the chemical equilibria attained for ethanolysis reactions by means of immobilized biocatalysis, different experimental set-up(s) were prepared (see Section 6). Two different lipolytic enzymes in immobilized forms were used. They were Thermomyces lanuginosus lipase (TLL) and Candida antarctica lipase B (CALB) both of which are immobilized on the same type of hydrophobic microporous supports. In addition, two forms of EtOH as the acyl acceptor in different molar equivalent amounts were used: Absolute EtOH (with max v% water) and rectified EtOH (with ca wt. % water). High oleic sunflower oil (SFO-HO) with C18:1 composition above 90% was used as the oil substrate and 5% (by the weight of oil feed) of immobilized enzymes was loaded as the catalyst. The reaction time where there was no more than 0.5% of difference between two consecutive measurements was assigned as the chemical equilibrium point (state) of reactions. Consequently, it was evidenced that Novozym 435 does not favor the formation of FAEE in case of aq. EtOH substrate and produces twice as much of FFA than TL HC. Moreover, lower T values favor the formation of FAEE than that of FFA. IV-8
204 ANALYSIS OF CHEMICAL EQUILIBRIA It was observed that the produced glycerol forms small droplets suspended in the mixture; while some of it adheres onto the catalyst beads during the reaction. In addition, besides of the interactive and electrostatic forces (polar apolar interactions) that results with its immiscibility with fatty species, glycerol has the relatively highest viscosity and density and it always tends to settle down to the bottom of reactor. The solubility of glycerol in fatty phase at the T range of K was measured to be ca. 0.8 wt. % 1.1 wt. % which increases slightly with the rises in EtOH amount and in temperature for reaction completions above 90% (see Chapter 3). Since the equilibrium equation for a heterogeneous equilibrium (reaction) does not include concentrations of pure liquids, for that reasons the removal of glycerol phase, according to Le Chatelîer principle, might help to the shift of reactions towards products side and to the completion of reactions. Furthermore, the law of mass action states that the speed of a chemical reaction is proportional to the quantity (or concentration) of the reacting substances. In other words, it basically says that the rate of a reaction depends only on the concentration of the pertinent species participating to the reaction. To put it simply, even though there is no complete conversion of acylglycerides the system can be further shifted to the products side by the removal of glycerol phase while keeping adequate concentration of EtOH in fatty phase through feeds in excess amount. The Impacts of Monophasic Reaction Media According to thermodynamic feasibility study of reaction systems in terms of chemical equilibria, it is of concern to point out that the system would favor lower biodiesel (EtOl) yield if the formed glycerol by-product and fatty phase were completely miscible with each other. In that respect, it was verified that, even though it might be accepted as a practical approach in conventional homogeneous catalysis widely used in industrial biodiesel production, the assumption of homogeneous or monophasic reaction media assumptions are not appropriate in case of heterogeneous catalysis (biocatalysis). The simulations based on such assumption produce higher FFA and lower FAEE yields owing to higher concentration (unrealistic) of dissolved free glycerol in fatty phases. Accordingly, though the amount of FFA might be corrected for the simultaneous solutions of transesterification, hydrolysis, and esterification reactions, simulations involving the physical split of liquid phases, i.e., liquid-liquid phase equilibria, and chemical equilibria together should be performed in order to find better modeling of biocatalytic ethanolysis processes. It was calculated that the K liq. a value of Reaction 5 is significantly low (see Table 4-11 in Section 5) for pseudo-empirical K-value method which confirms that this reaction will not be spontaneous in the written direction. Additionally, it was evidenced that catalysis of ethanolysis reactions by means of TL HC biocatalyst can be further shifted to the product (FAEE) side for completion and, thus, in case of aq. EtOH this kind of lipase should be rather preferred from processing point of view. Since the reaction mechanism and enzyme activity, water activity and inhibition patterns of lipase enzymes due to products and/or reactants (EtOH in particular) have a higher order of complexity, it is required to perform specific analyses with subsequent optimizations of systems in terms of reaction kinetics for the preferred biocatalysts reactant(s) reaction conditions combinations. It is also vital to state that there is no single or particular straightforward cause and effect relation in case of enzymatic reactions, thus each reaction system confirming certain collective expectances still requires its own detailed study. Meanwhile, the equilibrium constant ( K fatty x' ) values of transesterification and hydrolysis reactions calculated by means of forward and reverse rate constants of corresponding reaction steps were also presented in Table 4-14 (see Section 8). IV-9
205 ANALYSIS OF CHEMICAL EQUILIBRIA Simultaneous Simulations of Physical and Chemical Equilibria The general problem of chemical reaction equilibria is complicated when multiple phases and nonideality of solutions needed to be considered. The presence of equilibrated two-liquid phases (LLE) or practically the heterogeneous two-phase liquid medium (or emulsion) under continuous orbital shaking (mixing) has a significant influence on the position of chemical equilibrium, i.e. on the equilibrium constants and, thus, on equilibrium compositions. It was observed that although it increases the fatty phase solubility of glycerol produced during the reaction, the excess amount of EtOH feed favors further formation of biodiesel (EtOl). It was observed that a 4:1 ratio of EtOH to oil is enough for an equilibrium (complete) conversion for the simultaneous simulation (solution) of phase and chemical equilibria. On the other hand, the composition of physically equilibrated reaction media (LLE) has been calculated as a rather low concentration of glycerol in fatty phase even for an EtOH to oil ratio of 8:1 (0.35 wt. %). Therefore, complete conversion for 4:1 ratio is thermodynamically attainable but not realistic. Finally, a thermodynamic analysis of the system without considering the formation of two phases at the equilibrium position results in prediction of equilibrium yields that are lower than experimental obtained ones. Hence, the simultaneous calculation of phase and chemical equilibrium gives more realistic representations of the system. Quantum Chemical COSMO-RS Method in Reaction Equilibria Predictions COSMO-RS method can be used to estimate reaction barriers and kinetic constants of reversible reactions (equilibrium constants) (see Supplementary Data (Part 2) in Appendix 4-3). The kinetic constant of a reaction can be estimated using Arrhenius-type equation where the Gibbs free energy (GfE) of reaction corresponds to reaction barrier height. The total GfE and enthalpies of reacting species were calculated for an ideal gas phase using gas phase energies computed by means of parameter set (BP-TZVP) based on the density functional theory ( E QC i ). The enthalpies of reacting species were modified by their respective heats of vaporization in order to bring them to liquid state. The reaction energies and equilibrium constants of transesterification reactions were calculated at 308 and 318 K for stoichiometric and 30% molar excess feeds of dry EtOH as the acyl acceptors and triolein as the oil feedstock. Besides the same properties was calculated for the hydrolysis reaction steps through stoichiometric feeds of water and triolein. It was found that Reaction 1-1 has positive reaction energies in all four compositions of reaction media and thus its equilibrium constant was significantly low. As mentioned below (see Section 1.2) that the equilibrium constant (the apparent biphasic constant) calculated at the overall composition of the two-phase reactive media depends not only on temperature but also on the composition of reaction media and on the relative amount of the two liquid phases. Consequently, the limiting step in transesterification reactions seems to be Reaction 1-1 according to the predictions by means of COSMO-RS method. It was predicted that Reaction 2-1 has the lowest reaction energies and thus the highest apparent biphasic equilibrium constant values. Analogous results were obtained in case of hydrolysis reaction (see Table S-12) where Reaction 1-2 has positive reaction energies and thus the smallest equilibrium constant value. Therefore, it is plausible to consider that the first reaction steps in transesterification and hydrolysis reactions are not spontaneous. In overall, the assessments performed through the predictions obtained by means of COSMO-RS method for homogeneous reaction media assumption are not realistic and require the consideration of phase split phenomena. IV-10
206 ANALYSIS OF CHEMICAL EQUILIBRIA 1. Introduction 1.1. Motivation Accordingly, a chemical equilibrium constant substantially exceeding unity ( ) The analysis of reactive systems in terms of thermodynamics can provide significant and useful information on the extent and/or yield associated with a reaction. Beside of the thermodynamic analysis of reactive systems, it can be stated that chemical thermodynamics in equilibrium reactions has the auxiliary purpose of predicting the equilibrium compositions of a reaction system from the thermophysical properties of its components. As a matter of fact, it is possible to state that all reactions at least theoretically are reversible. In other words, if appropriate conditions exist, a product or a set of products synthesized from reactants (or from a set of reactants) may have a tendency to decompose to its reactants. However, it is generally a good approximation to assume that a reaction to be irreversible when o standard state Gibbs free energy (GfE) of reaction is much smaller than zero, G rxn 0. The description of a reaction as irreversible simply means that the equilibrium constant is so large that forward reaction rate is significantly higher than the rate of backward reaction. K 1 indicates that practically complete conversion might be possible and that the reaction can be considered to be irreversible. In contrast, Ka 1 indicates that reaction will not proceed to any appreciable extent. The calculation of the chemical equilibrium state can allow one to make conclusions about the limits of reactor performance that would be achievable if this state were reached. Although the Ka value is unaffected by pressure or inert(s), the equilibrium composition of the ingredients and equilibrium conversion of reactants can be influenced by these variables. As it can be easily perceived, the highest attainable conversion in reversible reactions is the equilibrium composition which may take an infinite period of time to be achieved. On the other hand, it is important to note that real systems do not necessarily achieve this level of conversion; therefore the conversions calculated from thermodynamics are only suggested attainable values. In other words, equilibrium concentrations are a set of fake or artificial values for most intents and purposes. They almost always represent an upper limit on the expected concentration at the temperature in question. Moreover, from the standpoint of obtaining sufficient products of economic value, a final state of equilibrium is almost always undesirable. Other chemical reactions, kinetic effects, and temperature variations in the system may render these calculations valueless. Nonetheless, equilibrium calculations serve a useful purpose since they do provide a reasonable estimate of the attained equilibrium concentrations. It is also worth emphasizing that the reaction kinetics not the equilibrium constant predicts the rates of reactions and which reactions will go rapidly or slowly towards equilibrium (see also Part 2 of Appendix 4-1). a IV-11
207 ANALYSIS OF CHEMICAL EQUILIBRIA Even though, to the best of our knowledge, there are no detailed studies reported on chemical and/or phase (physical) equilibria of transesterification and hydrolysis reactions or on their combined forms, a few studies focused on esterification reactions could be mentioned. Though its scope is beyond of this study, it is of concern to mention the study of Janssen and coworkers reported on the chemical equilibrium analysis of non-dilute biphasic systems for ethyl tert-butyl ether reaction. 2 They applied the UNIFAC activity coefficient model to describe the non-ideality of the mixture, and performed a rigorous approach by means of a priori known equilibrium constants so as to predict the equilibrium conversions. Even if this method can be applied to systems with non-constant distribution coefficients, it requires the value of chemical equilibrium constant to be known. On the other hand, the chemical equilibrium of the esterification of oleic acid (OlAc) in a solvent-free system have been reported by Sandoval et al. where they have calculated the activity coefficients of substrates and products at the overall concentration of the reactive mixture by ignoring the co-existence of two liquid phases. 3 They have, indeed, reported that, depending on the initial EtOH/OlAc molar ratios and the final equilibrium conversions, the existence of two liquid phases at the end of the reaction could be predicted by means of UNIFAC model. Moreover, Bucalá and coworkers 1 have reported solvent-free enzymatic esterification reaction for EtOl production. They have mentioned that the presence of one or two liquid phases is subject to the initial amount of water and to the extent of the reaction. In addition, they have also stated that the equilibrium condition requires simultaneous fulfillment of physical and chemical equilibria. It has been reported that the chemical equilibrium constant of enzymatic reactions taking place in two-phase systems varies not only with temperature but also with substrate concentrations. 1,4,5 Such equilibrium constants are calculated from overall experimental concentrations. Bucalá et al. have mentioned that such approaches are limited to ideal systems with constant distribution coefficients. 1 However, they can be effectively used in order to evaluate equilibrium shifts in biphasic systems. The variations of the experimental equilibrium constant values have been represented by considering chemical equilibrium in terms of the so-called apparent biphasic equilibrium constant. 1 Martinek et al. 5 have first introduced the concept of the apparent biphasic equilibrium constant and the same method was later applied by Antczak and coworkers 4. It is defined in terms of the overall concentrations of the two-phase system, which makes this equilibrium constant to depend not only on temperature, as expected, but also on the initial amount of reactants and products and, on the relative amount of the two liquid phases. It is worth mentioning that the model reported by Martinek and coworkers is only appropriate for dilute two-phase systems, with constant distribution coefficients. IV-12
208 ANALYSIS OF CHEMICAL EQUILIBRIA 1.2. Objectives and Assumptions In this chapter it was primarily aimed at studying the chemical equilibria in transesterification, hydrolysis and esterification reactions taking place during biodiesel (FAEE) production by means of enzymatic catalysis. Although the main reaction is transesterification of oil/fat using an acyl acceptor (MeOH or EtOH), it is inevitable to deal also with hydrolysis and esterification reactions when rectified (aqueous) EtOH and/or waste/used oils are employed as the substrates. Moreover, esterification reaction is also compulsory when low-grade oils containing significant amounts of free fatty acids (FFA) and water are used. It is in essence commonly known that in heterogeneous media (equilibria) in which reactants and products are present in more than one phase; reactive systems can definitely go to completion. In contrast, the homogeneous equilibria are those in which all reactants and products are in a single phase; reactive systems do not go to completion even under the possible optimum conditions. On the other hand, it was evidenced both experimentally and through predictive methods (cf. Chapter 3) that in transesterification reactions employing relatively neat vegetable oils and absolute EtOH as the acyl acceptor, systems tend to split into two liquid phases after 30% to 40% of reaction completion, depending on the other conditions. Such conversion levels are far below the attainable chemical equilibria compositions. The by-product glycerol is practically immiscible with the fatty species (mainly oil and FAEE species) where a maximum solubility of ca. 1% has been measured for reaction completions above 80% at the T range of K. However, the concentration of dissolved glycerol in fatty phase(s) changes primarily with the EtOH feed which obviously needs to be optimized for particular reaction systems. For instance, the molar excess EtOH feeds up to 30% is expected not to considerably affect the solubility of glycerol; whereas those of higher than 50% has been reported to influence both glycerol solubility and the activity of immobilized biocatalysts. The reaction systems involved in biodiesel production are virtually heterogeneous where equilibrated alcohol (water) rich and fatty rich phases exist together after some certain levels of conversion. As a result, the second purpose of this study was the assessment of thermodynamic feasibility and limits of reversible transesterification, hydrolysis and esterification reactions performances from 1:2 oil to EtOH molar feed ratio up to 30% of excess EtOH feeds through assuming single phase or homogeneous liquid reaction media. In other words, the additional aim was determining the thermodynamic limits of all three reactions in terms of reaction (chemical) equilibria analysis in homogenous media by changing the feed ratios and reaction temperatures. The non-ideality of reactive mixtures has been modeled using UNIFAC-LLE group contribution based activity coefficient model variant. It is of concern to note that system s non-ideality and thus LLE phenomena become significantly complex in case of waste/used oil feedstocks and/or aq. EtOH as the acyl acceptor. IV-13
209 ANALYSIS OF CHEMICAL EQUILIBRIA Since reaction and product specifications can be applied to impose constraints on chemical equilibria analysis, the reactions were first studied through Gibbs free energy (GfE) minimization of the reaction systems ( G rxn, i min. ) through both constrained and unconstrained minimization approaches. Besides, analyses via pseudo-empirical correlative chemical equilibrium constant models and quantum chemical COSMO-RS method were accordingly performed. The experimental investigations of chemical equilibria employing both absolute and aqueous EtOH and neat vegetable oil substrates by means of two different types of immobilized biocatalysts were also subsequently accomplished with the intentions of identifying the thermodynamic boundary lines of reaction sets and evaluating thermodynamic performances of reactive systems. In addition, simultaneous phase and chemical equilibria studies simulated through correlative thermodynamic model and subsequently verified by means of experimental measurements were also assessed. On the other hand, it is worth emphasizing that the accuracy of calculated equilibrium states depends critically on the data sources used. Hence, accurately measured thermophysical properties of reactive components need to be used, where available. However, neither a few of available data points reported on fatty species nor the thermophysical data of other species involved in reactions have internal consistency. They, instead, demonstrate considerable differences depending on the data sources used. Therefore, it is obvious to consider a compromise that represent internal consistency of data points among the thermophysical properties employed throughout of simulations. In that aspect several group contribution (GC) methods appropriate for estimating the pertinent thermophysical properties of fatty species were also evaluated. In order to simulate chemical reaction equilibria, it is inevitable considering some appropriate assumptions. The major assumption made was homogeneous (or single phase) liquid phase reactive media, as mentioned above. Moreover, a few more assumptions were as follows: well-mixed reactive mixture; equal reaction rates for consecutive reactions, and fast reaction rates which requires perfect catalysis. Another important assumption was that a solution to the equilibrium problems exists and it is unique (cf. Chapter 3 and 6 of the monograph written by Smith and Missen 6 for further information). It is obvious that the equilibrium constants calculated throughout of this study represent the apparent biphasic constant. Hereafter the apparent biphasic equilibrium constant will be called simply as chemical equilibrium constant, liq. K a. In overall, the thermophysical properties of reactive species, reaction energies, and ultimately the apparent biphasic equilibrium constants of transesterification, hydrolysis and esterification reactions including the intermediate reaction steps were calculated. The spontaneity of each reaction was subsequently evaluated by means of two determined thermophysical data sets at applicable T values. IV-14
210 ANALYSIS OF CHEMICAL EQUILIBRIA 1.3. Reaction Schema In case of enzymatic catalysis where aqueous EtOH (in general, 95.63% EtOH and 4.37% H 2 O by weight) is used as the acyl acceptor, transesterification and hydrolysis reactions take place simultaneously (in parallel) producing biodiesel (EtOl) and FFA (OlAc) as the respective target products and glycerol as the common by-product from the oil feed. Both the hydrolysis and transesterification reactions take place in series passing sequentially through corresponding intermediate reaction steps and producing corresponding EtOl and OlAc species at each step. Besides, the esterification of FFA to FAEE (EtOl) as a third parallel reaction (Reaction 5) also takes place with H 2 O as the by-product which may cause further formation of FFA by hydrolysis reaction sequence. In overall, there are 7 reactions, with three reaction sets, taking place simultaneously where the first two main reactions (parallel) each comprising (a set of) three reactions in series. Transesterification reaction steps are presented through Reaction 1-1 to Reaction 3-1 given below: Reaction 1-1: Reaction 2-1: Reaction 3-1: TAG + EtOH DAG + EtOH MAG + EtOH EtOl + DAG EtOl + MAG EtOl + Glycerol Similarly, hydrolysis reaction sequence follows the steps of Reaction 1-2 to Reaction 3-2: Reaction 1-2: Reaction 2-2: Reaction 3-2: TAG + H2O DAG + H2O MAG + H2O Oleic Acid + DAG Oleic Acid + MAG Oleic Acid + Glycerol IV-15
211 ANALYSIS OF CHEMICAL EQUILIBRIA Both the transesterification and hydrolysis reactions can be coupled as in Reaction 4-1 and 4-2, respectively. Reaction 4-1: Reaction 4-2: TAG + 3EtOH TAG + 3H2O 3EtOl + Glycerol 3Oleic Acid + Glycerol In addition, the esterification reaction can be presented as in Reaction 5: Reaction 5: Oleic Acid + EtOH EtOl + H O 2 As stated above transesterification and hydrolysis reactions proceeding simultaneously each have 3 consecutive reactions passing through step Reaction 1-1 to 3-1 or Reaction 1-2 to 3-2. In this schema, Reaction x-1, for instance, stands for the x th reaction step of transesterification where TAG, DAG and MAG pertain to triacylglyceride (triolein), diacylglycerides (diolein), and monoacylglycerides (monoolein) species, respectively. Consequently, by excluding the very beginning of transesterification and hydrolysis reactions it is likely to state that all 7 reactions form a set of multiple reactions taking place simultaneously and assuming that the system has already reached to an overall non-trivial steady state. IV-16
212 ANALYSIS OF CHEMICAL EQUILIBRIA 1.4. Determination of Independent Reaction Sets In order to perform the calculations of equilibrium compositions, it is preferable to express multiple simultaneous reactions in algebraic forms as given below: TAG EtOH + EtOl + DAG 0 DAG EtOH + EtOl + MAG 0 MAG EtOH + EtOl + Gly. 0 TAG H O + OlAc + DAG = 2 DAG H O + OlAc + MAG MAG H O + OlAc + Gly. 0 OlAc EtOH + EtOl + H O 0 This multiple reaction system can be expressed as a set of simultaneous linear equations using vector-matrix notation. For instance, the transesterification reactions can be expressed in matrix form as follows: TAG DAG MAG 0 = EtOl Gly. ν ij : stoichiometric coefficient matrix EtOH (1) Since the rank of the stoichiometric coefficient matrix of reactions is 3, the number of linearly independent reactions is also equal to three. Obviously, the stoichiometric coefficient matrix of the hydrolysis reaction scheme (Reaction 1-2 to 3-2) also has a rank of 3 and they form three independent reactions. On the other hand, the rank of overall reactions stoichiometric coefficient matrix as given by expression (2) is equal to 4, which means that only four of the reactions can be expressed as linearly independent. TAG DAG MAG EtOl = 0 OlAc Gly EtOH HO 2 ν ij : stoichiometric coefficient matrix (2) IV-17
213 ANALYSIS OF CHEMICAL EQUILIBRIA 2. Thermophysical Properties of Reacting Species 2.1. Formation Energies The standard Gibbs free energy (GfE) of a reaction can be expressed as in Eq.(3) where 0, liq. G f stands for the GfE of formation at liquid state. Analogously, the standard enthalpy of a reaction can be expressed by Eq. (4) where formation at standard conditions. n 0, liq. 0,. rxn o i f o i= 1 0, liq. H f pertains to the liquid state enthalpy of liq G ( T ) = ν G ( T ) (3) n 0, liq. 0,. rxn o i f o i= 1 liq H ( T ) = ν H ( T ) (4) Since all reactions in consideration take place in a homogeneous or single liquid phase at the temperature range of 308 K to 333 K, thermophysical properties of reacting species needs to be given for condensed (liquid) phase at standard state (P 0 = 1 bar and T o = K) or an arbitrarily chosen reference temperature but at standard P. On the other hand, available literature data and estimation methods for the formation energies are usually available at standard conditions only for ideal gas state. Moreover, it is of concern that there is a significant lack of experimental data accessible for fatty species either in ideal gas or liquid states. Hereafter, fatty stands for chemical species family pertaining to oils (such as triolein) or oil based derivatives, such as free fatty acids (FFA like oleic acid OlAc), fatty acid alkyl esters (FAEE) like ethyl oleate (EtOl), di- and mono-acylglycerides. The enthalpy of formation of a component at standard conditions (in liquid state) is related to that in the gas state by the following relation (Eq. (5)): ( ) ( ) ( ) H T = H T H T (5) o, liq. o, gas o f o f o vap. o Accordingly, the liquid state GfE of formation of a chemical species can be obtained from the gas state (ideal) formation energies by Eq. (6). The integration term is taken from normal boiling point temperature (T b ) to standard temperature (T o ). G ( T ) G ( T ) H ( T) = + dt (6) o, liq. o, gas T 1 o o f o f o vap. 2 RTo RTo R T Tb o Here, the enthalpy of vaporization as a function of temperature, H ( ). T, can be expressed as a polynomial in temperature of the form given by Eq. (7): vap IV-18
214 ANALYSIS OF CHEMICAL EQUILIBRIA o ( ) Hvap. T = a + bt + ct + dt + et (7) To the best of our knowledge, there is a lack of even predictive data for the formation energies of fatty species in consideration; however, there can be found some exceptions either predictive or experimental (see Table 4-1 and Table 4-4 for some examples). For instance, liquid state formation enthalpy of triolein has been calculated by NIST 7 using the enthalpy of combustion reported by Freedman and Bagby 8 as kj/mol; while DIPPR 801 database 9 have reported the same property s value as kj/mol. Moreover, Bucalá et al. 1 have reported (ideal gas) formation GfE of EtOl as kj/mol using Gibbs free reaction energy of esterification (Reaction 5) and corresponding ideal gas state Gibbs free formation energies of reacting species. However, it is possible to calculate the standard liquid state Gibbs free formation energy of EtOl using the corresponding liquid state formation energies given in Table 4-4 and Gibbs free reaction energy reported by Bucalá et al. 1 for Reaction 5 ( kj/mol). The calculated value ( kj/mol) was found considerably different than that of reported in Table 4-4 ( kj/mol; see also Table 4-1 for comparisons). This latter value was calculated through Eq.(6) using predicted value by MG GC method for ideal gas state ( kj/mol). DIPPR 801 database 9 reports a value of kj/mol for the same thermophysical property of EtOl. Likewise, the predictions reported by Osmont et al. 10 for the ideal gas state enthalpies of formation for EtOl and OlAc by means of quantum chemical calculations should also be considered as another excep-, tion. They reported o gas of oleic acid as kj/mol and that of EtOl species as kj/mol. H f Table 4-1 presents standard GfE and enthalpies of formation both at ideal gas and liquid states of reacting species. The ideal gas standard GfE and enthalpy of formation was predicted through group contribution (GC) methods of both CG (Constantinou and Gani, ) and MG (Marrero and Gani, ) using two-level (1 st and 2 nd order) group contributions. The assigned functional groups of chemical species and their respective contribution numbers for group contribution methods were tabulated in Appendix 4-1 (see Table A4-1 and A4-2). The formation energies at liquid state were calculated using Eq.(5) for enthalpies and through Eq. (6) for the Gibbs free energies. Obviously, the enthalpy of formation necessitates the vaporization enthalpy value of species at standard conditions and standard GfE requires a corresponding polynomial form of the enthalpy of vaporization for each chemical species integrated from corresponding normal boiling points (T b ) to T o using the Clausius- Clapeyron equation (with the change of vapor compressibility factor equal to unity; Z v = 1 ). IV-19
215 ANALYSIS OF CHEMICAL EQUILIBRIA Meanwhile, some standard state liquid formation enthalpies of fatty species can be obtained from literature. However, despite to the fact that there is a scarcity of such experimental values, it was observed that there are significant differences among reported values. For instance, of OlAc has been reported as kj/mol by Rogers et al. 13 ; - o, liq. H f kj/mol in Lange s handbook of chemistry 14, and as kj/mol by DIPPR 801 database. 9,. Analogously, two different data points for o liq of EtOl were reported by NIST. 7 The first calculated value by means of measured heats of combustion was kj/mol and kj/mol was the second where the same value was also reported in CRC Handbook. 15 Besides, DIPPR 801 database has reported kj/mol for the same thermophysical property. Since the latter sources/handbooks are relatively recent, their data points should be chosen for OlAc and EtOl species enthalpies of formation at liquid state. Consequently, it is also noteworthy to underline that in order to have internal consistency among the data points, liquid Gibbs free formation energies calculated by means of predictive methods for ideal gas state values and data points obtained from different sources for liquid formation enthalpies should be used for tri-, di-, and mono-olein species. For instance, instead of using reported liquid formation enthalpy of triolein 7, data point (predicted) taken from DIPPR 801 database was preferred. Although the values reported by the same database for di- and mono-olein were predictive with relatively high uncertainties, they were found in significant agreement with the MG GC predictions. The predicted and experimental thermophysical properties were presented in Table 4-1 and ultimate values (as the final decision made) used with pseudo-empirical K-value method was presented in Table 4-4 (see also Table A4-7 as the alternative decision table of thermophysical properties given in Appendix 4-3 for comparisons). It is reported by Silbert and coworkers 16 that 1(3)-isomeric form of monoacylglycerides (MAG) in the reversible isomerization reaction of 2-MAG 1(3)-MAG are predominant in MAG species due to acyl migration. 17,18 The same phenomenon is also valid for DAG species. Thus, all the property estimations of partial glycerides were performed for a mixture of 90% of 1(3)- and 10% of 2-isomeric forms of MAG; while for a mixture of 80% 1,3- and 20% 1,2- isomeric forms in case of DAG species based on the same reasoning (see Table A4-2 in Appendix 4-1 for 2 nd order functional group assignments). The calculations were done through the use of Kay s rule for mixture property calculation based on the simple molar average of the properties. 19 Alternatively, the formation energies at new reference conditions can also be calculated. Further details of this part were mentioned in Appendix 4-2. H f IV-20
 for ΔG f o,liq. and through Eq. (5) for ΔH f o,liq.. (Experimental values in bold+italic are mostly obtained from mentioned data handbooks and software; ICAS v.9.")
216 ANALYSIS OF CHEMICAL EQUILIBRIA Table 4-1 Standard Gibbs free energy and enthalpy of formation estimated through group contribution methods and corresponding formation energies in liquid state calculated through Eq. (6) for ΔG f o,liq. and through Eq. (5) for ΔH f o,liq.. (Experimental values in bold+italic are mostly obtained from mentioned data handbooks and software; ICAS v.9.0 is registered process simulation software produced by CAPEC - Denmark Technical University, Copenhagen/DK.; CHEMCAD v.6.4 is registered process simulation software of Chemstations, Inc., TX/USA; PRO/II v.9.0 is registered process simulation software of Invensys Systems, Inc., TX/USA). Abbreviations: MG Marrero and Gani; CG Constantinou and Gani; GC Group Contribution [The Eq. (18) and (19) refer to the corresponding updated Eq. (5) and (6)] IV-21
217 ANALYSIS OF CHEMICAL EQUILIBRIA 2.2. Vaporization Enthalpies The vaporization enthalpies of chemical species as a function of temperature were regressed into polynomial-form equations (DIPPR 100 type; see Eq. (7)). The heats of vaporization of species were illustrated in Fig. 4-1 for fatty compounds and in Fig. 4-2 for glycerol, ethanol, and water species. As is seen from Fig. 4-1, fitted data points that are obtained from CHEMCAD v. 6.4 software database for diolein species shows an enthalpy of vaporization even higher than that of triolein species (obtained from PRO/II v. 9.0 software database). As it can be expected triolein, however, should have relatively higher enthalpies of vaporization at the same T values. In contrast, the heat of vaporization for monoolein species has approximately the same values particularly at very high T values, though the difference seems to be significant at low temperatures (ca. 12 kj/mol). Besides, OlAc species has factually the same enthalpy of vaporization values for both of the data sources, as it can be seen from the same figure. It is also noteworthy that the vaporization enthalpy change in absolute value from T b to T o was not higher than 0.40 kj.mol -1.K -1 as the highest for triolein. Consequently, in order to keep consistency among data points and to decrease the relative errors attributable to different data sources, the heat of vaporization equations regressed from PRO/II v.9.0 were chosen throughout of this study. Figure 4-1 The enthalpy of vaporization for fatty compounds. (Data points produced via respective process simulation software were regressed into polynomial functions (DIPPR 100 type) with a MAD% less than 0.32% for each species) Although there is no appropriate estimative method for the enthalpy of vaporization as a function of temperature, except that of Watson relation, 20 it is only possible to estimate it at standard (T 0 ) and normal boiling temperatures under atmospheric pressure. There are several methods mentioned in the literature for both T values. Further information can be obtained from Poling et al. (cf. Chapter 7). 20 In that aspect, 3 different predictive GC methods, namely MG, CG, KRG (Kolská et al., ) were used in this study for predicting the enthalpy of vaporization at standard conditions. For estimations at T b, two additional GC methods -JR method (Joback and Reid, ) and Wilson method (from ProPred module IV-22
218 ANALYSIS OF CHEMICAL EQUILIBRIA (v.3.6) of ICAS v.9.0 process simulation software and utilizing T b estimated by MG GC method- were also applied beside of the same predictive methods used for standard tempera- o ture (T o ). In order to predict H ( ). T, Vetere's relation was used as a complement of MG, CG and Wilson GC methods. vap b Figure 4-2 The enthalpy of vaporization for glycerol, ethanol, and water components. (Data points produced via PRO/II v process simulation software were regressed into polynomial functions (DIPPR 100 type) with a MAD% less than 0.2% for each species) The enthalpies of vaporization at standard conditions and at normal boiling temperatures were presented in Table 4-2 for the mentioned GC methods. Although it was not possible to o estimate T b by Wilson method, it remarkably estimated the H ( ). T of OlAc species as kj/mol using the closest T b estimation which was calculated by MG GC method as K (reported experimental T b in CRC handbook 15 is K and also in above mentioned software databases). This was the closest value to the experimental one (67.40 kj/mol reported in CRC handbook 15 ; see Table 4-2 for comparisons). Evidently, normal boiling point, T b, has a significant importance in the calculation of standard GfE at liquid state as expressed by Eq. (6). Though it is always preferable to employ experimental normal boiling point data, it is not generally feasible to obtain such physical property values of fatty species due to their tendency to decompose at higher temperatures under atmospheric conditions. For instance, Myint and El-Halwagi 23 reported that FAME species are susceptible to thermal decomposition above 523 K. As is seen from Table 4-3, the highest boiling point estimations were performed by means of quantum chemical COSMO-RS method. This was followed by KRG GC method as the second. It is important to underline that such high data points are not realistic, particularly those of predicted by COSMO-RS method. Moreover, there was a significant inconsistency among data points taken from process simulation software which bring further ambiguity on having an optimal decision. It can be observed that while comparing experimental data points measured at vacuum conditions with predicted ones at P 0 (= 1 bar), it is likely to deduce that fatty species should vap b IV-23
219 ANALYSIS OF CHEMICAL EQUILIBRIA have hypothetical normal boiling points higher than the predicted ones. For instance, EtOl at 70 mm Hg (~0.09 bar) 24 which has a saturation temperature (T b ) of K may have an extrapolated average T b of K. Though, in order to have consistency among the corresponding data points and thus among calculated thermophysical properties, it is preferable to decide on a single data source for the normal boiling point temperatures. It is also expected that this approach might decrease the relative uncertainty attributable to different data sources Isobaric Specific Heat Capacities at Liquid State It is obvious that the impact of pressure on fatty species at liquid state is negligible, but not that of the temperature. The standard GfE of reaction at a temperature different than T o can be obtained through the integrated form of the van t Hoff Equation given by Eq. (8). G ( T) G ( T ) 1 H ( T) = dt (8) o, liq. o, liq. T o, liq. rxn rxn o 2 RT RTo R T To where the standard enthalpy change of reaction as a function of T is obtained from the Kirchoff equation (Eq. (9)): T o, liq. o, liq. o, liq. rxn rxn 0 P T0 H ( T) = H ( T ) + c ( T) dt n o, liq. o, liq. P ν i Pi, i= 1 c ( T) c ( T); i= 1,, n (9) It is also noteworthy that the term 0, liq H. ( T) represents the standard liquid state enthalpy rxn change of reaction, i.e., enthalpy change between products and reactants at liquid statewhen they are unmixed under standard conditions (P 0 = 1 bar, but T K). It is not the enthalpy change when the reactants and products are present in an equilibrium mixture. The liquid state enthalpy change for the reaction, liq. H rxn, can be equal to 0, liq. H rxn only if en- H thalpy is independent of pressure, = mix. 0, and the enthalpy change of mixing, ΔH is P T equal to zero which is not valid for mixture of reacting species and products involved. In Eq. (9) given above c o, liq. Pi, refers to the molar liquid heat capacities of chemical species at constant P. Analogous to heat of vaporization, this property can be expressed as a polynomial in temperature of the form given by Eq. (11): c ( T) = a + bt + ct + dt (10) o, liq. 2 3 P IV-24
220 ANALYSIS OF CHEMICAL EQUILIBRIA Table 4-2 The enthalpy of vaporization estimated through several estimative group contribution methods at T 0 = K (left hand side) and at normal boiling points estimated through corresponding predictive methods (right hand side) accompanied by experimental values for glycerol, ethanol, and water. (See the text for Eq. (18)) Abbreviations: MG Marrero and Gani; CG Constantinou and Gani; KRG Kolska, Ruzicka, and Gani; JR: Joback and Reid; GC Group Contribution; IG Ideal Gas. [Eq (18) refers to the updated Eq. (5)] IV-25
221 ANALYSIS OF CHEMICAL EQUILIBRIA Table 4-3 Comparisons of normal boiling temperatures estimated through several GC methods; predicted by COSMO-RS quantum chemical method, and obtained from process simulation software databases. (Owing to decomposition tendencies, all T b values, except those of taken from literature, should be considered as hypothetical) The boiling point estimation by KRG GC method 21 o was performed through the Eq. (10) where H ( ). T and entropy of vaporiza- o tion at T b ( S ( ). T ) were estimated using the same method. vap b vap b H Tb = S o vap. o vap. ( T ) b ( T ) b (11) IV-26
222 ANALYSIS OF CHEMICAL EQUILIBRIA The isobaric liquid specific heat capacities of fatty species with respect to temperature were illustrated in Fig Data points reproduced via CHEMCAD v.6.4 process simulation software were regressed into polynomials in temperature of the form given by Eq.(11) in order that the resulting o H ( ). T. 2 vap liq. K a remains in the algebraic form of Eq. (12), as it was also done for To the best of our knowledge, there is no reported experimental data measurements at different temperatures for fatty species involved with the exceptions of triolein reported by Morad and coworkers. 25 Therefore, isobaric liquid phase specific heat capacity as a function o, liq of temperature, c. ( T ) of fatty species were estimated using three-level non-hierarchical P form of GC method reported by Kolská and co-workers 26 for organic liquids. In order to have an idea on the prediction quality of this GC method, the data points from CHEMCAD v.6.4 database of the same species produced via regression into Eq. (11) type polynomial function were illustrated in Fig As is seen from this figure, experimental data points for triolein have an excellent agreement with the data points predicted by GC method. However, process simulator data deviates significantly from experimental data points. Interestingly, the curve of monoolein from CHEMCAD v.6.4 has a concavity and in contrast, the curve pertaining to GC prediction for the same species has a convex curve. In case of OlAc, there is a significant agreement between CHEMCAD v.6.4 data points and that of non-hierarchical GC method 26 for the T range involved (from 300 to 380 K). As a result, the polynomial models built using non-hierarchical GC method of Kolská et al. 26 were chosen in order to represent fatty species specific heat capacities. Figure 4-3 Isobaric liquid state specific heat capacity of 'fatty' species. (Experimental data points for triolein are reported in Morad et al., There is a significant agreement with non-hierarchical form of GC method by Kolska et al., ; Data points produced via CHEMCAD v.6.4 process simulation software were reregressed into polynomial functions (DIPPR 100 type; see Eq. (11) in the text) with a MAD% less than 0.25% for each species) o, liq Fig. 4-4 illustrates the c. P ( T ) of glycerol, ethanol, and water components reproduced using CHEMCAD v.6.4 database and then fitted into same type of polynomial functions. In order to ascertain the quality of data points created using process simulator database, some IV-27
223 ANALYSIS OF CHEMICAL EQUILIBRIA c o, liq. P data points of glycerol were reproduced and illustrated in Fig. 4-4 using the linear equation fitted to experimental data reported by Righetti et al. 27 within the corresponding T range. As it can be seen, the agreement with the process simulator s data points is significant. Consequently, the polynomials regressed using CHEMCAD v.6.4 was chosen in order to represent specific heat capacities of glycerol, ethanol, and water species. Figure 4-4 Isobaric liquid state specific heat capacity of glycerol, ethanol, and water compounds. (Data points re-produced using CHEMCAD v.6.4 process simulation software database were regressed into DIPPR 100 type polynomials; Experimental data points for glycerol were re-produced using the linear equation reported by Righetti et al., and were regressed into polynomial functions with a MAD% less than 0.10%.) 3. Pseudo-empirical Correlative K-value Method In the pseudo-empirical method, computation of reaction equilibrium was performed through correlative models as expressed by Eq. (12). The chemical equilibrium constant expressions pertaining to specific reaction steps were solved using the equilibrium temperature approach expressed by Eq. (22) for Tequilibrium given in Part 3 of Appendix 4-1. liq. a 2 A T B C lnt DT ET K = e (12) The calculation procedure of Eq. (12) was demonstrated in Fig. 4-5 below. The thermodynamic chemical equilibrium constant (the apparent biphasic equilibrium constant), related to the isobaric liquid phase specific heat capacity, reaction and vaporization enthalpies, and the stoichiometry of the related reactions, as illustrated. Since some of the thermophysical properties are experimental but some are not, the method appropriately should be called as pseudo-empirical method. The mole fraction based equilibrium constant K x was calculated through reaction components mole fractions in chemically equilibrated reactive mixture as expressed by Eq. (13) given in Part 2 of Appendix 4-1. In addition, the activity coefficient based K γ was calculated liq. Ka is IV-28
224 ANALYSIS OF CHEMICAL EQUILIBRIA using the same equation through UNIFAC-LLE model as expressed by the form of Eq. (25) given in Part 4 of Appendix 4-1 for the activity coefficients γ i of reactive species. It is obvious that reaction systems involved in biodiesel production require either simultaneous or sequential solution of linear equation sets. Therefore, the equilibrium conversion is determined by solving for composition of the products using related equation sets. Analogous to GfE minimizations, the reaction systems were assumed as and well-mixed or homogeneous liquid phases. Thermophysical properties and their estimations/calculations which were discussed above (see Section 2) are the vital part of this method. As stated above, there are no distinctive experimental data points or the most appropriate universal way(s) of estimation for all the properties in consideration. In addition, it was observed that the convergence of the reaction systems and calculation results are strictly reliant to the thermophysical property values. The magnitudes of K-values may increase thousand-fold(s) for some property data sets and thus affect the decisions made (e.g., the spontaneity of the related reactions). Therefore, it is more desirable to find some or a particular and most-likely optimum data set(s) in order to achieve the most feasible or more realistic K-value expressions. For alcohols (glycerol and EtOH), water, and OlAc species, to some extent, the available literature data were preferred. In case of fatty species, however, the choice of appropriate set of each thermophysical property was done through pseudo-quantitative comparisons of the related predictions with the experimental data points where available. For instance, the heat of vaporization predictions at T o and T b were compared with that of PRO/II v.9.0 database together with the related normal boiling data points comparisons. As a result, the data points obtained from PRO/II v.9.0 database were decided as the most appropriate T b values using this pseudo-quantitative approach and by keeping the internal consistency of data points in mind as a priori requirement. Thus, it was expected to have the most appropriate data set with internal consistency. On the other hand, the specific isobaric liquid heat capacity values were predicted through the GC method of Kolská et al., as discussed above. Since, in that case the best fit of experimental data for triolein was a promising result for property estimations of other fatty species. In brief, based on several trials and pseudo-quantitative comparisons, the ultimate sets of thermophysical properties were determined. Table 4-4 presents the thermophysical data employed for reacting species with the intention of calculating the chemical equilibrium expressions and then to simulate equilibrium conversions. IV-29
225 ANALYSIS OF CHEMICAL EQUILIBRIA n o, liq. o, liq. P ν i Pi, i= 1 Isobaric liquid state specific heat capacity c ( T) = a + bt + ct + dt o, liq. 2 3 P Liquid state enthalpy of reaction T o, liq. o, liq. o, liq. rxn rxn 0 P T0 H ( T) = H ( T ) + c ( T) dt c ( T) c ( T) i= 1,, n number of reaction components Integrated form of liquid state enthalpy of reaction b c d H ( T) = I + at + T + T + T o, liq rxn 1 n x= ν x x= a,, d i= 1 i i Relation of enthalpy and Gibbs free energies of reaction in liquid state o, liq. o, liq. T o, liq. rxn rxn 0 1 rxn = 2 RT RT0 R T T0 G ( T) G ( T ) H ( T) dt Integrated form of liquid state Gibbs free energy of reaction o, liq. Grxn ( T) I a b c d = + RT RT R 2R 6R 12R I2 ln T T T T Expression for chemical equilibrium constant K liq. a = e o, liq Grxn. ( T) RT General expression for the T dependence of chemical equilibrium constant I a b c d lnk = I + lnt+ T+ T + T RT R 2R 6R 12R liq a 2 Figure 4-5 Calculation procedure for pseudo-empirical chemical equilibrium constant method. (see Section 2 for further details of symbols and notations) IV-30
 and the next")
226 ANALYSIS OF CHEMICAL EQUILIBRIA Table 4-4 Final decision on energy values and boiling point temperatures of chemical species to be used for pseudo-empirical K-value method. In this method two different approaches were considered for the simulations of equilibrium conversions: In the first approach, pairs of reactions were solved simultaneously (in parallel) and the next pair of reaction was coupled as another simultaneous reaction set entering at the outlet temperature of the former pair and proceeded at that temperature. That is to say, three pairs of reaction were considered in series and were solved sequentially, i.e., Reaction x-1 and x-2 pairs (x = 1, 2 or 3) were solved simultaneously and in overall Reaction 1-y, 2-y, and 3-y (y = 1 or 2: transesterification or hydrolysis, respectively) were solved sequentially. In the second approach, each pair of reactions was considered as independent simultaneous reaction sets where the feeds enter to the reactor at 298 K as the fresh feeds. Thus, as presented in Section A4-3-2 of Appendix 4-3, the pair of Reaction 1-1 and 1-2 was solved simultaneously and then Reaction 2-1 and 2-2 pair was solved in a similar manner followed by the subsequent reaction pair. In these two methods, Reaction 5 was considered as a special case due to convergence problems and extremely low value of its equilibrium constant (see Part 1 and 3 of Appendix 4-3) A convergence tolerance of 10-3 was applied in this method for equilibrium calculations as expressed by Eq. (13) below: 1 j R liq ( K K ) aj, γ, jkxj, 2. 3 max ξ = 10 (13) IV-31
227 ANALYSIS OF CHEMICAL EQUILIBRIA 4. Chemical Equilibria Simulations through Minimization Methods 4.1. Constrained (Non-stoichiometric) Minimization In this minimization method, it is important to underline that the equilibrium composition results are completely hypothetical. Since, it may or may not be possible to achieve this composition depending on the reaction kinetics and enzyme activity. It is also noticeable that multiple minima may be found when multiple fluid phases coexist in the mixture. 28 The equilibrium temperature approach given by Eq. (22) with a ΔT of 1 K was applied all through this minimization method (see Part 4 of Appendix 4-1). In all cases (Simulation A to Simulation D), the inlet temperatures of the two feed-streams were 298 K. Three molar equivalent amounts of aqueous EtOH (0.67, 1.00, and 1.30) were fed into a continuous stirred tank reactor (CSTR) connected by oil (triolein) feed line. The representative process flow-sheet diagram is given in Fig. 4-6 below. Figure 4-6 Representative process flow-sheet diagram of CSTR reactor operated in equilibrium reactions Simulation A: Reaction System Including All Species The equilibrium compositions after the expected global minimization of Gibbs free energy (GfE) subjected to the conservation of elements and non-negativity of mole number constraints were presented in Table 4-5. As is seen from the table, there was a significant outlet flow-rate of oleic acid (2.043 kmol/h at 308 K) decreasing with temperature. However, despite to the depletions of EtOH and triolein feeds, there was no EtOl produced at 308 K. In contrast, the flow rate of water increased ca fold of its feed flow-rate (4.37 wt. % of EtOH feed) and diolein leaving the reactor was 60.89% of the triolein fed. There observed significant increases in diolein and EtOl amounts leaving the reactor with temperature. Consequently, the highest hypothetical equilibrium conversion of EtOl can be obtained at higher temperatures with 0.67 molar equivalent of aq. EtOH feed, i.e., at 328 K 72.23% of theoretically possible conversion can be obtained; while 71.53% was obtained with 1.30 equivalent at the same T. However, water amount reached to ca fold of its feed flow-rate. IV-32
228 ANALYSIS OF CHEMICAL EQUILIBRIA In case of 1.0 molar equivalent of aq. EtOH feed, diolein leaving the reactor at 308 K was 41.34% of the triolein fed and at 328 K it reached to 76.80%. On the other hand, for 1.3 equivalent of aq. EtOH flow rate, diolein leaving the reactor at 308 K was 23.74% of the triolein fed and at 328 K it was 65.70% of the triolein fed. Again, the hypothetical amount of EtOl leaving the reactor at 328 K was 72.23% of theoretical conversion with 0.67 molar equivalent of aq. EtOH and it was 71.53% with 1.3 equivalent of aq. EtOH, if only transesterification reactions are considered (Reaction 1-1 to 3-1, but not Reaction 5). However, the flow-rate of water leaving the reactor will reach to ca fold of its feed flow-rate for 0.67 equivalent of aq. EtOH and to 5.95-fold in case of 1.3 equivalent of aq. EtOH at 328 K. There was interestingly no glycerol or monoolein formed for all cases. Briefly, the thermodynamics of reaction system through non-stoichiometric GfE minimization for a reactive mixture including all species indicated that a CSTR reactor should operate at 328 K. The reactions should proceed with 0.67 molar equivalent of aq. EtOH for the highest hypothetical equilibrium conversions of EtOl. The synthesis of biodiesel (EtOl) is favored at lower flow-rates of EtOH, but at higher temperatures Simulation B: Reaction System for Absolute EtOH (Water as an inert species) As is shown in Table 4-6, the pattern was resembling to Simulation A to a certain extent, especially in terms of diolein and EtOl formation pattern. In this case, however, the system favors glycerol formation as the 50% of its theoretically possible conversion with 0.67 molar equivalent at 308 K where there still remained 2.61% of the EtOH feed. The conversion for glycerol was 58.67% for 0.67 molar equivalent aq. EtOH where water is considered as inert. Glycerol amount increased to ca. 57% and 58% of its theoretically possible conversions with 1.0 and 1.3 molar equivalents at the same T (308 K), respectively. It was also conceivable to get some traces of monoolein with the increase in temperature. Even though there was no water to initiate the hydrolysis of triolein and diolein (through Reaction 1-2 to 3-2), the system favors the hypothetical formation of oleic acid (OlAc) at low temperatures. The amount of OlAc produced at 308 K was fold of the expected theoretical conversion, if the water in 0.67 molar equivalent aq. EtOH feed was not kept inert. This was obviously unrealistic though, it tends to decrease to 0.15-fold of the theoretical amount at 328 K. In all cases the triolein fed was totally consumed. But, higher temperatures favor the formation of diolein where in all three cases (Case 1 to Case 3) almost equivalent molar amount of diolein was produced per feed of triolein at 328 K. The maximum amount of EtOl produced was 55.63% of its theoretically possible conversion with the 0.67 equivalent of EtOH and it was not changed for higher molar equivalents even at 328 K. IV-33
229 ANALYSIS OF CHEMICAL EQUILIBRIA Simulation C: Reaction System for Oleic Acid as an inert species Although there is no oleic acid in the system (assigned as an inert substance), there was a considerable output flow-rate of water with a tendency of increase in all cases (from Case 1 to Case 3), as presented in Table 4-7. For instance, 4.02-fold of inlet flow-rate was observed in Case 1. Besides, there was no triolein and EtOH feeds remained in the output and diolein amounts leaving the reactor decreased with the increase in molar equivalents of aq. EtOH. The outlet mixture composition in all three cases was the same for all T values which proves that OlAc is a critical component of the reaction system and in its absence the system behaves as temperature independent for the range in concern. The amount of EtOl produced was ca. 73% of its theoretically possible conversion with 0.67 molar aq. EtOH feed and decreased to 61% and then increased back to 72.16% in cases of 1.0 and 1.30 molar equivalent feeds, respectively. Analogous to Simulation A, there was no glycerol and monoolein species formed in the equilibrium compositions of the outlet flows. As a result, Simulation C revealed that reaction system equally favors the formation of EtOl at lower or at higher flow-rates of aq. EtOH, but it is temperature independent for the range studied Simulation D: Reaction System for Absolute EtOH (Water + Oleic acid as inert substances) In this case, as expected, the system equilibrates at an output flow rates of 1 kmol/h for EtOl and diolein. As is seen in Table 4-8, the equilibrium composition tends to change slightly toward more EtOl and monoolein formation (in trace amounts) with higher EtOH equivalents and at higher temperatures. There are no further conversions of diolein species into monoolein and glycerol subsequently. In other words, the system converges to the theoretically possible conversion levels from triolein to diolein and the system becomes equilibrated. The intermediate step of transesterification reactions converting diolein to monoolein seems to be the limiting step in terms of non-stoichiometric approach for GfE minimization by means of single liquid phase reaction media assumption. In that aspect, since there is no significant difference in theoretical conversions at higher temperatures, it is more feasible to operate the reactor at lower T values and lower EtOH flow rates in order to protect the enzymes from inhibition. IV-34


230 ANALYSIS OF CHEMICAL EQUILIBRIA Table 4-5 Constrained minimization of Gibbs free energy for a non-stoichiometric reaction system including all 7 chemical species with 0.67, 1.00, and 1.30 molar equivalents of aq. EtOH. Table 4-6 Constrained minimization of Gibbs free energy for a non-stoichiometric reaction system including 6 chemical species for 0.67, 1.00, and 1.30 molar equivalents of aq. EtOH where water was inert. IV-35


231 ANALYSIS OF CHEMICAL EQUILIBRIA Table 4-7 Constrained minimization of Gibbs free energy for a non-stoichiometric reaction system including 6 chemical species where oleic acid is assigned as an inert species for 0.67, 1.00, and 1.30 molar equivalents of aq. EtOH. Table 4-8 Constrained minimization of Gibbs free energy for a non-stoichiometric reaction system including 5 chemical species (water and OlAc as the inert species) for 0.67, 1.00, and 1.30 molar equivalents of aq. EtOH. IV-36
232 ANALYSIS OF CHEMICAL EQUILIBRIA 4.2. Unconstrained (Stoichiometric) Minimization As explained in Part 4 of Appendix 4-1, the conservation of element constraints are eliminated in this way of minimization and, thus, the problem becomes -in a manner- an easier minimization task. In this GfE minimization method, two approaches were considered: The equilibrium temperature approach given by Eq. (22) with a ΔT of 1 K and the fraction of conversion approach for the base component which can be expressed by Eq. (20) (see Part 3 of Appendix 4-1). Three mole fractions were considered for the latter approach: 0.80, 0.90, and For instance, when the system reached to chemical equilibrium 0.80 mole fraction of triolein is expected to be converted into diolein through Reaction 1-1 then to its successors through corresponding transesterification steps and the remained fraction is expected to be converted through hydrolysis. Fraction of conversion is not the equilibrium mixture composition, but just an expectation based on a priori knowledge of the reacting system. Analogous to constrained minimization cases three molar equivalent amounts of aqueous EtOH (0.67, 1.00, and 1.30) were fed into the CSTR reactor which are subjected to the state variable (T or P) and conversion conditions. Due to the difficulty of solving 3 parallel reactions where 2 of them (Reaction x-1 and Reaction x-2) have 3 reactions in series (Reaction 1-1 to 3-1 and Reaction 1-2 to 3-2), it was not possible to have an appropriate convergence despite to all efforts done. Alternatively, the problem can be formulated as 3 simultaneous reactions, such as Reaction 1-1, Reaction 1-2 and Reaction 5, etc. However, it was not again conceivable to minimize the objective function because of convergence problems with linear equation set. Instead, it was ultimately decided to exclude Reaction 5 and proceed with a reaction system solution in 3 steps consisting of 2 simultaneous reactions per step, such as Reaction 1-1 and Reaction 1-2 simultaneously and then simultaneous reaction of Reaction 2-1 and Reaction2-2 as the subsequent set Simulation through the Equilibrium Temperature Approach The highest percentage of theoretically possible conversion (97.80%) for EtOl (Reaction 1-1) was obtained at 318 K in case of 1.30 molar aq. EtOH (Case 3) where only 4.71% of oleic acid produced simultaneously through Reaction 1-2. As presented in Table 4-9 (A), there was a tendency of increase in EtOl amount with the temperature. For instance, in Case 1 the amount of OlAc produced at 308 K was 97.88% of its theoretical amount at the aq. EtOH feed of 0.67 molar equivalent and decreased to 16.65% at 318 K. In all cases, triolein feeds were completely converted into diolein at all T values. In the succeeding reaction system (Reaction 2-1 and 2-2) where a fresh feeds of 1.0 and 1.30 molar equivalents (with respect to diolein feed) of EtOH were fed into the reactor at 298 K, as shown in Table 4-9 (B). In this case, a maximum theoretical EtOl production of 8.78 % was achieved at 328 K. There was no OlAc formation observed at either 318 or 328 K and it was not possible to get convergence IV-37
233 ANALYSIS OF CHEMICAL EQUILIBRIA for the system at 308 K. The trace amounts of monoolein production proved that this step is the limiting step in a thermodynamic aspect through stoichiometric and discrete Gibbs free energy minimization of sequential reactions (this point will be further discussed later). For simultaneous set of Reaction 3-1 and 3-2, the highest percentages of theoretically possible conversions were achieved at 308 K with Case 2 (1.30 molar equivalent of aq. EtOH with respect to monoolein). The percentage of EtOl was 56.75% and that of glycerol was 77.96% where OlAc was also reached to 93.04% of its theoretically possible conversion level. However, as is seen in Table 4-9 (C), when the temperature increased to 318 K the amount of EtOl and glycerol decreased abruptly to 14.71% and 14.88%, respectively; whereas that of OlAc decreased to 0.72% of its theoretically possible conversion. Although the former reaction set did not converge at 308 K, the expected global minimization of unconstrained linear equations that represent simultaneous solution of reaction sets showed that it is more thermodynamically feasible to operate reactions at higher aq. EtOH feeds, but at low T with the obligation of a subsequent esterification step (Reaction 1-1 to Reaction Reaction 5), in order to reduce FFA composition in the final biodiesel product. Analogous to the relaxation method mentioned by Gmehling et al. 29, it might be considered that the reversible reaction scheme can use the output composition of the former simultaneous reversible reaction set as the feed at the same output temperature and proceed to the Gibbs free energy minimization of the next two simultaneous reactions (reactors are in series). In the subsequent cases, the base components were diolein and then monoolein. However, the expected convergence could not be achieved due to some technical drawbacks, despite to all efforts performed. On the other hand, reaction equilibria simulation for each pairs of reactions (i.e., Reaction x- 1 and x-2) using the fraction of conversion approach were mentioned in Part 1 of Appendix 4-3. IV-38
 minimization of")


234 ANALYSIS OF CHEMICAL EQUILIBRIA Table 4-9 Unconstrained (stoichiometric) minimization of Gibbs free energy for the stoichiometric reaction systems for 0.67, 1.00, and 1.30 molar equivalent of EtOH feeds. (A: Reaction 1-1 and 1-2; B: Reaction 1-2 and 2-2; C: Reaction 3-1 and 3-2) A B C IV-39
235 ANALYSIS OF CHEMICAL EQUILIBRIA 5. Chemical Equilibria Analysis by means of pseudo-empirical K-Value Method 5.1. Pseudo-empirical Chemical Equilibrium Constant (K-value) Models of Reactions As is given by Eq. (12) (see Section 3), the pseudo-empirical correlative chemical equilibrium models are polynomial functions of temperature (as the single variable). The coefficients of K-model terms were calculated using the procedure demonstrated in Fig. 4-5 for each particular reaction step. The coefficient values of 5 terms were presented in Table 4-10 for each particular reaction step. It is obvious that K-values of Reaction 4-1 and 4-2 can be calculated through the multiplication of the respective K-values of transesterification (Reaction 1-1 to 3-1) and hydrolysis reactions (Reaction 1-2 to 3-2) at the corresponding T values. The values of coefficients for the same parameters calculated for the thermophysical property data table determined alternatively (see Table A4-7 in Appendix 4-3) were presented in Table A4-8 in Appendix Reaction Energies Gibbs free Energies and Chemical Equilibrium Constants of Reactions o, liq The Gibbs free energy (GfE) of a reaction, G. rxn ( T), is the change in standard liquid state GfE for the reaction between unmixed species in their standard states at temperature T and pressure P (= 1 bar) to form unmixed products in their standard states at the same T and P. o, liq. G T is not the Gibbs free Analogous to the statements given above (see Section 2), ( ) energy change when the reactants and products are present in an equilibrium mixture. The o, liq. G T can be equal to that in an equilibrium liquid state GfE change for the reaction, ( ) mixture only if the GfE change of mixing, a moderate P range of a few bars. rxn rxn G = mix. G, is independent of pressure ( 0 P T When Table A4-4 (given in Appendix 4-2) and Table 4-11 are compared for different reference o, liq. G T, temperatures, it can be observed that the lower (or the negative) the value of ( ) the larger is the equilibrium constant for the corresponding reaction scheme. According to o, liq. Eq. (11) given in Part 2 of Appendix 4-1 and Eq. (3), it can be generalized that for < 0, then K liq. a rxn G rxn ) for > 1, the process would be spontaneous in the direction written if all the species o, liq. were mixed under respective standard conditions. On the other hand, when > 0, then K a < 1, meaning that the reaction will proceed from products to reactants, i.e., the process is not spontaneous in the direction written. This makes sense because large equilibrium constants are associated with product-favored reactions. If the K-values of hydrolysis and transesterification reaction sets given in Table 4-11 are compared, it can be perceived that hydrolysis reaction steps have exceptionally high K- G rxn IV-40
236 ANALYSIS OF CHEMICAL EQUILIBRIA values with respect to their counterparts in the transesterification reaction set. Such high equilibrium constants reveal that hydrolysis reactions will proceed spontaneously in the directions written. Meanwhile, as mentioned and discussed above (see Section 2), the K- values and corresponding energies of schema containing monoolein in the reactive mixture should be considered with caution. Since its melting point is around K, depending on the data source, monoolein remains in solid form (state) at all given reference temperatures. However, the liquid state GfE change of reaction and corresponding chemical equilibrium o, liq. G T is expressed as a constant (K-value) relations are rather complex in cases where ( ) function of temperature than calculating through Eq. (3) by means of the standard Gibbs free formation energies presented in Table 4-4. In the former case the specific heat capacities and the enthalpies of vaporization both fitted into polynomials (Eq. (7) type) were em- o, liq. G T was calculated ployed and the formation energies were taken from Table 4-4. ( ) through the corresponding steps (formula) demonstrated in Fig. 4-5 and were presented in Table 4-11 for each particular reaction steps. As is seen from the table, all the reaction energies except those of Reaction 5 are negative and their absolute values increased with temperature. On the contrary, the corresponding o, liq. G T at higher tempera- K-values decreased despite to more negative values of their rxn ( ),. tures. K-values of Reaction 5 increased thanks to the slight increase in the G o liq ( T) higher T values. Even though the K-value changes with respect to T of Reaction 2-1 and 3-1 can be considered as negligible, the fastest decrease in equilibrium constant with the increase in T was observed for Reaction 1-1 of transesterification reaction set. In hydrolysis reactions the impact of higher T on the equilibrium constants was rather significant with the highest value in Reaction 1-2 case. In Fig. 4-7 the change of the logarithmic K-value versus temperature was depicted for each particular reaction. As it can be seen the lnk liq. a values of transesterification and hydrolysis reactions did not change significantly; while these of Reaction 1-1 and 1-2 changed inversely with T. The change in lnk liq. a value of esterification reaction (Reaction 5) showed the opposite behavior than the others. In overall, all the equilibrium constants can be considered as the weak functions of T with slight changes at higher T values. As expected Reaction 4-1 and 4-2 are relatively strong functions of temperature owing to the multiplicative effect of corresponding reaction steps. In summary, there observed a slight increase in the absolute val- o, liq. G T for each particular reaction scheme which evidenced that the change in ues of ( ) rxn Gibbs free energies of reactions are not strong functions of T for the given ranges. rxn rxn rxn at IV-41
 of transesterification and")
 and overall (Reaction 4-1 and 4-2) reactions at standard conditions and at three possible")
237 ANALYSIS OF CHEMICAL EQUILIBRIA Table 4-10 Parameter coefficient values of pseudo-empirical K value models given by Eq. (12). (Temperature values are in Kelvin; Models for overall reactions - Reaction 4-1 and 4-2- are linear combinations (Hess law) of transesterification and hydrolysis reaction sets, respectively) Table 4-11 Reaction energies and chemical equilibrium constants of transesterification (Reaction 1-1 to 3-1), hydrolysis (Reaction 1-2 to 3-2, esterification (Reaction 5) and overall (Reaction 4-1 and 4-2) reactions at standard conditions and at three possible reaction temperatures. IV-42
238 ANALYSIS OF CHEMICAL EQUILIBRIA Figure 4-7 The change in the (logarithm of) equilibrium constants, lnk liq. a, with temperature for the reaction schema used. Reaction 3-1 and 3-2 show abrupt decrease with the increase in T. o, liq. It is important to emphasize that > 0, as in case of Reaction 5, does not ultimately G rxn mean that the reaction will not proceed in the direction written (from reactants to products) if the species are mixed under all conditions. Indeed, the K-values of this reaction are significantly low and diverge from zero with T which should be considered that the reaction might be spontaneous in the written direction at higher T. However, this requires further o specified study. Indeed, it is known that many industrial processes have values which are positive. 30 o The G rxn will govern, according to its sign, how the reaction moves from there (i.e., when the reaction quotient, Q a = 1) towards equilibrium. In other words, as obviously shown by Eq. (15) when Q > K G > 0 which means that the reaction proceeds a a rxn in the reverse direction; in contrary, when Qa < Ka Grxn < 0, it means that the reaction proceeds as written. As expressed by Eq. (14), Q a is the value of the equilibrium expression using the non-equilibrium activity values (the pseudo-apparent reaction equilibrium constant). G rxn G = G + RTlnQ (14) liq. o, liq. liq. rxn rxn a Q a Grxn = RT ln Ka (15) o The more negative G rxn, the more likelihood there is that the reaction will occur of its own accord. However, reactions may be too slow in the absence of a catalyst despite having a o, liq. G T value does not significantly change for large negative free energy change. Since ( ) rxn liquid phase reactions at constant atmospheric P, the spontaneity of a reaction depends on the sign of as formerly expressed by Eq. (10) of Part 2 of Appendix 4-1 (see also Eq. (14) liq. G rxn for comparison where lnk liq. a value was replaced by lnq liq. a representing the logarithm of re- IV-43
239 ANALYSIS OF CHEMICAL EQUILIBRIA action quotient). As a result, the sign of,. and not that of G o liq ( T) liq. G rxn rxn determines the ultimate direction of reaction spontaneity. It is also worth noting that no reaction is mathematically impossible. Since, for an impossible reaction, either the value of Ka should be equal to zero or o G rxn should be infinite. On the other hand, it should be pointed out that in case where G rxn < 0, the reaction may not occur at a detectable rate. For instance, the standard state given below is -237 kj/mol: o G rxn value of the reaction 1 H 2 ( g) + O 2( g) H2O ( l) 2 o G ( T ) kj rxn o = 237 mole of H O (l) formed 2 Evidently, water at the given conditions is much more stable than a mixture of H 2 ( g) and O 2 ( g ). However, the equilibrium constant of the reaction at K and 1 bar is ca which suggests that a stoichiometric mixture of H 2 ( g) and O 2 ( g) at room temperature should react to formh 2 O ( l ), and the reaction should go to completion. However, the rate of this reaction is so slow that it practically does not occur. But when a spark or a right catalyst is used, the reaction goes to completion rather quickly (explosively). Consequently, when thermodynamics says that a certain reaction will not occur spontaneously, then it will not occur; whereas when thermodynamics says the inverse (yes, it will occur spontaneously), it does not mean that it will necessarily occur at a detectable rate Enthalpies of Reactions,. Analogously, reaction enthalpies, H o liq ( T) rxn were calculated through the corresponding procedure demonstrated in Fig. 4-5 and were presented in Table 4-11 for each particular reaction. As can be seen, all the reaction steps have negative reaction enthalpies with the exception of Reaction 5. It is obvious that Reaction 5 requires energy input in order to surpass the reaction energy barrier and proceed in the written direction. On the other hand, as presented in Table A4-4 given in Appendix 4-2, the standard reaction enthalpies of transesterification reaction steps at the reference T of 293 and 303 K are both positive. Though, in these reference temperatures both Reaction 1-1 and Reaction 3-1 have negative Gibbs free reaction energies. Furthermore, in contrast to T o as the usual reference temperature, the GfE of Reaction 2-1 have positive values at both reference temperatures. In contrast, reaction energies of hydrolysis reaction set have negative values at both of the new reference T values. IV-44
240 ANALYSIS OF CHEMICAL EQUILIBRIA The reaction enthalpy of Reaction 1-1 at 313 K was calculated as kj per mole of EtOl (l) produced. It should be recognized that this value of reaction enthalpy stands for an unmixed condition where 1 mole of triolein and 1 mole of EtOH react to produce 1 mole of EtOl and 1 mole of diolein. In addition, the enthalpies of Reaction 2-1 and 3-1 were calculated as kj and kj per mole of EtOl (l), respectively. In overall, the enthalpy of Reaction 4-1 was calculated as kj per mole of EtOl (l). Recently, Sotoft and co-workers 31 reported the isothermal microcalorimetric measurement of reaction enthalpy at the same T as - 9.3±0.7 kj/mol for transesterification of rapeseed oil via EtOH as the acyl acceptor. Despite to mostly estimative calculations and single phase consideration there observed a significant agreement with the reported value. Sotoft et al. also reported two estimated values without mentioning the temperature and whether it is based on ideal gas or liquid state formation enthalpies of reacting species. The reported values for the same reaction were and -3.1 kj/mol using Benson s GC method and data from Aspen Plus process simulation software database, respectively. Since, both of these methods give formation enthalpies for ideal gas state, they should be considered as irrelevant. Likewise, the reaction enthalpy of Reaction 5 was calculated through K-value method as kj/mol (in average for 293 to 323 K range); whereas it was reported by Bucalá and coworkers 1 as kj/mol (in average). This considerably high value should be attributed to the fact that reactive mixture forms two equilibrated liquid phases throughout of the reaction course (water rich and fatty rich phases). Therefore, instead of assuming a single liquid phase it is indispensable to couple and compute physical and chemical equilibria simultaneously. It seems that partition of reacting species and hence the phase-split phenomena have significant impacts on chemical equilibrium. In conclusion, if the corresponding steps of transesterification and hydrolysis reactions are compared it can be easily seen that the latters are more exothermic than the former ones. This means that transesterification reactions require relatively higher heat duty in order to proceed in the written directions. The logarithm of equilibrium constant versus the reciprocal of T was also illustrated in Fig. A4-1, given in Appendix 4-1. In this figure, the gradients of each curve correspond to the negative of respective enthalpy of reaction divided by univer- o H rxn ( T). It can be concluded that, except those of Reaction 1-1, sal or ideal gas constant R, ( R ) Reaction 1-2 and Reaction 5 (and accordingly Reaction 4-1 and 4-2) all other reaction enthalpies are nearly constant for the T range of 300 to 380 K. Furthermore, as shown in Fig. 4-7 and mentioned above, transesterification reactions are in overall less exothermic than their counterparts in hydrolysis set. Therefore, as a practical approach, lower T values should be preferred in the transesterification reaction with aq. EtOH in order to produce higher amounts of EtOl. IV-45
241 ANALYSIS OF CHEMICAL EQUILIBRIA 5.3. Simulations of Chemical Equilibrium through pseudo-empirical K-value Models Simulation A: Transesterification Reactions using Absolute Ethanol Simultaneous solution of linear equation sets for the transesterification of triolein with absolute EtOH was simulated with the results presented in Table In this simulation, analogous to constrained and unconstrained minimization methods, a CSTR reactor fed by two stream lines was used (see Fig. 4-6). The convergence criteria expressed by Eq. (13) was employed and the mole fraction based equilibrium constants were expressed in terms of reaction extent of each particular reaction (see Eq. (5) given in Part 2 of Appendix 4-1). All calculations with this method were done using equilibrium temperature approach expressed by Eq. (22) given in Part 3 of Appendix 4-1. As is seen from Table 4-12, EtOl formation with 79.44% of its theoretically possible conversion was obtained for 0.67 molar equivalent of EtOH (Case 1) at 328 K as the highest. The case of 1.30 molar equivalent at the same T was the second highest percentage of EtOl (of the theoretically possible formation). It was observed that there is no significant difference in the unconverted tri-, di-, and mono-olein amounts; but with slight decreases with T in all cases. The amount of diolein remained was lower at higher EtOH feeds; whereas that of monoolein was the contrary. Hence, it is appropriate to deduce that stoichiometric or higher EtOH feed rates favor both the formation of EtOl and monoolein (Reaction 2-1) or more practically Reaction 3-1 seems to be the rate limiting step. Since the amount of diolein decreased successively, while that of monoolein was the opposite, it was possible to infer that increase in non-ideal behavior of the reaction system with EtOH feed rate has considerable impacts on the equilibrium compositions. Nonetheless, the 30% molar excess amount of EtOH feed yielded 5.65% (in average) higher biodiesel in all three T values than the stoichiometric feed. There observed some slight increases in EtOl amounts at all feed rates with the increase in T values. In overall, lower EtOH feeds gave better biodiesel yields than the excess or stoichiometric feeds. Temperature has slightly more considerable impact on Reaction 3-1 than Reaction 2-1. In this regard, higher T values and lower EtOH feed rates (than the stoichiometric amount) should be chosen in order to achieve higher biodiesel (EtOl) yields. IV-46
242 ANALYSIS OF CHEMICAL EQUILIBRIA Simulation B: Transesterification and Hydrolysis Reactions using Aqueous Ethanol - Consecutive Solution Since it was not possible solving corresponding seven reactions simultaneously, an appropriate but not very representative method was adopted. In this method instead of solving equation set of reactions simultaneously for feeds entering at the reference T of 298 K ( T o ), a method similar to the relaxation method mentioned in Section 4.2 was employed where the outlet T of former reaction pairs was used as the inlet T of the consecutive pair. As a result, three reaction pairs were solved successively where each pair involves simultaneous solution of a transesterification and a hydrolysis reaction steps. Though, in this case equation sets did not converge for stoichiometric and 0.67 molar equivalent EtOH feeds, but for 1.30 molar equivalent feed. Additionally, it is worth mentioning that the involvement of Reaction 5 as the third reaction in each T value and feed rates did not even provide the simultaneous solution of triple reaction sets. The results of sequentially solved 3 reaction pairs were presented in Table As is seen from this table, the results are quite similar in performance to those of Table In this case the highest EtOl formation was reached to 54.48% of its theoretically possible amount at 308 K for 1.30 molar equivalent of aq. EtOH feed. Almost all of the triolein fed was converted to diolein through the first reaction pairs which showed that this reaction step is not the rate-limiting step at 308 K. Besides, it was observed for the first reaction pair (Reaction 1-1 and 1-2) that 55% of triolein was converted to EtOl and the rest to OlAc which was reached to 99.25% of its theoretically possible amount. The final diolein and monoolein amounts at 308 K were computed as 14.34% and 61.34% of the triolein fed. As is seen from Table 4-13, the lowest theoretically possible EtOl formation was obtained at 318 K. Indeed, the percentages of EtOl at 318 and 328 K were similar and were calculated as around 30%. In contrast to 308 K case (28%), Reaction 2-1 and 2-2 pair produced only ~6.6% of the theoretically possible EtOl amount at 318 and 328 K. The performance of Reaction 3-1 and 3-2 were rather similar for all three T values. As a result, Reaction 1-1 and 1-2 pair should be considered as the rate limiting step at higher T values. OlAc amounts at 318 and 328 K were reached to 96.5% and 94% of their theoretically possible values, respectively. The highest glycerol formation was obtained at 328 K as 32% of the theoretically possible amount. In overall transesterification and hydrolysis reactions have different patterns at different T values. The thermodynamically optimal transesterification and hydrolysis reactions with 30% molar excess of aq. EtOH can be accomplished at 308 K, whereas hydrolysis reaction can also be performed equally well at 318 and 328 K values. Furthermore, since the amount of glycerol produced at 308 K was the lowest one, it was deduced that the backward reaction for Reaction 3-1 should be significant at that or lower T values. The output of Reaction 3-1 and 3-2 was fed into another serial reactor operating at the same T values in order to reduce the FFA content of the final biodiesel (EtOl) through esterification (Reaction 5). How- IV-47
243 ANALYSIS OF CHEMICAL EQUILIBRIA ever there was no conversion in all three cases for three reaction temperatures studied. Since, the K-values of esterification reaction were substantially low and the reactive mixtures fed were already chemically equilibrated. On the other hand, an analogous study by means of alternative data table (Table A4-7 given in Appendix 4-3) has also been achieved. Since the formation energies are considerably different, as are seen in Table 4-4 and A4-7, the equilibrium constant values and reaction energies calculated accordingly have shown considerable inconsistencies (see Table 4-11 and A4-9 for comparisons). Therefore, thermodynamic feasibility analyses based on these two tables have resulted with different conclusions. On the other hand, simulation results obtained by means of the parameter values presented in Table 4-10 and A4-8 for equilibrium composition calculations in monophasic reactive media were also resulted with considerably different compositions (see Section 5 and Appendix 4-3 for comparisons). Consequently, it was evidenced that thermophysical property values are crucial in determining the equilibrium constant values and hence the equilibrium compositions by means of pseudo-empirical K-value method. Further details of the evaluations made through alternative decision table can be found in Appendix 4-3. In conclusion, it was not possible to simulate all 7 reactions or 6 reactions proceeding simultaneously. There observed some technical and mathematical problems that hinder the convergence of the linear equation sets, such as inappropriate initial conditions, matrix singularity problem at some points, etc. It is well known that convergence problems can arise with Newton-Raphson method when one or more of the functions exhibit extrema. However, there are also several mathematical methods to overcome such mathematical bottlenecks as expressed by Michelsen and Møllerup 32 and Smith and Missen 6. Despite to successful efforts performed to overcome such mathematical problems, e.g. matrix singularities, reaction system converged neither for seven (hydrolysis, transesterification, and esterification reaction steps) nor for six simultaneous reactions (hydrolysis and transesterification reaction steps). Furthermore, it was not even possible to get convergence for reaction pairs consisting of three simultaneous reactions, e.g. Reaction 1-1, 1-2 and Reaction 5, through both of the chemical equilibrium approaches mentioned in Part 3 of Appendix 4-1 (see Eq. (20) and (22)). Alternatively, the reaction energies and chemical equilibrium constant calculations using quantum chemical COSMO-RS method were also performed. The details of this method accompanied by some theoretical explanations have been mentioned in Part 2 of Appendix 4-3. IV-48

244 ANALYSIS OF CHEMICAL EQUILIBRIA Table 4-12 Equilibrium compositions of transesterification reaction for the pseudo-empirical chemical equilibrium constant method using absolute EtOH as the acyl acceptor. The highest EtOl flow rates were given in bold + italic. IV-49
245 ANALYSIS OF CHEMICAL EQUILIBRIA Table 4-13 Equilibrium compositions of reaction system (transesterification + hydrolysis) solved simultaneously for reaction pairs with the pseudoempirical chemical equilibrium constant method using aqueous EtOH as the acyl acceptor. Final equilibrium compositions and water flow rates for all three T values are given in bold. The best OlAc, EtOl, and monoolein compositions are underlined. IV-50
246 ANALYSIS OF CHEMICAL EQUILIBRIA 6. Experimental Analysis of Chemical Equilibrium for Enzymatic Ethanolysis Reactions It was mentioned previously (see Part 1 of Appendix 4-1) that the spontaneity of a reaction can be determined by means of chemical thermodynamics. However thermodynamics does not say how fast a reaction can reach to chemical equilibrium or how the reactions proceed, i.e. reaction mechanisms. It is widely known that in a reversible reaction the relative values of the rate constants for the forward and reverse reactions determine the composition of the equilibrium mixture. Catalysts decrease the activation energy (E a ) barrier for the forward and reverse reactions by the same amount, thus increase the rate constants of forward (k f ) and reverse (k r ) reactions by the same factor. It helps a system to achieve its equilibrium faster, but does not alter the position of the equilibrium. In other words, a catalyst does not affect the equilibrium constant or the equilibrium concentrations of reactants and products in the equilibrium mixture. To be precise, it works by altering the mechanism of a reaction where the difference in energies of the reactants and products is independent of the reaction mechanism. Because the equilibrium constant K x (equilibrium constant in terms of concentrations) equals the ratio of k f to k r, the value of K x is unaffected by the addition of a catalyst which increases k (rate constants, kinetics), but does not alter K x (equilibrium). As explained in detail (see Chapter 2), the activation energy of the reaction for the enzymebound substrate is lower than for the free substrate molecule, often due to the fact that the interactions involved in binding shift the substrate geometry closer to that of the transition state for the reaction. In an attempt to analyze the chemical equilibria attained for ethanolysis reactions by means of immobilized biocatalysis, different experimental set-up(s) were prepared. Two different lipolytic enzymes in immobilized forms were used in this study. They were Thermomyces lanuginosus lipase (TLL) (formerly Humicola lanuginosus) and Candida antarctica lipase B (CALB) both of which are immobilized on the same type of hydrophobic microporous supports. The immobilized forms of these lipase enzymes are commercially called as TL HC and Novozym 435, respectively (further details were given in Chapter 2). Besides, two forms of EtOH as the acyl acceptor in different molar equivalent amounts were used: Absolute EtOH (with max v% water) and rectified EtOH (with ca wt. % water). High oleic sunflower oil (SFO-HO) with C18:1 (oleic acid) composition above 90% was used as the oil substrate and 5% (by the weight of oil feed) of immobilized enzymes was loaded as the catalyst. In all cases the acyl acceptor was added in single shots at the beginning of reactions and the reactive mixtures were shaken at 300 rpm in an orbital incubator shaker at corresponding T values. Each experiment was repeated twice and the average values of three measurements were taken. The reaction time where there was no more than 0.5% of difference between two consecutive measurements was assigned as the chemical equilibrium point (state) of reactive systems. IV-51
247 ANALYSIS OF CHEMICAL EQUILIBRIA 6.1. Ethanolysis with Absolute EtOH using Novozym 435 as the Biocatalyst Three molar equivalent amounts of absolute EtOH were used with Novozym 435 immobilized lipase enzyme at 308 and 318 K. The results of GC-FID measurements using MSTFA as the silylating agent (see Chapter 2 for further details) were given in Fig In case of 0.67 molar equivalent of EtOH at each T value the system has reached to almost its theoretically possible conversion (66.67%) of 65.08% and 63.49% after 6h of reaction time, respectively. However, it was simulated to be 51.16% and 51.44% at the same T values by means of pseudoempirical K-value model (see Section 5.3) through homogeneous or single liquid phase reactive media assumption, respectively. Although this amount of EtOH feed is completely miscible with SFO-HO at both T values, the assumption of homogeneous reaction media is no longer valid for the increased (formed) concentration (amount) of glycerol. Thus, the difference in experimental and simulated values at 0.67 molar equivalent feed should be considered as expectable. Moreover, the simulation of stoichiometric EtOH feed at the same T values was resulted with 60.20% and 60.94% of EtOl where it was experimentally measured to be 94.34% and 93.23% after 17 h of reaction, respectively. Equilibrium Compositions (% wt.) Triolein Diolein Monoolein EtOl 1.29 TAG 2.75 DAG MAG FAEE 0.10 Triolein Diolein Monoolein EtOl 2.28 TAG 2.63 DAG MAG FAEE Pseudo-empirical K- value Model Experimental Pseudo-empirical K- value Model K K Equivalent EtOH (n/n): 0.67 (6h) Equivalent EtOH (n/n): 1.00 (17h) Equivalent EtOH (n/n): 1.30 (26h) Experimental Figure 4-8 Chemical equilibrium compositions of transesterification reactions components for three molar equivalent amounts of absolute EtOH employing Novozym 435 immobilized lipase enzyme at 308 and 318 K Comparisons of pseudo-empirical K-value model and experimental results. (SFO-HO with C18:1 composition above 90% as the oil substrate and 5% (by the weight of oil) of immobilized enzymes load were employed.) IV-52
248 ANALYSIS OF CHEMICAL EQUILIBRIA Some Evaluations of Ethanolysis Reaction in terms of Chemical and Phase Equilibria According to thermodynamic feasibility study of reaction systems in terms of chemical equilibria, it is of concern to point out that the system would favor lower biodiesel (EtOl) yield if the formed glycerol by-product and fatty phase were completely miscible with each other. The increase in EtOl amount with temperature and with EtOH molar equivalent feeds observed during simulations were also verified experimentally with the exception of slight decreases with temperature. Such slight decreases might be assigned to the impact of higher concentration (solubility) of glycerol in fatty phase favoring the reverse reaction towards the formation of reactants. For instance, due to higher concentration of glycerol in fatty phase at 318 K, in case of 30% molar excess amount of EtOH feed, there observed ca. 1% of decrease in EtOl amount with respect to the stoichiometric EtOH after 26 h of reaction time. As a matter of fact, it was observed that the produced glycerol forms small droplets suspended in the mixture; while some of it adheres onto the catalyst beads during the reaction. In addition, besides of the interactive and electrostatic forces (polar apolar interactions) that results with its immiscibility with fatty species, glycerol has the relatively highest viscosity and density and it always tends to settle down to the bottom of reactor. Hence, it is likely to state that since glycerol molecules adhering on catalyst beads are larger than EtOH; their re-penetration into the catalytic pores could be more difficult. As a result, even the assumption of well-mixed or pseudo-homogeneous reaction media becomes completely inappropriate for incubator shakers for the shaking speeds up to 350 rpm. As explained in Chapter 3, the reactive mixture always tends to form two physically equilibrated liquid phases where upper phase is rich in fatty species, while the lower one in alcoholic (EtOH and glycerol) species. Consequently, glycerol phase should be considered as a pure alcohol phase separated from the bulk fatty phase. On the other hand, the solubility of glycerol in fatty phase at the T range of K was measured to be ca. 0.8 wt. % 1.1 wt. % which increases slightly with the increases in EtOH amount and in temperature for reaction completions above 90%. Furthermore, since the equilibrium equation for a heterogeneous equilibrium does not include concentrations of pure solids or liquids, for that reason the removal of glycerol phase, according to Le Chatelîer principle, might help to the shift of reactions towards products side and to the completion of reactions. liq. It can be seen in Table 4-11 (see Section 5.2) that Ka values of Reaction 1-1 to 3-1 are all greater than unity which indicate that the forward reactions tend toward completion. The farther the reaction proceeds toward completion, the larger is the value of K. In other words, since the forward reaction s activation energy is less than that of the reverse reaction (E a, fwd < E a, rev ), the latter will be slower than the former one when the concentrations of species at two sides of reactions are equal. That is to say, when k f is much larger than k r, liq. a IV-53

249 ANALYSIS OF CHEMICAL EQUILIBRIA K x is very large and the reaction virtually goes to completion. As mentioned above, since glycerol tends to separate from the fatty phase, the system shifts reactions towards products side. Meanwhile, the law of mass action states that the speed of a chemical reaction is proportional to the quantity (or concentration) of the reacting substances. It basically says that the rate of a reaction depends only on the concentration of the pertinent species participating to the reaction. To put it simply, even though there is no complete conversion of acylglycerides the system can be further shifted to the products side by the removal of glycerol phase while keeping adequate concentration of EtOH in fatty phase through feeds in excess amount Ethanolysis, Hydrolysis, and Esterification Reactions with Rectified EtOH using Novozym 435 and TL HC as the Biocatalysts. The reactions involved in case of aq. EtOH were illustrated in Fig The spontaneous directions of reactions according to pseudo-empirical K-model -except that of esterification (Reaction 5) - were drawn and the substrates and products were given for each step where those of esterification were underlined. Figure 4-9 Schematic illustration of transesterification (Reaction 1-1 to 3-1), hydrolysis (Reaction 1-2 to 3-2) and esterification (Reaction 5) reactions highlighting the reactants and products at each intermediate step. The directions drawn show the spontaneous reactions except that of esterification which shows the expected direction. The reactants and products in esterification reaction were underlined. Since silylation reagent (MSTFA) is moisture sensitive excess EtOH and water formed within the samples were removed using vacuum drying prior to analyses. As silylation reagents will derivatize nearly all active hydrogens, carboxylic acids, i.e. free fatty acids (FFA), can likewise be silylated (in a mixture of pyridine : hexane (1:1)) It is expected that silylated FFA species should be eluted within the FAEE species range or less likely within the MAG range during GC-FID analysis. Consequently, the FAEE yields demonstrated in Fig were given excluding the FFA amounts measured through titration method. IV-54
250 ANALYSIS OF CHEMICAL EQUILIBRIA Equilibrium Compositions (% wt.) Triolein Diolein Monoolein EtOl OlAc TAG DAG MAG FAEE FFA Triolein Diolein Monoolein EtOl OlAc TAG DAG MAG FAEE FFA Triolein Diolein Monoolein EtOl OlAc TAG DAG MAG FAEE FFA As is seen in Fig the average amount of FFA produced in three simulations was around 14% which is significantly higher than the measured ones. This might be attributable to esterification reaction (Reaction 5) consuming the produced FFA or because of the relatively high concentration of EtOH molecules dominating the transesterification reaction in case of experimental study. It might also be attributable to the water activity required in lipase catalyzed reactions (cf. Chapter 2). Nonetheless, this point unquestionably requires further and specified studies. In conclusion, it was found that Novozym 435 does not favor the for- Pseudoempirical K- value Model Experimental Pseudoempirical K- value Model Experimental Pseudoempirical K- value Model K K K Equivalent EtOH (n/n): 1.30 with TL HC after 27 h Equivalent EtOH (n/n): 1.30 with Novozym 435 after 23 h Experimental Figure 4-10 Chemical equilibrium compositions of transesterification reactions components for 1.30 molar equivalent amount of aqueous (rectified) EtOH employing Novozym 435 (values in red) and TL HC (values in blue) immobilized lipase enzymes at 308, 318, and 328 K Comparisons of pseudo-empirical K-value model and experimental results. (SFO-HO with C18:1 composition above 90% as the oil substrate and 5% (wrt to the weight of oil feed) of immobilized enzymes load were employed.) It was reported that Novozym 435 (CALB) catalyzes DAG to MAG and MAG to FAEE conversions faster; whereas TL HC (TLL) catalyzes conversion of TAG to DAG faster. 36,37 Moreover, it was also observed that Novozym 435 does not perform as effective as TL HC in terms of FAEE yield in case of aqueous EtOH. As shown in Fig the amount of FFA produced through Novozym 435 catalysis is almost twice as much that of TL HC at all T values for 1.30 molar equivalent of aq. EtOH feed. It was measured that the maximum yield that can be attained with Novozym 435 under these conditions cannot exceed 68.0% for EtOl and 3.9% for OlAc at 328 K after 23 h of reaction time. However, the same reaction set was simulated with the yields of 30.7% for EtOl and 13.7% for OlAc at the same T value. On the other hand, simulations with aq. EtOH as the acyl acceptor showed that the best temperature in terms of higher biodiesel (EtOl) yield among the 3 values studied should be the lowest one (308 K). This has also been proved experimentally with TL HC as the biocatalyst. IV-55
251 ANALYSIS OF CHEMICAL EQUILIBRIA mation of FAEE in case of aq. EtOH substrate and produces twice as much of FFA than TL HC. Moreover, lower T values favor the formation of FAEE than that of FFA. On the other hand, it was verified that, even though it might be accepted as a practical approach in conventional homogeneous catalysis widely used in industrial biodiesel production, the assumption of homogeneous or single liquid phase reaction media assumptions are not appropriate in case of heterogeneous catalysis (biocatalysis). The simulations based on such assumption produce higher FFA and lower FAEE yields owing to higher concentration (unrealistic) of dissolved free glycerol in fatty phases. Though the amount of FFA might be corrected for the simultaneous solutions of transesterification, hydrolysis, and esterification reactions, simulations involving the physical split of liquid phases, i.e., liquidliquid phase equilibria, and chemical equilibria together should be performed in order to find better modeling of biocatalytic ethanolysis processes. liq. It is also worth mentioning that the Ka value of Reaction 5 was found significantly low (see Table 4-11 in Section 5.2) for pseudo-empirical K-value method which confirms that this reaction will not be spontaneous in the written direction. Finally, it was evidenced that catalysis of ethanolysis reactions by means of TL HC biocatalyst can be further shifted to the product (FAEE) side for completion and, thus, in case of aq. EtOH this kind of lipase should be rather preferred from processing point of view. Since the reaction mechanism and enzyme activity, water activity and inhibition patterns of lipase enzymes due to products and/or reactants (EtOH in particular) have a higher order of complexity, it is required to perform specific analyses with subsequent optimizations of systems in terms of reaction kinetics for the preferred biocatalysts reactant(s) reaction conditions combinations. It is also vital to state as a final comment that there is no single or particular straightforward cause and effect relation in case of enzymatic transesterification reactions, thus each reaction system confirming certain collective expectances still requires its own detailed study. 7. Simultaneous Simulations of Physical (Phase) and Chemical Equilibria for the Ethanolysis Reaction with Absolute EtOH. The general problem of chemical reaction equilibria is complicated when multiple phases and non-ideality of solutions needed to be considered. As mentioned above the presence of equilibrated two-liquid phases (LLE), i.e. heterogeneous liquid medium under continuous orbital shaking (mixing) has a significant influence on the position of chemical equilibrium, i.e. on the equilibrium constants and thus equilibrium compositions. Since, reaction equilibrium has to simultaneously satisfy the physical equilibrium (iso-activity) criterion. It can therefore be expected that considerations of the physical equilibria of a reactive system containing practically immiscible species together with the attained chemical equilibria provide a better representation of the reactive system. IV-56
252 ANALYSIS OF CHEMICAL EQUILIBRIA Although the basis is very analogous, thermodynamic modeling of reactive multiphase systems is more challenging tasks compared to the modeling of chemical equilibria in monophasic systems. As it was previously explained in Part 4 of Appendix 4-1 for monophasic systems that the method for solving chemical and phase equilibria simultaneously can be, in an analogous way, categorized as: constrained (non-stoichiometric ) and unconstrained (stoichiometric) GfE minimization approaches. Meanwhile, it is obvious that a stoichiometric (unconstrained) approach will only satisfy the necessary condition for equilibrium, but does not guarantee that the actual equilibrium solution is found. 38 On the other hand, according to Sanderson and Chien 39 the constrained approach is especially applicable for system with multiple and complex reactions. It is also worth noting that Smejkal et al. applied the stoichiometric approach for analysis of chemical equilibrium in total hydrogenation of vegetable oil. 40 Furthermore, Stamatis and coworkers applied a similar approach for studying the influence of different solvents on the equilibrium of the lipase catalyzed transesterification of hexanol with ethyl acetate. 41 The difficulty of locating the global minimum of the Gibbs free energy (GfE) is due to the likelihood of multiple local minima of the GfE of mixing function especially when complex thermodynamic models are applied so as to describe the non-ideality of the systems. 38,42 Although activity coefficient models based on the excess GfE of systems can lead to highly non-convex and mathematically complex expressions of the excess energy, such as UNIQUAC and NRTL, McDonald and Floudas showed how it is possible to transform such expressions into less complex expressions composed of the difference between two convex functions. 43 Consequently, S. B. Gregersen has applied, as a part of this study, the correlative UNIQUAC activity coefficient model in order to represent the non-ideality of reactive systems and thus to calculate activity coefficients in the model only for the chemical equilibrium. The binary interaction parameters were regressed from reported experimental data on the LLE of mainly ternary and some binary systems at several T values where available. The rest of the parameters for which there is no experimental LLE data available were obtained using the predictive UNIFAC group contribution method (by means of UNIFAC-LLE variant). Further details of this study can be found elsewhere. 44 Due to the complexity and significant non-ideality of reactive systems involved in this study it was decided as a practical approach performing the non-stoichiometric GfE minimization method. In that aspect, the occurrence of two-liquid phases even at conversions much lower than the experimentally accomplished equilibrium conversions assumed to be valid. As explained in detail in Chapter 3, there is almost always two equilibrated phases (LLE) for reaction completions above 30%, namely one fatty and one alcholic (or glycerol rich) phases throughout of the reaction courses at T values up to 353 K. As a result, the requirement of determining the number of split-phases in equilibrium was eliminated. An analogous approach was also considered by Voll and coworkers 45 for the thermodynamic analysis of the two-phase liquid reaction system of FFA esterification for biodiesel production. The as- IV-57
253 ANALYSIS OF CHEMICAL EQUILIBRIA sumption of single phase reaction media in their study was concluded to be unreliable and hence the simultaneous analysis of physical and chemical equilibria has decided to be the most appropriate method. It was found that although it increases the fatty phase solubility of glycerol produced during the reaction, the excess amount of EtOH feed favors further formation of biodiesel (EtOl). In her calculations, S. B. Gregersen has calculated the thermodynamic chemical equilibrium constant K a of Reaction 4-1 as and that of Reaction 4-2 as 5.93 at T 0 ( K). 44 As a result, it should be expected that the yield of transesterification to be higher than that of hydrolysis. As is seen in Fig. 4-11, she has reported that for the single phase reaction media assumption it is required feeding with a significantly high EtOH feed in order to obtain a biodiesel yield above 95%. However, for the simultaneous simulation (solution) of phase and chemical equilibria she has reported that a 4:1 ratio of EtOH to oil is enough for an equilibrium (complete) conversion. On the other hand, the composition of physically equilibrated reaction media (LLE) has a significantly low concentration of glycerol in fatty phase even for an EtOH to oil ratio of 8:1 (0.35 wt. %). Therefore, complete conversion for 4:1 ratio is thermodynamically attainable but not realistic. Figure 4-11 The impact of three molar equivalents of EtOH (EtOH: SBO = 1.00, 1.07, and 1.50) to oil on FAEE yield calculated considering only the chemical equilibrium for a single-phase system (M1) or the simultaneous chemical and phase equilibria (M2) for an initial composition of 1 mole of oil (triolein) including 0.1 mole of H 2 O and 0.02 mole of OlAc at313 K. symbol shows the experimental values for three molar equivalent feeds of EtOH at 313 K of reaction temperature. 44 On the other hand, Krisnangkura et al. have reported in case of conventional continuous biodiesel production at 343 K employing palm oil and MeOH that when glycerol remained in solution the equilibrium was shifted to the substrates side lowering the yield of esters. 46 This situation can be explained as follows: An increase in the ratio of alcohol to oil results in more unreacted alcohol at the equilibrium position which will increase the solubility of FAAE in the glycerol-rich phase and the glycerol in the ester (FAAE) rich phase. The system therefore gets more similar to the monophasic system which explains the small decrease in the calculated yield. As a result, it was evidenced that the formation of homogenous reactive IV-58
254 ANALYSIS OF CHEMICAL EQUILIBRIA media does not favor higher yields of biodiesel through both experimental studies and thermodynamic analysis of reaction systems. The influence of EtOH concentration on the reaction rate is depending on the catalyst applied. For conventional transesterification it has for instance been shown that a ratio of 30 to 1 was needed to obtain the same yield for acid-catalysis as could be obtained with a ratio of 6 to 1 of alkaline-catalysis for a given reaction time. Tongboriboon and coworkers 47 studied the effects of different ratio of oil to EtOH for lipase catalyzed transesterification of palm oil with EtOH. The maximum yield was obtained for a ratio of EtOH to oil of 3:1. The yield reported was 89% which is very close to the thermodynamic equilibrium yield predicted by the S.B. Gregersen s model for this amount of EtOH. They reported a lower yield for the ratio of 4:1 and concluded that the reason for this lower yield should be the inhibition of lipase enzymes by EtOH. In conclusion, a thermodynamic analysis of the system without considering the formation of two equilibrated liquid phases at the general equilibrium position results in prediction of chemical equilibrium yields that are lower than experimental obtained yields. Finally, the simultaneous calculation of the phase and chemical equilibrium gives a better representation of the system. 8. General Conclusions and Future Prospects The chemical equilibria analysis and thermodynamic feasibility studies were achieved in terms of constrained and unconstrained Gibbs free energy minimization methods, pseudoempirical equilibrium constant models, and also quantum chemical COSMO-RS method. The main purpose was the evaluation of chemical equilibria of the reactions involved in biodiesel production, i.e. the simulations of reaction equilibria in transesterification, esterification and hydrolysis reactions. On the other hand, the secondary purpose was the assessment of thermodynamic feasibility and limits of reversible reactions for different substrate feed ratios and temperature values through homogeneous liquid reaction media assumption. In other words, the additional aim was determining the thermodynamic limits of all three reactions in terms of chemical equilibria compositions for monophasic (homogenous) reaction media. In addition, experimental analysis of chemical equilibria employing both absolute and aqueous EtOH and neat vegetable oil substrates for two different types of immobilized biocatalysts were also performed with the intentions of identifying the apparent thermodynamic boundary lines and evaluating thermodynamic performances of reacting systems. Lastly, the simultaneous phase and chemical equilibria studies accomplished through predictive method and subsequently verified by means of experimental measurements were also assessed. Since the accuracy of calculated equilibrium states and compositions depends critically on the data sources/values used, several group contribution methods appropriate for estimating the pertinent thermophysical properties of fatty species were also evaluated in that respect. In overall, the thermophysical properties of reactive species, reaction energies, and ultimately the apparent biphasic equilibrium constants of transesterifi- IV-59
255 ANALYSIS OF CHEMICAL EQUILIBRIA cation, hydrolysis and esterification reactions including the intermediate reaction steps were calculated. The spontaneity of each reaction step was subsequently evaluated by means of two ultimately determined thermophysical data sets and COSMO-RS method at appropriate T values. The thermophysical properties studied were the formation energies, vaporization enthalpies, isobaric liquid specific heat capacities, and normal boiling temperatures of species. The significant lack of experimental data accessible for fatty species either in ideal gas or liquid states has been mentioned, and also the lack of even predictive data for the formation energies of fatty or ester species was also discussed. Consequently, the majority of thermophysical data has been estimated through appropriate GC predictive methods. In order to have internal consistency among the data points, the choice of appropriate data for each thermophysical property of fatty species was done through pseudo-quantitative comparisons of the related predictions with the experimental data points where available. Since there are several options on the determination of possible data sets, two data sets have been ultimately decided in order to use mainly with the pseudo-empirical K-value method. Furthermore, two alternative tables of formation and reaction energies for new reference temperatures (293 and 303 K) were also built (see Part 2 of Appendix 4-2). The simultaneous solution of reaction sets through equilibrium temperature approach showed that it is thermodynamically more feasible to operate reactions at higher aq. EtOH feeds, but at low T values with the obligation of a subsequent esterification step (Reaction 1-1 to Reaction Reaction 5), in order to reduce FFA composition in the final biodiesel product. Since there were differences between equilibrium compositions at different temperatures, it was evidenced that despite to the homogeneous reaction media assumption there are some particular phase-splits/separations (LLE) under equilibrium conditions within the reactor. Hence, in order to attain more realistic and thermodynamically feasible equilibrium compositions, it is better to couple some appropriate phase-splitting algorithms to, say, the non-ideal VCS algorithm used for simulations so as to determine more realistic phase and chemical equilibria. Analogous to the constrained minimization through monophasic reaction media assumption ca. 70% of the theoretically possible conversion level of EtOl was obtained as the maximum by means of the two approaches performed (see Section 4.2 and also Fig below). In that respect, it was again verified that the system thermodynamically favors lower aq. EtOH feed rates, but higher T values for the first reaction pair (Reaction 1-1 and Reaction 1-2). However, the opposite was valid for the other two reaction pairs. On the other hand, it was calculated through pseudo-empirical K-value method that the equilibrium constants of hydrolysis reaction steps have exceptionally high values with respect to their counterparts in the transesterification reaction set. Such high equilibrium constants values reveal that hydrolysis reactions will proceed spontaneously in the directions written. Moreover, it was found that all the reaction energies, except those of Reac- IV-60
256 ANALYSIS OF CHEMICAL EQUILIBRIA tion 5, are negative and their absolute values increase with temperature. On the contrary,,. the corresponding K-values decreased despite to more negative values of their G o liq ( T) higher temperatures. The fastest decrease in equilibrium constant value with the increase in T was observed for Reaction 1-1 of transesterification reaction set. The impact of higher T on the equilibrium constants in hydrolysis reactions was rather significant with the highest value in Reaction 1-2 case. The reaction enthalpy of Reaction 1-1 at 313 K was calculated as kj per mole of EtOl (l) produced and the enthalpies of Reaction 2-1 and 3-1 were calculated as kj and kj per mole of EtOl (l), respectively. In overall, the enthalpy of Reaction 4-1 was calculated as kj per mole of EtOl (l) which is in significant agreement with the reported value (- 9.3±0.7 kj/mol ) at the same T for transesterification of rapeseed oil via EtOH as the acyl acceptor. Likewise, the reaction enthalpy of Reaction 5 was calculated through K-value method as kj/mol (as the average value for the T range of K); whereas it was reported as kj/mol (in average). This considerably high latter value should be attributed to the fact that reactive mixture forms two equilibrated liquid phases throughout of the reaction course (water rich and fatty rich phases). Simultaneous solution of linear equation sets for the transesterification of triolein with absolute and aq. EtOH feeds were simulated by means of the K-value method and EtOl formation with ca. 79% of its theoretically possible conversion was obtained for 0.67 molar equivalent of dry EtOH at 328 K as the highest. It was deduced that stoichiometric or higher EtOH feed rates favor both the formation of EtOl and monoolein (Reaction 2-1) or more practically Reaction 3-1 seems to be the rate limiting step in terms of thermodynamics. On the other hand, it was not possible to simulate all 7 reactions or 6 reactions proceeding simultaneously in case of aq. EtOH feeds. It was deduced that thermodynamically optimal transesterification and hydrolysis reactions with 30% molar excess of aq. EtOH feed can be achieved at 308 K; while hydrolysis reaction can be performed equally well at 318 and 328 K values. Since the amount of glycerol produced at 308 K was the lowest one, it was deduced that the backward reaction for Reaction 3-1 should be significant at that or lower T values. liq. The Ka value of Reaction 5 was calculated as significantly low (see Table 4-11 in Section 5.2) by means of this method which confirms that reaction will not be spontaneous in the written direction. In overall, it was observed through the assessments of three methods applied for the analysis of chemical equilibria (constrained and unconstrained GfE minimization and pseudo-empirical K-value model) that homogeneous reaction media does not favor the formation of FAEE (EtOl) higher than 70%. To be precise, the thermodynamic feasibility study of reaction systems has revealed that the maximum of 70% to 80% of biodiesel (EtOl) formation could be achieved through the monophasic reaction media assumption. All of the thermodynamic feasibility evaluations have been performed by means of the related thermophysical property data sets that are partly presented in Table 4-4 (see Section rxn at IV-61
257 ANALYSIS OF CHEMICAL EQUILIBRIA 3). Besides, it was evidenced that the quality of thermophysical properties has rather significant influence on the equilibrium constants and, therefore, on the equilibrium compositions (cf. Section 5 and Appendix 4-3 for comparisons). If the corresponding steps of transesterification and hydrolysis reactions are compared it can be easily seen that the latters are more exothermic than the former ones. This means that transesterification reactions require relatively higher heat duty so as to proceed in the written directions. The GfE minimization methods are computationally more efficient than setting up and solving a large collection of nonlinear, coupled equilibrium equations, namely pseudo-empirical equilibrium constant method. Nonetheless, the two procedures are theoretically equivalent and must lead to the same result. As is seen in Fig. 4-12, three methods gave practically the same level of conversion or molar extent of reaction for the same reaction systems. In COSMO-RS method based calculations, the reaction energies and equilibrium constants of transesterification reactions were calculated at 308 and 318 K for stoichiometric and 30% molar excess feeds of dry EtOH and stoichiometric feeds triolein (see Part 2 of Appendix 4-3). Besides, the same properties were calculated for the hydrolysis reaction steps through stoichiometric feeds of water and triolein. It was found that Reaction 1-1 and 1-2 have positive reaction energies in all compositions of reaction media and thus their equilibrium constants were significantly low. It was verified that the equilibrium constant (the apparent biphasic constant) calculated at the overall composition of the two-phase media depends not only on temperature but also on the composition of reaction media and on the relative amount of the two liquid phases. It was accordingly predicted that Reaction 2-1 has the lowest reaction energies and thus the highest apparent biphasic equilibrium constant values. In overall, the assessments of COSMO-RS method based predictions for homogeneous reaction media assumption are not realistic and require the consideration of phase split phenomena. In an attempt to measure the chemical equilibria attained for ethanolysis reactions by means of biocatalysis, different experimental set-up(s) were prepared and reactions were performed by means of two different lipolytic enzymes in immobilized forms (see Section 6). It was consequently evidenced that Novozym 435 does not favor the formation of FAEE in case of aq. EtOH and produces twice as much of FFA than TL HC. Moreover, lower T values favor the formation of FAEE than that of FFA. It was observed that the produced glycerol forms small droplets suspended in the mixture; while some of it adheres onto the catalyst beads during the reaction. Since the equilibrium equation for a heterogeneous equilibrium does not include concentrations of pure liquids, the removal of glycerol rich phase, according to Le Chatelîer principle, might help to the shift of reactions towards products side and to the completion of reactions. Furthermore, the law of mass action states that the speed of a chemical reaction is proportional to the quantity (or concentration) of the reacting substances. It basically says that the rate of a reaction depends only on the concentration of the pertinent species participating to the reaction. IV-62
258 ANALYSIS OF CHEMICAL EQUILIBRIA Equilibrium Compositions (x %) (% of theoretically possible conversions) EtOl OlAc EtOl OlAc EtOl OlAc EtOl OlAc EtOl OlAc EtOl OlAc EtOl OlAc EtOl OlAc EtOl OlAc EtOl OlAc EtOl EtOl OlAc Simulation A Simulation B Simulation C Constrained Minimization Simulation D Simulation A (ΔT approach) Unconstrained Minimization Simulation B (Frac. conv. approach) K Case K Case Simulation A Simulation B Pseudo-empirical K- Model K Case K Case K Case K Case K Case K Case K Case Figure 4-12 The overall results of chemical equilibria simulations performed by means of Gibbs free Energy minimization (constrained and unconstrained) and pseudo-empirical K-value methods. Considerable difference between ΔT and fraction of conversion approaches in unconstrained minimization can be easily seen. (Equilibrium compositions of OlAc were given only for K in case of constrained GfE minimization; Simulation results in unconstrained minimization represent the species conversion percentages that are theoretically attainable values at each reaction step) IV-63
259 ANALYSIS OF CHEMICAL EQUILIBRIA To put it simply, even though there is no complete conversion of acylglycerides the system can be further shifted to the products side by the removal of glycerol phase while keeping adequate concentration of EtOH in fatty phase through feeds in excess amount. In concluding the simulation parts, it was verified that, though it might be accepted as a practical approach in conventional homogeneous catalysis, the assumption of homogeneous or monophasic reaction media is not appropriate in case of heterogeneous catalysis (biocatalysis). The simulations based on such assumption produce higher FFA and lower FAEE yields owing to higher concentration (unrealistic) of dissolved free glycerol in fatty phases. Additionally, it was evidenced that catalysis of ethanolysis reactions by means of TL HC biocatalyst can be further shifted to the product (FAEE) side for completion and, thus, in case of aq. EtOH this kind of lipase should be rather preferred from processing point of view. Since the reaction mechanisms, enzyme activity, water activity and inhibition patterns of lipase enzymes because of products and/or reactants (EtOH in particular) have a higher order of complexity, it is required to perform specific analyses with subsequent optimizations of systems in terms of reaction kinetics for the preferred biocatalysts reactant(s) reaction conditions combinations. Indeed, it is reported that the algorithms to calculate compositions in phase and chemical equilibria can converge to local or constrained minima in Gibbs free energy. A realistic analysis of phase and chemical equilibria of reaction systems involved in biodiesel production therefore requires detailed and rather complex mathematical calculations. The sophisticated algorithms and methods reported in the literature needs to be modified so as to apply for the assessment of phase and chemical equilibria of reaction systems simultaneously. Nevertheless, it was observed in this preliminary coupled analysis that although it increases the fatty phase solubility of glycerol produced during the reaction, the excess amount of EtOH feed favors further formation of biodiesel (EtOl). Consequently, it was found that a 4:1 ratio of EtOH to oil is enough for an equilibrium (complete) conversion for the simultaneous simulation (solution) of phase and chemical equilibria. Finally, the thermodynamic analysis of reactive systems without considering phase separation at the equilibrium position results in prediction of equilibrium yields that are lower than experimentally obtained ones. However, the simultaneous calculation of phase and chemical equilibrium gives more realistic representations. Therefore, when designing chemical reactors, distillation columns or other separation processes, it is often necessary to compute the phase and chemical equilibrium of the corresponding mixtures that are being handled. fatty In closing this chapter, the equilibrium constant ( K x' ) values of transesterification and hydrolysis reactions calculated by means of forward and reverse rate constants of corresponding reaction steps were presented in Table The rate constants were calculated using the concentrations of species measured in equilibrated fatty phases (data supplied by Dr. S. N. Fedesov; personal communication). According to these equilibrium constant values, transesterification reactions are thermodynamically more favorable than hydrolysis IV-64
260 ANALYSIS OF CHEMICAL EQUILIBRIA in terms of product(s) formation. The first steps of reactions are the least reversible and can go to completion spontaneously. In essence, all reaction steps are spontaneous in the written directions, but those of transesterification can go to completion easier, i.e. they are thermodynamically more feasible. In contrast to K-value (see Table 4-11 in Section 5) method the equilibrium constants of hydrolysis reactions have been calculated significantly low. Therefore, these equilibrium constant results are in agreement neither with those obtained by means of K-value method nor with COSMO-RS method. They are not the apparent biphasic equilibrium constants but real constants obtained using equilibrated fatty phase concentrations of species. Lastly, as discussed in detail in Chapter 3, the formation of single phase liquid reaction media do not thermodynamically favor higher yields of target biodiesel product. Table 4-14 Chemical equilibrium constant values calculated for the fatty phases by means of the equilibrium concentrations of species. Reaction 1-1 to 3-1 pertain to transesterification reaction; while Reaction 1-2 to 3-2 represent corresponding steps of hydrolysis reaction. Reaction 4-1 to 4-2 pertain to overall transesterification and hydrolysis reactions, respectively. (See Section 1.3 for the corresponding reaction steps; data supplied by Dr. S. N. Fedesov, personal communication) IV-65
261 CHAPTER 5
262
263 GENERAL RESULTS & CONCLUSIONS V. Chapter 5 Chapter 5 GENERAL RESULTS AND CONCLUSIONS The main purpose of this thesis was achieving the thermodynamic analysis of reactions involved in enzymatic biodiesel production with particular focus on chemical and phase equilibria of reaction systems. Biocatalytic Biodiesel Production The oil feedstock possibilities including alcohols (methanol and ethanol) as the acyl acceptors, economic aspects of biodiesel production have been assessed through detailed literature survey (see Chapter 2). The biocatalytic way of biodiesel production was comprehensively evaluated by considering the key determinants. It was deduced that the use of inedible vegetable oils and waste/used oil sources through biocatalysis offer promising possibilities for the next generation of biodiesel production. Beside of the partial miscibility of oil substrates and primary alcohols, the by-product glycerol is practically immiscible with the ester products (FAAE and oil). The insoluble alcohol forms emulsion droplets where continuous stirring operations are applied in order to improve mass transfer and thus reaction rates. In all other cases, there occurs a heterogeneous alcohol phase in equilibrium with the fatty phase under equilibrium conditions. As a result, the substrates feed ratio (alcohol to oil ratio) essentially has a significant impact on the maximum process yield, reaction time, and life span of biocatalysts. Indeed, the accumulation of FAEE species makes the reaction mixture homogenous until the synthesis of certain amount of glycerol by-product which becomes practically immiscible with fatty phases. The system, hence, split again into two equilibrated phases: an alcohol rich lower phase and an ester or fatty rich upper phase. In case of neat vegetable oils as the substrate -even if each of the FAEE, TAG, DAG, and MAG blends were considered as single species- there are reaction media consisting of 6 kinds of species where TAG-EtOH and fatty -glycerol binary systems, except that of MAG-glycerol, are immiscible with each other. The reaction media become more complex in case of waste/used oil sources containing significant amounts of FFA and/or water where two more reactions (hydrolysis and esterification) need also to be taken into account. The immiscibility and/or miscibility drawbacks of reactive systems involved in transesterification, esterification and hydrolysis reactions are the central constraints whereby some crucial circumstances are stem from, such as denaturing impacts of insoluble alcohols on immobilized lipase enzymes (biocatalysts); dominating side reactions and/or reverse reactions; inadequate external mass transfer; longer reaction times; and ultimately low target product conversions/yields. Obviously, all of the conditions in question are strictly correlated to such constraints. Due to the reversible nature of involved chemical reactions, in practice some excess amounts of alcohol should be required in order to shift the reaction equilibria towards the products side. Besides, since EtOH has higher affinity for glycerol rich phase, some excess amounts of EtOH is also required in order to provide enough concentration of depleting (reacting) EtOH within the fatty rich phase. o Such excess feeds are obligatory with the purpose of keeping reaction rate(s) efficient towards products side. V-1
264 GENERAL RESULTS & CONCLUSIONS Accordingly, the excess amounts of alcohol feeds need to be optimized for the reaction processes, biocatalyst types, oils sources and type/form of acyl acceptors involved. Phase (Physical) Equilibria of Reactive Systems The evaluations of LLE and VLE phase behaviors and solubilities of species involved in enzymatic biodiesel (FAEE) production were performed (see Chapter 3). Binary, ternary and multicomponent LLE simulations were accomplished mainly through predictive thermodynamic models; experimental measurements and reported studies for comparisons, where available. o In this regard, two general predictive approaches were considered, namely functional group contribution method based UNIFAC activity coefficient model with its variants and quantum chemical COSMO-RS method. o The VLE calculations were performed both isothermally and isobarically by means of COSMO-RS method accompanied by vapor pressure equations obtained appropriately (see Appendix 3-4). UNIFAC model variants based LLE simulations were accomplished through the assignment of different functional group combinations to pseudo- biodiesel and -vegetable oil species. o Pseudo-species were modeled using measured FA composition of oils. It was found that the assignment of functional groups and their quality (i.e. group values from VLE or LLE parameter tables) determines the ultimate efficiency of the phase equilibria estimations. o The addition (formation) of FAEE increases the mutual solubility of oil and EtOH species and thus improves the homogeneity of the reactive medium. o It was evidenced that the LLE of ternary systems pertaining to the ethanolysis reaction at a temperature range of 283 K up to 310 K can be well simulated via the UNIFAC-LLE model variant. The initial solubility of absolute EtOH in vegetable oils allows using excess amount of EtOH up to 1.15 molar equivalents at 313 K; whereas that of aq. EtOH allows up to ca molar equivalent at the same T value. Even though it is possible feeding up to 3.45 kmol/h of dry EtOH feed, the denaturing impact of EtOH on enzymes (immobilized) should be taken into account and hence the optimizations of enzymatic processes for all key determinants needs to be accomplished: type(s) of enzyme(s)/enzyme supports, the amount of enzymes added (load), and pairs of EtOH and vegetable oil. o Furthermore, it was considered feeding aq. EtOH up to 2.0 kmol/h per 1 kmol/h of oil feed in order to provide homogenous media for the initial part of reaction courses. o It is also worth noting that the formation of FAEE provides homogeneous reaction media even for higher excess amounts of dry EtOH; say 3.90 kmol/h after 15% of reaction completion. The homogeneity of reaction media can be provided only for some certain concentration of glycerol by-product. o It was both predictively and experimentally evidenced that the solubility of the byproduct glycerol in FAAE species is significantly low which results with the formation of equilibrated two-phase formation. o The amount of dissolved glycerol for reaction completions above 90% reaches to ca. 1% o even at 293 K. The LLE predictions by means of COSMO-RS method could efficiently represent experimental LLE measurements. In other words, both phase distributions and mutual solubilities can be estimated quantitatively by means of this predictive method even at higher T values up to 323 K. V-2
265 GENERAL RESULTS & CONCLUSIONS o Nonetheless, the solubility estimation of glycerol in EtOl and the impact of EtOH addition on this solubility for conversions beyond 95% by means of UNIFAC-LLE model were quantitatively reasonable. Besides, it was found that UNIQUAC is the best model among three correlative models studied. o The statement of practically immiscible for glycerol species is valid even below 30% of reaction completion in the absence of excessive EtOH concentration. LLE phase behavior simulations of ternary (quaternary) systems containing rectified EtOH revealed that there is a significant decrease in mutual solubilities with aqueous form of EtOH. Solubility of FAEE species in glycerol: EtLn as the most unsaturated member studied has the highest affinity for glycerol rich phase followed by EtLi species; whereas the lowest affinity was exerted by the long-chained saturated FAEE (EtSt). o It can be deduced that the removal of glycerol rich phase with the progress of reaction might help to increase the cetane number and oxidative resistance of the biodiesel. Moreover, such removal might help to shift the reversible reactions towards product(s) side. Binary LLE simulation of glycerol FFA and water FFA systems by means of COSMO-RS method: there is an inverse relation between the saturated FFA carbon number and miscibility with water and glycerol; while there is a linear solubility relation with the numbers of double bond in unsaturated FFA. o It was predicted that glycerol has very high affinity for FFA than water has. According to both LLE simulations and measurements, the use of waste/used oils containing substantial percentage of FFA as the feedstocks may improve the homogeneity of reaction media even at highly excess amounts of EtOH feeds. The examination of reported experimental ternary LLE phase diagrams of water containing Veg. Oil FFA EtOH H 2 O quaternary systems revealed that water has an antagonistic impact on the LLE of the reactive systems. o Therefore, the use of waste/used oils having considerable amount of water beside of FFA may prevent the formation of homogeneous reaction media. o Glycerol becomes more soluble with the increase in FFA concentration. However, the systems eventually turn into a biphasic system with further increase in glycerol concentration. o The FFA content of oil source can, however, increase the amount of dissolved glycerol in fatty medium up to 2 5% depending on the composition of reaction media (mainly of FFA) and temperature. Even if a homogeneous reaction medium can help to surmount the external mass transfer problems; high concentration of glycerol and/or water in fatty rich phase can also promote the reverse reactions and, thus, can decrease the final product yield. On the other hand, such single phase formations (regions) can be effectively used for the optimization of immobilized enzyme amounts in order to make reactions faster. Moisture Content in Biodiesel Water solubility determinations in FAME and FAEE species both experimental and predictive were also performed. The best predictive approach for water solubility in FAAE species was COSMO-RS method with the updated BP-TZVP parameterization set (v.3.0). Since moisture content determines the final product quality supplied to the market, it is more appropriate considering moisture contents at lower T values. V-3
266 GENERAL RESULTS & CONCLUSIONS o Therefore, either COS-MO-RS with BP-TZVP+HB2010 /BP-TZVP (the updated version) or modified UNIFAC (Do.) models can be used equally well for predicting absorbed water content in FAEE (EtOl) species. o EtOH feed (addition) increases the solubility of water in FFA rich phase and thus can improve the homogeneity of reaction media in case of waste/used oil substrates. The influence of feedstocks water content on the mutual solubilities of glycerol and FFA: an increase in water concentration considerably decreases the solubility of glycerol in FFA rich phase. o However, the increase in EtOH concentration increases the mutual solubility of FFA and glycerol, particularly in FFA rich phase. o Consequently, the initial feed rate (concentration) of EtOH can help to the homogeneity of reaction media containing waste/used oil feedstocks. It was evidenced through the LLE phase diagrams of ternary systems involved in biodiesel (FAEE) production and refining processes that COSMO-RS method with BP-TZVP parameterization can effectively be used for the simulation of LLE phase behavior and phase distribution of H 2 O between two liquid phases. Multicomponent LLE Simulations It was demonstrated using COSMO-RS method that there are possibilities of homogenous reaction media formation at the commencement of reactions, mainly with the use of dehydrated waste/used oil feedstocks comprising noticeable amounts of FFA. o However, the increase in by-product glycerol concentration and simultaneous decrease in EtOH concentration under equilibrium conditions initiate more pronounced phase separations for the enzymatic reactions at appropriate T values. It was predicted that glycerol is miscible with 1(3)-Monoolein at the T values employed in enzymatic reactions, while water has a predicted solubility value of 3% in the same species. EtOH was estimated as miscible with both MAG and DAG species. o The formation of MAG species increases the likelihood of homogeneous reaction media formation, particularly in the commencement of reactions. In case of the most plausible reactive mixture including oil, FAEE, FFA, aq. EtOH and glycerol (excluding intermediate acylglycerides) the amount of dissolved free glycerol at 303 and 318 K were estimated as 0.48% and 0.71%, respectively, where even that of predicted at lower T value substantially exceeds the allowed limit in the current standards. o Moreover, the amount of corresponding absorbed moisture contents were predicted as and ppm and it was evidenced that moisture content increases with the increase in FFA content. Current biodiesel standards restrict the maximum amount of moisture to 500 ppm. o Even though cold-water can be used for the removal of dissolved glycerol from biodiesel by liquid-liquid extraction operation, a dehydration step is always necessary. o Nonetheless, since intermediate acylglyceride products (DAG and MAG) have higher affinity for glycerol, the simultaneous removal of glycerol may decrease final biodiesel yields. VLE Simulations In order to provide a realistic simulation of VLE, the mixture of FAEE species was considered as a near-ideal solution. As a result, the overall vapor pressure of the FAEE species in the system was calculated from the sum of vapor pressure of individual FAEE components weighted by their corresponding FA compositions (of the oil source). V-4
267 GENERAL RESULTS & CONCLUSIONS VLE simulations were performed for multinary systems: 5 FAEE + EtOH + Glycerol for EtOH recovery and 5 FAEE + glycerol for the VLE of purification operations. Considering the purity of recovered EtOH, isobaric operation under 50 kpa of vacuum was chosen as the most suitable option for striping excess EtOH from biodiesel phase. It was found that is very achievable removing the dissolved glycerol from the biodiesel through isothermal simple unit operations, such as flash distillation or evaporation for conversions above 89% to 99.5%. However, since the temperature exceeds the critical temperature limit (523 K) reported for FAME decomposition, isobaric operations seems to be completely unsafe. Besides, neither 10 nor 50 kpa of vacuum levels perform better than isothermal cases for such simple unit operations. On the other hand, the VLE simulations of glycerol purification step through isothermal operations at 413 K showed yet again relatively better results than simple isobaric unit operations, even that at 1 kpa of vacuum. o Besides, at such a significantly low vacuum, the temperature still exceeds (ca. 430 K) the critical limit. Despite the fact that glycerol has lower boiling points than FAEE mixture, in general, the K- values of FAEE were rather higher than those of glycerol. o As a consequence, further purification of glycerol requires using vacuum distillation or rectification operations. It is worth noting that as an advantage of enzymatic biodiesel production, glycerol after the stripping of EtOH should theoretically have a purity of 98.3 wt. % to 98.8 wt. % for the conversion levels of 74.4% and 99.5%, respectively. The binary VLE of single FAEE species and glycerol showed minimum boiling azeotropes where the highest azeotrope mole fraction of was observed for EtPa at 423 K. o o Similar pseudo-azeotrope points were also observed with FAEE-Glycerol binaries. EtLi -as the major constituent of soybean oil derived FAEE blend- had sufficient concentration for the formation of azeotropy at low conversions (ca. 39% to 44%). Analysis of Chemical Equilibria Analysis of reactive systems in terms of thermodynamics provides significant and useful information on the extent and/or equilibrium yield associated with a reaction. In this regard, detailed analyses of chemical equilibria of transesterification, hydrolysis and esterification reactions have been accomplished (see Chapter 4). All the thermodynamic feasibility evaluations were performed by means of the related thermophysical property data sets either predicted using appropriate group contribution methods or obtained from the related literature, where available. o The required thermophysical properties of reacting species, such as formation energies, vaporization enthalpies and isobaric specific heat capacities at liquid state were mostly predicted by means of group contribution methods. According to such feasibility studies reaction systems would favor lower biodiesel (EtOl) yield if the formed glycerol by-product and ester phase were completely miscible with each other. It was observed through the assessments of these methods that homogeneous reaction media does not favor the formation of higher than 70%. o To be precise, the thermodynamic feasibility study of reaction systems has revealed that 70% to 80% as the maximum amounts of biodiesel (EtOl) formation could be achieved through the single liquid phase reaction media assumption. Consequently, it was verified that the attempts to create monophasic reaction media or such assumptions are not appropriate in case of heterogeneous catalysis (biocatalysis). V-5
268 GENERAL RESULTS & CONCLUSIONS o Equilibrium simulations based on such assumptions produce higher FFA and lower FAEE yields owing to higher but unrealistic concentration of dissolved (free) glycerol in ester phases. It was evidenced that the quality of thermophysical properties has rather significant influence on the equilibrium constants and hence on the equilibrium compositions. If the corresponding steps of transesterification and hydrolysis reactions are compared it can be easily seen that the latters are more exothermic than the former ones. This means that transesterification reactions require relatively higher heat duty in order to proceed in the written directions. Moreover, it was simulated that although it increases the fatty phase solubility of glycerol produced during the reaction, the excess amount of EtOH feed favors further formation of biodiesel (EtOl). In that respect, it was demonstrated through simultaneous simulation (solution) of phase and chemical equilibria that a 4:1 ratio of EtOH to oil is enough for an equilibrium (near complete) conversion. Finally, the thermodynamic analysis of the system without considering the formation of two phases at the equilibrium position results in prediction of equilibrium yields that are lower than experimental obtained ones. Hence, the simultaneous calculation of phase and chemical equilibrium gives more realistic representations of the system. Some General Findings and Conclusions The statistical optimization studies with the main purpose of finding optimum parameter values for EtOH to oil ratio; the ratio of two different enzymes (TLL to CALB) and their load; the inclusion of FAEE as the solvent; reaction time, and temperature were performed. The response surface methodology based IV-optimal type of design and optimization studies (using coordinate exchange algorithm) were performed. It is of concern to note that data obtained in these studies were not shown. However, a few crucial findings will be outlined below: It is possible to use dry EtOH soybean oil molar ratio up to in batch reaction conditions without observing any phase separation under equilibrium conditions. (3.2 kmol/h per kmol of soybean oil feed is also applicable in case of continuous process). o There was no considerable difference between 3 and 3.2 moles of EtOH addition on the ultimate biodiesel yield where above 97% of FAEE was measured after 12 h of reaction o time. There was some slight denaturing or inhibitive impact on immobilized biocatalyst mixture for 5 recycles. (Biocatalysts were washed with isopropanol+tert-butanol (1:1) mixture and subsequently dried at 313 K for a few hours. Their weight was checked with the help of a balance). o The use of 15% FAEE (based on oil + EtOH feed weight) as the solvent helps to hinder denaturing impact of EtOH and inhibition by glycerol. However, further studies need to be achieved by considering the difference in inhibition/inactivation patterns of TLL and CALB enzymes. o The increase in glycerol concentration decreases the rate of reaction through adhering on the biocatalyst beads. Evidently, there was no difference between 300 and 400 rpm of stirring speed on this phenomenon. V-6
269 REFERENCES
270
271 REFERENCES R. References REFERENCES FOR CHAPTER 2 1. ASTM D6751. American Society for Testing and Materials - Standard specification for biodiesel fuel (B100) blend stock for distillate fuels. ASTM Standards D Ranganathan, S. V.; Narasimhan, S. L.; Muthukumar, K. An overview of enzymatic production of biodiesel. Bioresour. Technol. 2008, 99 (10), Gavrilescu, M.; Chisti, Y. Biotechnology: a sustainable alternative for chemical industry. Biotechnol. Adv. 2005, 23, OECD/FAO OECD-FAO Agricultural Outlook Chapter 3: Biofuels; OECD Publishing and FAO: Jun 11, Knothe, G.; Van Gerpen, J.; Krahl, J. The Biodiesel Handbook; 2nd ed.; AOCS Press: Champaign, Illinois, USA, Ghaly, A. E.; Dave, D.; Brooks, M. S.; Budge, S. Production of biodiesel by enzymatic transesterification: Review. Am. J. Biochem. Biotechnol. 2010, 6 (2), Knothe, G. "Designer" biodiesel: Optimizing fatty ester composition to improve fuel properties. Energy & Fuels 2008, 22, Gopinath, A.; Puhan, S.; Nagarajan, G. Relating the cetane number of biodiesel fuels to their fatty acid composition: A critical study. Proc. Inst. Mech. Eng. Part D J. Automob. Eng. 2009, 223 (4), Bala, B. K. Studies on biodiesels from transformation of vegetable oils for diesel engines. Energ. Edu. Sci. Technol. 2005, 15 (1-2), Encinar, J. M.; Gonzalez, J. F.; Rodriguez, J. J.; Tejedor, A. Biodiesel fuels from vegetable oils: Transesterification of Cynara cardunculus L. oils with ethanol. Energy Fuels 2002, 16 (2), Gupta, R. B.; Demirbas, A. Biodiesel from vegetable oils. In Gasoline, Diesel and Ethanol Biofuels from Grasses and Plants, Cambridge: New York, USA, 2010; pp Renedo, C. J.; Ortiz, A.; Perez, S.; Manana, M.; Fernandez, I. Biodiesel. In Handbook of Renewable Energy Technology, Zobaa, A. F., Bansal, R. C., Eds.; World Scientific Publishing Co. Pte. Ltd.: Singapore, 2011; pp Vasudevan, P. T.; Gagnon, M. D.; Briggs, M. S. Environmentally sustainable biofuels - The case for biodiesel, biobutanol and cellulosic ethanol. In Sustainable Biotechnology: Sources of Renewable Energy, Singh, O. V., Harvey, S. P., Eds.; Springer: New York, USA, 2010; pp Oilseeds: World Markets and Trade (11/09/11) WorldBank World Bank Commodity Price Data (Pink Datasheet) H Street, N.W., MSN MC Washington, D.C U.S.A.; Oct 3, Demirbas, A. Political, economic and environmental impacts of biofuels: A review. Appl. Energy 2009, 86, S108-S Hoque, E.; Singh, A.; Chuan, Y. L. Biodiesel from low cost feedstocks: The effects of process parameters on the biodiesel yield. Biomass Bioenergy 2010, 35 (4), Mittelbach, M. Biorenewable Resources No.1, a special supplement to INFORM. Inform 2006, Pramanik, K. Properties and use of jatropha curcas oil and diesel fuel blends in compression ignition engine. Renewable Energy 2003, 28 (2), Tiwari, A. K.; Kumar, A.; Raheman, H. Biodiesel production from jatropha (Jatropha curcas) with high free fatty acids: An optimized process. Biomass Bioenerg 2007, 31 (8), Ravasio, N.; Zaccheria, F.; Psaro, R. The use of catalysis in the production of high-quality biodiesel. In Catalysis for Sustainable Energy Production, Barbaro, P., Bianchini, C., Eds.; WILEY-VCH: Weinheim, 2009; pp R-1
272 REFERENCES 22. Haas, M. J.; Piazza, G. J.; Foglia, T. A. Enzymatic approach to the production of biodiesel fuels. In Lipid Biotechnology, Kuo, T. M., Gardner, H. W., Eds.; Marcel Dekker: New York, USA, 2002; pp Chisti, Y. Biodiesel from microalgae beats bioethanol. Trends Biotechnol. 2008, 26, Manzanera, M. Biofuels from oily biomass. In Carbon-neutral fuels and energy carriers, Veziroglu, T. N., Muradov, N. Z., Eds.; CRC, Taylor & Francis Group: Orlando,USA, 2011; pp Foidl, N.; Foidl, G.; Sanchez, M.; Mittelbach, M.; Hackel, S. Jatropha curcas L as a source for the production of biofuel in Nicaragua. Bioresour. Technol. 1996, 58 (1), Meher, L. C.; Sagar, D. V.; Naik, S. N. Technical aspects of biodiesel production by transesterification - a review. Renew. & Sust. Energ. Rev. 2006, 10 (3), Antczak, M. S.; Kubiak, A.; Antczak, T.; Bielecki, S. Enzymatic biodiesel synthesis - Key factors affecting efficiency of the process. Renewable Energy 2009, 34 (5), Ognjanovic, N.; Bezbradica, D.; Knezevic-Jugovic, Z. Enzymatic conversion of sunflower oil to biodiesel in a solvent-free system: Process optimization and the immobilized system stability. Bioresour. Technol. 2009, 100 (21), Rodrigues, R. C.; Volpato, G.; Wada, K.; Ayub, M. A. Z. Enzymatic synthesis of biodiesel from transesterification reactions of vegetable oils and short chain alcohols. J. Am. Oil Chem. Soc. 2008, 85 (10), Wu, W. H.; Foglia, T. A.; Marmer, W. N.; Dunn, R. O.; Goering, C. E.; Briggs, T. E. Low-temperature property and engine performance evaluation of ethyl and isopropyl esters of tallow and grease. J. Am. Oil Chem. Soc. 1998, 75 (9), Dunn, R. O.; Shockley, M. W.; Bagby, M. O. Improving the low-temperature properties of alternative diesel fuels: Vegetable oil-derived methyl esters. J. Am. Oil Chem. Soc. 1996, 73 (12), Salis, A.; Pinna, M.; Monduzzi, M.; Solinas, V. Biodiesel production from triolein and short chain alcohols through biocatalysis. J. Biotechnol. 2005, 119 (3), Guisan, J. M. Immobilization of enzymes as the 21 st century begins - An already solved problem or still an exciting challenge? In Immobilization of Enzymes and Cells, 2nd ed.; Guisan, J. M., Ed.; Humana Press: New Jersey, USA, 2006; Vol. 22, pp Lotti, M.; Alberghina, L. Candida rugosa lipases: From molecular evolution analysis to the design of a synthetic gene. In Protein Engineering For Industrial Biotechnology, Alberghina, L., Ed.; Harwood Academic Publishers: Amsterdam, The Netherlands, 2000; pp Svendsen, A. Lipase protein engineering. Biochim. Biophys. Acta 2000, 1543 (2), Ransac, S.; Carriére, F.; Rogalska, E.; Verger, R.; Magret, F.; Bruno, G.; Melo, E. P.; Cabral, J. M. S.; Egloff, M. P.; van Tilbeurgh, H.; Cambillau, C. The kinetics, specificities and structural features of lipases. In Molecular Dynamics of Biomembranes, Springer-Verlag: Berlin, Germany, 1996; Vol. 96, pp Lotti, M.; Alberghina, L. Lipases: molecular structure and function. In Industrial Enzymes - Structure, Function and Applications, Polaina, J., MacCabe, A. P., Eds.; Springer: Dordrecht, The Netherlands, 2007; pp Wong, D. W. S. Lipase. In Handbook of Food Enzymology, Whitaker, J. R., Voragen, A. G. J., Wong, D. W. S., Eds.; CRC Press: New York, USA, 2003; pp Faber, K. Biotransformations in Organic Chemistry: A Textbook; 6th ed.; Springer-Verlag: Berlin, Germany, Salis, A.; Sanjust, E.; Solinas, V.; Monduzzi, M. Commercial lipase immobilization on Accurel MP1004 porous polypropylene. Biocatal. Biotransform. 2005, 23 (5), Al-Zuhair, S. Production of biodiesel: possibilities and challenges. Biofuels Bioproducts & Biorefining- Biofpr 2007, 1 (1), Jaeger, K.-E.; Eggert, T. Lipases for biotechnology. Curr. Opin. Biotechnol. 2002, 13 (4), Cernia, E.; Palocci, C.; Soro, S. Solvent engineering modulates stereoselectivity of microbial lipases. In Protein Engineering For Industrial Biotechnology, Alberghina, L., Ed.; Harwood Academic Publishers: Amsterdam, The Netherlands, 2000; pp Al-Zuhair, S.; Dowaidar, A.; Kamal, H. Dynamic modeling of biodiesel production from simulated waste cooking oil using immobilized lipase. Biochem. Eng. J. 2009, 44 (2-3), Vasudevan, P. T.; Briggs, M. Biodiesel production-current state of the art and challenges. J. Ind. Microbiol. Biotechnol. 2008, 35 (5), R-2
273 REFERENCES 46. Koshland, D. E., Jr.; Neet, K. E. The catalytic and regulatory properties of enzymes. Annu. Rev. Biochem. 1968, 37 (359), Chang, H. M.; Liao, H. F.; Lee, C. C.; Shieh, C. J. Optimized synthesis of lipase-catalyzed biodiesel by Novozym 435. J. Chem. Technol. Biotechnol. 2005, 80 (3), Watanabe, Y.; Shimada, Y.; Sugihara, A.; Noda, H.; Fukuda, H.; Tominaga, Y. Continuous production of biodiesel fuel from vegetable oil using immobilized Candida antarctica lipase. J. Am. Oil Chem. Soc. 2000, 77 (4), Nielsen, P. M.; Brask, J.; Fjerbæk, L. Enzymatic biodiesel production: Technical and economical considerations. Eur. J. Lipid Sci. Technol. 2008, 110 (8), Türkan, A.; Kalay, S. Monitoring lipase-catalyzed methanolysis of sunflower oil by reversed-phase high-performance liquid chromatography: Elucidation of the mechanisms of lipases. Journal of Chromatography A 2006, 1127 (1-2), Heinsman, N. W. J. T.; Schroën, C. G. P. H.; Padt, A. v. d.; Franssen, M. C. R.; Boom, R. M.; Riet, K. v. '. Substrate sorption into the polymer matrix of Novozym 435 and its effect on the enantiomeric ratio determination. Tetrahedron: Asymmetry 2003, 14, Sotoft, L. F.; Westh, P.; Christensen, K. V.; Norddahl, B. Novel investigation of enzymatic biodiesel reaction by isothermal calorimetry. Thermochim. Acta 2010, 501 (1-2), Cygler, M.; Schrag, J. D. Structure as basis for understanding interfacial properties of lipases. In Methods in Enzymology - Lipases, Part A: Biotechnology, Rubin, B., Dennis, E. A., Eds.; Academic Press: 1997; Vol. 284, pp Hanefeld, U. Immobilization as a tool for improving enzymes. In Modern Biocatalysis - Stereoselective and Environmentally Friendly Reactions, Fessner, W.-D., Anthonsen, T., Eds.; Wiley-VCH Verlag GmbH & Co.: Weinheim, 2009; pp Du, W.; Xu, Y. Y.; Liu, D. H.; Zeng, J. Comparative study on lipase-catalyzed transformation of soybean oil for biodiesel production with different acyl acceptors. J. Mol. Catal. B: Enzym. 2004, 30 (3-4), Adamczak, M.; Bornscheuer, U. T.; Bednarski, W. The application of biotechnological methods for the synthesis of biodiesel. European Journal of Lipid Science and Technology 2009, 111 (8), Akoh, C. C.; Chang, S. W.; Lee, G. C.; Shaw, J. F. Enzymatic approach to biodiesel production. J. Agric. Food Chem. 2007, 55 (22), Deng, L.; Xu, X. B.; Haraldsson, G. G.; Tan, T. W.; Wang, F. Enzymatic production of alkyl esters through alcoholysis: A critical evaluation of lipases and alcohols. J. Am. Oil Chem. Soc. 2005, 82 (5), Fjerbæk, L.; Christensen, K. V.; Norddahl, B. A review of the current state of biodiesel production using enzymatic transesterification. Biotechnol. Bioeng. 2009, 102 (5), Fukuda, H.; Kondo, A.; Noda, H. Biodiesel fuel production by transesterification of oils. J. Biosci. Bioeng. 2001, 92 (5), Robles-Medina, A.; Gonzalez-Moreno, P. A.; Esteban-Cerdan, L.; Molina-Grima, E. Biocatalysis: Towards ever greener biodiesel production. Biotechnol. Adv. 2009, 27 (4), Stamenkovic, O. S.; Velickovic, A. V.; Veljkovic, V. B. The production of biodiesel from vegetable oils by ethanolysis: Current state and perspectives. Fuel 2011, 90 (11), Shimada, Y.; Watanabe, Y.; Sugihara, A.; Tominaga, Y. Enzymatic alcoholysis for biodiesel fuel production and application of the reaction to oil processing. J. Mol. Catal. B: Enzym. 2002, 17 (3-5), Iso, M.; Chen, B. X.; Eguchi, M.; Kudo, T.; Shrestha, S. Production of biodiesel fuel from triglycerides and alcohol using immobilized lipase. J. Mol. Catal. B: Enzym. 2001, 16 (1), Choo, Y. M.; Ong, S. H. Transesterification of fats and oils. British Patent GB , Mittelbach, M. Lipase catalyzed alcoholysis of sunflower oil. J. Am. Oil Chem. Soc. 1990, 67 (3), Du, W.; Li, W.; Sun, T.; Chen, X.; Liu, D. H. Perspectives for biotechnological production of biodiesel and impacts. Appl. Microbiol. Biotechnol. 2008, 79 (3), Nelson, L.; Foglia, T. A.; Marmer, W. N. Lipase-catalyzed production of biodiesel. J. Am. Oil Chem. Soc. 1996, 73, Abigor, R. D.; Uadia, P. O.; Foglia, T. A.; Haas, M. J.; Jones, K. C.; Okpefa, E.; Obibuzor, J. U.; Bafor, M. E. Lipase-catalysed production of biodiesel fuel from some Nigerian lauric oils. Biochem. Soc. Trans. 2000, 28, R-3
274 REFERENCES 70. Köse, Ö.; Tüter, M.; Aksoy, H. A. Immobilized Candida antarctica lipase-catalyzed alcoholysis of cotton seed oil in a solvent-free medium. Bioresour. Technol. 2002, 83 (2), Noureddini, H.; Gao, X.; Philkana, R. S. Immobilized Pseudomonas cepacia lipase for biodiesel fuel production from soybean oil. Bioresour. Technol. 2005, 96 (7), Selmi, B.; Thomas, D. Immobilized lipase-catalyzed ethanolysis of sunflower oil in a solvent-free medium. J. Am. Oil Chem. Soc. 1998, 75 (8), Irimescu, R.; Furihata, K.; Hata, K.; Iwasaki, Y.; Yamane, T. Utilization of reaction medium-dependent regiospecificity of Candida antarctica lipase (Novozym 435) for synthesis of 1,3-dicapryloyl-2- docosahexaenoyl (or eicosapentaenoyl) glycerol. J. Am. Oil Chem. Soc. 2001, 78 (3), Irimescu, R.; Furihata, K.; Hou, C. T. Study of TAG ethanolysis to 2-MAG by immobilized Candida antarctica lipase and synthesis of symmetrically structured TAG. J. Am. Oil Chem. Soc. 2002, 79 (9), Breivik, H.; Haraldsson, G. G.; Kristinsson, B. Preparation of highly purified concentrates of eicosapentaenoic acid and docosahexaenoic acid. J. Am. Oil Chem. Soc. 1997, 74 (11), Haraldsson, G. G.; Kristinsson, B.; Sigurdardottir, R.; Gudmundsson, G. G.; Breivik, H. The preparation of concentrates of eicosapentaenoic acid and docosahexaenoic acid by lipase-catalyzed transesterification of fish oil with ethanol. J. Am. Oil Chem. Soc. 1997, 74 (11), Watanabe, Y.; Shimada, Y.; Sugihara, A.; Tominaga, Y. Stepwise ethanolysis of tuna oil using immobilized Candida antarctica lipase. J. Biosci. Bioeng. 1999, 88 (622), Wu, W. H.; Foglia, T. A.; Marmer, W. N.; Phillips, J. G. Optimizing production of ethyl esters of grease using 95% ethanol by response surface methodology. J. Am. Oil Chem. Soc. 1999, 76 (4), Vacek, M.; Zarevúcka, M.; Wimmer, Z.; Stránský, K.; Macková, M.; Demnerová, K. Enzyme alcoholysis of blackcurrant oil. Biotechnol. Lett. 2001, 23 (1), Shah, S.; Sharma, S.; Gupta, M. N. Biodiesel preparation by lipase-catalyzed transesterification of Jatropha oil. Energy & Fuels 2004, 18 (1), Yesiloglu, Y. Immobilized lipase-catalyzed ethanolysis of sunflower oil. J. Am. Oil Chem. Soc. 2012, 81 (2), Nag, A. Alcoholysis of vegetable oil catalyzed by an isozyme of Candida rugosa lipase for production of fatty acid esters. Indian Journal of Biotechnology 2006, 5, Rodrigues, R. C.; Volpato, G.; Ayub, M. A. Z.; Wada, K. Lipase-catalyzed ethanolysis of soybean oil in a solvent-free system using central composite design and response surface methodology. J. Chem. Technol. Biotechnol. 2008, 83 (6), Tongboriboon, K.; Cheirsilp, B.; Kittikun, A. Mixed lipases for efficient enzymatic synthesis of biodiesel from used palm oil and ethanol in a solvent-free system. J. Mol. Catal. B: Enzym. 2010, 67 (1-2), Kumari, V.; Shah, S.; Gupta, M. N. Preparation of biodiesel by lipase-catalyzed transesterification of high free fatty acid containing oil from Madhuca indica. Energy Fuels 2007, 21 (1), Shah, S.; Gupta, M. N. Lipase catalyzed preparation of biodiesel from Jatropha oil in a solvent free system. Process Biochem. 2007, 42 (3), Moreira, A. B. R.; Perez, V. H.; Zanin, G. M.; de Castro, H. F. Biodiesel synthesis by enzymatic transesterification of palm oil with ethanol using lipases from several sources immobilized on silica-pva composite. Energy Fuels 2007, 21 (6), Hsu, A. F.; Jones, K.; Foglia, T. A.; Marmer, W. N. Continuous production of ethyl esters of grease using an immobilized lipase. J. Am. Oil Chem. Soc. 2004, 81 (8), Hsu, A. F.; Jones, K. C.; Foglia, T. A.; Marmer, W. N. Transesterification activity of lipases immobilized in a phyllosilicate sol-gel matrix. Biotechnol. Lett 2004, 26 (11), Hsu, A. F.; Jones, K.; Marmer, W. N.; Foglia, T. A. Production of alkyl esters from tallow and grease using lipase immobilized in a phyllosilicate sol-gel. Journal of the American Oil Chemists Society 2001, 78 (6), Bastida, A.; Sabuquillo, P.; Armisen, P.; Fernández-Lafuente, R.; Huguet, J.; Guisán, J. M. A single step purification, immobilization and hyperactivation of lipases via interfacial adsorption on strongly hydrophobic supports. Biotechnol. Bioeng. 1998, 58 (5), Hultin, H. O. Current and potential uses of immobilized enzymes. Food Technol. 1983, 37, R-4
275 REFERENCES 93. Sakai, T. 'Low-temperature method' for a dramatic improvement in enantioselectivity in lipasecatalyzed reactions. Tetrahedron: Asymmetry 2004, 15 (18), Klibanov, A. M. Enzymes that work in organic solvents. CHEMTECH 1986, 16, Ryu, K.; Dordick, J. S. Free energy relationships of substrate and solvent hydrophobicities on enzymatic catalysis in organic media. J. Am. Chem. Soc. 1989, 111, Hsu, S.-H.; Wu, S.-S.; Wang, Y.-F.; Wong, C.-H. Lipase-catalyzed irreversible transesterification using enol esters: XAD-8 immobilized lipoprotein lipase-catalyzed resolution of secondary alcohols. Tetrahedron Lett. 1990, 31 (6403), Jegannathan, K. R.; Abang, S.; Poncelet, D.; Chan, E. S.; Ravindra, P. Production of biodiesel using immobilized lipase - a critical review. Crit. Rev. Biotechnol. 2008, 28 (4), Hilal, N.; Kochkodan, V.; Nigmatullin, R.; Goncharuk, V.; Al-Khatib, L. Lipase immobilized biocatalytic membranes for enzymatic esterification: Comparison of various approaches to membrane preparation. J. Membr. Sci. 2006, 268 (2), Nie, K.; Xie, F.; Wang, F.; Tan, T. W. Lipase catalyzed methanolysis to produce biodiesel: Optimization of the biodiesel production. J. Mol. Catal. B: Enzym. 2006, 43 (1-4), Yagiz, F.; Kazan, D.; Akin, A. N. Biodiesel production from waste oils by using lipase immobilized on hydrotalcite and zeolites. Chem. Eng. J. 2007, 134 (1-3), Malcata, F. X.; Reyes, H. R.; Garcia, H. S.; Hill, C. G. Jr.; Amundson, C. H. Immobilized lipase reactors for modification of fats and oils - A review. J. Am. Oil Chem. Soc. 1990, 67, Kneževic, Z.; Šiler-Marinkovic, S.; Mojovic, Lj. Immobilized lipases as practical catalysts. APTEFF 2004, 35, Balcão, V. M.; Paiva, A. L.; Malcata, F. X. Bioreactors with immobilized lipases: State of the art. Enzyme Microb. Technol. 1996, 18 (6), Fernández-Lafuente, R.; Armisen, P.; Sabuquillo, P.; Fernández-Lorente, G.; Guisán, J. M. Immobilization of lipases by selective adsorption on hydrophobic supports. Chem. Phys. Lipids 1998, 93 (1-2), Sugiura, M.; Isobe, M. Studies on the mechanism of lipase reaction. III. Adsorption of Chromobacterium lipase on hydrophobic glass beads. Chem. Pharm. Bull 1976, 24, Akita, H. Recent advances in the use of immobilized lipases directed toward the asymmetric syntheses of complex molecules. Biocatal. Biotransform. 1996, 13 (3), Lavayre, J.; Baratil, J. Preparation and properties of immobilized lipases. Biotechnol. Bioeng. 1982, 24 (4), Clark, D. S. Can immobilization be exploited to modify enzyme activity? Trends Biotechnol. 1994, 12 (11), Malcata, F. X.; Reyes, H. R.; Garcia, H. S.; Hill, C. G. Jr.; Amundson, C. H. Kinetics and mechanisms of reactions catalysed by immobilized lipases. Enzyme Microb. Technol. 1992, 14, Bornscheuer, U. T. Immobilizing enzymes: How to create more suitable biocatalysts. Angew. Chem. Int. Ed. 2003, 42 (29), Miled, N.; Beisson, F.; de Caro, J.; de Caro, A.; Arondel, V.; Verger, R. Interfacial catalysis by lipases. J. Mol. Catal. B: Enzym. 2001, 11 (4-6), Mateo, C.; Palomo, J. M.; Fernandez-Lorente, G.; Guisan, J.; Fernandez-Lorente, R. Improvement of enzyme activity, stability and selectivity via immobilization techniques. Enzyme Microb. Technol. 2007, 40 (6), Marangoni, A. G. Lipases: Structure, function, and properties. In Lipid Biotechnology, Gardner, H. W., Kuo, T. M., Eds.; CRC Press: New York, USA, 2002; pp Martinek, K.; Klibanov, A. M.; Goldmacher, V. S.; Tchernysheva, A. V.; Mozhaev, V. V.; Berezina, I. V.; Glotov, B. O. The principles of enzyme stabilization: II. Increase in the thermostability of enzymes as a result of multipoint noncovalent interaction with a polymeric support. Biochim. Biophys. Acta, Enzymol. 1977, 485 (1), Brodelius, P. Industrial applications of immobilized biocatalysts. In Advances in Biochemical Engineering/Biotechnology, Ghose, T. K., Fiechter, A., Blakebrough, N., Eds.; Springer-Verlag: Berlin, Germany, 1978; Vol Bevinakatti, H. S.; Banerji, A. A. Lipase catalysis: Factors governing transesterification. Biotechnol. Lett. 1988, 10 (6), R-5
276 REFERENCES 117. Desnuelle, P. The Lipases. In The Enzymes, 3 rd ed.; Boyer, P. D., Ed.; Academic Press: New York, US, 1972; Vol. 7, pp Miller, C.; Austin, H.; Posorske, L.; Gonziez, J. Characteristics of an immobilized lipase for the commercial synthesis of esters. J. Am. Oil Chem. Soc. 1988, 65 (6), Bosley, J. A.; Peilow, A. D. Immobilization of lipases on porous polypropylene: Reduction in esterification efficiency at low loading. J. Am. Oil Chem. Soc. 1997, 74 (2), Wehtje, E.; Adlercreutz, P.; Mattiasson, B. Improved activity retention of enzymes deposited on solid supports. Biotechnol. Bioeng. 2011, 41 (2), Lu, J. K.; Deng, L.; Zhao, R.; Zhang, R. S.; Wang, F.; Tan, T. W. Pretreatment of immobilized Candida sp lipase to improve its methanol tolerance for biodiesel production. J. Mol. Catal. B: Enzym. 2010, 62 (1), Chen, J.-W.; Wu, W.-T. Regeneration of immobilized Candida antarctica lipase for transesterification. J. Biosci. Bioeng. 2003, 95 (5), Samukawa, T.; Kaieda, M.; Matsumoto, T.; Ban, K.; Kondo, A.; Shimada, Y.; Noda, H.; Fukuda, H. Pretreatment of immobilized Candida antarctica lipase for biodiesel fuel production from plant oil. J. Biosci. Bioeng. 2000, 90 (2), Shimada, Y.; Sugihara, A.; Nakano, H.; Nagao, T.; Suenaga, M. Fatty acid specificity of Rhizopus delemar lipase in acidolysis. J. Fermentat. Bioeng. 1997, 83 (321), Lanser, A. C.; Manthey, L. K.; Hou, C. T. Regioselectivity of new bacterial lipases determined by hydrolysis of triolein. Curr. Microbiol. 2002, 44, Lang, D. A.; Mannesse, M. L. M.; de Haas, G. H.; Verheij, H. M.; ijkstra, B. W. Structural basis of the chiral selectivity of Pseudomonas cepacia lipase. Eur. J. Biochem. 1998, 254, Yamane, T. Enzyme technology for the lipids industry: An engineering overview. J. Am. Oil Chem. Soc. 1987, 64 (12), Fukuda, H.; Kondo, A.; Tamalampudi, S. Bioenergy: Sustainable fuels from biomass by yeast and fungal whole-cell biocatalysts. Biochem. Eng. J. 2009, 44 (1), Schmid, R. D.; Verger, R. Lipases - interfacial enzymes with attractive applications. Angew. Chem. Int. Ed. 1998, 37, Berger, M.; Schneider, M. P. Regioselectivity of lipases in organic solvents. Biotechnol. Lett. 1991, 13, Torres, C. F.; Fornari, T.; Tenllado, D.; Senoráns, F. J.; Reglero, G. A predictive kinetic study of lipasecatalyzed ethanolysis reactions for the optimal reutilization of the biocatalyst. Biochem. Eng. J. 2008, 42, Ahern, T. J.; Klibanov, A. M. The mechanism of irreversible enzyme inactivation at 100 C. Science 1985, 228, Soumanou, M. M.; Bornscheuer, U. T. Lipase-catalyzed alcoholysis of vegetable oils. Eur. J. Lipid Sci. Technol. 2003, 105 (11), Matassoli, A. L. F.; Correa, I. N. S.; Portilho, M. F.; Veloso, C. O.; Langone, M. A. P. Enzymatic synthesis of biodiesel via alcoholysis of palm oil. Appl. Biochem. Biotechnol. 2009, 155 (1-3), Watanabe, Y.; Shimada, Y.; Sugihara, A.; Tominaga, Y. Conversion of degummed soybean oil to biodiesel fuel with immobilized Candida antarctica lipase. Journal of Molecular Catalysis B- Enzymatic 2002, 17 (3-5), Modi, M. K.; Reddy, J. R. C.; Rao, B. V. S. K.; Prasad, R. B. N. Lipase-mediated conversion of vegetable oils into biodiesel using ethyl acetate as acyl acceptor. Bioresour. Technol. 2007, 98 (6), Bélafi-Bakó, K.; Kovacs, F.; Gubicza, L.; Hancsok, J. Enzymatic biodiesel production from sunflower oil by candida antarctica lipase in a solvent-free system. Biocatal. Biotransform. 2002, 20 (6), Bernardes, O. L.; Bevilaqua, J. V.; Leal, M. C. M. R.; Freire, D. M. G.; Langone, M. A. P. Biodiesel fuel production by the transesterification reaction of soybean oil using immobilized lipase. Applied Biochem. Biotechnol. 2007, 137, Jeong, G. T.; Park, D. H. Lipase-catalyzed transesterification of rapeseed oil for biodiesel production with tert-butanol. Applied Biochem. Biotechnol. 2008, 148 (1-3), Ben Salah, R.; Ghamghui, H.; Miled, N.; Mejdoub, H.; Gargouri, Y. Production of butyl acetate ester by lipase from novel strain of Rhizopus oryzae. J. Biosci. Bioeng. 2007, 103 (4), R-6
277 REFERENCES 141. Huang, Y.; Zheng, H.; Yan, Y. J. Optimization of lipase-catalyzed transesterification of lard for biodiesel production using response surface methodology. Appl. Biochem. Biotechnol. 2010, 160 (2), Li, W.; Du, W.; Liu, D. H. Rhizopus oryzae IFO 4697 whole cell catalyzed methanolysis of crude and acidified rapeseed oils for biodiesel production in tert-butanol system. Process Biochem. 2007, 42 (11), Lee, J. H.; Lee, D. H.; Lim, J. S.; Um, B. H.; Park, C.; Kang, S. W.; Kim, S. W. Optimization of the process for biodiesel production using a mixture of immobilized Rhizopus oryzae and Candida rugosa lipases. J. Microbiol. Biotechnol. 2008, 18 (12), Bloomer, S.; Adlercreutz, P.; Mattiasson, B. Facile synthesis of fatty acid esters in high yields. Enzyme Microb. Technol. 1992, 14, Bloomer, S.; Adlercreutz, P.; Mattiasson, B. Kilogram-scale ester synthesis of acyl donor and use in lipase-catalyzed interesterifications. J. Am. Oil Chem. Soc. 1992, 69 (10), From, M.; Adlercreutz, P.; Mattiasson, B. Lipase catalyzed esterification of lactic acid. Biotechnol. Lett 1997, 19 (4), Shimada, Y.; Watanabe, Y.; Sugihara, A.; Baba, T.; Ooguri, T.; Moriyama, S.; Terai, T.; Tominaga, Y. Ethyl esterification of docosahexaenoic acid in an organic solvent-free system with immobilized Candida antarctica lipase. J. Biosci. Bioeng. 2001, 92, Stamatis, H.; Xenakis, A.; Menge, U.; Kolisis, F. N. Kinetic study of lipase catalyzed esterification reactions in microemulsions. Biotechnol. Bioeng. 1993, 42, Watanabe, Y.; Nagao, T.; Nishida, Y.; Takagi, Y.; Shimada, Y. Enzymatic production of fatty acid methyl esters by hydrolysis of acid oil followed by esterification. J. Am. Oil Chem. Soc. 2007, 84 (11), Reyes, H. R.; Hill, C. G. Jr. Kinetic modeling of inter-esterification reactions catalyzed by immobilized lipase. Biotechnol. Bioeng. 1994, 43 (2), Laane, C.; Boeren, S.; Vos, K.; Veegek, K. Rules for optimization of biocatalysis in organic solvent. Biotechnol. Bioeng. 1987, 30, Villeneuve, P. Lipases in lipophilization reactions. Biotechnol. Adv. 2007, 25, Li, L. L.; Du, W.; Liu, D. H.; Wang, L.; Li, Z. B. Lipase-catalyzed transesterification of rapeseed oils for biodiesel production with a novel organic solvent as the reaction medium. J. Mol. Catal. B: Enzym. 2006, 43 (1-4), Royon, D.; Daz, M.; Ellenrieder, G.; Locatelli, S. Enzymatic production of biodiesel from cotton seed oil using t-butanol as a solvent. Bioresour. Technol. 2007, 98 (3), Kojima, S.; Du, D.; Sato, M.; Park, E. Y. Efficient production of fatty acid methyl ester from waste activated bleaching earth using diesel oil as organic solvent. J. Biosci. Bioeng. 2004, 98, Park, J. Y.; Kim, D. K.; Wang, Z. M.; Lee, J. S. Fast biodiesel production with one-phase reaction. Appl. Biochem. Biotechnol. 2009, 154 (1-3), Dossat, V.; Combes, D.; Marty, A. Continuous enzymatic transesterification of high oleic sunflower oil in a packed bed reactor: influence of the glycerol production. Enzyme Microb. Technol. 1999, 25 (3-5), Cooke, R.; Kuntz, I. D. The properties of water in biological systems. Ann. Rev. Biophys. Bioeng. 1974, 3, Halling, P. J. Solvent selection for biocatalysis in mainly organic systems: predictions of effects on equilibrium position. Biotechnol. Bioeng. 1990, 35, Kaieda, M.; Samukawa, T.; Matsumoto, T.; Ban, K.; Kondo, A.; Shimada, Y.; Noda, H.; Nomoto, F.; Ohtsuka, K.; Izumoto, E.; Fukuda, H. Biodiesel fuel production from plant oil catalyzed by Rhizopus oryzae lipase in a water-containing system without an organic solvent. J. Biosci. Bioeng. 1999, 88 (6), Shimada, Y.; Watanabe, Y.; Samukawa, T.; Sugihara, A.; Noda, H.; Fukuda, H.; Tominaga, Y. Conversion of vegetable oil to biodiesel using immobilized Candida antarctica lipase. J. Am. Oil Chem. Soc. 1999, 76 (7), Talukder, M. M. R.; Puah, S. M.; Wu, J. C.; Won, C. J.; Chow, Y. Lipase-catalyzed methanolysis of palm oil in presence and absence of organic solvent for production of biodiesel. Biocatal. Biotransform. 2006, 24 (4), R-7
278 REFERENCES 163. Goderis, H. L.; Ampe, G.; Feyten, M. P.; Fouwé, B. L.; Guffens, W. M.; van Cauwenbergh, S. M.; Tobback, P. P. Lipase-catalyzed ester exchange reactions in organic media with controlled humidity. Biotechnol. Bioeng. 1987, 30 (2), Kaieda, M.; Samukawa, T.; Kondo, A.; Fukuda, H. Effect of methanol and water contents on production of biodiesel fuel from plant oil catalyzed by various lipases in a solvent-free system. J. Biosci. Bioeng. 2001, 91 (1), Al-Zuhair, S. Production of biodiesel by lipase-catalyzed transesterification of vegetable oils: A kinetics study. Biotechnol. Progr. 2005, 21 (5), Watanabe, Y.; Pinsirodom, P.; Nagao, T.; Kobayashi, T.; Nishida, Y.; Takagi, Y.; Shimada, Y. Production of FAME from acid oil model using immobilized Candida antarctica lipase. J. Am. Oil Chem. Soc. 2005, 82 (11), Chen, Y. M.; Xiao, B.; Chang, J.; Fu, Y.; Lv, P. M.; Wang, X. W. Synthesis of biodiesel from waste cooking oil using immobilized lipase in fixed bed reactor. Energy Convers. Manage. 2009, 50 (3), Du, W.; Wang, L.; Liu, D. H. Improved methanol tolerance during Novozym435-mediated methanolysis of SODD for biodiesel production. Green Chemistry 2007, 9 (2), Richardson, T.; Hyslop, D. B. Enzymes. In Food Chemistry, 2 nd ed.; Fennema, O. R., Ed.; Marcel Dekker: New York, US., 1985; pp Doble, M.; Kruthiventi, A. K.; Gaikar, V. G. Biotransformations and Bioprocesses; Marcel Dekker Inc.: New York, US, 2004.pp Vicente, G.; Martinez, M.; Aracil, J.; Esteban, A. Kinetics of sunflower oil methanolysis. Ind. Eng. Chem. Res. 2005, 44 (15), Bambase, M. E.; Nakamura, N.; Tanaka, J.; Matsumura, M. Kinetics of hydroxide-catalyzed methanolysis of crude sunflower oil for the production of fuel-grade methyl esters. J. Chem. Technol. Biotechnol. 2007, 82 (3), Sandler, S. I. Chemical, Biochemical, and Engineering Thermodynamics; 4th ed.; J. Wiley & Sons: Hoboken, NJ., USA, Mittelbach, M.; Roth, G.; Bergmann, A. Simultaneous gas chromatographic determination of methanol and free glycerol in biodiesel. Chromatographia 1996, 42 (7-8), R-8
279 REFERENCES REFERENCES FOR CHAPTER 3 1. Myint, L. L.; El-Halwagi Process analysis and optimization of biodiesel production from soybean oil. Clean Technol. Environ. Policy 2009, 11 (3), Zhang, Y.; Dube, M. A.; Mclean, D. D.; Kates, M. Biodiesel production from waste cooking oil: 1. Process design and technological assessment. Bioresour. Technol. 2003, 89 (1), Goodrum, J. W.; Geller, D. P.; Lee, S. A. Rapid measurement of boiling points and vapor pressure of binary mixtures of short-chain triglycerides by TGA method. Thermochimica Acta 1998, 311 (1-2), Antczak, M. S.; Kubiak, A.; Antczak, T.; Bielecki, S. Enzymatic biodiesel synthesis - Key factors affecting efficiency of the process. Renewable Energy 2009, 34 (5), Ma, F. R.; Hanna, M. A. Biodiesel production: A review. Bioresour. Technol. 1999, 70 (1), Pramanik, T.; Tripathi, S. Biodiesel clean fuel of the future. Hydrocarbon Process. 2005, 84 (2), Tongboriboon, K.; Cheirsilp, B.; Kittikun, A. Mixed lipases for efficient enzymatic synthesis of biodiesel from used palm oil and ethanol in a solvent-free system. J. Mol. Catal. B: Enzym. 2010, 67 (1-2), Shimada, Y.; Watanabe, Y.; Sugihara, A.; Tominaga, Y. Enzymatic alcoholysis for biodiesel fuel production and application of the reaction to oil processing. J. Mol. Catal. B: Enzym. 2002, 17 (3-5), Sandler, S. I. Chemical, Biochemical, and Engineering Thermodynamics; 4th ed.; J. Wiley & Sons: Hoboken, NJ., USA, Negi, D. S.; Sobotka, F.; Kimmel, T.; Wozny, G.; Schomacker, R. Liquid-liquid phase equilibrium in glycerol-methanol-methyl oleate and glycerol-monoolein-methyl oleate ternary systems. Ind. Eng. Chem. Res. 2006, 45 (10), Belafi-Bako, K.; Kovacs, F.; Gubicza, L.; Hancsok, J. Enzymatic biodiesel production from sunflower oil by candida antarctica lipase in a solvent-free system. Biocatalysis and Biotransformation 2002, 20 (6), Fjerbæk, L.; Christensen, K. V.; Norddahl, B. A review of the current state of biodiesel production using enzymatic transesterification. Biotechnol. Bioeng. 2009, 102 (5), Dossat, V.; Combes, D.; Marty, A. Continuous enzymatic transesterification of high oleic sunflower oil in a packed bed reactor: influence of the glycerol production. Enzyme Microb. Technol. 1999, 25 (3-5), Hernandez-Martin, E.; Otero, C. Different enzyme requirements for the synthesis of biodiesel: Novozym (R) 435 and Lipozyme (R) TL IM. Bioresource Technology 2008, 99 (2), Poling, B. E.; Prausnitz, J. M.; O'Connell, J. P. The Properties of Gases and Liquids; 5th ed.; McGraw-Hill Co., Inc.: Singapore, Fredenslund, Aa.; Jones, R. L.; Prausnitz, J. M. Group-contribution estimation of activity coefficients in nonideal liquid mixtures. AIChE Journal 1975, 21 (6), Elliott, J. R.; Lira, C. T. Introductory Chemical Engineering Thermodynamics; Prentice Hall PTR: New Jersey, Abrams, D. E.; Prausnitz, J. M. Statistical thermodynamics of liquid mixtures: A new expression for the excess gibbs energy of partly or completely miscible systems. AIChE Journal 1975, 21 (1), Gmehling, J.; Li, J. D.; Schiller, M. A modified UNIFAC model.2. Present parameter matrix and results for different thermodynamic properties. Ind. Eng. Chem. Res. 1993, 32 (1), Skjold-Jørgensen, S.; Kolbe, B.; Gmehling, J.; Rasmussen, P. Vapor-liquid-equilibria by UNIFAC group contribution - revision and extension. Ind. Eng. Chem. Process Des. Dev. 1979, 18 (4), Abildskov, J.; Kontogeorgis, G. M.; Gani, R. Models for liquid phase activity coefficients - UNIFAC. In Computer Aided Property Estimation for Process and Product Design, Kontogeorgis, G. M., Gani, R., Eds.; Elsevier B. V.: 2004; Vol. 19, pp R-9
280 REFERENCES 22. Kikic, I.; Alessi, P.; Rasmussen, P.; Fredenslund, A. On the combinatorial part of the UNIFAC and UNIQUAC models. Can. J. Chem. Eng. 1980, 58 (2), Fredenslund, Aa.; Sorensen, J. M. Group contribution estimation methods. In Models for Thermodynamic and Phase Equilibria, Sandler, S. I., Ed.; CRC Press: 1993; pp Fredenslund, Aa. UNIFAC and related group-contribution models for phase-equilibria. Fluid Phase Equilib. 1989, 52, Gmehling, J. Present status and potential of group contribution methods for process development. J. Chem. Thermodyn. 2009, 41 (6), Gmehling, J. Group contribution methods for the estimation of activity-coefficients. Fluid Phase Equilib. 1986, 30, Smith, J. M.; Van Ness, H. C.; Abbott, M. M. Introduction to Chemical Engineering Thermodynamics; 7th ed.; McGraw-Hill Pub. Co.: Singapore, Fredenslund, Aa.; Gmehling, J.; Michelsen, M. L.; Rasmussen, P.; Prausnitz, J. M. Computerized design of multicomponent distillation-columns using UNIFAC group contribution method for calculation of activity-coefficients. Ind. Eng. Chem. Process Des. Dev. 1977, 16 (4), Oishi, T.; Prausnitz, J. M. Solubilities of some volatile polar fluids in copolymers containing vinyl chloride, vinyl acetate, glycidyl methacrylate, and hydroxypropyl acrylate. Ind. Eng. Chem. Fundamen. 1978, 17 (2), Marrero, J.; Gani, R. Group-contribution based estimation of pure component properties. Fluid Phase Equilib. 2001, 183, Hansen, H. K.; Rasmussen, P.; Fredenslund, A.; Schiller, M.; Gmehling, J. Vapor-liquid-equilibria by UNIFAC group contribution.5. Revision and extension. Ind. Eng. Chem. Res. 1991, 30 (10), Larsen, B. L.; Rasmussen, P.; Fredenslund, A. A modified UNIFAC group-contribution model for prediction of phase-equilibria and heats of mixing. Ind. Eng. Chem. Res. 1987, 26 (11), Gmehling, J.; Rasmussen, P.; Fredenslund, A. Vapor-liquid-equilibria by UNIFAC group contribution - revision and extension.2. Ind. Eng. Chem. Process Des. Dev. 1982, 21 (1), Constantinou, L.; Gani, R. New group contribution method for estimating properties of pure compounds. AIChE Journal 1994, 40, Andreatta, A. E.; Casas, L. M.; Hegel, P.; Bottini, S. B.; Brignole, E. A. Phase equilibria in ternary mixtures of methyl oleate, glycerol, and methanol. Ind. Eng. Chem. Res. 2008, 47 (15), Cheng, L. H.; Cheng, Y. F.; Yen, S. Y.; Chen, J. H. Ultrafiltration of triglyceride from biodiesel using the phase diagram of oil-fame-meoh. J. Membr. Sci. 2009, 330 (1-2), Kuramochi, H.; Maeda, K.; Kato, S.; Osako, M.; Nakamura, K.; Sakai, S. Application of UNIFAC models for prediction of vapor-liquid and liquid-liquid equilibria relevant to separation and purification processes of crude biodiesel fuel. Fuel 2009, 88 (8), Maeda, K.; Kuramochi, H.; Fujimoto, T.; Asakuma, Y.; Fukui, K.; Osako, M.; Nakamura, K.; Sakai, S. Phase equilibrium of biodiesel compounds for the triolein plus palmitic acid plus methanol system with dimethyl ether as cosolvent. J. Chem. Eng. Data 2008, 53 (4), Tizvar, R.; Mclean, D. D.; Kates, M.; Dube, M. A. Liquid-liquid equilibria of the methyl oleate-glycerolhexane-methanol system. Ind. Eng. Chem. Res. 2008, 47 (2), Zong, L.; Ramanathan, S.; Chen, C. C. Fragment-based approach for estimating thermophysical properties of fats and vegetable oils for modeling biodiesel production processes. Ind. Eng. Chem. Res. 2010, 49 (2), Espinosa, S.; Fornari, T.; Bottini, S. B.; Brignole, E. A. Phase equilibria in mixtures of fatty oils and derivatives with near critical fluids using the GC-EOS model. J. Supercrit. Fluids 2002, 23 (2), Chang, A. F.; Liu, Y. A. Integrated process modeling and product design of biodiesel manufacturing. Ind. Eng. Chem. Res. 2010, 49 (3), Karaosmanoglu, F.; Cigizoglu, K. B.; Tüter, M.; Ertekin, S. Investigation of the refining step of biodiesel production. Energy & Fuels 1996, 10 (4), Knothe, G.; Van Gerpen, J.; Krahl, J. The Biodiesel Handbook; 2nd ed.; AOCS Press: Champaign, Illinois, USA, R-10
281 REFERENCES 45. Gunstone, F. D.; Harwood, J. L.; Dijkstra, A. J. The Lipid Handbook; 3rd ed.; CRC Press: Boca Raton, FL., Ramos, M. J.; Fernandez, C. M.; Casas, A.; Rodriguez, L.; Perez, A. Influence of fatty acid composition of raw materials on biodiesel properties. Bioresour. Technol. 2009, 100 (1), Lanza, M.; Neto, W. B.; Batista, E.; Poppi, R. J.; Meirelles, A. J. A. Liquid-liquid equilibrium data for reactional systems of ethanolysis at K. J. Chem. Eng. Data 2008, 53 (1), Lidefelt, J.-O. Vegetable Oils and Fats Handbook; 2nd ed.; AAK Academy: Karlshamn, SE, 2007.pp Lindvig, T.; Michelsen, M. L.; Kontogeorgis, G. M. Thermodynamics of paint-related systems with engineering models. AIChE Journal 2001, 47 (11), Magnussen, T.; Rasmussen, P.; Fredenslund, A. UNIFAC parameter table for prediction of liquid-liquid equilibria. Ind. Eng. Chem. Process Des. Dev. 1981, 20 (2), Batista, E.; Monnerat, S.; Stragevitch, L.; Pina, C. G.; Gonçalves, C. B.; Meirelles, A. J. A. Prediction of liquid-liquid equilibrium for systems of vegetable oils, fatty acids, and ethanol. J. Chem. Eng. Data 1999, 44 (6), Fornari, T.; Bottini, S.; Brignole, E. A. Application of UNIFAC to vegetable oil-alkane mixtures. J. Am. Oil Chem. Soc. 1994, 71 (4), Ceriani, R.; Meirelles, A. J. A. Predicting vapor-liquid equilibria of fatty systems. Fluid Phase Equilib. 2004, 215, Ceriani, R.; Goncalves, C. B.; Rabelo, J.; Caruso, M.; Cunha, A. C. C.; Cavaleri, F. W.; Batista, E.; Meirelles, A. J. A. Group contribution model for predicting viscosity of fatty compounds. J. Chem. Eng. Data 2007, 52, Jachmanian, I.; Dobroyan, M.; Moltini, M.; Segura, N.; Irigaray, B.; Veira, J. P.; Vieitez, I.; Grompone, M. A. Continuous lipase-catalyzed alcoholysis of sunflower oil: Effect of phase-equilibrium on process efficiency. J. Am. Oil Chem. Soc. 2010, 87 (1), Liu, X.; Piao, X.; Wang, Y.; Zhu, S. Liquid-liquid equilibrium for systems of (fatty acid ethyl esters + ethanol +soybean oil and fatty acid ethyl esters + ethanol + glycerol). J. Chem. Eng. Data 2008, 53, Shahidi, F. Bailey's Industrial Oil and Fat Products (Edible Oil and Fat Products: Processing Technologies); 6th ed.; J. Wiley & Sons: New York, USA, 2005; Vol Prausnitz, J. M.; Tavares, F. W. Thermodynamics of fluid-phase equilibria for standard chemical engineering operations. AIChE Journal 2004, 50 (4), Oliveira, M. B.; Miguel, S. I.; Queimada, A. J.; Coutinho, J. A. P. Phase equilibria of ester plus alcohol systems and their description with the cubic-plus-association equation of state. Ind. Eng. Chem. Res 2010, 49 (7), Zhou, W.; Boocock, D. G. B. Phase behavior of the base-catalyzed transesterification of soybean oil. J. Am. Oil Chem. Soc. 2006, 12, Cerce, T.; Peter, S.; Weidner, E. Biodiesel-transesterification of biological oils with liquid catalysts: Thermodynamic properties of oil-methanol-amine mixtures. Ind. Eng. Chem. Res. 2005, 44 (25), Chiu, C.-W.; Goff, M. J.; Suppes, G. J. Distribution of methanol and catalysts between biodiesel and glyerin phases. AIChE Journal 2005, 51 (4), Di Felice, R.; De Faveri, D.; De Andreis, P.; Ottonello, P. Component Distribution between Light and Heavy Phases in Biodiesel Processes. Ind. Eng. Chem. Res 2008, 47 (20), França, B. B.; Pinto, F. M.; Pessoa, F. L. P.; Uller, A. M. C. Liquid-Liquid Equilibria for Castor Oil Biodiesel plus Glycerol plus Alcohol. J. Chem. Eng. Data 2009, 54 (9), Lee, M.-J.; Lo, Y.-C.; Lin, H.-M. Liquid-liquid equilibria for mixtures containing water, methanol, fatty acid methyl esters, and glycerol. Fluid Phase Equilib. 2010, 299, Oliveira, M. B.; Teles, A. R. R.; Queimada, A. J.; Coutinho, J. A. P. Phase equilibria of glycerol containing systems and their description with the Cubic-Plus-Association (CPA) Equation of State. Fluid Phase Equilib. 2009, 280 (1-2), Oliveira, M. B.; Queimada, A. J.; Coutinho, J. A. P. Modeling of Biodiesel Multicomponent Systems with the Cubic-Plus-Association (CPA) Equation of State. Ind. Eng. Chem. Res 2010, 49 (3), R-11
282 REFERENCES 68. Oliveira, M. B.; Ribeiro, V.; Queimada, A. J.; Coutinho, J. A. P. Modeling phase equilibria relevant to biodiesel production: A comparison of ge models, cubic EoS, EoS-gE and association EoS. Ind. Eng. Chem. Res 2011, 50 (4), Zhou, H.; Lu, H.; Liang, B. Solubility of multicomponent systems in the biodiesel production by transesterification of Jatropha curcas L. oil with methanol. J. Chem. Eng. Data 2006, 51, Makareviciene, V.; Sendzikiene, E.; Janulis, P. Solubility of multi-component biodiesel fuel systems. Bioresour. Technol. 2005, 96 (5), da Silva, C. A. S.; Sanaiotti, G.; Lanza, M.; Follegatti-Romero, L. A.; Meirelles, A. J. A.; Batista, E. A. C. Mutual solubility for systems composed of vegetable oil + ethanol + water at different temperatures. Journal of Chemical and Engineering Data 2010, 55 (1), Follegatti-Romero, L. A.; Lanza, M.; da Silva, C. A. S.; Batista, E. A. C.; Meirelles, A. J. A. Mutual solubility of pseudobinary systems containing vegetable oils and anhydrous ethanol from ( to ) K. J. Chem. Eng. Data 2010, 55, Batista, E.; Monnerat, S.; Kato, K.; Stragevitch, L.; Meirelles, A. J. A. Liquid-liquid equilibrium for systems of canola oil, oleic acid, and short-chain alcohols. J. Chem. Eng. Data 1999, 44 (6), Sørensen, J. M.; Magnussen, T.; Rasmussen, P.; Fredenslund, A. Liquid-liquid equilibrium data - their retrieval, correlation and prediction.1. Retrieval. Fluid Phase Equilib. 1979, 2 (4), Othmer, D. F.; Tobias, P. E. Tie line correlation. Ind. Eng. Chem. 1942, 34, Abbott, M. M.; Prausnitz, J. M. Phase equilibria. In Handbook of Separation Process Technology, Rousseau, R. W., Ed.; J. Wiley & Sons, Inc.: New York, US., 1987; pp Csernica, S. N.; Hsu, J. T. Reverse-phase ternary phase diagram, tie lines, and plait point for commercial biodiesel-glycerol-methanol. Ind. Eng. Chem. Res. 2011, 50, Shah, M. R.; Yadav, G. D. Prediction of liquid liquid equilibria for biofuel applications by quantum chemical calculations using the Cosmo-SAC method. Ind. Eng. Chem. Res 2011, 50, Mesquita, F. M. R.; Feitosa, F. X.; Sombra, N. E.; de Santiago-Aguiar, R. S.; de Sant'Ana, H. B. Liquidliquid equilibrium for ternary mixtures of biodiesel (soybean or sunflower) + glycerol + ethanol at different temperatures. J. Chem. Eng. Data 2011, 56, Ardila, Y. C.; Pinto, G. M. F.; Machado, A. B.; Maciel, M. R. W. Experimental determination of binodal curves and study of the temperature in systems involved in the production of biodiesel with ethanol. J. Chem. Eng. Data 2010, 55 (11), Oliveira, M. B.; Barbedo, S.; Soletti, J. I.; Carvalho, S. H. V.; Queimada, A. J.; Coutinho, J. A. P. Liquidliquid equilibria for the canola oil biodiesel + ethanol + glycerol system. Fuel 2011, 90, Follegatti-Romero, L. A.; Oliveira, M. B.; Batista, F. R. M.; Batista, E. A. C.; Coutinho, J. A. P.; Meirelles, A. J. A. Liquid liquid equilibria for ternary systems containing ethyl esters, ethanol and glycerol at and K. Fuel Andrade, E. F.; Igarashi-Mafra, L.; Mafra, M. R.; Corazza, M. L. (Liquid + liquid) equilibrium for the system {ethyl stearate(1) + ethanol(2) + glycerol(3)}. J. Chem. Thermodyn. 2012, 47, Machado, A. B.; Ardila, Y. C.; de Oliveira, L. H.; Aznar, M.; Maciel, M. R. W. Liquid-liquid equilibria in ternary and quaternary systems present in biodiesel production from soybean oil at (298.2 and 333.2) K. J. Chem. Eng. Data 2012, 57 (5), Walas, S. M. Liquid-liquid equilibria. In Phase Equilibria in Chemical Engineering, Butterworth- Heinemann Ltd.: Boston, US., 1985; pp Raal, D. R.; Mühlbauer, A. L. Liquid-liquid equilibrium calculations. In Phase Equilibria:Measurement and Computation, Taylor&Francis Pub.: Washington, US., 1998; pp Kontogeorgis, G. M.; Folas, G. K. Activity coefficient models Part 2: local composition models, from Wilson and NRTL to UNIQUAC and UNIFAC. In Thermodynamic Models for Industrial Applications : From Classical and Advanced Mixing Rules to Association Theories, J. Wiley & Sons Ltd.: West Sussex, UK., 2010; pp Renon, H.; Prausnitz, J. M. Local compositions in thermodynamic excess functions for liquid mixtures. AIChE Journal 1968, 14 (1), Tsuboka, T.; Katayama, T. Modified Wilson equation for vapor-liquid and liquid-liquid equilibria. J. Chem. Eng. Jpn. 1975, 8 (3), R-12
283 REFERENCES 90. Draper, N. R.; Smith, H. Applied Regression Analysis; 3rd ed.; J. Wiley & Sons, Inc.: New York, Kontogeorgis, G. M.; Folas, G. K. Quantum chemistry in engineering thermodynamics. In Thermodynamic Models for Industrial Applications : From Classical and Advanced Mixing Rules to Association Theories, J. Wiley & Sons Ltd.: West Sussex, UK., Klamt, A.; Schüürmann, G. COSMO: a new approach to dielectric screening in solvents with explicit expressions for the screening energy and its gradient. J. Chem. Soc., Perkin Trans , (5), Schafer, A.; Klamt, A.; Sattel, D.; ohrenz, J. C. W.; ckert, F. COSMO implementation in TURBOMOLE: Extension of an efficient quantum chemical code towards liquid systems. Phys. Chem. Chem. Phys. 2000, 2 (10), Eckert, F. COSMOtherm Users Manual - Version C2.1 Release 01.11a; COSMOlogic GmbH & Co. KG: Leverkusen, Germany, Klamt, A. Conductor-like screening model for real solvents: a new approach to the quantitative calculation of solvation phenomena. J. Phys. Chem. 1995, 99 (7), Lin, S.-T.; Sandler, S. I. A Priori Phase Equilibrium Prediction from a Segment Contribution Solvation Model. Ind. Eng. Chem. Res. 2002, 41, Klamt, A. The basic COSMO-RS. In COSMO-RS: From Quantum Chemistry to Fluid Phase Thermodynamics and Drug Design, Elsevier Science Ltd.: Amsterdam, The Netherlands, 2005; pp Klamt, A.; Jonas, V.; Bürger, T.; Lohrenz, J. C. W. Refinement and parametrization of COSMO-RS. J. Phys. Chem. A 1998, 102 (26), Schäfer, A.; Klamt, A.; Sattel, D.; Lohrenz, J. C. W.; Eckert, F. COSMO Implementation in TURBOMOLE: Extension of an efficient quantum chemical code towards liquid systems. Phys. Chem. Chem. Phys. 2000, 2, Eckert, F. COSMOtherm Users Manual - Version C3.0 Release 12.01; COSMOlogic GmbH & Co. KG: Leverkusen, Germany, Klamt, A.; Reinisch, J.; Eckert, F.; Hellweg, A.; Deidenhofen, M. Polarization charge densities provide a predictive quantification of hydrogen bond energies. Phys. Chem. Chem. Phys. 2012, 14, Klamt, A. Prediction of the mutual solubility of hydrocarbons and water with COSMO-RS. Fluid Phase Equilib. 2003, 206, Klamt, A.; Eckert.F. Prediction of vapor liquid equilibria using COSMOtherm. Fluid Phase Equilib. 2004, 217, Klamt, A.; Eckert.F. Prediction, fine tuning, and temperature extrapolation of a vapor liquid equilibrium using COSMOtherm. Fluid Phase Equilib. 2007, 260, Dell'Era, C.; Zaytseva, A.; Uusi-Kyyny, P.; Pokki, J.-P.; Pakkanen, M.; Aittamaa, J. Vapour liquid equilibrium for the systems butane + methanol, +2-propanol, +1-butanol, +2-butanol, +2- methyl-2-propanol at K. Fluid Phase Equilib. 2007, 254, Ramsauer, B.; Neueder, R.; Kunz, W. Isobaric vapour-liquid equilibria of binary 1-propoxy-2-propanol mixtures with water and alcohols at reduced pressure. Fluid Phase Equilib. 2008, 272, Güzel, G.; Xu, X. Phase equilibria (LLE and VLE) of refining operations for enzymatic biodiesel production via quantum mechanical COSMO-RS method (DOI: /aic.13731). AIChE Journal Wang, T.; Briggs, J. L. Rheological and thermal properties of soybean oils with modified FA compositions. J. Am. Oil Chem. Soc. 2002, 79 (8), Lide, D. R. The CRC Handbook of Chemistry and Physics; 90 th ed.; CRC Press: Boca Raton, FL. / USA, Marrone, L.; Pasco, L.; Moscatelli, D.; Gelosa, S. Liquid-liquid phase equilibrium in glycerol-methanolfatty acids systems (presented at the 8th International Conference on Chemical and Process Engineering - ICheaP-8 - Ischia Island/IT.) Quinlan, P.; Moore, S. Modification of triglycerides by lipases: Process technology and its application to the production of nutritionally improved fats. Inform 1993, Stamatis, H.; Xenakis, A.; Menge, U.; Kolisis, F. N. Kinetic study of lipase catalyzed esterification reactions in microemulsions. Biotechnol. Bioeng. 1993, 42, R-13
284 REFERENCES 113. Follegatti-Romero, L. A.; Oliveira, M. B.; Batista, E. A. C.; Coutinho, J. A. P.; Meirelles, A. J. A. Liquid liquid equilibria for ethyl esters + ethanol + water systems: Experimental measurements and CPA EoS modeling. Fuel 2012, 96, He, B. B.; Thompson, J. C.; Routt, D. W.; Van Gerpen, J. H. Moisture absorption in biodiesel and its petro-diesel blends. Appl. Eng. Agric. 2007, 23 (1), Oliveira, M. B.; Varanda, F. R.; Marrucho, I. M.; Queimada, A. J.; Coutinho, J. A. P. Prediction of water solubility in biodiesel with the CPA equation of state. Ind. Eng. Chem. Res 2008, 47 (12), Oliveira, M. B.; Pratas, M. J.; Queimada, A. J.; Coutinho, J. A. P. Another look at the water solubility in biodiesels: Further experimental measurements and prediction with the CPA EoS. Fuel 2012, 97, Follegatti-Romero, L. A.; Lanza, M.; Batista, F. R. M.; Oliveira, M. B.; Coutinho, J. A. P.; Meirelles, A. J. A. Liquid-liquid equilibrium for ternary systems containing ethyl esters, anhydrous ethanol and water at , , and K. Ind. Eng. Chem. Res. 2010, 49 (24), PRO/II v. 9.0 Process Simulation Software - Invensys Systems, Inc. TX,USA. Unpublished Work, R-14
285 REFERENCES REFERENCES FOR CHAPTER 4 1. Bucalá, V.; Foresti, M. L.; Trubiano, G.; Briozzo, M.; Bottini, S. Analysis of solvent-free ethyl oleate enzymatic synthesis at equilibrium conditions. Enzyme Microb. Technol. 2006, 38 (7), Jensen, K. L.; Datta, R. Ethers from ethanol. 1. Equilibrium thermodynamic analysis of the liquid-phase ethyl tert-butyl ether reaction (ETBE). Ind. Eng. Chem. Res. 1995, 34 (1), Sandoval, G.; Condoret, J. S.; Monsan, P.; Marty, A. Esterification by immobilized lipase in solvent-free media: Kinetic and thermodynamic arguments. Biotechnol. Bioeng. 2002, 78 (3), Antczak, T.; Hiler, D.; Krystynowicz, A.; Bielecki, S.; Galas, E. Mathematical modelling of ester synthesis by lipase in biphasic system. J. Mol. Catal. B: Enzym. 2001, 11 (4-6), Martinek, K.; Klibanov, A. M.; Goldmacher, V. S.; Tchernysheva, A. V.; Mozhaev, V. V.; Berezina, I. V.; Glotov, B. O. The principles of enzyme stabilization: II. Increase in the thermostability of enzymes as a result of multipoint noncovalent interaction with a polymeric support. Biochim. Biophys. Acta, Enzymol. 1977, 485 (1), Smith, W. R.; Missen, R. W. Chemical Reaction Equilibrium Analysis: Theory and Algorithm; Krieger Pub. Co.: Malabar, FL., Thermophysical properties of 'fatty' substances Freedman, B.; Bagby, M. O. Heats of combustion of fatty esters and triglycerides. J. Am. Oil Chem. Soc. 1989, 65 (11), Design Institute for Physical Properties Research (DIPPR), American Institute of Chemical Engineers, Project 801 ( Osmont, A.; Catoire, L.; Gökalp, I. Thermochemistry of methyl and ethyl esters from vegetable oils. Int. J. Chem. Kinet. 2007, 39 (9), Constantinou, L.; Gani, R. New group contribution method for estimating properties of pure compounds. AIChE Journal 1994, 40, Marrero, J.; Gani, R. Group-contribution based estimation of pure component properties. Fluid Phase Equilib. 2001, 183, Rogers, D. W.; Hoyte, O. P. A.; Ho, R. K. C. Heats of hydrogenation of large molecules. Part 2. Six unsaturated and polyunsaturated fatty acids. J. Chem. Soc. Faraday Trans , 74 (46), Dean, J. A. Lange's Handbook of Chemistry; 15 th ed.; McGraw-Hill Professional: New York, USA, Lide, D. R. The CRC Handbook of Chemistry and Physics; 90 th ed.; CRC Press: Boca Raton, FL. / USA, Silbert, L. S.; Daubert, B. F.; Mason, L. S. The heats of combustion, formation, and isomerization of isomeric monoglycerides. J. Phys. Chem. 1965, 69 (9), Diks, R. M. M. Production and modification of acylglycerides. In Handbook of Food Enzymology, Whitaker, J. R., Voragen, A. G. J., Wong, D. W. S., Eds.; CRC Press: New York, USA, 2003; pp Martin, J. B. The equilibrium between symmetrical and unsymmetrical monoglycerides and determination of total monoglycerides. J. Am. Chem. Soc. 1953, 75 (22), Kay, W. B. Density of hydrocarbon gases and vapors at high temperature and pressures. Ind. Eng. Chem. 1936, 28 (9), Poling, B. E.; Prausnitz, J. M.; O'Connell, J. P. The Properties of Gases and Liquids; 5th ed.; McGraw-Hill Co., Inc.: Singapore, Kolská, Z.; Ružicka, V.; Gani, R. Estimation of the enthalpy of vaporization and the entropy of vaporization for pure organic compounds at K and at normal boiling temperature by a group contribution method. Ind. Eng. Chem. Res. 2005, 44 (22), Joback, K. G.; Reid, R. C. Estimation of pure-component properties from group contributions. Chem. Eng. Comm. 1987, 57, Myint, L. L.; El-Halwagi Process analysis and optimization of biodiesel production from soybean oil. Clean Technol. Environ. Policy 2009, 11 (3), R-15
286 REFERENCES 24. Silva, L. Y. A.; Falleiro, R. M. M.; Meirelles, A. J. A.; Krahenbuhl, M. A. Vapor-liquid equilibrium of fatty acid ethyl esters determined using DSC. Thermochim. Acta 2011, 512 (1-2), Morad, N. A.; Kamal, M. A. A.; Panau, F.; Yew, T. W. Liquid specific heat capacity estimation for fatty acids, triacylglycerols, and vegetable oils based on their fatty acid composition. J. Am. Oil Chem. Soc. 2000, 77 (9), Kolská, Z.; Kukal, Z.; Zábranský, M.; Ružicka, V. Estimation of the heat capacity of organic liquids as a function of temperature by a three-level group contribution method. Ind. Eng. Chem. Res. 2008, 47 (6), Righetti, M. C.; Salvetti, G.; Tombari, E. Heat capacity of glycerol from 298 to 383 K. Thermochim. Acta 1998, 316, Gautam, R.; Seider, W. D. Computation of phase and chemical equilibrium: Part II - Phase-splitting. AIChE Journal 1979, 25 (6), Gmehling, J.; Kolbe, B.; Kleiber, M.; Rarey, J. Enthalpy of Reaction and Chemical Equilibria. In Chemical Thermodynamics: for Process Simulation, Wiley-VCH Verlag & Co. KGa.A: Weinheim, DE., 2012; pp Sandler, S. I. Chemical, Biochemical, and Engineering Thermodynamics; 4th ed.; J. Wiley & Sons: Hoboken, NJ., USA, Sotoft, L. F.; Westh, P.; Christensen, K. V.; Norddahl, B. Novel investigation of enzymatic biodiesel reaction by isothermal calorimetry. Thermochim. Acta 2010, 501 (1-2), Michelsen, M. L.; Mollerup, J. M. Thermodynamic Models: Fundamentals & Computational Aspects; 2nd ed.; Tie-Line Publications: Holte, DK., Blum, W. Preparation of inert and high-temperature stable apolar and medium polar glass-capillary columns using OH-terminated polysiloxane stationary phases. J. High. Resolut. Chromatogr. 1985, 8 (11), Blum, W. Preparation of glass capillary columns coated with immobilized OV-240-OH (33% cyanopropyl substituted, OH-terminated). An approach to improve the inertness and thermal stability of cyanoalkyl polysiloxane coatings. J. High. Resolut. Chromatogr. 1986, 9 (6), Aoyama, T.; Yashiro, T. Analytical study of low-concentration gases: III.Determination of lower fatty acids and their trimethylsilyl esters in air by gas chromatography. J. Chromatogr. A 1983, 265, Nielsen, P. M.; Brask, J.; Fjerbæk, L. Enzymatic biodiesel production: Technical and economical considerations. Eur. J. Lipid Sci. Technol. 2008, 110 (8), Turkan, A.; Kalay, S. Monitoring lipase-catalyzed methanolysis of sunflower oil by reversed-phase highperformance liquid chromatography: Elucidation of the mechanisms of lipases. Journal of Chromatography A 2006, 1127 (1-2), Rossi, C. C. R. S.; Berezuk, M. E.; Cardozo-Filho, L.; Guirardello, R. Simultaneous calculation of chemical and phase equilibria using convexity analysis. Comput. Chem. Eng. 2011, 35 (7), Sanderson, R. V.; Chien, H. H. Y. Simultaneous chemical and phase equilibrium calculation. Ind. Eng. Chem. Process Des. Dev. 1973, 12 (1), Smejkal, Q.; Smejkalová, L.; Kubicka, D. Thermodynamic balance in reaction system of total vegetable oil hydrogenation. Chem. Eng. J. 2009, 146 (1), Stamatis, H.; Voutsas, E. C.; Delimitsou, C.; Kolisis, F. N.; Tassios, D. Enzymatic production of alkyl esters through lipase-catalyzed transesterification reactions in organic solvents: Solvent effects and prediction capabilities of equilibrium conversions. Biocatal. Biotransform. 2000, 18 (4), Vonka, P.; Leitner, J. Calculation of chemical equilibria in heterogeneous multicomponent systems. Calphad 1995, 19 (1), McDonald, C. M.; Floudas, C. A. Decomposition based and branch and bound global optimization approaches for the phase equilibrium problem. J. Global Optim. 1994, 5 (3), Gregersen, S. B. Thermodynamic analysis of transesterification of soybean oil for biodiesel production. Master of Science Thesis - Department of Molecular Biology - Aarhus University, Århus /Denmark, Aug Voll, F. A. P.; da Silva, C.; Rossi, C. C. R. S.; Guirardello, R.; de Castilhos, F.; Oliveira, J. V.; Cardozo-Filho, L. Thermodynamic analysis of fatty acid esterification for fatty acid alkyl esters production. Biomass & Bioenergy 2011, 35 (2), R-16
287 REFERENCES 46. Krisnangkura, K.; Simamaharnnop, R. Continuous transmethylation of palm oil in an organic solvent. J. Am. Oil Chem. Soc. 1992, 69 (2), Tongboriboon, K.; Cheirsilp, B.; Kittikun, A. Mixed lipases for efficient enzymatic synthesis of biodiesel from used palm oil and ethanol in a solvent-free system. J. Mol. Catal. B: Enzym. 2010, 67 (1-2), R-17
288 APPENDIX 2
289
290 APPENDICES A. APPENDICES Appendix 2-1 Biodiesel Standards Biodiesel fuels require the near-complete conversion of acylglycerides and FFA in the feedstocks to alkyl esters independent of the method used for production. It is a necessary feature, because even low residues of these species reduce the performance characteristics and handling of the fuel. Failure to attain specified values of these species during reactions requires cumbersome purification operations that further increase the cost of the fuel. Even after complete conversion, small amounts of acylglycerides will remain in the final biodiesel product. There exist strict standards developed for the maximum allowable levels of these species. Because the glycerol portion of the oil feedstocks is typically ca wt. %, this level of total glycerol corresponds to 97.7% reaction completion. For about 4 liter of FAME formed, approximately 0.3 kg of crude glycerol is produced. 1 EN standards specifies a maximum residual level of free and bound glycerol of 0.25 wt. % for B100 (neat) biodiesel (ASTM D6751 specifies max. of 0.24 wt. %) as measured using a gas chromatographic (GC) method described in EN (ASTM D6584) standard. Only the GC procedures are currently acceptable for demonstrating compliance with standards. Besides, both standards specify a maximum acid number of 0.5 mg KOH per gram for FFA in final product. Specifications of these standards were presented in Table A EN In 2003, Comité Européen de Normalisation (CEN) set the European standard for FAME used as automotive fuel which is known under the standard number EN Allowable limits and measurement methods of biodiesel (FAME) are set by this standard for B100 and its blends with diesel fuel. The CEN standard for diesel fuel (EN 590) entails that all biodiesel blended in the fuel must conform to the standard EN At present, the EU diesel fuel allows a maximum of 5 v. % (B5) blend of biodiesel. However, in Germany, for instance, it is allowed biodiesel to be distributed as a neat fuel for specially adapted vehicles. The CEN is presently revising the EN 590 specification for diesel fuel to be blended with up to 10% of biodiesel. The extension of EN is also expected to include a wide range of feedstocks and fatty acid ethyl esters as biodiesel, without compromising the security of vehicles using this product either in blends or as a neat fuel. A-1
291 APPENDICES Table A2-1 Standard specifications of biodiesel (FAME) fuel according to ASTM 6751 and EN Property ASTM 6751 (v.2009) EN (v. 2008) Units Ca and Mg, combined 5 max. 5 max. ppm (µg/g) Flash point (closed cup) 93 min. 101 min. o C Alcohol control 1- MeOH content 0.20 max max. wt. % 2-Flash point 130 min. - Water & Sediment max max. v. % Kinematic 40 o C mm 2 /s Sulfated ash max max. wt. % Sulfur (15 ppm or lower level) max max. wt. % (ppm) Copper strip corrosion No. 3 max. No. 1 Cetane number 47 min. 51 min. Cloud point Report - o C Carbon residue 0.05 max. 0.3 max. wt. % Acid number 0.50 max. 0.5 max. mg KOH/g Cold soak filterability 360 max. seconds Free glycerol max max. wt. % Total glycerol 0.24 max max. wt. % Phosphorous content 0.01 max max. wt. % Distillation temp., atm equiv. temp., 90% recoverd 360 max. o C Sodium and potassium, combined 5 max. 5 max. ppm (µg/g) Oxidation stability 3 minimum 6 minimum h Density (15 o C) g/cm 3 Total contamination - 24 max. mg/kg Ester content min. wt. % Monoglycerides max. wt. % Diglycerides max. wt. % Triglycerides max. wt. % Iodine Value (IV) max. - Methyl linoenate - 12 max. wt. % Polyunsaturation (4 or more double bond) - 1 max. wt. % A-2
292 APPENDICES Appendix Calibration Functions for Calculation of Glycerol and Glycerides Composition Calibration models were prepared according to the procedures prescribed in the DS/EN (2003) (Fat and oil derivatives Fatty Acid Methyl Esters (FAME) Determination of free and total glycerol and mono-, di-, triglyceride contents) and ASTM D (Standard Test Method for Determination of Free and Total Glycerin in B-100 Biodiesel Methyl Esters by Gas Chromatography) standards. Parameters of calibration functions were given in Table A2-2 accompanied by respective adjusted R 2 values. Respective calibration curves were illustrated in Fig. A2-1 to A2-4 for glycerol, mono-, di-, and tri-glycerides Glycerol Calibration Function Calibration function is obtained from the experimental data using the linear regression method. Free glycerol calibration function is given in the expression (A-1): M G M IS 1 = a G A G A IS 1 + b G (A-1) where M G : Glycerol amount (mg) M IS 1 : Internal Standard 1 amount (mg) A G : The peak area of glycerol A IS 1 : The peak area of the IS-1 a G, b G : Equation coefficient and constant coming from linear regression method for glycerol, respectively Glycerides Calibration Function Calibration function for glycerides obtained from experimental data is given below as in the expression (A-2): M XG M IS 2 = a XG A XG A IS 2 + b XG (A-2) where XG stands for mono-, di- or tri-glycerides and M XG : Acylglycerides amount (mg); M IS 2 : The amount of Internal Standard 2 (mg); A XG : The peak area of acylglycerides; A IS 2 : The peak area of the IS-2; A-3
293 APPENDICES a XG, b XG : Equation coefficient and constant coming from linear regression method for acylglycerides, respectively Percentage Calculations of Glycerol and Glycerides The percentage (mass / mass) calculation of free glycerol and acylglycerides in the sample are done using the expressions (A-3) and (A-4), respectively: G % = a G A G + b A G M IS (A-3) IS 1 M XG % = a XG A XG + b A XG M IS (A-4) IS 2 M where A XG : The sums of the peak areas of acylglycerides G %: Stands for free glycerol percentage; XG %: Stands for mono-, di- or tri-glycerides percentages; M : The mass of sample (mg). Total glycerol percentage is calculated as follows: G T = Free Glycerol + Bound Glycerol G T = G% + 0,255. MG% + 0,146. DG% + 0,103. TG% (A-5) (A-6) where G T : Total glycerol percentage in the sample (mass/mass); G% : Free glycerol percentage in the sample (mass/mass); MG%, DG%, TG% : Acylglyceride percentages in the sample (mass/mass). 2. Calibration Function for Calculation of Ethanol Composition Analogously, ethanol amount is calculated as follows. Parameter values of calibration function were given in Table A2-2. The calibration curve of ethanol was depicted in Fig. A2-5. M EtOH M IS e = a EtOH A EtOH A IS e + b EtOH (A-7) where EtOH stands for ethanol M EtOH : Ethanol amount (mg); M IS e : The amount of Internal Standard-e (n-propanol) (mg); A EtOH : The peak area of ethanol; A-4
294 APPENDICES A IS e : The peak area of the IS-e (1-propanol); a EtOH, b EtOH : Equation coefficient and constant coming from linear regression method for ethanol, respectively. Table A2-2 Parameter values and adjusted correlation coefficients for calibration functions. y = ax + b a b Adj. R 2 Glycerol MAG DAG TAG EtOH Figure A2-1 Calibration curve of free glycerol accompanied by linear regression line and 95% CI. Figure A2-2 Calibration curve of monoacylglycerides (MAG) accompanied by linear regression line and 95% CI. A-5
295 APPENDICES Figure A2-3 Calibration curve of diacylglycerides (DAG) accompanied by linear regression line and 95% CI. Figure A2-4 Calibration curve of triacylglycerides (TAG) accompanied by linear regression line and 95% CI. Figure A2-5 Calibration curve of ethanol (EtOH) accompanied by linear regression line and 95% CI. A-6
296 APPENDICES Appendix 2-3 Some GC-FID Chromatograms of FAEE and Acylglyceride Species Figure A2-6 Reference chromatogram of a calibration sample. Figure A2-7 Reference chromatograms obtained for monoacylglycerides mixture. A-7
297 APPENDICES Figure A2-8 A sample chromatogram at 6 th hours of reaction course for 3:1 (mole/mole) ethanol to soybean oil feed ratio with 5 wt. % (based on weight of oil feed) immobilized CALB (Novozym 435). A-8
298 APPENDIX 3
299
300 APPENDICES Appendix 3-1 Supplementary Data 1. Phase-Split Phenomenon Ideal solutions or solutions exhibiting negative deviation from ideal behavior cannot form two liquid phases. However, if the components exhibit positive deviations from ideal solution behavior, the single-phase solutions separate into two distinct phases. Therefore, a strong positive deviation is always necessary for two or more liquid phases to exist together. Deviations from ideal behavior occur when there is a marked difference in the molecular structure of the participating species. In very non-ideal mixtures the species activity coefficients can be large, so that the two species will be relatively insoluble. 3 Besides, as a typical characteristic of non-ideal systems, the activity coefficients vary considerably with composition. The change of activity coefficient value with respect to composition is illustrated in Fig. S-1 for ideal and non-ideal systems. Figure S-1 Deviation from ideal behavior as a function of concentration is measured by the value of activity coefficient,γ i. The effective mole fraction (activity, a i ) becomes equal to true mole fraction (x i ) for γ i = 1. The true or absolute stability of separated phases is characterized by equality of chemical potentials of individual components of mixtures in each phase. In other words, a state of equilibrium is characterized as having a minimum Gibbs free energy (GfE) at a given T, P, and composition. The change in GfE for a transfer of n i moles of a substance between two phases at the same T and P can be given by Eq.(1): G = Phase I µ i µ n i Phase II i (1) At a thermodynamic equilibrium GfE is at a minimum G =0 and thus, A-9
301 APPENDICES Phase I Phase II µ µ i = i for i= 1,, N (2) For a binary mixture the molar GfE (or chemical potential) is given as follows: dg = µ dx + µ dx (3) Applying this equation to each phase and using dx = dx condition gives: 1 2 dg ( ) dx 2 = µ µ and Phase I Phase I Phase I 2 1 dg ( ) dx 2 = µ µ (4) Phase II Phase II Phase II Phase I Phase II Phase I Phase II The equilibrium condition requires that µ = µ and µ = µ. When these equalities substituted into either of the above equations, the result is the common tangent condition: dg dg = (5) dx Phase I Phase II ( ) ( ) dx 2 2 Alternative but analogous mathematical expression of phase split phenomenon can be described by Eq. (6). This condition is called as liquid-liquid equilibrium (LLE) condition -or more generally isoactivity condition- where the activity (a i = γ i x i ) of each component distributed between the equilibrated phases is equal to each other. Phase I Phase II { } γ x { } Phase I [ γ x [ i i i i Phase II ] ( TP,, x ) = ] ( TP,, x ) for every component i = 1, 2,, n (6) Phase I and Phase II superscripts in Eq. (6) refer to the two equilibrated liquid phases. Eq. (5) states that the equilibrium concentrations of two coexisting phases in a binary system are the points on the GfE of mixing curves that are tangent to the same straight line. This rule is called as double tangent or common tangent rule. It states that when the composition of a non-ideal binary mixture in a graph (the phase space hypersurface in a multicomponent mixture) of g [ = x ln( γ x ) ] versus x i is between i i i I x i and mixing II x i, there are two separate phases, I and II, that are in equilibrium with each other. The equilibrium compositions of these coexisting phases lie at the points of double tangency or co-tangency (a hyperplane tangent in a multicomponent mixture). It is worth noting that the condition of co-tangency is a necessary one for defining the compositions of equilibrium phases, but is not sufficient since a given Gibbs energy plot may have several such double tangents. 4,5 Further mathematical details of excess GfE and GfE of mixing were outlined in Section A of Appendix Binodal and Spinodal Curves A simple mathematical analysis (second derivative of three situations: g mixing wrt x i ) of such a function generates A-10
302 2 g x 2 g mixing 2 i x 2 g mixing 2 i x mixing 2 i < 0 unstability = 0 inflection (spinodal) points > 0 metastability APPENDICES (7) In order to observe two or more coexisting phases, g mixing needs to be a concave function between the 2 inflection points. The mathematical condition for concavity can be expressed by Eq. (8) and (9): G = 0 x (8) 2 G < x 2 0 (9) This condition of concavity, 2 gmixing < x 0 2 i, requires that at least some of the terms of the second excess G derivatives of g = + x ln x mixing be negative. 5 The immiscibility and, thus, phase separation i i RT will occur if there are values of composition that satisfy these conditions. In other words, if the mole fraction of the mixture falls within the unstable region, spontaneous phase separation occurs when going from one-phase to the two-phase region. 2 g mixing As mentioned above, the compositions at which the second derivatives are zero ( = 0 ) are 2 xi the inflection points (spinodal points). There is no thermodynamic driving force on a spinodal point (spinode) to either drive the mixture to a macroscopic phase separation or oppose composition fluctuations. The mathematical condition is expressed by Eq.(10): 2 µ µ i i 2 x x i i or = = G G = = 0 x x 2 3 i i (10) 2 g mixing lna i Since the mixture is unstable ( < 0 or < 0 2 x ) within the area bounded by spinodal x i T, P i T, P curves, separation into two phases will be instantaneous. The spinodal and binodal curves (phase boundaries) of EtLn glycerol binary system accompanied by the change in activity of EtLn species against its composition were illustrated in Fig. S-2 for different T values. A-11
303 APPENDICES Figure S-2 Spinodal and binodal curves of EtLn Glycerol binary system simulated using COSMO-RS method (COSMOtherm v. C2.1_01.11 with BP-TZVP parameterization) at several T values. The activity (a EtLn ) of EtLn in binary mixture reaches to a minimum and a maximum point which defines the spinodal curve or unstability boundary lines. As is seen in Fig. S-2 and S-3, two spinodal curves bound the domain of instability where the mixture is completely unstable within the spinodal domain. In fact, a component always tends to diffuse to regions where it has a higher concentration. As a result, the demixing of systems occurs spontaneously within this zone; the mixture splits in two parts. In Fig. S-2, there are two phases one with a high mole fraction of EtLn at RHS, and at LHS with a low mole fraction of EtLn species (red lines in Fig. S-2). Outside of the spinodal zone there is always a boundary of the demixing zone: the outer binodal curves are the limit of true stability. Spinodal zone is bounded by two super-saturation zones which are located between the two binodal and spinodal curves. Mixtures with a composition in such a zone can exist indefinitely, but they are metastable. For a multicomponent mixture the condition of metastable equilibrium is characterized thermodynamically by the statement ( ) > 0 2 g mixing 2 TPn,,. A phase separation may or may j i xi not occur immediately depending on the presence or absence of nuclei 5 : Any disturbance tends split them into two liquids with compositions on the binodal curve (or phase boundaries). The binodal and spinodal curves for a series of FAEE species simulated for their binary mixtures with glycerol at 303 K by means of quantum chemical COSMO-RS method were illustrated in Fig. S-3. It was observed that the size of metastable (super-saturation) zones depends strictly on the FAEE species. The overlapping of spinodal and binodal curves in glycerol rich phase of EtOl-glycerol binary mixture in glycerol rich phase seems to be a numerical calculation problem encountered with BP-TZVP parameterization (Becke-Perdew (BP) functional for density functional theory calculations with a triple valence plus polarization function (TZVP) basis set). A-12
304 APPENDICES Figure S-3 Spinodal and binodal curves of FAEE glycerol binary systems (containing single FAEE species + glycerol) simulated using COSMO-RS method (COSMOtherm v. C2.1_01.10 with BP-TZVP parameterization) at K Determination of LLE and Compositions of Phases As mentioned above, two general approaches are stated to fulfill the requirement of quantifying the compositions of phases in equilibrium. The first and relatively reliable one is the experimental way and the other is using appropriate correlative or predictive thermodynamic models. For the former one it is necessary to have high purity components with precisely constructed experimental setups. Often there is comparatively large discrepancy between equilibrium data reported by different researchers for the same system. For these reasons, the experimental way is rather rigorous and not always conceivable. Alternatively, thermodynamic behavior of mixtures can be characterized by mathematical expressions relating the thermodynamic property changes of mixing, namely modeling of thermodynamic property changes (see Section A of Appendix 3-1). The mixture of species in different chemical nature, size and shape are excellently described by excess Gibbs free energy based activity coefficient models, 3,6 and that is also the case in biodiesel production systems Correlative thermodynamic models, such as UNIQUAC and NRTL, are predominantly applied for the calculation of liquid phase activity coefficients and phase equilibria of the non-ideal systems. Two general approaches can be mentioned about the determination of LLE and quantification phase compositions by means of thermodynamic models: the constrained minimization of GfE of mixing and the iterative function methods based on the conservation of mass equations and isoactivity criterion. It is worth mentioning that the minimization GfE of mixing methods are more eligible than the iterative function methods. 13 Since, in case of the GfE minimization methods the minimum GfE is also achieved in addition to iso-activity condition and the conservation of mass equations. At this point, it should be pointed out that the function being minimized needs to be a concave function and the solution needs to be over a concave feasible region so as to obtain an optimal solution that represents the global solution. As reported by Sofyan and coworkers 13, if the number and types of phases present at a certain T, P, and composition can be determined in advance, it might be preferable and practical using iterative function method than GfE minimization methods. In other words, the iterative function methods result with the correct global solution when the number and type of phases involved known a priori. However, the requirements of appropriate initial guesses for equilibrium constants or mole fractions are still valid. The GfE minimization methods have been mentioned in Chapter 4. A-13
305 APPENDICES The stability of phases can be deduced by seeking the minima of the tangent-plane distance function. The tangent-plane distance function TPD(z) described by Michelsen and Møllerup 4 is necessary and sufficient condition for the stability of a mixture: N ( ) = ( ( ) ( )) TPD z z µ z µ α (11) i= 1 i i i where z pertains to global composition vector in an N-component mixture at specified T and P and α refers to any trial phase composition vector that might encounter a phase separation. The nonnegativity of TPD(z) function for any trial phase composition z is necessary and sufficient condition for a mixture to be stable. In other words, a phase is unstable if and only if the tangent plane intersects the GfE of mixing surface where the TPD function has a negative value. The tangent-plane distance can be expressed in terms of mole fractions by Eq.(12): N g mixing TPD( x) = g ( x) g ( x ) mixing mixing ( x x i, z i, ) z α (12) α x A-14 i= 1 i A reduced and modified form of TPD (tpd m ) 4,14 in terms of the activity of species (a i ) in a mixture which has practical use can be defined as in Eq.(13): N ( ln ln ) tpd = x a a (13) m i, z i, z i,α i= 1 The extrema (or saddle points) in the GfE of mixing surface for a system, called as stationary points, which determine the tangent-plane distances are the results of solving a minimization problem or an equivalent non-linear equations set. In alcoholysis (transesterification) reactions involving neat vegetable oils or waste/used vegetable oils as the acyl donor and excess amount of absolute or rectified EtOH as the acyl acceptor, the phase separation forming two liquid phases is an obvious fact which is known a priori. The latter case also involves mostly biphasic hydrolysis, and esterification reactions as the side reactions. Therefore, the determination of the phase stability which is used to control whether a mixture at certain T, P and compositions can split into multiple phases is not a vital step in phase equilibrium calculations performed throughout of this study. On the other hand, a phase-split analysis is essential in the simulation of LLE phase behavior by means of such (activity coefficient) models in order to determine the composition and fraction of each phase in equilibrium. The Newton-Raphson method 4,5,13,15 (see also Chapter 4) was preferred to solve the nonlinear equation sets for stationary points where the points found are taken as the initial mole fraction guesses for the for phase-split calculations, because of its speed of convergence and simplicity. In overall, an algorithm based on iterative function method combining phase stability analysis 4,14 and a convenient phase check procedure 16 (a modified form of Algorithm III reported by Sofyan et al. 13 ) were applied for the calculation of LLE of reactive systems. Some mathematical details of phase-split calculations for LLE were outlined in Section B of Appendix 3-1. Furthermore, an analogous TPD function (tpd m ) implemented in COSMOtherm software accompanied by a procedure 17 suggested for the determination and discrimination of local and global minima has been applied to ternary and multinary LLE calculations. The application of suggested procedure
306 APPENDICES for seeking the global minima in GfE of mixing was expected to ascertain the quantification of stable and equilibrated phase compositions. ø ø ø A. A Thermodynamic Framework in Brief The Gibbs free energy (GfE) as a thermodynamic function and its related properties (partial or excess) should be defined in order to formulate problems in phase equilibria thermodynamics. a. The Excess Gibbs Free Energy In phase equilibrium calculations the excess GfE provides a global measure of deviation from ideal solution behavior. 18 The excess GfE can be generalized for a multicomponent mixture as in Eqn. (14): Ideal Solution { } { } excess Real Solution G G TP x G TP x (,, ) (,, ) (14) The ideal solution GfE is expressed by Eqn. (15): N ideal G = x G + RT x lnx i i i i i= 1 i= 1 N (15) On the other hand, the chemical potential of species i in a real solution is expressed by Eqn. (16): ( ) µ G ideal + RT ln γ x (16) i i i i Analogous to G excess, the activity coefficient provides a local measure of deviation from ideal solution behavior. The activity coefficient refers to a chemical species i in a liquid solution and can be defined in terms of G excess as in equation set (17): µ µ = RT lnγ ideal i i i g g = RT lnγ ideal i i i g i lnγ = i RT excess (17) In Eqn. (18) both total and molar excess GfE are also defined: excess G = RT where g excess i x lnγ n G ni i i excess T, P, n j i (18) The activity coefficients, lnγ i, obeys a summability relationship, which is common to all partial mo- γ lar properties. The logarithm of the activity coefficient ( ln i ) is the partial molar property with respect to the dimensionless G excess : A-15
307 lnγ = i excess ng ( RT ) n i TPn,, j i APPENDICES (19) where it can also be shown that i ideal µ i µ i ( ) RT γ = e (20) The activity coefficientγ i is defined as the ratio of effective mole fraction (a i ) to true mole fraction (x i ): a i γ i = (21) xi In overall, the excess molar GfE forming mixtures from pure components is given as follows: Real Solution Ideal Solution { } { } { } excess g ( TP,, x) g ( TP,, x) g ( TP,, x) = RT xln( xγ ) (22) n i= 1 i i i The total GfE of a real solution or mixture can be expressed by the equation set (23) given below: excess ideal G= xg = G + G i i = RT x ln( γ x ) = RT x ln a = RT i i i i i fi x ln( ) i 0 f i (23) Where g i is the partial molar GfE. i f is the fugacity of species i in a mixture and f 0 is the fugacity of component i at standard condi- fi tions. The ratio of 0 fi is named as relative fugacity or more generally as activity (effective mole fraction - a i ) of species i. i b. The Gibbs Free Energy of Mixing The difference of thermodynamic function between different states is the driving force for processes to be held. The difference in GfE of mixing is expressed by Eq. (24): G = G G mixing mixture pure (24) This change can also be defined in terms of chemical potential and mole number of species i: N G = n µ (25) mixing i i i= 1 where A-16
308 APPENDICES µ = µ µ (26) i i,mixture i,pure In overall, the GfE of mixing, G xg pure, in terms of mole fractions is defined by Eqn. (27) and (28): i i pure excess G xg i i G g = = + x lnx mixing (27) i i RT RT The change in molar GfE of mixing is expressed as N excess g g RT x lnx mixing i i i= 1 = + (28) B. Equations for Phase-Split Calculation for LLE using Iterative Method (Rachford-Rice Equations) The procedure given below for the determination of binary LLE and the tie-lines in ternary LLE calculations is applied with UNIFAC model variants, UNIQUAC, NRTL, and modified WILSON (T&K) activity coefficient models. ( 0 i In defining the essential LLE condition (iso-activity condition), pure components standard fugacities f ) were taken as the same for both phases where it is assumed that the standard state is equivalent for all components in all phases. The iso-activity condition (equality) for a two-phase system (equivalent to Eq. (6) in the text) can be expressed by Eq. (29) and (30): γ x = γ x (29) I I II II i i i i I II γ i I I xi = xi = Kx II i i (30) γ i where K i determines the distribution ratio. N N N N I II I I x = 1 and x = 1 x x = 0 i i i i i= 1 i= 1 i= 1 i= 1 (31) In terms of the global composition, z i, and the fraction, β, of the total material that is present in an arbitrarily chosen phase, the material balance is: [ ] I II I z = βx + (1 β) x = β + K (1 β) x (32) i i i i i On summing these fractions the condition to be solved at equilibrium becomes as in Eq. (33): zi f( β ) = 1 0 β + K (1 β) i (33) A-17
309 APPENDICES The calculation is performed with the values of K i dependent on the composition accompanied by appropriate initial estimates. x z β x I II i i = i 1 β (34) An algorithmic form of Rachford-Rice equations based on Newton-Raphson method can be found in the supplementary file given by Shah and Yadav. 19 A concise evaluation of methods for calculating liquid-liquid phase-splitting was reported by Swank and Mullins. 20 Although the global composition is arbitrary when finding tie-line data, S. L. Walas 5 recommended a phase fraction value β = 0.5 (approximately equal amounts of the global composition for the two phases ) for fast convergence. An alternative formulation of LLE calculation based on Gibbs free energy minimization method can be defined using Lagrange multipliers as done in Chapter 4. The function to be minimized can be expressed by Eq. (35): I II ( ) min. i i (35) κ = g+ λ x x where λ is called the Lagrange multiplier, which is unknown to start but is found by the minimization I II procedure along with the quantities x i, xi and one of the phase splits, α or β. The derivatives of κ I II with respect to each of the system unknowns, equated to zero, together with x x = 0 i constitute a constrained optimization problem from which the unknowns and the parameter λ can be i found by the Newton-Raphson or a comparable method. It is worth emphasizing that in LLE calculations it is sometimes likely to find solutions remaining in the supersaturation zones, due to local minima problems. The thermodynamic condition for a ternary mixture to be metastable is mentioned by S. L. Walas 5 as: lnγ lnγ 2 3 lnγ lnγ 2 2 ψ = 1 x 1 x xx 0 MS > 2 3 x x x x (36) when ψ = 0 MS the limit of metastability is reached. C. UNIFAC Models for Liquid Phase Activity Coefficient Prediction The excess molar Gibbs free energy function of UNIFAC model is given as the sum of combinatorial and residual parts. The combinatorial part provides the contribution due to the differences in size and shape of the molecules in the mixture (non-idealities due to entropic effects) and the residual part is essentially due to energy interactions between the groups (non-idealities due to intermolecular interactions): excess excess excess g g g ( ) = ( ) + ( ) (37) T, P Combinatorial Residual RT RT RT A-18
310 APPENDICES The combinatorial part is expressed as: excess n g z z ( ) = ln ( )ln ln Combinatorial x x + x xq φ+ xq θ (38) i i i i i i i i i RT i= The residual part is expressed by Eqn. (39): g excess n m () i () i ( ) = x ν (lnγ + ln Γ ) Residual i k k k RT i= 1 k= 1 (39) The activity coefficients are defined from the molar excess GfE ( g excess ) as follows: excess ng T ( ) = RT lnγ T,P,nj i i n i (40) Combinatorial Residual lnγi lnγi lnγi = + (41) Eq. (41) is the fundamental relationship of the solution-of-groups (SoG) concept. Group contribution models, i. e. UNIFAC models, are the application of the correlative UNIQUAC model to the SoG concept. 21 The combinatorial term for UNIFAC model is the same as given for UNIQUAC. It contains pure component parameters only and is the Staverman-Guggenheim expression taken from the UNIQUAC model: φ φ z φ φ = + q + x x 2 θ θ Combinatorial i i i i lnγ ln (1 ) [ln (1 ) i i i i i i (42) xq θ = ; φ= i i xq j xr i i i i xr j j j j j (43) z is defined as the lattice coordination number which depends on how the molecules are packed. For liquids at moderate T and P, it is determined empirically that z The summations in two parts of equation (43) are over all components, including component i; θ i is the area fraction, and φ i is the segment fraction, which is similar to the volume fraction. Pure-component parameters r i and q i are measures of molecular van der Waals volumes and molecular surface areas, respectively. They are calculated as the sum of the group volume and area parameters, R k and Q k : (44) r = v R and q = v Q () i () i i k k i k k k k () i where v, always an integer, is the number of groups of type k in component i. k A-19
311 APPENDICES Group parameters R k and Q k are obtained from the van der Waals group volume (V wk) and surface areas (A wk ), given by A. Bondi 6 (see Table A3-1 to A3-3 for R k and Q k values for functional groups involved in the species of fatty systems) R k Vwk = Q A wk and = k (45) The normalization factors and 2.5x10 9 are determined by the volume and external surface area of a CH 2 (methylene) unit in polyethylene molecule. 21 In UNIFAC models, the residual part of the activity coefficient in UNIQUAC is replaced by the SoG concept. 23 The residual term is expressed as: µ µ ln γ [ln ln ] (46) pure Residual i i () i () i = = ν Γ Γ i k k k RT k all groups () i where Γ k is the group residual activity coefficient and Γ is the residual activity coefficient of group k k in a reference solution containing only components of type i. The sum is over all functional groups () i in component (i) and ν is the number of occurrences of group k in the component. k It is necessary to emphasize that Γk is calculated in a SoG for all molecules in the mixture, whereas () i Γ is calculated just for the component (i). k In Eq. (46) the term ln Γ () i is required to obtain symmetrically normalized system where the activity k coefficient, γ 1 i as x 1 i. The activity coefficient for group k in component i depends on the component i in which k is situated. The group activity coefficient, Γ, is: lnγ = Q 1 ln( θ Ψ ) k k m mk k θ Ψ m km (47) m m θ Ψ n nm n Equation (47) also holds for ln Γ () i k where θ m is the surface area fraction of group m, and the sums are over all different groups. θ m is calculated in a manner similar to that for θ i in combinatorial part: X Q m m θ = m XQ n n n (48) X m is the mole fraction of group m in the mixture: A-20
312 X m = components i components i ν () i m i groups k x ν x () i k i APPENDICES (49) () where ν i x is the number of is groups of type m in component i. m i The group-interaction parameter Ψ mn is given by: Umn Unn ( ) amn ( ) RT T Ψ = e = e mn (50) where U mn is a measure of the energy of interaction between groups m and n. The group interaction parameters a mn (a mn a nm ) is evaluated from experimental phase equilibrium data and has units of K (Kelvin). Parameters a mn and a nm (plus b mn, c mn and vice-versa in case of modified UNIFAC (Do.)) are obtained from several database using a wide range of experimental results The energetic interactions are considered to be the same for all subgroups with a particular main group. The modified UNIFAC (Do.) model uses a different expression for the combinatorial term, Combinatorial lnγ i. 24 φ φ z φ φ = + q + (51) x x 2 θ θ ' ' Combinatorial i i i i lnγ ln (1 ) [ln (1 ) i i i i i i where xr 34 ' i i φ i = 34 xr j i j (52) The group-interaction parameter, Ψ mn, in the residual part (Eq.(50)) is given by a three-parameter temperature dependent form of equation. This was introduced to permit a better description of the real behavior (activity coefficients) as a function of temperature: mn 2 amn + bmnt+ cmnt ( ) T Ψ = e (53) In the modified UNIFAC (Do.), all R k and Q k values are treated as adjustable parameters and regressed together with the interaction parameters using phase equilibria data. a. The Group-interaction Parameter Tables for UNIFAC Model The values of group-group interaction parameters assigned to fatty species for LLE estimations with UNIFAC model are tabulated for UNIFAC-LLE and modified UNIFAC (Do.) variants. An updated table used with UNIFAC-LLE variant was also presented (Table A3-2). A-21
. Functional group data taken from UNIFAC-VLE table were indicated in gray raw and column.")
. Functional group data taken from UNIFAC-VLE table were indicated in gray raw and column. D.")
313 APPENDICES Table A3-2 Assigned functional groups and group-group interaction parameter values, a mn (K), for UNIFAC-LLE model variant (Interaction parameter data was obtained from Magnussen et al., and Hansen et al., ). Functional group data taken from UNIFAC-VLE table were indicated in gray raw and column. Table A3-3 Assigned functional groups and updated group-group interaction parameter values, a mn (K), for UNIFAC-LLE model variant (Interaction parameter data was obtained from Magnussen et al., ; Hansen et al., and Batista et al., ). Functional group data taken from UNIFAC-VLE table were indicated in gray raw and column. D. A Few Notes on Correlative Activity Coefficient Models - UNIQUAC and NRTL Local Composition Models The correlative models with adjustable parameters exist for adequately representing most non-ideal solution behaviors. Such models are used in order to represent the non-idealities generating phase separations (splits) of many types of mixtures containing for instance strong polar and non-polar molecules. 18 They require the accurately measured experimental data for the determination of binary interaction parameters (BIP). Since they are able to directly use binary data, the modified Wilson (T&K), UNIQUAC, and NRTL equations are the only ones of general value in representing multicomponent LLE behavior. Modified Wilson (T&K) is a modification by Tsuboka and Katayama 28 which extends Wilson equation 6 to LLE calculations. A-22
314 APPENDICES Table A3-4 Assigned functional groups and group-group Interaction parameter values, a mn (K), b mn (K), and c mn (K -1 ) with emprical R k and Q k for modified UNIFAC (Do.) model variant. (Interaction parameter data was obtained from Gmehling et al., and Jakob et al., ). A-23
315 APPENDICES Although the original NRTL model has 9 parameters for a ternary system, it turns out that a universal value of α ij = 0.2 is satisfactory, so all binary pairs in a ternary system can be regarded as having only six parameters at a given temperature applicable to ternary and more complex mixtures. In other words, each binary pair of components has three parameters, i.e. two interaction parameters and the so-called constant non-randomness parameter, α ij. In fact, the non-randomness parameter which holds a clear physical meaning, as can be perceived from a comparison of NRTL to the quasichemical theory of Guggenheim, has a range of values between 0.20 and 0.47 in most cases where it can be set (somewhat arbitrarily) equal to 0.3 in the absence of data. It is physically equal to 2, z where z is the coordination factor which has values for liquids varying between 8 and In view of the LLE, α ij values below predict phase immiscibility and a value equal to zero means that the mixture is completely random. 30 Renon and Prausnitz 31 have recommended some general rules depending on the family of components: α ij = 0.3 for non-polar components, polar mixtures with slight negative deviations from Raoult s law or moderate positive deviations, water polar components; and α ij = 0.47 for alcohols non-polar species. However, these rules cannot be easily applied and thus often α ij is treated as an extra adjustable parameter, which is determined from binary data. Furthermore, some different non-randomness parameter values (α ij = 0.1 and -1.0) are stated to be less satisfactory. 30 It is worth noting that despite to some of its technical disadvantages, the BIP of UNIQUAC model have been estimated from quantum chemical/mechanical principles with good results, better than with the other LC models. Since the interactions take place by means of the surface of the components, it has substantial advantage over NRTL and Wilson models. Further details, evaluation, and drawbacks of LC models, particularly UNIQUAC and NRTL models, have been discussed in the monograph written by Kontogeorgis and Folas (cf. Chapter 5). 30 a. UNIQUAC Activity Coefficient Model for a Binary Mixture The excess Gibbs free energy for a multi-component solution is given below: excess G φj z φj = x ln( ) qx ln( ) qx ln( θτ ) j j j j j i ij RT x 2 x (54) j j j j j i The molar excess GfE for binary systems g φ φ z θ θ = x ln + x ln + ( qx ln + qx ln ) RT x x 2 φ φ excess (Combinatorial) excess (Residual) g = qx ln[ θ + θτ ] qx ln[ θ + θτ ] RT xr xq u u φ = ; θ = ; ln τ = ; lnτ = x r + x r x q + x q RT RT (55) u 12 and u21 are the binary interaction parameters: u = u u u = u u (56) A-24
316 APPENDICES The activity coefficients lnγ 1 and lnγ 2 are, φ φ φ φ θ θτ lnγ = ln + (1 ) 5 q [ln + (1 ) + q [1 ln( θ θτ ) ] x x θ θ θ + θτ θτ + θ φ φ φ φ θτ θ lnγ = ln + (1 ) 5 q [ln + (1 ) + q [1 ln( θτ θ ) ] x x θ θ θ + θτ θτ + θ In more generalized form: Combinatorial Residual lnγ lnγ lnγ i i i = + (57) where φ z θ φ = + q + l xl x 2 φ x Combinatorial i i i lnγ ln ln i i i j j i i i = q j Residual lnγ 1 ln( θτ ) i i j ji θτ j ij j θτ k kj k j Rearranging and summing up above equations leads to the general form of UNIQUAC equation for activity coefficient calculation: φ z θ r τ τ i i i ji ij lnγ = ln + ln ( ) ln( ) ( ) i q + φ i j l i l j q θ θτ θ i i j ji j q i x 2 φ r θ + θτ θ + θτ i i j i j ji j i ij (58) where i=1; j=2 or j=1; i=2 z l = ( r q ) ( r 1) i i i i 2 z l = ( r q ) ( r 1) j j j j 2 (59) uji uji uii xq xr ( ) i i i i RT RT = ; = ; = e = e i i ji θ φ τ xq xr j j j j j j (60) r and q are pure-component parameters and coordination number z = 10. In these equations x i is the mole fraction of component i and the summations in Eqn. (60) are over all components, including component i; θ i is the area fraction, and φ i is the segment fraction, which is similar to the volume fraction. Pure-component parameters r i and q i are the measures of molecular van der Waals volumes and molecular surface areas, respectively. A-25
317 APPENDICES In UNIQUAC, the two adjustable binary parameters τ ij and τ ji appearing in Eqn. (58) and (60) are evaluated from experimental phase equilibrium data. No ternary (or higher) parameters are required for systems containing three or more components. b. Non-Random Two Liquids (NRTL) Activity Coefficient Model for a Binary Mixture The molar excess Gibbs energy for binary systems excess g τ G τ G = xx + RT x + xg x + xg ( ) (61) where g g τ = ; τ = RT RT ln G = ατ ; lng = ατ g 12, g21 and α12 are the binary interaction parameters g = g g ; g = g g Activity coefficients lnγ 1 and lnγ 2 are, G ln γ = x τ ( ) x + xg ( x + xg ) G ln γ = x τ ( ) + τ G τ G x + xg ( x + xg ) (62) Although NRTL uses three adjustable parameters per binary species, one of these (non-randomness parameter, α 12 ) can often be set a priori; typical values are α 12 = 0.3 or 0.2 depending on the systems involved (see above for a discussion of non-randomness parameter). Second derivative of NRTL equation for excess G in binary systems: excess G τ G τ G τ G (1 G ) τ G (1 + G ) = 2 + (1 2 x ) RT x+ G x G x+ x ( x+ G x ) ( G x+ x ) τ G (1 G ) τ G (1 + G ) 1 + 2xx ( x + G x ) ( G x + x ) xx (63) It is worth to note that the derivation of UNIQUAC shows that the 3-parameter NRTL equation is more properly applicable to excess enthalpy than excess Gibbs free energy. 32 A-26
318 APPENDICES Appendix 3-2 Mathematical Expressions for Statistical Comparison A (1 α )100% confidence interval for the mean value of experimental tie-line data for each component at each phase was calculated as follows: s s w t w w + t (1) N i α i i α N 1, N 1, 2 N 2 where w i is the mean weight percentage value of measurements; s is the standard deviation of measurements; N is the number of measurement replication for the tie-line i. tn, α is the (1 α )100% percentile (it is taken 95% in this study for the probability of making a type I error of α, ( α = 0.05 ); α is also referred to as the level of significance) of the two-tailed t-distribution with N-1 degrees of freedom. Mean relative error percentage is given as follows: MRE % = 100 w T R t I P expt estm trip trip t= 1 r= 1 i= 1 p= 1 expt wtrip T IP t= 1 R t w (2) where expt w and trip estm w represent the experimental and estimated weight percentage of component trip i in phase p, respectively. The overall mean relative error percentage value is calculated for the tieline t with the replication r and total replication number of R t for each tie-line. T is the total number of tie-lines, and I is the total number of components at each phase of total number P. Confidence interval of the expected value of MRE (E (MRE)) is calculated as follows: s MRE t E( MRE) MRE + t T T α ( ) 1, T α IP ( ) 1, T Rt IP Rt 2 2 t= 1 t= 1 t t= 1 t= 1 IP R IP R s t (3) where standard deviation, s, is defined by Eq. (4): s = w w ( MRE) T R expt estm t I P trip trip expt t= 1 r= 1 i= 1 p= 1 wtrip T ( IP R ) 1 t= 1 t 2 (4) A-27
319 APPENDICES Mean squared deviation is given as follows: MSD = T R t I P t= 1 r= 1 i= 1 p= 1 IP ( w w ) T t= 1 expt estm 2 trip trip R t (5) Similarly, root mean squared deviation (RMSD) is simply given as follows: RMSD = T R t I P t= 1 r= 1 i= 1 p= 1 IP ( w w ) T t= 1 expt estm 2 trip trip R t (6) Confidence interval of the expected value of MSD (E (MSD)) is calculated as follows. It is also valid for expected value of RMSD, E(RMSD), with the exchange of MSD to RMSD values: s MSD t E( MSD) MSD + t T T α ( ) 1, T α IP ( ) 1, T Rt IP Rt 2 2 t= 1 t= 1 t t= 1 t= 1 IP R IP R s t (7) Where standard deviation, s, is defined by Eq. (8): s = T R t I P t= 1 r= 1 i= 1 p= 1 (( w w ) MSD) expt estm 2 2 trip trip T ( IP R ) 1 t= 1 t (8) Mean absolute deviation is given as follows: MAD = T R t I P t= 1 r= 1 i= 1 p= 1 IP T w t= 1 expt trip R t w estm trip (9) Confidence interval of the expected value of MAD (E (MAD)) is calculated as follows: s MAD t E( MAD) MAD + t T T α ( ) 1, T α IP ( ) 1, T Rt IP Rt 2 2 t= 1 t= 1 t t= 1 t= 1 IP R IP R s t (10) where standard deviation, s, is defined by Eq. (11): s = T R t I P t= 1 r= 1 i= 1 p= 1 ( w w MAD) expt estm 2 trip trip T ( IP R ) 1 t= 1 t (11) A-28
320 APPENDICES Appendix 3-3 Supplementary Data 1. UNIFAC-VLE Variant for LLE Phase Behavior Simulation As mentioned in Section 2 of the main text, according to Magnussen and coworkers 26 also in principal any UNIFAC model variants should be used to calculate LLE composition of phases. However, since UNIFAC-VLE parameters are obtained from binary VLE data, predictions made using this variant are generally useful for VLE, but not for LLE. The LLE phase diagrams of SFO-HO EtOl EtOH and SBO FAEE EtOH ternary systems predicted at 308 K were depicted in Fig. S-4 and S-5, respectively. The diagrams at the left hand side (LHS) of Fig. S-4 and S-5 illustrate the corresponding ternary LLE phase diagrams of SFO-HO-(x) EtOl-1 EtOH and SBO-(x) FAEE-1 EtOH where x in parenthesis denotes the number of possible combination of SFO-HO and SBO, as presented in Table 3-2 in Section 1.6 and Table S-1 below, respectively. As it can be seen in these two figures the parts of binodal curves pertaining to EtOH rich phases are almost overlapping and, hence, different combinations do not make any significant change in the solubility of oil in EtOH rich phases. The highest mutual solubilities in EtOH rich phases were predicted for the 2 nd combinations of oils where all ester fragments were assigned to COO functional group. Consequently, it is plausible to deduce that such group differences do not affect the systems mutual solubility behaviors in EtOH rich phases. Table S-1 Assigned functional groups for pseudo-sbo, -FAEE components. Abbreviations: FAEE: Fatty Acid Ethyl Ester; EtOH: Ethanol; SBO: Soybean Oil; M.W.: Molecular Weight The binodal curves at the LHS diagrams of Fig. S-4 and S-5 belong to almost a Type II diagrams 32,33 where SFO-HO-(x)+EtOH; SBO-(x)+EtOH; EtOl-1+EtOH and FAEE-1+EtOH binaries are practically immiscible, yet the SFO-HO-(x)+ EtOl-1 and SBO-(x)+FAEE-1 binaries are not. It is, however, well known that fatty acid alkyl esters (FAME and FAEE) are almost totally miscible with EtOH at 308 K. 12,34-36 The least heterogeneous (two-phase) area at LHS diagrams were obtained for the combination of SFO- HO-2 (SBO-2) where the ester fragments of oil were assigned to only COO and CH 2 functional groups. Though, the ester groups in EtOl-1 and FAEE-1 were a single CH 2 COO. Moreover, as it has been mentioned in Section of main text, the highest initial solubility of EtOH in SFO-HO (SBO) was obtained for this combination which slightly increased with the addition of EtOl-1 (FAEE-1). The largest heterogeneous (two-phase) region was obtained for SFO-HO-4 (SBO-4) among four binodal curves. Since the binodal curve parts of EtOH rich phase are quite close to each other, it can also be concluded that EtOH is practically immiscible for all the combinations of SFO-HO-(x) EtOl-1 EtOH and SBO-(x) FAEE-(y) EtOH ternary systems estimated by means of UNIFAC-VLE model. As a char- A-29
321 APPENDICES acteristic of such diagrams, the tie-lines near the edge of the curves are almost parallel with the sides of the equilateral triangle. On the other hand, binodal curves pertaining to the RHS ternary phase diagrams of Fig. S-4 and S-5 belong to Type I diagrams 32,33 where SFO-HO-(x)+EtOl-2; SBO-(x)+FAEE-2; EtOl-2+EtOH, and FAEE- 2+EtOH binaries are almost totally miscible with each other, but the SFO-HO-(x)+EtOH and SBO- (x)+etoh binaries are not. The only difference from the LHS diagrams was the corresponding uses of EtOl-2 and FAEE-2 as the biodiesel components where the ester fragment was represented by COO and CH 2 functional groups. Thus, it is obvious to conclude that the assignments of COO and CH 2 functional groups in FAEE species are more appropriate for a realistic simulation of the system s LLE phase behavior than the recommended single CH 2 COO sub-group. 37,38 In this case the tie-lines near the edge of the curves in Type I diagrams are not parallel with the sides of the equilateral triangles. Furthermore, the expected miscibility of FAEE and EtOH at the T range of K was evidenced for the EtOl-2+EtOH and FAEE-2+EtOH binary systems. It was obviously seen that the addition of FAEE component increases the mutual solubility of EtOH and oil species and thus decreases the sizes of two-phase regions. A comparison of Fig. S-4 and S-5 indicates that the number of CH 2 functional groups is more effective on decreasing the size of heterogeneous two-phase region than HC=CH groups. Since, the number of CH 2 groups in SFO-HO and EtOl species is greater than the corresponding number in SBO and FAEE species; whereas the number of HC=CH in SBO and FAEE is the opposite. It is also likely to state that the impact of COO functional group in EtOl-2 species which helps on the mutual solubility of oil and EtOH is more effective in SFO-HO containing ternaries than in SBO one (see Fig. 3-4 in Section of the main text). Accordingly, the binodal curves in the RHS diagram of Fig. S-4 are more close to a Type II diagram than those in RHS diagram of Fig. S-5. In concluding this section, it is also reasonable to state that the binodal curve patterns in Fig. S-4 and S-5 are almost identical; this could be attributable to assigned functional group combinations. Finally, it is conceivable to use UNIFAC- VLE model as an approximation to get an idea on the LLE behavior of the system where any other model variant is not available. Figure S-4 UNIFAC-VLE estimated SFO-HO-(x)-EtOl-(y)-EtOH ternary systems LLE diagrams at T = K (x: 1 to 4; y: 1 to 2). Abbreviations: SFO-HO: High oleic sunflower oil; EtOl: Ethyl oleate. A-30
322 APPENDICES Figure S-5 Ternary LLE diagrams estimated by UNIFAC-VLE model for SBO-(x) FAEE-(y) EtOH system at T = K (x = 1 to 4; y = 1 or 2). Abbreviations: SBO-soybean oil; FAEE-fatty acid ethyl ester; EtOH-ethanol; LLE-liquid liquid equilibrium. Figure S-6 Ternary LLE diagrams estimated by UNIFAC-LLE model variant for SBO-(x) FAEE-(y) EtOH system at T = K (x = 1 to 4; y = 1 or 2). Abbreviations: SBO-soybean oil; FAEE-fatty acid ethyl ester; EtOH-ethanol; LLE-liquid liquid equilibrium. 2. Modified UNIFAC (Do.) Model Variant for LLE Estimation In contrary to previous UNIFAC model variants ternary systems containing SFO-HO-(x) as the vegetable oil and EtOl-1 as the biodiesel species belongs to Type I diagram and that of EtOl-2 to Type II diagram. The LLE diagrams were illustrated on Fig. S-7 where the diagram at LHS pertains to EtOl-1 and that at RHS pertains to EtOl-2 containing ternary system. It was more feasible using CH 2 COO sub-group than COO and CH 2 groups assigned to biodiesel species with this model. The system with the smallest heterogeneous area in size was obtained for SFO-HO-4 containing ternary system depicted on the LHS of Fig. S-7. Since the binodal curves at LHS are very close to each other, it is con- A-31
323 APPENDICES ceivable to conclude that all combinations of SFO-HO species show practically similar LLE phase behaviors. Moreover, the assignment of 3 COO and 3 CH 2 functional groups to the ester fragments of oils did not indicate analogous results as in previous two model variants. In contrast, the ternary systems with this functional group have the highest two-phase regions. Similar results were obtained also for the SBO-4 FAEE-1 EtOH ternary system by means modified UNIFAC (Do.) model. As it can partly be seen from Fig. 3-11, ternary systems containing FAEE-1 combination resulted with a Type I diagram in contrast to former two UNIFAC model variants given above. The ternary systems with FAEE-2, however, resulted with Type II phase diagrams (data is not presented). In brief, it is more feasible assigning CH 2 COO as the ester functional group of biodiesel species with modified UNIFAC (Do.) model variant. However, the modified UNIFAC (Do.) variant among the three model variants gave the largest two-phase regions which ascertain that the mutual solubility of vegetable oils and EtOH and, thus, the LLE phase behavior of Veg. Oil FAEE EtOH ternary systems are underestimated by this model variant. Figure S-7 Modified UNIFAC (Do.) estimated SFO-HO-(x)-EtOl-(y)-EtOH ternary systems LLE diagrams at T = K (x: 1 to 4; y: 1 to 2). Abbreviations: SFO-HO: High oleic sunflower oil; EtOl: Ethyl oleate. 3. Comparisons of Reported Experimental LLE Data for FAEE EtOH Glycerol Ternary Systems with Predictive Methods UNIFAC vs. COSMO-RS Even though LLE data measured at the T values higher than 323 K is not suitable for enzymatic biodiesel production, it might help on defining the boundary lines for phase behaviors of reactive systems and the efficiency of unit operations in refining steps. Follegatti-Romero and coworkers 39 reported LLE measurements for ternary systems including a saturated (EtPa) (at 313 and 323 K) and two unsaturated (EtOl and EtLi) FAEE species at 323 and 353 K. Likewise, Andrade et al. 40 reported LLE data measured at 323 and 353 K for ternary systems containing EtSt as the FAEE component. The simulated LLE phase diagrams by means of COSMO-RS method and UNIFAC-LLE model variant accompanied by reported experimental binodal curves for EtOl EtOH glycerol ternary system were illustrated in Fig. S-8. Since LLE prediction for EtOl-2 combination via UNIFAC-LLE variant showed the most appropriate binodal curves, only the phase diagrams of this case were illustrated. Ternary LLE diagrams for the system of EtLi EtOH glycerol, on the other hand, were analogously illustrated in A-32


324 APPENDICES Fig. S-9 by means of the same set of predictive methods. It is important to emphasize at this point that the illustrated tie-lines do not correspond to the same points of binodal curves. Figure S-8 LLE phase diagrams of EtOl EtOH Glycerol ternary systems at K and K Comparisons of experimental data from Follegatti-Romero et al., , UNIFAC-LLE simulated (EtOl-2 EtOH Glycerol), and COSMO-RS simulated (COSMOtherm v.c2.1_01.11 with BP-TZVP parameterization) LLE phase diagrams. Figure S-9 LLE phase diagrams of EtLi EtOH Glycerol ternary systems at K and K Comparisons of experimental data from Follegatti-Romero et al., , UNIFAC-LLE simulated (EtLi-2 EtOH Glycerol), and COSMO-RS simulated (COSMOtherm v.c2.1_01.11 with BP-TZVP parameterization) LLE phase diagrams. It is worth mentioning that Follegatti-Romero et al. 39 have used a technical grade EtOl species which is comprised of 77.5% EtOl and EtLi as the other major contaminating component; whereas EtLi used had 97% of purity. As a result, ternary (quaternary) system containing technical grade EtOl component was also simulated for a composition of 77.5% EtOl and 22.5% EtLi components by means of COSMO-RS method. As is seen from ternary phase diagrams depicted in Fig. S-8 only COSMO-RS method properly represent the LLE phase behavior of ternary system at 323 K and 353 K, where relatively better result was obtained at higher T value. However, the solubility of glycerol in ester rich phase with higher EtOH addition could not be modeled by any of the models mentioned. Even A-33
325 APPENDICES though there is no significant difference between the COSMO-RS based simulations for pure EtOl and EtOl (77.5%) and EtLi (22.5%) blend, the latter case demonstrated a relatively better representation of binodal curve at ester rich phase. On the other hand, a comparison of experimental data measured at 323 K and 353 K demonstrates an interesting pattern which might be attributable to measurement errors. The researchers reported a considerably high solubility of glycerol in ester rich phase with the addition of EtOH at lower T value; while the impact of EtOH addition at higher T value was reported to be relatively insignificant. In our opinion, this should be stemmed from the fact that EtOH at 353 K is already over its normal boiling point ( K at SP). Therefore, there expected some significant evaporation of EtOH at that T value. This situation can also be observed through a simple comparison of binodal curves of ester rich phases obtained by means of COSMO-RS simulations. Consequently, as can be seen from the conversion line representing a reaction completion up to 99.5%, the LLE predictions at higher T values by means of COSMO-RS method excellently simulates phase distributions and thus mutual solubilities of ternary system containing EtOl as the FAEE species for conversion levels above 90%. It is also worth noting that although UNIFAC-LLE variant with EtOl-2 combination shows the most appropriate LLE phase diagram, it underestimates the mutual solubilities and phase distributions at such high T values. LLE phase diagrams of EtLi EtOH glycerol ternary system by means of the same set of methods were illustrated in Fig. S-9. In case of 323 K, there observed significant overlapping of binodal curves at ester rich phase. However, predictions through COSMO-RS method did not represent the same trend for higher amount of EtOH addition which means that mutual solubility impact of EtOH could not be simulated appropriately. Moreover, there found some deviations in binodal curves at the glycerol rich phase. Hence, neither COSMO-RS with BP-TZVP parameter set nor UNIFAC-LLE variant could perfectly simulate the experimental LLE diagram measured at 353 K. In other words, the former method overestimates the mutual solubilities of the components; while the latter one underestimates the same solubilities at both T values. Though nothing has been mentioned in their study, the expected evaporation of EtOH at 353 K must be considered in the course of experimental measurements. The LLE phase diagrams for ternary systems comprising saturated FAEE species were depicted in Fig. S-10 for EtSt case and in Fig. S-11 for EtPa case. The saturated FAEE (EtPa) species used by Follegatti-Romero et al. 39 had a purity of 99.5%; while EtSt purity was reported by Andrade and coworkers 40 as 97%. Experimental phase diagrams of EtSt containing ternary system at 313 K showed a rather significant agreement with predictions obtained by means of UNIFAC-LLE model variant (with EtSt-1 combination.) The same agreement was also reported by Andrade et al. using the same UNIFAC variant. On the other hand, as is seen in Fig. S-10 the LLE estimations via COSMO-RS method with BP-TZVP parameter set also have substantial agreement with experimental binodal curves at both of the T values where the binodal curve at glycerol rich phase simulated at 323 K through UNI- FAC-LLE model show some significant deviations. This fact was also mentioned by Andrade and coworkers. In overall, it was observed that the mutual solubilities of EtSt and glycerol species are properly represented by both types of predictive methods. Although EtPa species (EtPa-1) used with UNIFAC-LLE variant has an analogous functional group assignment (CH 2 COO in ester fragment; see Table 3-3 in the main text), the LLE diagrams of ternary system demonstrated in Fig. S-11 did not exactly match with experimental diagram for higher EtOH compositions. Though, there observed a rather significant agreement for reaction completion levels above 90%. In contrast, LLE phase behavior of the system has been represented rather significantly by COSMO-RS method employing BP-TZVP parameterization. Meanwhile, it can be deduced from a simple comparison of two diagrams depicted in Fig. S-11 that the size of two-phase region is smaller A-34
326 APPENDICES in case of 323 K. Therefore, as mentioned for unsaturated cases, the risk of EtOH evaporation which affects the quality of measured data at such higher T values should again be certainly considered. As a general conclusion of this section, it was evidenced that both predictive methods, UNIFAC-LLE variant and particularly COSMO-RS with BP-TZVP parameter set, can be efficiently used for the simulations of LLE phase behavior of FAEE EtOH glycerol ternary systems even at higher T values up to 353 K for reaction completion levels above 90% (see Fig for EtOl case in Section 3.3 of main text). The statistical comparison of COSMO-RS method using BP-TZVP parameterization with experimental data points was presented in Table 3-7 of the main text where RMSD values of at 293 K and at 308 K were calculated. Figure S-10 LLE phase diagrams of EtSt EtOH Glycerol ternary systems at K and K Comparisons of experimental data from Andrade et al., , UNIFAC-LLE simulated (EtSt-1 EtOH Glycerol), and COSMO- RS simulated (COSMOtherm v.c2.1_01.11 with BP-TZVP parameterization) LLE phase diagrams. In overall, the amounts of dissolved glycerol in EtOl rich phase were measured at 293 and 308 K as 1.03% and 1.22%, respectively. Even though it was not quantitatively possible to determine for other ethyl ester species measured at higher T values, it is obvious that dissolved glycerol amount increases with temperature and thus it is expected to be above 1.00%. However, it was calculated ca. 0.66% at 313 K for the system containing EtSt component by interpolation of experimental data points reported by Andrade and coworkers. 40 The evaluation of ternary and multinary LLE by means of predictive COSMO-RS method with different parameter sets will be continued in Section 4.3 and in Section 6 for mainly quaternary and multicomponent systems. A-35
, and COSMO-RS simulated (COSMOtherm v.c2.1_01.11 with BP-TZVP parameterization) LLE phase diagrams. 4.")
327 APPENDICES Figure S-11 LLE phase diagrams of EtPa EtOH Glycerol ternary systems at K and K Comparisons of experimental data from Follegatti-Romero et al., , UNIFAC-LLE simulated (EtPa-1 EtOH Glycerol), and COSMO-RS simulated (COSMOtherm v.c2.1_01.11 with BP-TZVP parameterization) LLE phase diagrams. 4. Binary LLE of Reactive Substrates of Transesterification Reaction The solubilities of aliphatic alcohols (MeOH and EtOH) in vegetable oils are one of the crucial steps determining process efficiency via homogeneity or heterogeneity of reaction medium. Such alcohols are employed as the acyl group acceptors in transesterification (alcoholysis) reaction. Reactive systems LLE and VLE phase behaviors are dependent on the feed amount of alcohols, medium temperature, and to the purity levels of species to some extent. Therefore, binary LLE of triolein MeOH and triolein EtOH systems were calculated using 4 different parameterization sets as illustrated in Fig. S-12. The solubility of dry and aqueous EtOH species in vegetable oils was extensively described in Section through reported experimental measurements and predictions performed by means of UNIFAC-LLE model variant. In brief, it was verified using reported measurements by Batista and coworkers 27 at 3o3 K that the solubility of EtOH (> 99.8%) in triolein (> 99%) is 13.97%; whereas that of MeOH in corn (-seed) oil (58.29% C18:2; 27.82% C18:1, and 10.04% C16:0) at the same temperature was reported to be 5.73% which increases to 6.36% at 313 K. 41 However, the most quantitatively closest value predicted for EtOH at 303 K was ca. 7.22% with DMOL3-PBE parameterization, while the BP-TZVP and BP-TZVPD-FINE predicted the lowest but equal values (ca. 3.42%). The same parameterization set analogously predicted the most quantitatively closest solubility value in case of MeOH as ca. 1.80% at 303 K and ca. 2.10% at 313 K. On the other hand, the worst solubility value for MeOH was predicted by means of BP-TZVPD-FINE parameterization was ca. 0.80% and 1.05% at 303 and 313 K, respectively. As a conclusion, none of the parameterization file could efficiently simulate the solubility of MeOH and EtOH in triolein. However, they can be effectively used, as shown below, for the representations of species phase distributions. In order to check self-association (H-bonding) among glycerol molecules and H-bonding impact on its solubility in FAAE species, the solubilities of glycerol were simulated using BP-TZVPD-FINE parameterization (cf. Section 4.1 of the main text). As is seen in Fig. S-13 the highest solubility was observed within the smallest member (MeMy) followed by the most unsaturated one (MeLn); whereas A-36
328 APPENDICES its lowest solubility was calculated for long-chained saturated MeSt and mono-unsaturated MeOl species. Glycerol solubility in FAEE species, on the other hand, was calculated for EtLi as the highest and for EtOl as the lowest. It was remarkably observed that glycerol in EtPa, as being the smallest member evaluated, shows higher solubility than in EtOl. Figure S-12 Solubility change of EtOH and MeOH in simple TAG (Triolein) species predicted using COSMO-RS method (COSMOtherm v.c3.0_12.01) through four parameter sets. Figure S-13 Solubility of glycerol in FAME (blue curves) and FAEE (black curves) species simulated using COSMO-RS method (COSMOtherm C3.0_12.01) through BP-TZVPD-FINE parameterization. 5. A Few More Ternary LLE Simulations of Reactive Systems using Predictive Methods 5.1. The Case with Triolein EtOl EtOH using COSMO-RS with novel BP-TZVPD-FINE Parameter Set A comparison of Fig (see Section 4.2 of the main text) and Fig. S-14 has revealed that there is a significant increase in the size of two-phase region with the BP-TZVPD-FINE parameterization file. In the latter simulations depicted in Fig. S-14 the novel parameterization file was assessed for oleic case at 303 and 318 K where a significant left-side shift was observed for binodal curve part representing EtOH rich phase. Thus, it was concluded that H-bonding should have significant influence on the mutual solubilities of species. A-37
329 APPENDICES Figure S-14 Ternary phase diagrams for LLE of TAG FAEE EtOH ternary system predicted at K and K using COSMO-RS method (COSMOtherm C3.0_12.01) through BP-TZVPD-FINE parameter set. The LLE phase diagrams simulated at 303 and 318 K employing BP-TZVPD-FINE parameter set for oleic case was illustrated in Fig. S-15. It is obvious from these diagrams that glycerol is miscible neither with FAEE derivatives nor with TAG species representing neat vegetable oils The Case with Triolein EtOH glycerol using COSMO-RS with novel BP-TZVPD-FINE Parameter Set Figure S-15 LLE phase diagram of Triolein EtOl Glycerol ternary system using COSMO-RS method (COSMOtherm C3.0_12.01) at K and K through BP-TZVPD-FINE parameterization. An oil conversion of 99.5% was assumed. A-38
330 APPENDICES 5.3. The Case with SFO-HO(x) OlAc EtOH using Modified UNIFAC (Do.) Model Variant Figure S-16 LLE phase diagrams of SFO-HO-(x) OlAc EtOH ternary systems predicted at K and K by means of modified UNIFAC (Do.) model variant (x = 1,,4). The assigned functional groups to pseudo-sfo-ho species have been presented in Table Solubility of Water in Biodiesel (FAAE) Preliminary Evaluation of COSMO-RS Simulations Analogous to the method mentioned in Section 4.3.2, FAEE blend was modeled using 5 ethyl ester species weighted by their corresponding FA composition measured in the substrate oil (SBO). The equilibrium moisture content (saturation solubility of water) in FAEE blend was predicted using 4 parameterization sets and results were shown in Fig. S-17 for a T range of K. There observed almost linear relations between water solubility and temperature where the lowest solubility was predicted using BP-TZVP parameterization accompanying a hydrogen bonding term (HB2010). As expected, the existence of self-associative H-bonding among water molecules which declines wit temperature generates relatively low solubility in FAEE species (mixture). On the other hand, the highest water solubility was predicted by means of BP-TZVP-ISOCAV parameterization which follows the same trend line with BP-TZVP. Figure S-17 Simulation of water solubility in multicomponent FAEE mixture using COSMO-RS method (COSMOtherm v.c2.1_01.11) with four parameter sets. ppm: parts per million ( 1 mg 1 kg 3-23 caption in the main text (Section 4.2). ). The composition of FAEE is the same as given in Fig. A-39
331 APPENDICES The H-bonding term, as is seen, has considerable impact on the predicted solubilities of water in FAEE mixture. Therefore, it might as well be helpful assessing the solubility of water in single FAAE species using the new BP-TZVPD-FINE parameterization set which includes a new H-bonding term (HB2012). Prediction results were depicted in Fig. S-18 for 3 saturated and 4 unsaturated FAME species; and 2 saturated and 3 unsaturated FAEE species. The temperature range involved was the same as in Fig. S-17 where the highest water solubility in single FAME species, in this case, was found for the shortest saturated member, MeMy. Since there was no such species in case of FAEE species, the most unsaturated member, EtLn, was predicted to hold the highest amount of moisture. It was observed that moisture content in both single unsaturated FAME and FAEE species follow the same increasing order as in Fig shown in Section 4.4 of the main text for FFA. The order of increasing water solubility in, for instance, FAEE species was: EtLn > EtLi > EtOl. It was predicted that both MeSt and EtSt hold equal amounts of moisture, especially at above 320 K where the former has a normal melting point between and 312 K 42,43 and the latter has between 307 and 311 K at SP. Actually, the solubilities of water in MePa below 298 K (T m = K 42,43 ) and in MeSt and EtSt below 311 K and 306 K, respectively, should be considered as hypothetical. On the other hand, it was observed that solubility predictions using BP-TZVPD-FINE parameterization set including the new H-bonding term resulted with significantly high moisture content in single FAAE species. Therefore, it is possible to deduce at this point that there is a considerable difference among the two H-bonding terms. This point will be further evaluated below. Figure S-18 Moisture absorption simulation in single FAEE and FAME species using COSMO-RS method (COSMOtherm v.c3.0_12.01) with BP-TZVPD-FINE parameterization. 7. A few Notes on SAFT-HR and ESD Equations of State In essence, thermodynamic models based on statistical mechanics and molecular structure allow more detailed predictions than that are possible with models used for simple fluids, 22,45 but these models tend to be less accurate because only minimum information is generally available about the species. As reported above, associating fluids and their mixtures form strong H-bonding interactions and, thus, have highly directional nature. Therefore, they may reveal non-ideal phase behaviors that are rather exceptional, particularly in VLE. Statistical associating fluid theory (SAFT-HR and its variants) is a widely used molecular-based equation of state (EoS) which has been successfully applied to study a broad range of fluid systems The SAFT-HR EoS is similar to perturbed hard chain equations like that of Beret and Prausnitz 52, but provides accuracy competitive with correlative activity coefficient models for H-bonding mixtures. Indeed, SAFT-HR is not an exact equation of state, but rather a method that allows for the incorporation of the effects of association into a given theory. 47 It provides a framework in which the effects of molecular shape and interactions on the thermodynamics and phase behavior of fluids can be separated and quantified. However, because different microscopic effects can be explicitly A-40
332 APPENDICES defined and accounted for, the SAFT approach has been shown to be a reliable equation of state. Analogous to SAFT-HR approach, the Elliott-Suresh-Donohue 53 (ESD) EoS is also based on Wertheim s first-order thermodynamic perturbation theory. Moreover, ESD EoS is similar to conventional cubic EoS like the SRK or PR mainly used for hydrocarbons and gases, but it also provides accuracy for H-bonding mixtures. Several researchers have reported particular success of such methods in describing the thermodynamics and phase behavior of associating fluids. 48 These new theoretical equations relate the thermodynamic properties to physical intermolecular forces, so that associating liquids are treated on the same basis as simple liquids of more weakly interacting molecules. 47 In these approaches, molecules are described by chains of tangentially bonded homonuclear (i.e., identical) monomer segments that interact via common dispersion and, when appropriate, association interactions. The free energy of fluids is obtained by summing different contributions that account for the monomer monomer interactions, chain formation, and intermolecular association, e.g., H-bonding interactions. Unlike the correlative models, these equations are based on treating the H-bonding interactions as chemical reactions in accordance with the formalism developed by Wertheim. 54 In this sense, the ESD equation is similar to the SAFT-HR equation of Chapman and coworkers. 49 However, there are some differences among these two equations. For instance, the ESD equation is slightly different in that it is designed for generalized application. 54 This means that the parameters of ESD EoS can be easily and reliably estimated from generally available values of experimental data. Besides, the way that the pure-component parameters are determined is different in ESD and SAFT-HR equations. The former uses the critical thermophysical properties and acentric factor (ω) to estimate the purecomponent parameters where self-association is neglected in this way. On the other hand, it still matches the experimental critical T, but adjusts the size and shape parameters to obtain an optimal representation of vapor pressure data for associating compounds. However, the latter generally derives its size, shape, and dispersion energy parameters by optimizing the representation of liquid density as well as vapor pressure, but it ignores the experimental value for the critical point. In this regard, two methods reported by Elliott and Natarajan 55 which are later updated by Emami et al. 56 have been used in order to calculate parameters required for pure biodiesel and glycerol components. These methods are based mainly on a group contribution procedure supported by experimental vapor pressure data implementation for both associating and non-associating species. In the first method critical properties (P c and T c ) and ω estimated using GC methods or obtained from reported studies have been used in combination with GC method for shape factor estimation; while in the second method experimental vapor pressure data measured at reduced pressure was combined with GC methods. The parameter values were optimized in all calculations using generalized reduced gradient nonlinear method (GRG Nonlinear) built in Microsoft Excel (v.14.0) spreadsheet. Meanwhile, the parameters of water component related to SAFT-HR and ESD EoS were obtained from Huang and Radosz 51 and Suresh and Elliott 57, respectively. In both ESD and SAFT-HR a linear acceptor-donor association was applied for the treatment of the association thermodynamics of water component. Since, Elliott has reported that linear acceptor-donor restriction permits an increase in computational efficiency of about 100-fold relative to the completely general formulation. 58 As a successful application, Suresh and Beckman have showed that ESD EoS can provide higher accuracy in LLE of hydrocarbon + water mixtures using binary interaction parameters. 59 SAFT approach have been applied to conventional biodiesel processes: Perdomo and Gil-Villegas have reported the use of SAFT-VR (Variable Range) variant after predicting pure FAME component parameters by means of empirical Helmholtz free energy reported by Huber and coworkers 60 for calculating thermophysical properties of three FAME species. 61 In a subsequent study they have reported the A-41
333 APPENDICES phase equilibria and thermophysical property predictions of FAME blends. 62 Moreover, the VLLE of MeOl MeOH glycerol ternary system have been reported by Barreau et al. using GC-PPC-SAFT variant (Group Contribution-Polar Perturbed Chain-SAFT). 63 Pure component parameters of MeOl- (1, 2), MeLi- (1, 2), EtOl- (1, 2), FAEE- (1, 2), and glycerol species calculated in this study were presented in Table A5-5 at Section G of Appendix 5-3. Further details of ESD EoS and SAFT-HR (and its variants) including recent reviews can be found elsewhere. 45,47,48,50,51,64-66 ø ø ø A. Simulations of LLE for RSO MeOl MeOH and MeOl MeOH Glycerol Ternary Systems using UNIFAC-LLE Model Variant Figure A3-1 LLE phase diagram of RSO MeOl MeOH ternary system at K, K, and K simulated using UNI- FAC-LLE model variant. (Functional groups assigned to pseudo-rso species were as follows: 41 CH 2 ; 3 CH 3 ; 1 CH; 4 HC=CH; 1 CH 2 COO; and 2 COO; whereas those of MeOl were 13 CH 2 ; 2 CH 3 ; 1 HC=CH; and 1 CH 2 COO) A-42
334 APPENDICES Figure A3-2 Simulated LLE phase diagram of MeOl MeOH glycerol ternary system at K, and K using UNIFAC- LLE model variant. (See Fig. A3-1 caption for assigned functional groups to MeOl species) B. Predictive LLE Phase Behavior Simulations of FAEE EtOH Glycerol Ternary Systems by means of UNIFAC Model Variants To put it briefly, it was observed in Fig. A3-3 and Fig. A3-4 that the ternary LLE simulations for unsaturated FAEE components by means of UNIFAC-LLE and -VLE variants generated the smallest twophase regions for the 2 nd combination of FAEE components (COO and CH 2 functional groups assigned to ester fragments instead of CH 2 COO); whereas simulations via modified UNIFAC (Do.) generated the opposite behavior. On the other hand, the LLE simulations through UNIFAC-VLE and -LLE variants for systems containing saturated FAEE components showed remarkably different patterns where their 1 st combination (EtPa-1 and EtSt-1) generated the smallest two-phase regions, as in case of modified UNIFAC (Do.) variant. As a result, it is plausible to deduce that there is a strong correlation between HC=CH and CH 2 COO functional groups for UNIFAC-VLE and LLE model variants based LLE simulations. Moreover, as is seen from Fig. A3-2 above, both type of ternary systems (containing ethanol or methanol as the acyl acceptor) have analogous LLE phase behavior. A-43
335 APPENDICES Figure A3-3 Ternary LLE diagrams of EtOl-x EtOH Glycerol ternary systems at K and K simulated through UNIFAC model variants. EtOl Ethyl Oleate; EtOH Ethanol; LLE Liquid-Liquid Equilibria; VLE Vapor-Liquid Equilibria Figure A3-4 Ternary LLE diagrams of EtLi-x EtOH Glycerol ternary systems at K and K simulated through UNIFAC model variants. EtOl Ethyl Oleate; EtOH Ethanol; LLE Liquid-Liquid Equilibria; VLE Vapor-Liquid Equilibria A-44
336 APPENDICES Figure A3-5 Ternary LLE diagrams of EtSt-x EtOH Glycerol ternary systems at K and K simulated through UNIFAC model variants. EtOl Ethyl Oleate; EtOH Ethanol; LLE Liquid-Liquid Equilibria; VLE Vapor-Liquid Equilibria Figure A3-6 Ternary LLE diagrams of EtPa-x EtOH Glycerol ternary systems at K and K simulated through UNIFAC model variants. EtOl Ethyl Oleate; EtOH Ethanol; LLE Liquid-Liquid Equilibria; VLE Vapor-Liquid Equilibria A-45
337 APPENDICES C. LLE Phase Behavior Simulations for EtOl Glycerol Ternary Systems using NRTL Model with different Non-randomness Parameter Values Figure A5-7 Ternary LLE diagrams of EtOl EtOH Glycerol ternary system simulated using correlative NRTL activity coefficient model at K and K. NRTL data was simulated using different α ij values. D. Simulations of LLE Phase Behavior of MeOl MeOH glycerol Ternary System via COSMO-RS Method The LLE phase behavior of MeOl MeOH glycerol ternary system was also simulated using BP- TZVP parameterization and the phase diagrams predicted at 303 and 318 K were depicted in Fig. A3-8 below. As expected, the size of two-phase region is relatively larger than the phase diagrams of EtOl EtOH glycerol ternary system depicted in Section Figure A3-8 Predicted LLE diagram of MeOl MeOH Glycerol ternary system using COSMO-RS method (COSMOtherm v.c2.1_01.11a) at K and K through BP-TZVP parameter set. An oil conversion of 99.5% was assumed. A-46
338 APPENDICES E. Solubility of Glycerol in Free Fatty Acids using UNIFAC-LLE and Modified UNIFAC (Do.) Model Variants Figure A5-9 Solubility of glycerol in free fatty acids (FFA) predicted at K by means of UNIFAC-LLE and Modified UNI- FAC (Do.) model variants. F. Ternary LLE Phase Diagrams of Vegetable oil FFA EtOH H 2 O Quaternary Systems Experimental Measurements Figure A3-10 Ternary LLE phase diagrams of Vegetable Oil Commercial OlAc H 2 O EtOH quaternary systems. The measurements with RSO performed by Batista et al., for a H 2 O concentration range of 1.57% and 1.19% (based on EtOH feed weight). Commercial oleic acids have 81.34% of C18:1 in case of Batista et., and 83.13% in case of Mohsen-Nia et al., A-47
339 APPENDICES Figure A3-11 Ternary LLE phase diagrams of SBO Commercial LiAc H 2 O EtOH quaternary system measured by Chiyoda et al, at K. Water percentages are based on global EtOH feed weights. Commercial linoleic acid contains 71.27% of C18:2; 17.03% C18:1, and 7.63% C16:0. Figure A3-12 Ternary LLE phase diagrams of SBO Commercial LiAc H 2 O EtOH quaternary system measured by Rodrigues et al, at K. Water percentages are based on global EtOH feed weights. Commercial linoleic acid contains 71.27% of C18:2; 17.03% C18:1, and 7.63% C16:0. A-48
340 APPENDICES G. The Conformation Numbers of Species used with COSMO-RS Method and Pure Component Parameters of FAEE Species and Glycerol for ESD and SAFT-HR Equations of State Table A3-5 Conformation numbers of species used in LLE and VLE simulations by means of quantum chemical COSMO-RS method. The numbers of conformations in BP-TZVP and BP-TZVP+HB2010 (and also BP-TZVPD-FINE) are equivalent (Software: COSMOtherm v.c2.1_01.11; v.c2.1_01.11a, and v.c3.0_12.01) A-49

341 APPENDICES H. The LLE Phase Diagrams of FFA EtOH Glycerol Ternary System Simulated via COSMO-RS Method and Reported LLE Data for FAEE EtOH H 2 O Ternary Systems Figure A5-13 Ternary LLE phase diagrams of saturated and unsaturated FFA containing alcohol mixtures (FFA EtOH Glycerol systems) simulated by means of quantum chemical COSMO RS method with three parameter sets (COS- MOtherm v.c3.0_12.01). Figure A5-14 LLE phase diagrams of EtPa H 2 O EtOH ternary system Comparisons of experimental LLE data measured by Follegatti-Romero et al., at K with COSMO-RS method predictions (COSMOtherm v.c3.0_12.01 with 4 parameterization sets and BP-TZVP-ISOCAV parameterization (from v.c2.1_01.11)). A-50
342 APPENDICES Figure A5-15 K-value (phase distribution ratio) of water changing with its concentration in water rich phase for EtPa EtOH H 2 O ternary system at K Comparison of experimental LLE data from Follegatti-Romero et al., with COSMO- RS method (COSMOtherm v.c3.0_12.01 with three parameter sets). Figure A5-16 Experimental LLE phase diagrams of FAEE H 2 O EtOH ternary systems at several T values (see figure legend for FAEE species and T values) LLE data reported by Follegatti-Romero et al., (EtLa and EtMy) and Follegatti- Romero et al., (EtPa, EtOl, and EtLi). A-51
343 APPENDICES I. Quaternary LLE Phase Diagram for Triolein MeOl MeOH Glycerol Systems Simulated by means of COSMO-RS Method Figure A5-17 LLE diagram of Triolein MeOl MeOH Glycerol quaternary system simulated using COSMO-RS method (COS- MOtherm v.c2.1_01.11a with BP-TZVP parameterization) at K and K. A-52
344 APPENDICES Appendix 3-4 Article: Phase Equilibria (LLE and VLE) of Refining Operations for Enzymatic Biodiesel Production via Quantum Mechanical COSMO-RS Method Journal:, Xuebing XU American Institute of Chemical Engineering Journal (AIChE Journal) DOI: /aic A-53
345 Phase Equilibria (LLE and VLE) of Refining Operations for Enzymatic Biodiesel Production via Quantum Mechanical COSMO-RS Method Gündüz Güzel and Xuebing Xu Dept. of Engineering, Aarhus University, Aarhus C. 8000, Denmark DOI /aic Published online in Wiley Online Library (wileyonlinelibrary.com). Phase equilibria, both liquid liquid equilibria (LLE) and vapor-liquid equilibria (VLE), are equally important in the refining operations of biodiesel production. Equilibrium distributions of components at the down-processing of enzymatic ethanolysis reaction were investigated through quantum mechanical COnductor-like Screening MOdel-Real Solvent method with implemented vapor pressure equations. Due to the composite nature of fatty acid ethyl ester (FAEE) components as the biodiesel fuel, multicomponent predictive phase equilibria approach was applied for a model reaction system of refined soybean oil with 30% molar excess amount of ethanol. Simulation results for the LLE at 303 K were in significant agreement with reported experimental data. Minimum boiling azeotropes were found for FAEE-glycerol binaries at isothermal (at 423 and 473K) and isobaric (at reduced pressures) VLE simulations. Similar results were also found at the VLE of glycerol purification operations for multicomponent real case simulations. The feasibilities of simple and rigorous unit operations were also pointed up in this study. VC 2012 American Institute of Chemical Engineers AIChE J, 00: , 2012 Keywords: LLE, VLE, biodiesel refining, phase equilibria, enzymatic ethanolysis Introduction Biodiesel is a renewable alternative diesel fuel, defined as the fatty acid alkyl esters (FAAE) of vegetable oils or animal fats. The alkyl esters produced depend on the alcohol used where methanol and ethanol are the most common with transesterification and esterification as the foremost reactions exerted for producing biodiesel. Since oils/fats mainly consist of triacylglycerides (TAG), the central reaction is transesterification, also called alcoholysis; whereas esterification is only necessary for feedstocks with higher content of free fatty acids (FFA). Transesterification is the exchange of alkoxy group of an ester compound (TAG) with an aliphatic alcohol (the acyl acceptor) in the presence of a catalyst. The reaction stoichiometry requires 3 mols of alcohol per 1 mol of oil to synthesize 3 mols of FAAE and 1 mol of glycerol by-product. Currently, biodiesel is primarily produced from methanolysis of rapeseed, palm, and soybean oil, although numerous other edible/inedible vegetable oils, low-grade by-products of the oil refining industry, as well as waste cooking oils are also suitable feedstocks. In practice, due to the reversible nature of involved reactions, an excess amount of alcohol is required to shift the reaction equilibria towards the products side. 1 The catalysts involved could be conventional basic (alkali) or acidic type (sulfuric or phosphoric acids) Correspondence concerning this article should be addressed to X. Xu at xu@mb. au.dk VC 2012 American Institute of Chemical Engineers homogeneous catalysts; heterogeneous (solid) metal oxides or immobilized lipase enzymes that catalyze both the hydrolytic cleavage and the synthesis of ester bonds in TAG. Biodiesel produced from soybean or rapeseed oil feedstocks are mainly comprised of five different FAAE, which have conventional names of palmitic, stearic, oleic, linoleic, and linolenic acid alkyl esters. The compositions of biodiesel fuels can be considered essentially identical to the fatty acid (FA) composition of the corresponding TAG or FFA sources. 2,3 In other words, the produced biodiesel can be considered as the sum of individual FAAE components weighted with their corresponding FA compositions in the oil substrate. This implies that the various FA chains of the TAG molecules have essentially identical reactivity toward alcohols. 3 Indeed, it is expected that the catalyst used does not possess any substrate- or regio-specificity towards TAG components, particularly in case of enzymatic catalysis. As an advantage of enzymatic biodiesel production, glycerol and biodiesel formed split into two equilibrated and rather limpid liquid phases of which the upper layer is rich in FAAE and lower one rich in glycerol. Generally, quick phase separations occur due to the low solubility of glycerol in the biodiesel and to the lack of liquid catalyst mingling or soap formation. In practice, the split-up of phases can be accomplished either with a settling tank or through centrifugation. 3 Next step is the recovery of excess alcohol from both phases succeeding with further purification of the biodiesel and glycerol phases. The excess and unreacted alcohol distributes between these two liquid phases with relatively high concentration in glycerol phase. 4 A representative AIChE Journal 2012 Vol. 00, No. 0 1

346 Figure 1. Representative process flowsheet diagram for down-stream operations (gray lines represent the EtOH recovery from glycerol rich phase). flow-sheet diagram of the process concerning the unit operations was shown in Figure 1. F1 There are standardized specifications with the aim of controlling the quality of the biodiesel supplied to the market: EN in European countries and a few of its variants in some other countries, such as Brazil, and S. Africa; and ASTM-D6751 in USA, Canada, and Australia. According to both standards, the free glycerol content must be less than 0.02% (w/w). It is reported that high total glycerol content can cause injector fouling, and thus, pressure drop. 5 On the other hand, glycerol is a versatile product that can be used as either a final product like a pharmaceutical ingredient or as a substrate in cosmetic industry for more value added product synthesis. Therefore, instead of using raw glycerol as a feedstock like in fermentation operations for hydrogen production, 6 further purification is generally preferred which also encourage the biodiesel production processes becoming more profitable 7 and more widespread. It is essential to specify the fluid phase compositions in equilibrium for detailed process analysis and/or design of unit operations, such as in simple or rigorous distillations. Besides, phase equilibria studies of such systems are essential for the elaboration of the optimum process conditions, their influence on reaction kinetics, and the selectivity of the desired product. In biodiesel production, both the vapor-liquid (VLE) and liquid liquid equilibria (LLE) are equally important. Liu et al. reported an experimental study on the LLE of soybean oil ethyl ester-etoh-glycerol ternary system at several temperatures. 8 Oliveira et al. 9 measured ternary LLE of MeLa/MeMy/MeSt/-EtOH-glycerol systems. They reported the ternary LLE of systems using the cubic plus association (CPA) EoS model. Recently, the same research group has also reported ternary LLE of canola oil ethyl ester-etoh-glycerol system at K range. Finally, Jachmanian et al. 10 measured sunflower oil ethyl ester-alcohol-glycerol ternary systems at 323 K. However, to the best of our knowledge, there is no published study on the VLE of glycerol-biodiesel (FAME or FAEE) systems, yet. Phase equilibria of highly nonideal mixtures containing polar-associating and nonpolar components can be evaluated through methods based on quantum mechanical (chemical) (QM) calculations. 11 One of the most extensively used QM based method is the COnductor-like Screening MOdel (COSMO) which belongs to the class of quantum mechanical dielectric continuum solvation (or polarizable) models. 12,13 COSMO has become popular in computational chemistry since its first publication and following implementation in MOPAC (Molecular Orbital PACkage). 13 In QM- COSMO approach the solute molecules are considered in a virtual conductor environment where each solute molecule induces a screening (polarization) charge density, r, on the interface between the molecule and the molecular surface (conductor). 14 The screening charge density distribution on the surface of each molecule i is converted into a probability distribution function known as r-profile (p i (r)) which gives the relative amount of surface with polarity r on the surface of the molecule. 14 There are two thermodynamic model theories based on the implementation of the descriptors from the QM-COSMO method: COSMO-RS 15 and COSMO-SAC. 16 The COSMO- RS method where RS pertains to Real Solvents or Realistic Solvation has the basis of statistical thermodynamics approach combined with QM-COSMO calculations. It is based on the theory of interacting molecular surface charges which combines statistical thermodynamics methods with an electrostatic theory of locally interacting molecular surface descriptors derived from the dielectric continuum model COSMO. 14 COSMO-RS can be defined as the statistical thermodynamics treatment of molecular interactions. In this thermodynamic model theory a compound s polarization charge density, which is described by its r-profile, is used for the quantification of the interaction energy of pairwise interacting surface segments, resulting in the compound s chemical potential (its partial Gibbs free energy). 15,17 The activity coefficient of component i in the system S, c S i then can be calculated through lnðc S i Þ¼lS i l 0 i RT where l S i is the chemical potential in the solvent (or solvent system) S, and l 0 i is the chemical potential of the pure component i. COSMO-RS method was applied to describe the fluid phase equilibria of systems, such as the LLE of water-hydrocarbon mixtures, 18 VLE of mixtures containing polar chemicals, 19,20 VLE of butane þ alcohols, 21 and VLE of binary mixtures of 1-propoxy-2-propanol with alcohols and water at reduced pressures. 22 The evaluation of multicomponent phase equilibria required for down-processing operations of enzymatic biodiesel production accompanied by the elementary feasibility inspections of simple unit operations were the major objectives of this study. Multinary (multicomponent) reaction system for LLE simulation was the FAEE-EtOH-Glycerol ternary, whereas for the VLE the binary system of FAEE- Glycerol was simulated for both the isothermal and isobaric operations. Phase simulations were performed through quantum chemical calculations using COSMO-RS method (via COSMOtherm software v.c ). The components with BP-TZVP parameterization (Becke-Perdew (BP) functional for density functional theory calculations with a triple valence plus polarization function (TZVP) basis set 14 ) were used. The necessary parameterization file does always correspond to one functional and basis set. Study was focused on the enzymatic biodiesel production (using immobilized heterogeneous lipase enzymes) involving ethanolysis of refined vegetable oils, like soybean oil containing significantly low levels of FFA, as the feedstocks. (1) 2 DOI /aic Published on behalf of the AIChE 2012 Vol. 00, No. 0 AIChE Journal
347 Table 1. Calculated and Experimental Saturation Temperatures of Individual FAEE Components at Reduced Pressures Ethyl Palmitate Ethyl Stearate Ethyl Oleate Ethyl Linoleate Ethyl Linolenate P (kpa) T (K) P (kpa) T (K) P (kpa) T(K) P (kpa) T (K) P (kpa) T (K) Exp. 6.90E a 7.00E a Calc Exp. 2.06E a 2.33E a Calc Exp. 6.16E a 9.12E a 3.33E b 3.33E b Calc Exp b, c d c c e Calc Exp c d e e Calc Exp c c e c Calc Exp c c c c Calc Exp c c c c Calc Exp c c c c Calc Exp c c c c Calc Exp b c c c Calc Exp c c e Calc % MAD T min (K) T max (K) R a Ref. 24. b Ref. 3. c Ref. 25. d Ref. 26. e Ref. 27. Methods Vapor pressures of FAEEs Even though COSMO-RS method allows for the estimation of pure compound vapor pressures, 19 it is preferable to use available experimental data or correlations obtained using such data. As a matter of fact, reliable vapor pressure calculations of FAEE components are essential to obtain the high quality of estimations in VLE simulations. Consequently, the extended versions of Antoine equations (DIPPR 101 type equation 23 ) were established and implemented into COSMOtherm software for EtOH, glycerol, and the major FAEE components from soybean (or rapeseed oil) feedstock. The vapor pressure versus temperature data of individual FAEE components for the temperature ranges given in Table 1 were taken from PRO/II v.9.0 chemical process simulation software 28 database and fitted to the extended type Antoine equations using the Levenberg-Marquardt nonlinear least squares method. 29 Some data points were modified with the available experimental ones before the regression. It is noteworthy that although they were measured at the same reduced pressures, reported experimental data from different sources also shows considerable inconsistencies for the same components. The extended type Antoine equation can be given as follows lnðp 0 i Þ¼A þ B T þ C lnðtþþdt2 (2) where p 0 i is the vapor pressure of pure component i; T is temperature; and A, B, C, and D are the equation coefficients. Experimental and calculated saturation temperatures at several respective pressures are presented in Table 1 accompanied by the correlation coefficients for the fitted equations. As reported by Goodwin and Newsham, 30 the fatty acid methyl esters (FAME) usually require use of vacuum distillation due to the thermal instability. Similarly, the majority of experimental values for FAEE saturation temperatures were also reported at reduced pressures. It was found that the saturation temperatures of saturated FAEE have the highest mean absolute deviation (MAD) for ethyl stearate (EtSt) with 2.10% followed by 2.02% for ethyl palmitate (EtPa). A MAD of 0.69% was calculated for the polyunsaturated ethyl linolenate (EtLn) species where there was only two available experimental data points. The best performance with lowest MAD value was obtained for the monounsaturated ethyl oleate (EtOl) species (see Table 1). In overall, there is a significant agreement between experimental and calculated saturation temperatures (boiling points). Vapor pressure data values of glycerol and EtOH molecules changing with temperature were taken from CHEMCAD v.6.4 chemical process simulation software 31 and re-regressed to extended type Antoine equation to get the consistent coefficient values. The temperature ranges for glycerol and EtOH were taken between to 850 K and to K, respectively. LLE of FAEE-EtOH-glycerol ternary systems In essence, ideal solutions or solutions exhibiting negative deviation from ideal behavior cannot form two liquid phases. 32 Instead, for two or more liquid phases to exist AIChE Journal 2012 Vol. 00, No. 0 Published on behalf of the AIChE DOI /aic 3
348 Figure 2. LLE of glycerol-etoh FAEE ternary system at 303 K (data reported by Liu et al. 8 were measured at 300 K). FAEE: Fatty acid ethyl ester, EtOH: Ethanol. [Color figure can be viewed in the online issue, which is available at wileyonlinelibrary.com.] together (i.e., for phase separation) significant positive deviation from ideal behavior is required. As mentioned above, the FAEE and glycerol are practically immiscible and, thus, imply significant positive deviation resulting equilibrated two phases when brought into contact. In other words, glycerol as a liquid capable of forming three-dimensional (3-D) networks of strong hydrogen bonds; whereas biodiesel (FAEE) composed of molecules containing donor atoms, but no active hydrogen atoms cannot form homogeneous solutions when mixed in equal amounts. The LLE condition (also called iso-activity condition) in which the same standard state is assumed for all components in two phases can be defined as follows ½c S x i iš PhaseI ðt; P; fg x PhaseI Þ¼½c S x i iš Phase II ðt; P; fg x Phase II Þ i ¼ 1; 2; ; n where Phase I and Phase II refer to the two equilibrated liquid phases. The products of transesterification reaction with near complete conversion will eventually separate into two phases where each phase will comprise particular amounts of FAEE, glycerol, and unreacted (excess) EtOH in dissolved forms. The FAEE compositions of two phases were calculated as the sum of individual FAEE components distributed between the phases I or II xfaee ¼ XM i¼1 ð3þ I or II x (4) i For the sake of a realistic simulation, the LLE was estimated for an enzymatic transesterification reaction achieving a conversion of up to 99.5%. The substrate EtOH with 30% of molar excess amount and stoichiometric amounts of synthesized FAEE and glycerol were used in the global composition. In the beginning of reaction, the oil phase was supposed to be a medium completely miscible with EtOH and changing into a fatty phase (oil þ FAEE) and an alcohol phase (EtOHþ glycerol) with the reaction progress. Since FAEE is miscible with EtOH at 303 K, the homogeneous media assumption for oil-etoh binary mixture is valid above ca. 15% of conversion (Güzel et al., submitted). Hence, initially the EtOH mole fraction was taken as 1.0 which diminishes to with the reaction course (conversion up to 99.5%). At that conversion level, mole fractions of FAEE and glycerol were calculated and 0.203, respectively. The variation of global composition from 0 to 99.5% FAEE, so-called conversion line, is represented in Figure 2. It is worth noting that enzymatic transesterification reactions generally accomplished at moderate temperatures between 308 and 323 K and ambient pressure condition. 33 Consequently, the LLE of FAEE-EtOH-Glycerol ternary system was simulated at a lower-temperature of 303 K at which the collection of the reacted mixture was considered for refining operations. The estimations were illustrated together with the experimental data points 8,34 in Figure 2. To provide the data points consistency on the ternary phase diagram, values reported as weight fractions by Liu et al. 8 and by Oliveira et al. 34 were transformed into mole fractions through the assumption of the same FA compositions for oils and their corresponding ester derivatives. In this regard, the molecular weights of FAEE were calculated g/mol for soybean oil FAEE 8 and g/mol for canola oil FAEE. 34 It is well-known that the rotational symmetry of a carbon carbon single bond allows the atoms or groups of atoms connected by that bond to rotate about it. Due to this kind of rotation, many molecules assume several different 3-D forms. They are called as conformations where some conformations of a particular molecule are more stable than others are. Consequently, due to composite nature of biodiesel (FAEE), all the simulations were performed using three conformers for saturated FAEE species (EtPa and EtSt); though only one conformer for each unsaturated FAEE species (EtOl, EtLi, and EtLn) was used. Besides, EtOH is simulated using two conformers and the by-product glycerol with 10 conformers. The sigma profiles of FAEE, EtOH and glycerol conformations were given in the Appendix. In LLE and VLE simulations, all the conformers were weighted according to their Boltzmann distributions in the system. 14 It was evidenced that using three different conformations for each saturated FAEE component do not affect the LLE and VLE estimations, as expected. Since, it is reported that in saturated hydrocarbons such bond-rotational conformations have minor influence on the phase equilibria and chemical potential estimations. 14 However, conformers of glycerol showed faintly different results, especially for the binary VLE calculation of unsaturated FAEE and glycerol. VLE of FAEE-glycerol binary systems Analogous to LLE, it was required that at equilibrium the partial molar Gibbs free energy (i.e., chemical potential) of each component must be the same in liquid and vapor phases present in the system. The total pressure used in the computation of VLE phase diagrams is calculated through Eq. 5 where x i is the mole fraction of component i in the liquid phase. P ¼ Xn i¼1 p 0 i x ic S i i ¼ 1; 2; ; n (5) The vapor phase mole fraction, y i is defined as the ratio of partial vapor pressure, p i to the total pressure, P with the 4 DOI /aic Published on behalf of the AIChE 2012 Vol. 00, No. 0 AIChE Journal
349 assumption of ideal behavior for the gas phase 19 is given by Eq. 6. y i ¼ p i P ¼ p0 i x ic S i P VLE calculations can be performed both isothermally and isobarically. To simulate vacuum evaporation/distillation, isobaric VLE calculations were computed at reduced pressures of up to 10 and 50 kpa for both individual FAEE components and biodiesel fuel; whereas reduced pressure of 1 and 10 kpa were applied for the VLE simulation in glycerol purification step. It is reported that purified biodiesel fuel (FAME) and glycerol are susceptible to thermal decomposition above 523 K 35 and 423 K, 36 respectively. As a result, temperature values of 413 (for glycerol purification), 423, and 473 K (for biodiesel purification), were chosen for the isothermal VLE computations with the purpose of preventing separated biodiesel and glycerol phases from decomposition. As mentioned above biodiesel is naturally a mixture of ethyl (methyl) esters of long-chain fatty acids and the simulation of real processes requires using such mixtures rather than using the major constituent as a pure single component. However, the calculation of thermodynamic properties, such as vapor pressure, generally requires such single component approximation. To provide a realistic simulation, the mixture of FAEE species was considered as a near-ideal solution which was pointed out for the mixture of FAME species by Goodrum et al. 37 Thus, the total vapor pressure of the FAEE mixture in the system was calculated from the vapor pressure of individual FAEE components using the Eq. 7 given below. 38 p FAEE ¼ XN i¼1 (6) p i z i (7) where z i is the mole fraction of the FA composition of vegetable oil feedstocks applied as a weighing factor. Ultimately, instead of the single component approximation, both the LLE and VLE simulations where each FAEE is weighted with the corresponding FA composition of oil source were performed for multinary systems: 5 FAEE þ EtOH þ Glycerol for EtOH recovery and 5 FAEE þ glycerol for the VLE of purification operations. Soybean oil was chosen as the biodiesel feedstock with the molar composition 39 of 10.82% C16:0; 4.89% C18:0; 25.21% C18:1; 51.51% C18:2; and 7.47% C18:3. The total biodiesel (FAEE) mole fraction at vapor phase was calculated as the sum of individual mole fractions of ethyl esters, analogous to Eq. 4 y FAEE ¼ XM i¼1 y i (8) Results and Discussion LLE of FAEE-EtOH-glycerol ternary system The ternary LLE diagram shown in Figure 2 indicates that FAEE is virtually immiscible with glycerol, whereas the opposite is not correct. This can be evidenced through the leftshift of the binodal curve from the corresponding edge of the triangle on the FAEE rich phase. The diagram shows that the experimental data points of Oliveira et al. 34 and Liu Figure 3. Change of distribution ratios of individual FAEE components at 303 K through conversion (EtPa: Ethyl palmitate; EtSt: Ethyl stearate; EtOl: Ethyl oleate; EtLi: Ethyl linoleate; EtLn: Ethyl linolenate). et al. 8 are in significant agreement with the COSMOtherm predictions. This is particularly valid for the glycerol rich phase, where FAEE is practically immiscible. On the other hand, there is a pseudo-homogeneous medium for the conversions up to 30% where both the diminishing EtOH and accumulating glycerol is completely soluble within the fatty (oilþpartial glyceridesþfaee) medium (Güzel et al., submitted). This was accounted for the fact that high concentration of EtOH helps mutual solubility of FAEE and glycerol formed. In addition to completely miscible media assumption given above, it should be pointed out that the miscibility of glycerol with vegetable oil phase was lower than with FAEE, and can be considered practically insignificant (data was not presented). Although the data reported by Liu et al. was measured at 300 K, it agrees significantly with the other two particularly in the glycerol rich phase. In contrast, the results reported by them show a significant solubility of glycerol in FAEE phase at higher concentrations of EtOH, which cannot be evidenced considering this predictive study and Oliveira and coworkers study. Furthermore, the correspondence between experimental data of Oliveira et al. and predicted ones is highly reasonable with the exception of flimsily high solubility in experimental data at FAEE rich phase that can be attributed to polar impurities in FAEE substrate and analytical errors. In consequence, the approach of using biodiesel as the mixture of FAEE components weighted with corresponding FA composition values and using multinary LLE estimations was confirmed as merely reliable. The distribution ratios of individual FAEE components in the mixture were illustrated in Figure 3 so as to reveal their affinity for the glycerol rich phase. As seen from the figure, in the beginning of the reaction the highest affinity for glycerol was revealed by polyunsaturated EtLn component followed by ethyl linoleate (EtLi) and then saturated EtPa component. This affinity can be analogously accounted for to the fact that degree of unsaturation and decrease in molecular weight of saturated components positively affect the solubility of FA in EtOH. 40 It is noticeable that with the reaction course the distribution ratio of each component approaches to the same minimum level in the glycerol phase. It is also worth noting that due to the higher affinity of polyunsaturated FAEE to glycerol, simultaneous removal of glycerol AIChE Journal 2012 Vol. 00, No. 0 Published on behalf of the AIChE DOI /aic 5
![Figure 4. Isothermal VLE of individual FAEE Glycerol binaries at 423 and 473 K. [Color figure can be viewed in the online issue, which is available at wileyonlinelibrary.com.] Figure 6.](/docs-images/78/77247352/images/350-0.jpg "Minimum boiling azeotrope points for individual FAEE components. formed may improve the cetane number and the oxidation stability of the final biodiesel product.")

350 Figure 4. Isothermal VLE of individual FAEE Glycerol binaries at 423 and 473 K. [Color figure can be viewed in the online issue, which is available at wileyonlinelibrary.com.] Figure 6. Minimum boiling azeotrope points for individual FAEE components. formed may improve the cetane number and the oxidation stability of the final biodiesel product. 3 Data represented in Figure 2 indicates that for the conversion levels above 30% glycerol formed will practically separate from the fatty phase and may remain as suspended droplets in the mixture depending on the physical conditions applied during the reaction. It is worth to recall that since the unreacted (excess) amount of EtOH acts as a cosolvent increasing the mutual solubility of glycerol and FAEE; some minor amounts of glycerol can be dissolved in the final biodiesel phase. However, as it is obviously shown in the ternary diagram (Figure 2), this small amount of dissolved glycerol exceeds the specified limit of 0.02% (w/w) (which corresponds to 0.066% (m/m)). Here, the molecular weight of FAEE was calculated as g/mol according to the soybean oil composition given above. Stating briefly, with the aim of producing biodiesel in the specification limits further separation and purifications are evidently required. VLE of FAEE-glycerol binary systems In this section, the formation of minimum azeotropes will be discussed. However, it is noteworthy that due to significant immiscibility of FAEE and glycerol with each other such minimum boiling azeotropes cannot be practically observed in enzymatic biodiesel production processes, if the system temperature is lower than 333 K and also if the conversion is higher than 44%. The mole fraction(s) where such azeotrope points occur depends on the FAEE component (and on the biodiesel composition). Hence, the FA composition of substrate, in particular polyunsaturated FA composition, should be considered as a characteristic measure. These points will be further evaluated in the succeeding subsections, in particular for real case simulations of glycerol purification step. Individual FAEE-glycerol binaries: isothermal case Figures 4 and 5 illustrate the isothermal VLE of pure FAEE-glycerol binaries. As seen from the figures for each binary system azeotrope points were found. The corresponding temperature values were below the boiling points of pure components forming the binaries. Such mixtures are called as minimum boiling azeotrope mixtures. The azeotrope points were illustrated in Figure 6 where azeotrope mole fraction values of FAEE decrease with temperature; with the degree of unsaturation; and with the increase in carbon number for saturated FAEE. The lowest azeotrope mole fraction was calculated for EtLn-glycerol whereas the highest was observed for EtPa-glycerol binary system. The highest saturation pressure was calculated for EtPa-glycerol binary system which is not exceeding 9 kpa at 473 K (see Figure 5). Similar azeotrope point observations were reported for smaller methyl ester-alcohol binaries by Constantinescu and Wichterle 41 for the isothermal VLE of methyl propionate / methyl butanoate-etoh mixtures. Figure 5. Isothermal Pxy diagram of individual FAEE Glycerol binaries at 423 and 473 K. [Color figure can be viewed in the online issue, which is available at wileyonlinelibrary.com.] 6 DOI /aic Published on behalf of the AIChE 2012 Vol. 00, No. 0 AIChE Journal
351 Figure 7. Isobaric VLE of individual FAEE glycerol binaries at 10 and 50 kpa. [Color figure can be viewed in the online issue, which is available at wileyonlinelibrary.com.] Individual FAEE-glycerol binaries: isobaric case Isobaric VLE of pure FAEE-glycerol were depicted in Figures 7 and 8 for reduced pressure values of 10 and 50 kpa. Analogous to isothermal case, each FAEE shows minimum boiling azeotrope points, while in that case the points are virtually the same at 10 and 50 kpa for binary systems containing EtSt, EtOl, and EtLn. However, it changes with the decrease in vacuum from 10 to 50 kpa for EtPa and EtLi cases. Interestingly, EtSt shows the same azeotropic points for three pressure values as illustrated in Figure 6. The azeotropic temperatures were ca. 480 K and ca. 530 K at 10 and 50 kpa, respectively (see Figure 8). It was reported that isobaric VLE measurements of small methyl, 42,43 ethyl, 44,45 propyl, 46 and butyl 47,48 ester-alcohol(s) binaries show similar azeotrope points at atmospheric pressure ( kpa). In addition, Ortega and Susial 49 were reported minimum boiling azeotropes for methyl propanoate-etoh mixture at higher pressures of and kpa. VLE of refining operations: isothermal and isobaric real case simulations VLE of Ethanol Recovery. As stated above, to shift the equilibrium reaction towards the products side it is always necessary to use acyl acceptors (alcohols) in excess amount. According to Knothe et al. 3 the excess amount of alcohol should not be removed before the separation of glycerol and ester phases due to the risk of reverse transesterification reaction, in particular while enzyme residues possibly remain within the phases. EtOH remained in both phases following this initial phase separation can be recovered using a flash distillation (evaporation), a vacuum stripping process, 3 or a falling film evaporator unit (see Figure 1). The partition of EtOH between ester and glycerol phases was plotted in Figure 9. It can be perceived from these curves that the K-value is always higher than 1.0 and increases with the conversion, especially in case of COSMO-RS predictions. This means that on account of relatively higher solubility of alcohols, such as MeOH and EtOH, in the polar glycerol phase, EtOH will distribute in higher amounts into the glycerol phase. Therefore, most of the EtOH will remain in the glycerol phase after the initial phase separation. It should be noted that since the global composition of FAEE-EtOH-Glycerol ternary system is not mentioned in Oliveira et al. 34 these values were calculated as the average value of each tie-line data. Similar to the predicted results, EtOH distribution ratio measured by Oliveira et al. also increases with the decrease in global EtOH mole fraction (with conversion). Accordingly, although the rate of increase was not quantitatively comparable, Figure 9 shows that EtOH concentration in glycerol will always be higher than in ester phase. The simulated VLE results of the EtOH recovery from biodiesel phase were presented in Table 2 for 85.2 and 99.5% conversion levels. As a measure of evaporation tendency, the K-values (K i ¼ yi x i ) for EtOH both in isothermal and in isobaric operations were significantly higher than the values of glycerol and FAEE in biodiesel rich phase. It was found that isothermal and isobaric VLE simulations have virtually the same K-values for EtOH component, but not for glycerol and FAEE mixture. This can be considered as an opportunity of finding the most feasible operation in terms of EtOH recovery and its purity. The applied temperature in isothermal operations may not be safe for the biodiesel components with carbon numbers of C12.0 and C14.0 where the decomposition and, thus, loss of such FAEE species might be relatively higher. The isobaric operation at a vacuum of 10 kpa was considered as the most feasible option with regard to the K-values. On the other hand, the relative volatility (a ij ¼ Ki K j ) of components were also calculated as a measure of the ease of separation. Considering the purity of recovered EtOH Figure 8. Isobaric Txy diagram of individual FAEE Glycerol binaries at 10 and 50 kpa. [Color figure can be viewed in the online issue, which is available at wileyonlinelibrary.com.] AIChE Journal 2012 Vol. 00, No. 0 Published on behalf of the AIChE DOI /aic 7
352 Figure 9. Change of distribution ratio of EtOH at 303 K through conversion (data reported by Liu et al. 8 were measured at 300 K). (a Gly,FAEE ¼ and a EtOH,Gly ¼ ), isobaric operation under 50 kpa of vacuum was chosen as the most suitable option to strip excess EtOH from biodiesel phase. Yet, vacuum stripping is the generally preferred operation 3 which can also help to the further purification of FAEE at ambient pressure, such as the removal of glycerol impurities by mixing water with the hot mixture resulting from the EtOH recovery. For instance, if this unit operation were achieved isobarically at 50 kpa, the corresponding temperature of biodiesel phase would be ca. 365 K. Blending the succeeding biodiesel mixture with water at ambient temperature (such as, 1:1 (v:v)) will result with significantly high mixture temperature value. It is notable that for conversions above 50%, dissolved glycerol in biodiesel phase (and vice versa) was estimated to remain miscible with the respective system at ca. 365 K. Nonetheless, from the engineering viewpoint, process economics should also be considered in an attempt to make a feasible choice. It is reported that isobaric VLE of methyl butanoate-etoh at kpa 42 ; methyl propanoate-etoh at and kpa 49 ; and isothermal VLE of the same two binaries at and K 41 show minimum boiling azeotropes. In contrast to such minimum azeotrope points reported for lower alkyl esters-etoh mixtures, analogous results were not observed for mixtures of EtOH and long-chain fatty acid ethyl esters of vegetable oils. To conclude this section, simulation results showed that the recovery of EtOH from glycerol rich phase is relatively easier than from the biodiesel rich phase (data was not shown). Simple distillation systems depicted in Figure 1 were considered rather adequate for the EtOH recovery. VLE of Biodiesel Purification. The VLE simulation results for further purification of biodiesel phase were presented in Table 3 and illustrated for isobaric cases in Figure 10. As seen from the table, it is very achievable removing the dissolved glycerol through isothermal simple unit operations, such as flash distillation or evaporation for conversions above 89 to 99.5% (points indicated with black circles in Figure 10). In addition to glycerol tendency to decompose above 423 K, 36 operating at 473 K might be risky due to decomposition of shorter FAEE components. As a result, it was found better to operate at lower temperatures. On the other hand, since the temperature exceeds the critical Table 2. VLE Simulation Results for FAEE-EtOH-Glycerol System at Isobaric and Isothermal Conditions for Biodiesel Rich Phase Cond. T (K) or P (kpa) Species K-value Relative Volatility Sat. P (kpa) or Sat. T (K) 85.2 % conversion Iso T 423 K EtOH a EtOH,FAEE 1.314E þ Glycerol 1.384E-02 a Gly,FAEE FAEE 4.601E-04 a EtOH,Gly K EtOH a EtOH,FAEE 3.109E þ Glycerol 3.783E-02 a Gly,FAEE FAEE 1.941E-03 a EtOH,Gly Iso P 10 kpa EtOH a EtOH,FAEE 2.054E þ Glycerol 3.600E-04 a Gly,FAEE FAEE 2.945E-06 a EtOH,Gly 1.681E þ kpa EtOH a EtOH,FAEE 1.723E þ Glycerol 2.252E-03 a Gly,FAEE FAEE 3.510E-05 a EtOH,Gly kpa EtOH a EtOH,FAEE 5.483E þ Glycerol 5.090E-03 a Gly,FAEE FAEE 1.103E-04 a EtOH,Gly % Conversion Iso T 423 K EtOH a EtOH,FAEE 1.361E þ Glycerol 2.232E-02 a Gly,FAEE FAEE 6.879E-04 a EtOH,Gly K EtOH a EtOH,FAEE 3.153E þ Glycerol 6.028E-02 a Gly,FAEE FAEE 2.961E-03 a EtOH,Gly Iso P 10 kpa EtOH a EtOH,FAEE 1.468E þ Glycerol 8.749E-04 a Gly,FAEE FAEE 6.384E-06 a EtOH,Gly 1.071E þ kpa EtOH a EtOH,FAEE 1.015E þ Glycerol 5.713E-03 a Gly,FAEE FAEE 9.234E-05 a EtOH,Gly kpa EtOH a EtOH,FAEE 3.011E þ Glycerol 1.305E-02 a Gly,FAEE FAEE 3.111E-04 a EtOH,Gly Italic values given in the last column correspond to saturation pressures, while ones in bold form correspond to saturation temperatures. 8 DOI /aic Published on behalf of the AIChE 2012 Vol. 00, No. 0 AIChE Journal
353 Table 3. VLE Simulation Results for Biodiesel and Glycerol Purifications at Isobaric and Isothermal Conditions 89% Conv. a 99.5% Conv. Conditon T (K) or P (kpa) Components (K-Value ¼ y i /x i ) Sat. P (kpa) or T (K) (K-Value ¼ y i /x i ) Sat. P (kpa) or T (K) FAEE Purification Iso T 423 FAEE Glycerol a Gly,FAEE FAEE Glycerol a Gly,FAEE Iso P 10 FAEE Glycerol a Gly,FAEE FAEE Glycerol a Gly,FAEE FAEE Glycerol a Gly,FAEE Iso T 413 FAEE Glycerol a Gly,FAEE Iso P 1 FAEE Glycerol a Gly,FAEE FAEE Glycerol a Gly,FAEE Italic values given in the second, the fifth, and the last columns correspond to saturation pressures, while ones in bold form correspond to saturation temperatures. a 74.4% conversion in case of glycerol purification; K-values and relative volatilities were emphasized in bold form. temperature limit (523 K) reported for FAME decomposition, 35 isobaric operations seems to be completely unsafe. Besides, neither 10 nor 50 kpa of vacuum levels perform better than isothermal cases for such simple unit operations (see Table 3). In brief, glycerol removal needs to be performed by means of isothermal simple distillation, film evaporation or more conveniently by means of hot water-washing operations, as stated earlier. VLE of Glycerol Purification. VLE simulations of glycerol purification were shown for isobaric cases on Figure 11 and were tabulated in Table 3. In that case isothermal operation at 413 K showed yet again relatively better results than Figure 10. Isobaric Txy diagram of FAEE Glycerol binary system at 10 and 50 kpa for biodiesel purification. Figure 11. Isobaric Txy diagram of FAEE Glycerol binary system at 1 and 10 kpa for glycerol purification. AIChE Journal 2012 Vol. 00, No. 0 Published on behalf of the AIChE DOI /aic 9

354 Figure 12. Isobaric predictive and experimental 51 saturation temperature data of FAME 1 Alcohol binary systems at kpa. Predictions were simulated using COSMO-RS method. [Color figure can be viewed in the online issue, which is available at wileyonlinelibrary.com.] isobaric simple operations, even at 1 kpa of vacuum. Besides, at such a significantly low vacuum, the temperature still exceeds (ca. 430 K) the critical limit (see Figure 11). In contrary to the 423 K value mentioned by Zhang et al. 36 for decomposition of glycerol, Briggs 50 pointed out that glycerol is not decomposed even at a temperature of 473 K under vacuum. Despite the fact that glycerol has lower boiling points than FAEE mixture, in general, the K-values of FAEE was rather higher than of glycerol. Therefore, relative volatility of glycerol to FAEE (a Gly,FAEE ) which is defined as the ratio of K-value of more volatile to the less volatile component by convention, was lower than unity. Since the K-values of glycerol are very close to unity, glycerol will split equally between the vapor and liquid phases. This concluded that is not possible to purify glycerol phase by means of simple unit operations. Nonetheless, it is worth noting that as an advantage of enzymatic biodiesel production, glycerol after the stripping of EtOH should theoretically have a purity of 98.3 to 98.8 wt % for the conversion levels of 74.4% and 99.5%, respectively. Moreover, since the solubility tends to decrease with the reduction in temperature, further purification might be practically achieved by settling at ambient temperature and removing the upper layer (fatty phase) after reaching to the equilibrium. Though, this condition depends on the level of impurities within the glycerol phase, the type of feedstocks used, and also the level of conversion. In overall, further purification of glycerol requires using vacuum distillation or rectification operations. Figure 11 shows that for the low levels of conversion, there observed several near azeotrope point(s) formation (small arrows indicate the conversion direction). Since the major constituent of FAEE mixture is EtLi (51.51%) which shows minimum boiling azeotrope, for instance, at a mole fraction of at 10 kpa (T az ¼ ca. 483 K) for the EtLi- Glycerol mixture and the others do not have enough concentration for the azeotropy formation (see Figure 6), the observed azeotrope points are not exact azeotrope points. Instead, due to composite nature of biodiesel, they should be called pseudo-azeotrope points ranging from 39 to 44% of conversion for isothermal and isobaric VLE simulations. Nonetheless, with the increase in conversion and subsequent phase splitting of glycerol and fatty phases, it is unlikely to observe such azeotrope points in enzymatic biodiesel production processes. On the other hand, in conventional biodiesel production the FAEE solubility is expected to be higher in the glycerol rich phase due to homogeneous catalysis, FFA content, soap formation, and some other impurities in the feedstocks, such azeotropes can be easily observed even at higher conversion levels. VLE of FAME þ Alcohol Binary Systems. To assess the prediction quality of COSMO-RS method (COSMOtherm) experimental isobaric VLE data measured for MeLa/ MeOlþMeOH/EtOH binary systems at atmospheric pressure ( kpa) 51 was compared with COSMOtherm predictions. The results were illustrated in Figure 12 where the best quantitative performance was obtained with MeLa- EtOH system which is followed by MeOlþEtOH system. However, significant deviation was observed for MeOl mole fractions higher than 0.6. This is expected to stem from the fact that the MeOl used in experimental measurements has 71.1 wt % of purity. The increase in ester concentration and, thus, in impurity significantly affects the saturation temperature. In contrast, relatively poorer performances were obtained with MeOH containing systems. It was evidenced that experimental data points of MeOlþMeOH system representing the highest deviation from the corresponding predictions almost overlaps with experimental data of MeLaþMeOH system. As seen from Figure 12 for lower FAME concentrations up to 0.4, COSMOtherm predictions for binary systems containing MeOH still have reasonable agreements. In overall, due to 29 wt % of impurity in commercial MeOl species, MeOlþalcohol binary systems showed relatively higher deviations in terms of saturation temperatures. To bring this section to an end, the prediction quality of COSMO-RS method on VLE simulations of FAMEþalcohol binaries, particularly FAMEþEtOH system, showed reasonable correlations, which elucidate the suitability of using COSMO-RS method for phase equilibria simulation of biodiesel fuel refining operations. The minimum boiling azeotrope points were also evaluated using the experimentally available data for shorter alkyl alkanoate-alkanol mixtures forming azeotrope points. For instance, experimental azeotrope point was reported at x az, ethyl propanoate ¼ 0.628, T az ¼ K coordinates for the binary system of ethyl propanoate þ butan-2-ol. 44 Hernandez and Ortega 44 have also reported an additional reference data for the same system as x az, ethyl propanoate ¼ and T az ¼ K which differs considerably from the value they measured. COSMOtherm simulation of the same binary system produced azeotrope point at x az, ethyl propanoate ¼ with the azeotrope temperature value of T az ¼ K which is in significant agreement with the experimental values. To bring this study to an end, it was evidenced that COSMO-RS method predicts the VLE and azeotrope formation rather significantly either with the implemented vapor pressure equations or with default equations in the database of the software. Conclusions Phase equilibria (LLE and VLE) involved in refining operations of enzymatic ethanolysis reaction for biodiesel production were simulated using quantum chemical COSMO- RS method. The required vapor pressure vs. temperature data values of FAAE components were taken from PRO/II 10 DOI /aic Published on behalf of the AIChE 2012 Vol. 00, No. 0 AIChE Journal
355 v.9.0 chemical process simulation software 28 database and fitted to the extended type Antoine equations after modifying some with experimental data points using nonlinear least squares method. The regressed equations were implemented into COSMOtherm software. The comparisons with experimentally available data points showed a maximum of 2.10% MAD for EtPa. Multinary phase equilibria simulation through near-ideal mixture approximation for biodiesel was performed to realistically simulate the system of FAEE mixture, EtOH, and glycerol instead of using ternary system including the major constituent of FAEE mixture as the biodiesel component plus EtOH, and glycerol. Isothermal and isobaric (at vacuum conditions) VLE involved in unit operations were estimated, analogously. It was observed that both multinary LLE and VLE approaches produce merely reliable results. The comparisons of available experimental data with LLE and VLE simulations were in significant agreement. Moreover, binary VLE of individual FAEE components and glycerol showed minimum boiling azeotropes where the highest azeotrope mole fraction of was observed for EtPa at 423 K. Similar pseudo-azeotrope points were also observed with FAEE-Glycerol binaries. At low conversions (ca %) EtLi -as the major constituent of soybean oil derived FAEEhad sufficient concentration for the formation of azeotropy. Finally, it was shown that simple unit operations such as flash distillation or evaporation are not feasible for further purification of glycerol phase, except for the unit operation of excess and unreacted EtOH recovery. Water washing was considered as adequate for further purification of biodiesel. Further purification of glycerol may well require rigorous distillation units consisting of rectification and stripping parts. Acknowledgments The authors thank the Advanced Technology Foundation (HTF) and the Novozymes A/S for the financial support (Sustainable Biodiesel Project). Notation p i ¼ partial vapor pressure, kpa p i (r) ¼ probability distribution function (r-profile) {x} ¼ set of liquid phase mole fractions x 1, x 2,..., x n p 0 i ¼ the vapor pressure of pure component i, kpa COSMO ¼ COnductor-like Screening MOdel COSMO-RS ¼ COnductor-like Screening Model-Real Solvents CPA ¼ cubic plus association equation of state EtLi ¼ ethyl linoleate (linoleic acid ethyl ester) EtLn ¼ ethyl linolenate (linolenic acid ethyl ester) EtOH ¼ ethanol (ethyl alcohol) EtOl ¼ ethyl oleate (oleic acid ethyl ester) EtPa ¼ ethyl palmitate (palmitic acid ethyl ester) EtSt ¼ ethyl stearate (stearic acid ethyl ester) FA ¼ fatty acid FFA ¼ free fatty acid FAAE ¼ fatty acid alkyl ester FAEE ¼ fatty acid ethyl ester FAME ¼ fatty acid methyl ester FFA ¼ free fatty acid K i ¼ tendency of evaporation or distribution value for component i LLE ¼ liquid liquid equilibria M ¼ number of FAEE components in the separated phases MAD% ¼ mean absolute deviation percentage MeLa ¼ methyl laurate (lauric acid methyl ester) MeMy ¼ methyl myristate (myristic acid methyl ester) MeOH ¼ methanol (methyl alcohol) MeOl ¼ methyl oleate (oleic acid methyl ester) MeSt ¼ methyl stearate (stearic acid methyl ester) m/m ¼ mole per mole based P ¼ total pressure, kpa QM ¼ quantum mechanical T ¼ absolute temperature, K TAG ¼ triacylglyceride VLE ¼ vapor-liquid equilibria w/w ¼ weight per weight based x i ¼ liquid phase mole fraction of component i y i ¼ vapor phase mole fraction of component i z i ¼ the mole fractions of FA composition of vegetable oil feedstocks Greek letters c S i ¼ activity coefficient of component i in the system (solvent system) S l S i ¼ chemical potential of component i in the system (solvent system) S l 0 i ¼ chemical potential of pure component i a ij ¼ relative volatility r ¼ screening (polarization) charge density Literature Cited 1. Ma FR, Hanna MA. Biodiesel production: a review. Bioresour Technol. 1999;70: Karaosmanoğlu F, Cığızoğlu KB, Tüter M, Ertekin S. Investigation of the refining step of biodiesel production. Energy Fuels. 1996;10: Knothe G, Van Gerpen J, Krahl J. The Biodiesel Handbook, 2nd ed. Champaign, Illinois: AOCS Press, Negi DS, Sobotka F, Kimmel T, Wozny G, Schomacker R. Liquidliquid phase equilibrium in glycerol-methanol-methyl oleate and glycerol-monoolein-methyl oleate ternary systems. Ind Eng Chem Res. 2006;45: Cheng LH, Cheng YF, Yen SY, Chen JH. Ultrafiltration of triglyceride from biodiesel using the phase diagram of oil-fame-meoh. J Membr Sci. 2009;330: Liu F, Fang B. Optimization of bio-hydrogen production from biodiesel wastes by Klebsiella pneumoniae. Biotechnol J. 2007;2: Wen Z, Pyle DJ, Athalye KS. Glycerol waste from biodiesel manufacturing. In: Aggelis G, editor. Microbial Conversions of Raw Glycerol. New York: Nova Science Publishers, 2009: Liu X, Piao X, Wang Y, Zhu S. Liquid-liquid equilibrium for systems of (fatty acid ethyl esters þ ethanol þsoybean oil and fatty acid ethyl esters þ ethanol þ glycerol). J Chem Eng Data. 2008;53: Oliveira MB, Queimada AJ, Coutinho JAP. Modeling of biodiesel multicomponent systems with the cubic-plus-association (CPA) equation of state. Ind Eng Chem Res. 2010;49: Jachmanian I, Dobroyan M, Moltini M, Segura N, Irigaray B, Veira JP, Vieitez I, Grompone MA. Continuous lipase-catalyzed alcoholysis of sunflower oil: effect of phase-equilibrium on process efficiency. J Am Oil Chem Soc. 2010;87: Kontogeorgis GM, Folas GK. Quantum chemistry in engineering thermodynamics. In: Thermodynamic Models for Industrial Applications : From Classical and Advanced Mixing Rules to Association Theories. West Sussex, UK: Wiley, Schafer A, Klamt A, Sattel D, Lohrenz JCW, Eckert F. COSMO implementation in TURBOMOLE: extension of an efficient quantum chemical code towards liquid systems. Phys Chem Chem Phys. 2000;2: Klamt A, Schüürmann G. COSMO: a new approach to dielectric screening in solvents with explicit expressions for the screening energy and its gradient. J Chem Soc Perkin Trans ;5: Eckert F. COSMOtherm Users Manual Version C2.1 Release Leverkusen, Germany: COSMOlogic GmbH, Klamt A. Conductor-like screening model for real solvents: a new approach to the quantitative calculation of solvation phenomena. J Phys Chem. 1995;99: Lin S-T, Sandler SI. A priori phase equilibrium prediction from a segment contribution solvation model. Ind Eng Chem Res. 2002;41: Klamt A. The basic COSMO-RS. In: COSMO-RS: From Quantum Chemistry to Fluid Phase Thermodynamics and Drug Design. Amsterdam, The Netherlands: Elsevier, 2005: AIChE Journal 2012 Vol. 00, No. 0 Published on behalf of the AIChE DOI /aic 11
356 18. Klamt A. Prediction of the mutual solubility of hydrocarbons and water with COSMO-RS. Fluid Phase Equilib. 2003;206: Klamt A, Eckert F. Prediction of vapor liquid equilibria using COS- MOtherm. Fluid Phase Equilib. 2004;217: Klamt A, Eckert. F. Prediction, fine tuning, and temperature extrapolation of a vapor liquid equilibrium using COSMOtherm. Fluid Phase Equilib. 2007;260: Dell EraC, Zaytseva A, Uusi-Kyyny P, Pokki J-P, Pakkanen M, Aittamaa J. Vapour liquid equilibrium for the systems butane þ methanol, þ2-propanol, þ1-butanol, þ2-butanol, þ2-methyl-2-propanol at K. Fluid Phase Equilib. 2007;254: Ramsauer B, Neueder R, Kunz W. Isobaric vapour-liquid equilibria of binary 1-propoxy-2-propanol mixtures with water and alcohols at reduced pressure. Fluid Phase Equilib. 2008;272: Extended Antoine equation (DIPPR 101) for liquid-gas phase boundary pressure (vapor pressure) calculation. Equations/FEquations.html Widegren JA, Bruno TJ. Vapor pressure measurements on biodiesel esters by the concatenated gas saturation method. Fuel. 2011;90: Silva LYA, Falleiro RMM, Meirelles AJA, Krahenbuhl MA. Vaporliquid equilibrium of fatty acid ethyl esters determined using DSC. Thermochimica Acta. 2011;512: Shigley JW, Bonhorst Cw, Liang CC, Althouse PM, Triebold HO. Physical characterization of a) A series of ethyl esters and b) A series of ethanoate esters. J Am Oil Chem Soc. 1954;32: Lide DR. The CRC Handbook of Chemistry and Physics, 90th ed. Boca Raton, FL, CRC Press, PRO/II v. 9.0 Process simulation software. TX: Invensys Systems, Draper NR, Smith H. Applied Regression Analysis, 3rd ed. New York: Wiley, Goodwin SR, Newsham DMT. Kinetics of decomposition of methyl linoleate and vapor-liquid-equilibria in mixtures of methyl palmitate and methyl linoleate. J Chem Eng Data. 1975;20: CHEMCAD v.6.4 Chemical Process Simulation Software. TX: Chemstations, Sandler SI. Chemical, Biochemical, and Engineering Thermodynamics, 4th ed. Hoboken, NJ: Wiley, Antczak MS, Kubiak A, Antczak T, Bielecki S. Enzymatic biodiesel synthesis key factors affecting efficiency of the process. Renewable Energy 2009;34: Oliveira MB, Barbedo S, Soletti JI, Carvalho SHV, Queimada AJ, Coutinho JAP. Liquid-liquid equilibria for the canola oil biodiesel þ ethanol þ glycerol system. Fuel. 2011;90: Myint LL, El-Halwagi. Process analysis and optimization of biodiesel production from soybean oil. Clean Technol Environ Policy. 2009;11: Zhang Y, Dube MA, Mclean DD, Kates M. Biodiesel production from waste cooking oil: 1. Process design and technological assessment. Bioresour Technol. 2003;89: Goodrum JW, Geller DP, Lee SA. Rapid measurement of boiling points and vapor pressure of binary mixtures of short-chain triglycerides by TGA method. Thermochimica Acta. 1998;311: Yuan W, Hansen AC, Zhang Q. Vapor pressure and normal boiling point predictions for pure methyl esters and biodiesel fuels. Fuel. 2005;84: Wang T, Briggs JL. Rheological and thermal properties of soybean oils with modified FA compositions. J Am Oil Chem Soc. 2002;79: Shahidi F. Bailey s Industrial Oil and Fat Products: Processing Technologies, 6th ed. New York: Wiley, Constantinescu D, Wichterle I. Isothermal vapour liquid equilibria and excess molar volumes in the binary ethanol þ methyl propanoate or methyl butanoate systems. Fluid Phase Equilib. 2002;203: Ortega J, Susial P, de Alfonso C. Isobaric vapor-liquid equilibrium of methyl butanoate with ethanol and 1-propanol binary systems. J Chem Eng Data. 1990;35: Ortega J, Espiau F, Postigo M. Excess properties and isobaric vapor-liquid equilibria for binary mixtures of methyl esters þ tertbutanol. J Chem Eng Data. 2004;49: Hernandez P, Ortega J. Vapor-liquid equilibria and densities for ethyl esters (ethanoate to butanoate) and alkan-2-ol (C3 C4) at kpa. J Chem Eng Data. 1997;42: Ortega J, Espiau F, Postigo M. Isobaric vapor-liquid equilibria and excess quantities for binary mixtures of an ethyl ester þ tert-butanol and a new approach to VLE data pocessing. J Chem Eng Data. 2003;48: Ortega J, Gonzalez C, Peña J, Galván S. Thermodynamic study on binary mixtures of propyl ethanoate and an alkan-1-ol (C2 C4). Isobaric vapor liquid equilibria and excess properties. Fluid Phase Equilib. 2000;170: Gonzalez E, Ortega J. Vapor-liquid equilibria at kpa in mixtures formed by the first four butyl alkanoates and butan-2-ol. Fluid Phase Equilib. 1996;124: Gonzalez E, Ortega J. Densities and Isobaric vapor-liquid equilibria for the mixtures formed by four butyl esters and 1-butanol. J Chem Eng Data. 1996;41: Ortega J, Susial P. Measurements and prediction of VLE of methyl propanoate, ethanol, propan-1-ol at and kpa. J Chem Eng Jpn. 1990;23: Briggs E. The distillation of glycerine. In:YoungS,editor.Distillation Principles and Processes. London: Macmillan, 1922: Oliveira MB, Miguel SI, Queimada AJ, Coutinho JAP. Phase equilibria of ester plus alcohol systems and their description with the cubic-plus-association equation of state. Ind Eng Chem Res. 2010;49: Manuscript received Oct. 5, 2011, and revision received Dec. 15, Appendix Figure A1. Sigma profiles of saturated FAEE components with conformations. 12 DOI /aic Published on behalf of the AIChE 2012 Vol. 00, No. 0 AIChE Journal

357 Figure A2. Sigma profiles of unsaturated FAEE components. Figure A3. Sigma profiles of glycerol and ethanol components with respective conformations. AIChE Journal 2012 Vol. 00, No. 0 Published on behalf of the AIChE DOI /aic 13
358 APPENDIX 4
359
360 APPENDICES Appendix 4-1 Supplementary Data 1. Reaction Spontaneity and Chemical Equilibrium Chemical reactions can be either spontaneous or non-spontaneous. A simple definition of spontaneity in terms of chemical reactions can be given such that a reaction that takes place on its own without an external force or another reaction needed to drive it is spontaneous. In other words, a reaction that will occur on its own without any energy input from the surrounding is spontaneous. However, spontaneous reactions might not take place very quickly. Hence, a proper thermodynamic definition of a spontaneous chemical reaction or process, in general, takes both energy and entropy changes into account. If the proper conditions are met, changes toward increased entropy and decreased energy generally are spontaneous. The system will spontaneously change in the direction of increasing total entropy, reaching equilibrium when the entropy cannot increase any more. Spontaneous changes occur only in the direction that leads to equilibrium. From chemical thermodynamics point of view, it is obvious that when the total chemical potential which represents a measure of the tendency of species to leave the system for the products is equal to that for the reactants this corresponds to the reaction s equilibrium position. In mathematical terms when ( dg ) 0, a chemical reaction at a specified T and P will proceed in the direction of decreasing rxn P, T GfE function. That is to say, since G rxn 0 for a spontaneous reaction, molecules with a high chemical potential will spontaneously move to a region of lower chemical potential, or react to form molecules with a lower chemical potential. At equilibrium, G rxn = 0 and Q K, the reaction will stop and chemical equilibrium will be established when the GfE of reaction attains a minimum value. A chemical reaction cannot be made to produce a conversion beyond that of chemical equilibrium, where reaction rate is also equal to zero. 2. Some Mathematical Background on Chemical Equilibria A reversible reaction can be expressed on a general basis by Eq. (1) where Ri represents all the participating chemical species and ν i represents the stoichiometric coefficients that are taken as positive for products and as negative for reactants. n i= 1 ν R i i (1) Similarly, multiple reactions can be defined as in Eq. (2), where ν is the stoichiometric coefficient of i th component in j th reaction. ij A-67
361 APPENDICES p q i= 1 j= 1 ν R = 0 ij i (2) The change in the number of moles, n, of each participating species i as a result of the chemical reaction is given by i dn dn dn 1 2 i = = = = dε (3) ν ν ν 1 2 i The term ε is defined as the reaction coordinate or the molar extent of reaction. It is an extensive property that is unique for a given reaction measured in moles. Its value can be greater than unity. dn i = ν dε (4) i By integrating Eq. (4) to get a mathematical expression giving the change in mole numbers of a chemical species i in terms of reaction extent, ε. n i i,0 i or n n = νε = n + νε i i,0 i (5) The GfE of a reaction system G as a function of T, P, and mole numbers, G f( TP,, n) in partially differentiated form is called as the fundamental equation of chemical thermodynamics. It can be expressed as follows: C G G G dg = dt + dp + dni T P n or Pn, Tn, i= 1 i T, nj ( j i) dg = -SdT + VdP + µ dn C i= 1 i i (6) Eq.(6) is completely general and valid for open or closed; reversible or irreversible changes, (provided only by PV work done). S in Eq.(6) represents the entropy and V pertains to the volume of the system. Besides, the chemical potential of chemical species i can be expressed as in Eq. (7): o n γ i i µ µ + RT ln (7) i i n t o where µ i refers to the molar Gibbs free energy or chemical potential of a pure chemical species, i.e., its GfE of formation at standard conditions. The molar GfE or chemical potential, µ, is a measure of how much a species wants to undergo a physical or chemical change. i A-68
362 APPENDICES If Eq. (6) is restricted to closed system where only PV work is done and the change is completely reversible (i.e., the system is near-equilibrium) for which and P Eq. (6) becomes C i= 1 µ dn = 0. In other words, at constant T i i C dg = µ dn = µν dε i i i i i= 1 i= 1 C (8) Since the extent variable is the same for all species of a reaction, Eq. (8) becomes (in a liquid phase) for a system at chemical equilibrium: G C liq. rxn ε T, P i= 1 i i G = νµ = 0 (9) where G = G + RT lnk = 0 (10) liq. o, liq. liq. rxn rxn a Consequently, the thermodynamic equilibrium constant of a reaction related to the thermodynamic properties of the mixture at standard conditions is obtained as in Eq. (11): Ka o G rxn RT = e (11) On the other hand, the equilibrium constant Ka of a reaction taken place for n chemical species (R i ) which form a non-ideal mixture can be expressed as follows: n p p p v v v i i i i K = a x γ a i,@ eqlb i i o i= 1 i= 1 i= 1 i= 1 fi Kx Kγ f vi (12) where a i ( a xγ ) is the activity of the i th component in the reaction system at chemical equilibrium i i i o and f i is the fugacity of pure liquid i at T and P of the system. Here, fi is the fugacity of pure liquid at T of the system but at standard-state pressure, P o (= 1 bar). Pure liquid component i at unit activity (a i = 1) and at the reference temperature of T 0 (= K) were taken as the standard conditions throughout of this study. For that reason, neglecting the pressure correction at reactions under (or near) atmospheric pressures, the last term in Eq. (12) goes to unity ( f = e 1 ) and thermody- f namic equilibrium constant takes the form given by Eq. (13): i o i Vi ( P 1) RT A-69
363 K a x where K and K can be defined in general as K K x γ = KK = m j= 1 n i= 1 γ x [Product] vj [Reactant] vi m m vj aj γ jxj j= 1 j= 1 n n vi ai γ ixi i= 1 i= 1 = = γ ( ) ( ) vj vi APPENDICES (13) where the activities (a i and a j ) are the equilibrium activities when the system reached to the chemical equilibrium. K x is the part of equilibrium constant expressed in terms of concentrations (reaction extent) and K γ is the complementary part of equilibrium constant pertaining to the non-ideality of the reactive system. It is defined in terms of the activities of species. 3. Mass Balance Constraints and Approaches to Chemical Equilibrium During chemical reactions the number of species (molecules) is not generally conserved. However, the number of elements and thus mass is conserved. In a closed system the conservation of material can be defined by a set of elemental material balance equations, henceforward called as the conservation of element equations. N a n= b ; i= 1,2,, N and k= 1,2,, E (14) ki i k i= 1 where a ki is the number of atoms of the k th element in the molecular formula of species i and n i is the number of moles of i given in some basis amount of system (i.e., as the feed composition) and b k is the total number of atomic masses of the k th element in the feed. E pertains to the total number of different elements in the feed and N pertains to the number of chemical species in the system. An alternative formulation of the conservation of element equation can be given as the change from one compositional state to another 15 : N a δ n = 0 ; i = 1,2,, N and k = 1,2,, E (15) ki i i= 1 where δ ni is the change in the number of moles of the i th species between two compositional states of the system. Eq. (14) and (15) can be expressed in vector-matrix notation as in Eq. (16) and (17), respectively. An = b (16) Aδn = 0 (17) A-70
364 APPENDICES where A is the formula matrix, n is the species vector ( n 0 i ), and b is the element vector; whereas (2) (1) δn is the species change vector which can be simply expressed as δn = n n where superscripts pertain to two consecutive states. The general solution of Eq. (16) can be given as a set of E linear equations in N unknowns: R (0) = + j= 1 n n ν ε (18) j j where (0) n is the initial composition (as a particular solution), νj is any set of R linearly independent solutions of the homogeneous equation. The quantities ε j are a set of real parameters and each is called as a stoichiometric vector. If a reaction has a specified reaction extent an additional mass balance constraints can also be defined. N' ( 0, ) ε = a n n ; r = 1,2,, R (19) r ri i i i= 1 where ε pertains to the specified extent of reaction and r νj ari is the matrix element derived from the inverse of stoichiometric coefficient matrix. Moreover, if the product rate of a component is specified, either by the specified constraint for product rate or by the specified percentage of feed amount reacted. For a single phase system (e.g., in a liquid phase reaction), this constraint can simply be expressed as an approach to equilibrium where a fractional conversion of the base component chosen for each reaction is defined ab initio. Fraction of conversion for the base component, α j, is defined as: n reacted α j,base comp. = nfed base comp. (20) The equilibrium conversion is calculated for each reaction by simultaneous solution of the linear equations set. Then, this fractional conversion can be applied to the equilibrium conversion through multiplying with the specified conversion. This constraint can also be generalized for systems having more than one phase (P) as in Eq. (21). P αi = ni; i = 1,2,, N* (21) p= 1 where α is the derived or specified product rate or percentage of feed amount reacted and N* is j the total number of components with fixed product rate. Moreover, the equilibrium temperature approach can also be used as a global constraint. In the equilibrium temperature approach, Tequilibrium was used to solve the minimization equations; whereas the thermophysical properties were calculated at T reaction. T = T + T (22) equilibrium reaction A-71
365 APPENDICES The equilibrium temperature ( T equilibrium ) is also the temperature at which the chemical equilibrium liq. constant, K (see Eq. (12) in Section 3 of the main text) is calculated so as to determine the composition of the equilibrium mixture in case of pseudo-empirical correlative K-value a method. 4. Gibbs Free Energy Minimization Methods - Theoretical The minimization problems are associated with the problem of solving sets of nonlinear equations. In case of constrained and unconstrained minimization of Gibbs free energy, the improved form 73 of RAND algorithm 4,15 for non-ideal reaction systems was implemented. The RAND algorithm employs the Newton-Raphson method 4 in order to solve the sets of nonlinear equations and it is based on the second-order method 15 which approximates to the objective function F(n) near each n (m) by a quadratic function and then finding the minimum value using this approximation. The applied quadratic function is the first two terms of a Taylor series expansion of F(n) about n (m). 15 Further details of this algorithm and its modification can be found in Chapter 6 and Appendix C of the monograph written by Smith and Missen. 15 The general vector- matrix form of Newton-Raphson method applied to the nonlinear equation sets can be expressed as in Eq. (23): ( m+ 1) ( m) 1 ( m) ( m) x = x J ( x ) Fx ( ) for m = 0,1, (23) where J is the Jacobian (matrix) of the F matrix. The Newton-Raphson method proceeds from an initial estimate x (0) of a solution and calculates a sequence by means of ( m) ( m+ 1) ( m) ( m) x = x + ω δx m = 0, 1,2, (24) where the superscript (m) is an iteration index. The scalar quantity ω is called as positive step-size parameter, which determines the distance between successive iterations in the direction defined by ( m) δx. The conservation of element constraints are satisfied at each iteration and the algorithm iteratively minimizes the Gibbs free energy function of the reactions involved. Since the reaction system considered is highly non-ideal, the solution of constrained and unconstrained minimization equations require the introduction of an appropriate expression for µ i, i.e., the non-dimensional form of µ i the chemical potential, RT. Therefore, in order to calculate µ i in reaction systems subjected to RT GfE minimizations, UNIFAC model 74 accompanied with the group-group binary interaction parameters, R i and Q i values belonging to LLE parameter table was implemented. The required parameters and data values were collected from Magnussen et al. 26, except for COO functional group which was taken from Hansen and coworkers. 25 The molar Gibbs free energy expression in terms of mole fractions by means of UNIFAC model can be given as follows, Eq. (25): µ G( x) G z z = Γ Γ RT RT RT N o G fi, () i xi 1 qi lnφi qi lnθi vli l l i= i= 1 (25) A-72
366 APPENDICES The indices i and j in Eq. (25) run over the set of components N, and the index I, m, and n run over the set of functional groups G. The details of UNIFAC model was given in Appendix 3-1 of Chapter 3. The overall augmented objective function F(n) for both constrained and unconstrained minimization can be defined as follows: E N R N' N* P F( n) = G( n) + RT λk akini bk + λr ari ( ni n0, i ) εr + λi αi nip k= 1 i= 1 r= 1 i= 1 i= 1 p= conservation of element constr. 2 - specified rxn extent constr. 3 P - frac. of conv. constr. for phases (26) where G(n) is the total Gibbs free energy of reactive mixture and λ ik,, or r are the unknown Lagrange multipliers. The third term within square brackets considers two or more phase formations. However, since we assumed a well-mixed or homogeneous single liquid phase for all calculations, this constraint term can be omitted. Furthermore, the second summation term was applied in a simple manner as expressed by Eq. (20) without further complication of the minimization problem Constrained (Non-stoichiometric) Minimization In order to ascertain the thermodynamic limits of a reaction, the problem can be formulated as the minimization of G(n) for fixed T and P, in terms of the N mole numbers, subject to the E conservation of element constraints as expressed in Eq. (27) and (28). Thus, the objective of constrained minimization is expressing the GfE, G(n), as a function of the mole numbers, n i and to seek those values of the n i that make G(n) minimum subjected to the constraints. In this method, the given values of the conservation of element vector b, temperature T, pressure P, are used as the inputs. This method does not require the knowledge of reaction stoichiometry: N G( n ) = nµ min. (27) i= 1 i i subject to the conservation of element constraint N akini = bk k= 1,2,, E (28) i= 1 The common approach for solving constrained minimization problems is using the method of Lagrange multipliers so as to remove the constraints. 4,15,75 The Lagrange multipliers mathematically is a method performed for finding the extreme (maximum or minimum) value of a function subjected to c0nstraints. They are a measure of the sensitivity of the objective function to changes in the corresponding constraints. Accordingly, the minimization of GfE subjected to the conservation of element constraints determines the distribution of the components which gives the minimum free energy for the system. The Lagrangian, Ł applied to Eq. (27) and (28) results in Eq.(29) as given below: N E N Ł( n, λ ) = niµ i + λk bk akini (29) i= 1 k= 1 i= 1 A-73
367 APPENDICES T λ1 λ2 λ E where λ is a vector of E unknown Lagrange multipliers, = (,,, ) λ. Thus, the necessary conditions provide the following set of (N + E) equations in the (N +E) unknowns given by Eq. (30) and (31). Ł ni nj i, λ E i ki k i k= 1 ( n ) = µ a λ = 0, > 0 (30) Ł = b a n= 0 k ki i ni n, λ i= 1 j k N (31) ( m) ( m) Linearization of Eq. (30) about an arbitrary estimate of the solution (, ) n ψ yields after some ( m) ( m) rearrangements (the superscript (m) denotes evaluation at( n, ψ ) ): 1 µ µ + = RT n RT N' E ( m) E i ( m) ( m) i ( m) δ nj akiδψ k akiψ k j= 1 j ( m) k= 1 k= 1 n i= 1,2,, N' (32) where the total number of moles including inert components can be expressed as follows: t N' i inert (33) i= 1 n = n + n and λ RT k ψ k = (34) δψ = ψ ψ (35) ( m) ( m) k k k and δ n = n n (36) ( m) ( m) j j j The quantities n and n (m) are related through the conservation of elements constraints by N' ( m) ( m) akjδ nj = bk bk, k= 1,2,, E (37) j= 1 N' ( m) ( m) k kj j j= 1 b = a n, k= 1,2,, E (38) ( m) ( m) Eq. (32) and (37) are a set of (N + E) linear equations in the unknowns δn and δψ. These linear equations are solved, and new estimates of (n, ψ) are obtained from Eq. (39) and (40), respectively: A-74
368 APPENDICES ( m+ 1) ( m) ( m) ( m) ψ = ψ + ω δψ (39) ( m+ 1) ( m) ( m) ( m) n = n + ω δn (40) The convergence criteria of the RAND algorithm applied to constrained minimization can be expressed as follows 15 : max δn ξ n 10 1 i N ( m) i ( m) i 5 = (41) The element-by-species matrix for a model reaction system that can be expressed through Reaction x-1 and/or x-2 including Reaction 5, both in transesterification and hydrolysis reaction sets, was given in Table S-1. The numbers correspond to the amount of respective element in each species, i.e. the number of b k for k th element in each species. Table S-1 The element-by-species matrix for a reaction system. H, C, and O stand for hydrogen, carbon, and oxygen atoms, respectively. Triolein Diolein Monoolein Ethyl Oleate Oleic Acid Glycerol EtOH Water H C O Unconstrained (Stoichiometric) Minimization of Gibbs Free Energy One of the main differences between stoichiometric and nonstoichiometric method involves the total number of independent variables that must essentially be determined. In case of stoichiometric minimization, the conservation of element constraints are eliminated from the minimization problem and, thus, resulting in an unconstrained case. The mole numbers n are related to the extents of reaction, ε of the R stoichiometric equations, which are the independent variables, by Eq. (18). R (0) = + j= 1 n n ν ε j j and the problem is one of minimizing Gibbs free energy, G, for fixed T and P, in terms of the R (the number of stoichiometric reactions) reaction extents, ε j. G= ftpε (,, ) (42) the first-order necessary conditions 15 for a minimum in G is G ε j T, P, ε k j = 0 (43) A-75
369 APPENDICES or N νµ = 0 j = 1,2,, R (44) ij j i= 1 Here, the N unknown mole numbers (n), which are constrained by the E conservation of element equations, are transformed to a new set of the extent of reaction variables (ε j ). In this method, the mole numbers always satisfy the conservation of element constraints on each iteration. Consequently, the expression of the free energy function G as a function of the reaction extent variables (ε j ) by holding T and P constant, the chemical equilibrium problem becomes the minimization of G(ε). Hence, the problem can be expressed in vector-matrix notation as given by Eq. (45): T ΔG N μ(ε) = 0 (45) ( m) The changes in the mole numbers δn from any estimate n (m) satisfying the conservation of element constraints are related to new ε variables by R ( m) ( m) ν δε i ij j j= 1 δ n =, i= 1,2,, N' (46) The simultaneous linear equations resulting from the Newton-Raphson method at each iteration can be obtained as follows: 2 1 ( ) = 2 ε ( m ) n m G G δε ε n ( m ) (47) µ R N' N' N' m i ( m) δε ν ν l ij kl ν µ ij i l= 1 i= 1 k= 1 n ( m ) k n i= 1 =, j = 1,2,, R (48) This method is called as the Villars-Cruise-Smith (VCS) algorithm. 15 It is worth noting that the VCS algorithm is not an exact second-order method but an intermediate one between first- and secondorder methods. Further details of this algorithm can be obtained from Chapter 6 and Appendix D of the monograph written by Smith and Missen. 15 The convergence criteria of the VCS algorithm applied to unconstrained minimization can be expressed as follows: G max ξ = 10 ε i 1 i N ( m ) n 5 (49) øøø A-76
370 APPENDICES 5. Functional Groups and Contribution Numbers Assigned to Fatty Species Functional groups and corresponding contribution numbers were presented in Table A4-1 and A4-2. In Table A4-1 first order groups used with CG 76, MG 77, KRG 78, and KKR 79 group contribution methods were presented. In case of MG, KKR, and KRG methods, since there is no third order contribution applicable to fatty species, only the first and the second order contributions were assigned. Second order functional groups and their contributions were presented in Table A4-2 only for MG GC method. Due to the reversible isomerization reaction of mono- and di-olein species and also with the aim of observing the effect of second order contributions, both of the isomeric forms were considered (see Part 1 of Appendix 4-2). Table A4-1 Functional groups and corresponding contribution numbers assigned to 'fatty' species for GC predictive methods. Thermophysical properties were calculated using CG 76, MG 77, KRG 78, and KKR 79 group contribution methods (See text for the abbreviations and corresponding methods used). Table A4-2 Second order functional groups and corresponding contribution numbers assigned to 'fatty' species for MG (Marrero and Gani, ) GC predictive method. Figure A4-1 The change in the logarithm of equilibrium constants, lnk liq. a, with the reciprocal of temperature for the K- value model reaction schema used. Reaction 1-1 and 1-2 show slight increase with the decrease in 1 T. A-77
371 APPENDICES Appendix Formation Energies at New Reference Conditions (arbitrary T; standard P) The formation energies of chemical species either experimentally or using estimative methods are generally given for a reference temperature of K (T o ). However, since both of the isomeric form of monoolein species in this study are not liquid at T o, it is desirable using relatively higher reference temperatures. Accordingly, it is thermodynamically feasible that both the enthalpy and the Gibbs free energy of formation at an arbitrary temperature (T o, new ) different than T o can be calculated through Eq. (50) and (51), respectively. T o f o new f o P To o, new o (, ) ( ) ( ) H T = H T + C T dt (50) If the enthalpy of species is known, the temperature dependence of the GfE of formation can be o calculated through the Gibbs-Helmholtz relation. Therefore, using this relation, G f at an arbitrarily chosen reference T value can be expressed as: To new o ( ) ( ) To, new o, Gf T Hf T d = dt 2 T T (51) To To The calculation of formation energies at an arbitrary temperature lower than T o requires the normal melting point information of chemical species. It is well-known that all of the species involved are in liquid form at T o with monoolein as an exception. However, according to some literature, pure 1,3- diolein has a melting point of K 43 and pure 1(3)-monoolein has that of 308 K (Kulkarni et al. 80 reported the same property as 309 K). It is also worth stating that the same data source 43 and also Kulkarni et al. 80 reported the respective T b of 1(3)-monoolein species as K and K which are even lower than that of glycerol (563 K). On the other hand, process simulation software CHEMCAD v.6.4 and PRO/II v.9.0 databases give the melting point of diolein as and 294 K, respectively. Likewise, the melting point of monoolein is given as 305 and 308 K, respectively. As it can be deduced, pure 1,3-diolein (according to literature data 43 that might be a typographical error) and 1(3)-monoolein will be in solid state at the reference temperature T o (= K). As a result, it is decided that monoolein s formation energies but not those of diolein need to be calculated at solid state instead of liquid. Moreover, it is worth mentioning that there are neither literature data nor appropriate estimative methods in order to calculate the entropy of fusion of chemical species which show solid-solid transitions in melting processes 6, such as of monoolein (e.g., 1(3) isomeric form of monoolein). Therefore, it was not possible to calculate the enthalpy and thus Gibbs free energy of fusion of this chemical species. Consequently, the heat and the GfE of reactions, for Reaction 3-1 and 3-2 at T o and formation energies of monoolein at 293, 298, and 303 K should be considered with cautions. Since, the heat and the GfE of reactions are defined for an unmixed situation and pure monoolein is in solid state at these temperature values. However, formation energies of diolein and its reaction energies (for Reaction A-78

372 APPENDICES 2-1 and 2-2) can be considered as on the limit at 293 K. Besides, it is worth pointing out that in a fatty system/mixture both of these species will be at liquid state due to freezing point depression phenomenon in a solution (depending on their corresponding concentrations). The formation energies of chemical species are presented in Table A4-3 in Appendix 4-2 for 293 and 303 K where liquid state enthalpies and GfE of formation were calculated using Eq. (5) and (6) given in the main text, Section 2.1, respectively. It has been reported that liquid state enthalpy of formation for OlAc at 293 K is kj/mol (calculated without Washburn corrections). 81 H o, liq. f of OlAc was calculated to be kj/mol which is in significant agreement with the reported value. As expected, all the formation energies decrease with the decline of reference temperature. The respective formation GfE and formation enthalpy of reactions at 293 and 303 K accompanied by the chemical equilibrium constants at respective temperatures were tabulated in Table A4-4. As it can be seen 10 K of temperature difference has a very significant impact on the K-value of particularly Reaction 3-1 and 3-2 (see Section 5 in the main text and Appendix 4-3 for further discussions). 2. Thermophysical properties and Reaction Energies Calculated for New Reference Temperatures The thermophysical properties and reaction energies for the new reference T values presented in Tables A4-3 and A4-4 were calculated through the equations (3) and (4) mentioned in Section 2.1 of the main text and (11) given in Part 2 of Appendix 4-1. The formation energies given in Table A4-3 and reaction energies given in Table A4-4 were subsequently calculated through the property values ultimately decided and presented in Table 4-4 (see Section 4 of the main text) and specific isobaric heat capacity functions given in Section 2.3 for each chemical species. On the other hand, as discussed in Sections 2 and 5.2 of the main text there is neither predictive nor unique experimental thermophysical property data set for fatty species. It was observed in contrast that there are significant differences among the experimental property values of the same species, particularly for fatty species. Therefore, the formation energies of reactive species and corresponding reaction energies of 7 reactions were calculated for two alternative reference T values at standard pressure with the aim of observing the effect of an alternative thermophysical property data set. Since the property values for OlAc, water and alcohols are the same in two cases, calculations were performed only for the first four components. As it can be deduced from the comparison of Tables A4-3 and A4-5, the impact of ultimate decision made on the thermophysical properties is rather significant. In brief, the formation energies decrease with the decrease in temperature in both cases. Besides of Tables A4-3 and A4-5, further evaluations on formation energies can be made by referring to Table 4-5 in Section 3 and Table A4-7 given in Appendix 4-3. Table A4-3 Formation energies at two new reference temperatures of K and K calculated by means of equations given in Part 1 of Appendix 4-2 (P 0 = 1 bar). A-79
![APPENDICES Table A4-4 Reaction energies at two new reference temperatures of 293.15 K and 303.15 K calculated using equations given in Section 2.1 [Eq. (3), (4)] and Eq.](/docs-images/78/77247352/images/373-2.jpg "(11) in Part 2 of Appendix 4-1 (P 0 = 1 bar).")
373 APPENDICES Table A4-4 Reaction energies at two new reference temperatures of K and K calculated using equations given in Section 2.1 [Eq. (3), (4)] and Eq. (11) in Part 2 of Appendix 4-1 (P 0 = 1 bar). The same substantial differences can also be observed in case of reaction energies and chemical equilibrium constant values by comparing the corresponding values presented in Tables A4-4 and A4-6. It is noteworthy to emphasize that decisions made on the spontaneity and related thermodynamic evaluations based on these values should be considered with cautions. The internal consistency of property values and data sets built using such inferences are neither accurate nor enough from the engineering point of view and should be verified using precisely measured thermophysical property values, where appropriate. Table A4-5 Alternative table of formation energies at two new reference temperatures of K and K calculated using equations given in Part 1 of Appendix 4-2 (P 0 = 1 bar). Table A4-6 Alternative table for reaction energies at two new reference temperatures of K and K calculated using equations given in Section 2.1 [Eq. (3), (4)] and Eq. (11) in Part 2 of Appendix 4-1 (P 0 = 1 bar). A-80
374 APPENDICES Appendix 4-3 Supplementary Data 1. Simulation through the Fraction of Conversion Approach - Unconstrained (Stoichiometric) Minimization Table S-2 and S-3 present the simulation results of Reaction 1-1 and 1-2 for 0.67 and 1.30 molar equivalent of aq. EtOH at different temperatures. As it is presented in Table S-2, there was no difference in equilibrium composition between 318 and 328 K. Reaction systems converged for all three fractions which means that when the system reaches to chemical equilibrium the initial expectations of 0.80, 0.90, or 0.95 of triolein to be converted through transesterification reaction are thermodynamically feasible where the multiplication of these fractions with the corresponding converged equilibrium compositions will be the real (ultimate) equilibrium concentrations. Obviously, the highest theoretically possible conversion of EtOl was achieved as 72.26%, while only 4.99% of OlAc was obtained. However, on account of significant non-ideality of reaction systems there was a considerable difference in the equilibrium composition in case of 1.30 molar equivalent feed. As is seen from Table S-3, the percentage of theoretically possible conversion for EtOl was slightly decreased when the temperature increased from 308 K to 328 K. The highest percentage of EtOl theoretical conversion (55.37%) was obtained at 308 K. Since there are differences between equilibrium compositions at different temperatures, there seems to be some particular phase-splits/separations (LLE), even though homogeneous reaction media were assumed within the reactor. Thus, it can be concluded that this assumption has to be considered with cautions. Besides, in order to attain more realistic and thermodynamically feasible equilibrium compositions, it is better to couple some appropriate phase-splitting algorithms to the non-ideal VCS algorithm used for chemical equilibrium calculations so as to determine possible physical (two-phase) equilibrium. 82 In case of Reaction 2-1 and 2-2 for 1.0 and 1.30 molar equivalent of aq. EtOH feeds at different temperatures, the equilibrium composition showed a more interesting situation. In contrast to Reaction 1-1 and 1-2, in this case the conversion of EtOl increased with the increase in temperature. However, the percentage of conversion is rather small with 5.14% of theoretically possible conversion at 328 K as the highest in case of 1.0 molar equivalent and 6.33% in case of 1.30 molar equivalent feed at the same temperature. As it is presented in Table S-4 and S-5, there was no OlAc formation and analogous to the former reaction set, temperature and to some extent molar equivalent amount of aq. EtOH have a considerable impact on the equilibrium compositions. Finally, it was noticeable that the reaction systems converged for all three fractional conversion expectations. Table S-6 and S-7 presents the equilibrium composition of simultaneous Reaction 3-1 and 3-2 for two molar equivalent feeds of aq. EtOH (1.0 and 1.30 equivalents with respect to monoolein feed). Contrary to Reaction 2-1 and 2-2, this reaction set favors lower T for the formation of higher EtOl amounts. Likewise, even in this case the difference in EtOl formation for 1.0 and 1.3 molar equivalents was not significant. There observed 13.84% of theoretically possible conversion for EtOl in case of 1.0 molar equivalent of aq. EtOH feed at 318 K for the expectation of Case 3 (0.95 molar fraction); whereas for 1.30 molar equivalent the conversion was only 17.10% However, in contrast to Reaction A-81
375 APPENDICES 2-1 and 2-2 set the system converged at 308 K for all cases where EtOl production reached to 58.42% of its theoretically attainable limit (Case 3). In this reaction set the impact of temperature was rather significant and it was the inverse of Reaction 2-1 and 2-2. For instance, the 58.42% of theoretically possible conversion at 308 K decreased to 17.10% at 318 K and then decreased to 1.87% at 328 K. It is worth mentioning that in this case (Case 3 in Table S-7) the highest OlAc conversion was observed at lower temperatures with 4.83% of the theoretically possible conversion at 308 K, i.e mol fraction of monoolein was converted through hydrolysis. In contrary, for 1.0 molar equivalent feed case, there was no significant OlAc formation (see Table S-6 and S-7 for comparisons). Analogously, the highest glycerol formation was also obtained in case of 1.3 molar equivalent of aq. EtOH feed at 308 K (59.52% of its theoretically possible conversion). In order to check the impact of esterification (Reaction 5) on the final FFA (OlAc) composition in biodiesel (EtOl) fuel, the output of the highest conversion of Reaction 3-1 and 3-2 (see Table S-6) were entered as the feed for Reaction 5 and this reaction was simulated at the same temperature of 328 K. In other words the Gibbs free energy minimization of the system was performed at the temperature of entering feeds similar to the relaxation method mentioned above. It was found that instead of EtOl formation the system favors the reverse reaction which forms OlAc. The equilibrium composition of EtOl decreased to 39.28% of its theoretically possible conversion and OlAc increased from 4.83% to 88.80% (data was not shown). A-82

 A-83")
376 APPENDICES Table S-2 Unconstrained minimization of Gibbs free energy for the stoichiometric Reaction 1-1 and Reaction 1-2 with 0.67 molar equivalent of aq. EtOH feed. (Three fractional conversions of triolein to diolein through transesterification reaction were considered as the equilibrium composition approaches: 0.8, 0.9 and 0.95) Table S-3 Unconstrained minimization of Gibbs free energy for the stoichiometric Reaction 1-1 and Reaction 1-2 with 1.3 molar equivalent of aq. EtOH feed. (Three fractional conversions of triolein to diolein through transesterification reaction were considered as the equilibrium composition approaches: 0.8, 0.9 and 0.95) A-83

377 APPENDICES Table S-4 Unconstrained minimization of Gibbs free energy for the stoichiometric Reaction 2-1 and Reaction 2-2 with 1.0 molar equivalent of aq. EtOH feed with respect to diolein species. (Three fractional conversions of diolein to monoolein through transesterification reaction were considered as the equilibrium composition approaches: 0.8, 0.9 and 0.95) Table S-5 Unconstrained minimization of Gibbs free energy for the stoichiometric Reaction 2-1 and Reaction 2-2 with 1.3 molar equivalent of aq. EtOH feed based on diolein species. (Three fractional conversions of diolein to monoolein through transesterification reaction were considered as the equilibrium composition approaches: 0.8, 0.9 and 0.95) A-84

 Table S-7 Unconstrained minimization of Gibbs free energy for the stoichiometric Reaction 3-1 and Reaction 3-2 with 1.3 molar equivalent of aq.")
378 APPENDICES Table S-6 Unconstrained minimization of Gibbs free energy for the stoichiometric Reaction 3-1 and Reaction 3-2 for 1.0 molar equivalent of aq. EtOH feed wrt monoolein species. (Three fractional conversions of monoolein to EtOl through transesterification reaction were considered as the equilibrium composition approaches: 0.8, 0.9 and 0.95) Table S-7 Unconstrained minimization of Gibbs free energy for the stoichiometric Reaction 3-1 and Reaction 3-2 with 1.3 molar equivalent of aq. EtOH feed based on monoolein species. (Three fractional conversions of monoolein to EtOl through transesterification reaction were considered as the equilibrium composition approaches: 0.8, 0.9 and 0.95) A-85
379 APPENDICES 2. Calculation of Chemical Equilibrium Constant and Reaction Energies using Quantum Chemical COSMO-RS Method 2.1. A Few Notes on COSMO-RS Method and its Application to Reaction Equilibria Calculations One of the most extensively used quantum chemical (QC) method is the COnductor-like Screening MOdel (COSMO) which belongs to the class of quantum chemical dielectric continuum solvation (or polarizable) models. 83,84 COSMO has become popular in computational chemistry since its first publication and following implementation in MOPAC (Molecular Orbital PACkage). 83 In QC-COSMO approach the solute molecules are considered in a virtual conductor environment where each solute molecule induces a screening (polarization) charge density, σ, on the interface between the molecule and the molecular surface (conductor). 85 The screening charge density distribution on the surface of each molecule i is converted into a probability distribution function known as σ-profile, i ( ) p σ, which gives the relative amount of surface with polarity σ on the surface of the molecule. 85 There are two thermodynamic model theories based on the implementation of the descriptors from the QC-COSMO method: COSMO-RS 86 and COSMO-SAC 87. The COSMO-RS method where RS pertains to Real Solvents or Realistic Solvation has the basis of statistical thermodynamics approach combined with QC-COSMO calculations. It is based on the theory of interacting molecular surface charges which combines statistical thermodynamics methods with an electrostatic theory of locally interacting molecular surface descriptors derived from the dielectric continuum model COSMO. 85 Therefore, COSMO-RS can be defined as the statistical thermodynamics treatment of molecular interactions. In this thermodynamic model theory a compound s polarization charge density, which is described by its σ-profile, is used for the quantification of the interaction energy of pairwise interacting surface segments, resulting in the compound s chemical potential (its partial Gibbs free energy - GfE). 86,88 COSMO-RS can be used to estimate reaction barriers and kinetic constants of reversible reactions (equilibrium constants). The kinetic constant of a reaction can be estimated using Arrhenius-type equation (Eq. (11)) where the GfE of reaction corresponds to reaction barrier height. In COSMO-RS method the GfE and enthalpy of species are formed from a liquid contribution (COSMOtherm contribution) and from a quantum chemical contribution that results from the quantum chemical energy of the species. 85 It has been stated that the accuracy of the absolute number of the predicted reaction Gibbs energy and enthalpy mainly is determined by the accuracy of the underlying quantum chemical calculation. 85 However, it is possible to achieve higher prediction quality by introducing external energy data for the enthalpy and GfE of reacting species. In COSMOtherm software (vc2.1_01.11a), it is allowed separating the COSMOtherm and the quantum chemical contributions QC Ei to G i and H i (see Eq. (52) and (53), respectively) by means of the species GfE of solvation, G i,solvation and enthalpy of vaporization, H i,vap.. 85 G = E + G (52) QC i i i,solvation H = E H (53) QC i i i,vap. Here, G i is the total GfE of the reacting species in the given solution and H i is the liquid state enthalpy of reacting species in the given solution. G i contains an entropic ideal mixture contribution of RT ln( x i ) if compound i is present in the mixture at a finite concentration. G i,solvation and H i,vap. terms describe the changes of the free energy and enthalpy which occur if the reacting species at A-86
380 APPENDICES gas phase is dissolved into the liquid phase, respectively, i.e., the transition from gas state (the reference state of the quantum chemical calculation) to the liquid state (the state of COSMOtherm ). Since most of the Gibbs energy calculations in this study are based on some estimative methods, it is not representative implementing these estimative values into another estimative method (COS- MOtherm ); instead mostly experimental values for H i,vap. of reacting species were implemented into COSMOtherm in order to calculate the enthalpy of species through Eq. (53). Analogous to Eq. (3) and (4) (see Section 2 of the main text), reaction enthalpy and GfE were calculated by using Eq. (54) and (55), respectively. n 0 rxn ν igi i= 1 G = (54) n 0, liq. rxn ν ihi i= 1 H = (55) In COSMO-RS method, the reaction is assumed to occur in the ideal gas phase at the atmospheric pressure. During reaction equilibria computations, the BP-TZVP parameterization set (file) (Becke- Perdew (BP) functional for density functional theory calculations with a triple valence plus polarization function (TZVP) basis set) was chosen for reacting species. 85 The necessary parameterization file does always correspond to one functional and basis set. Moreover, in order to get more realistic simulation results, EtOH species was simulated using two conformers and the by-product glycerol with 10 conformers; whereas the rest had only one conformer Reaction Energies and Chemical Equilibrium Constant Calculations via COSMO-RS Method It is important to re-state that all COSMO-RS calculations were performed at ideal gas state, i.e. total Gibbs free energy and enthalpies of reacting species expressed by Eq. (52) and Eq. (53), respectively, were calculated for an ideal gas phase using gas phase energies computed by means of parameter set based on the density functional theory ( E QC i ). The enthalpies of reacting species were modified by their respective heats of vaporization in order to bring them to liquid state. That is to say, the heat of vaporization at normal boiling point of reacting species taken from PRO/II process simulation software database was implemented into COSMO-RS calculations in order to get realistic estimates of reaction enthalpies (see Eq.(53)). Analogous to former calculations, reaction systems in these cases were also considered as taking place in homogeneous or single phase liquid media. Besides, the major chemical species that form the reactive mixture were used as the solvent media at the commencement of each particular reaction. It is of concern to emphasize that their concentrations were taken into account but, were considered constant throughout of the reactions. For instance, Reaction 1-1 occurred in a homogeneous solvent system consisting of a molar composition of 25% triolein and 75% EtOH. Likewise, it was assumed that except that of Reaction 3-1 (Reaction 3-2) each reaction step assumed to go to completion Case 1: Stoichiometric EtOH and Oil (Triolein) Feeds Simulation results of transesterification reaction set (Reaction 1-1 to 3-1) for stoichiometric amount of EtOH (1.0 molar equivalent) were presented together with the results of overall reaction (Reaction 4-1). As shown in Table S-8, both of the reaction energies in the given solvent medium are posi- A-87
381 APPENDICES tive for Reaction 1-1 and, thus, the corresponding K-value has found substantially low. It was found that even though the reaction energies did not change significantly for a T difference of 10 K, the corresponding K-values decreased considerably with the exceptions of slightly increased K-values of Reaction 1-1 and Reaction 3-1. The highest K-value was calculated for Reaction 2-1 and the lowest one was for Reaction 1-1. As is seen from Table S-8, K-value of the overall reaction (Reaction 4-1) was computed as markedly lower than the simple K-value summation of intermediate reaction steps. This result should stem from the fact that solvent media have considerable impacts on the Gibbs free energies of reactions. The reaction enthalpy of Case 1 modified by respective heats of vaporization was calculated as ca kj per mole of EtOl (l) at 308 K and 318 K. Thus, from a thermodynamic (quantum chemical) aspect and based on these results it can be stated that the rate limiting step for stoichiometric EtOH feed might be Reaction 1-1. Instead of the solvent compositions at the commencement of each reaction, it might be a more realistic approach calculating the Gibbs free energies of reactions and thus K-values in the subsequent solvent compositions, e.g. Reaction 1-1 in the solvent medium pertaining to reactive mixture feed of Reaction 2-1. Accordingly, solvent system for Reaction 3-1 should be an arbitrarily chosen homogeneous composition point of the reaction time course consisting mainly of EtOl and glycerol including some EtOH, and potential traces of tri-, di- and mono-olein species. Since, it is generally expected that each reversible reaction step will reach to chemical equilibrium at a finite mixture of reactants and products. This point will be further evaluated below (see Section 7 of the main text). Table S-8 Reaction energies and chemical equilibrium constants of transesterification reactions for stoichiometric feeds of EtOH and triolein taken place in the corresponding solvent media (systems). Normal boiling points of tri-, di-, and monoolein species were taken from Aspen Plus v.7.2 process simulation software database Case 2: 30% molar excess feed of EtOH. The results with 30% molar excess feeds of EtOH were presented in Table S-9. Although both of the reactions energies for Reaction 1-1 in this case were still positive and increased slightly, its K-value was still noticeably low. Analogous to Case 1 there was no difference in reaction energies for a T difference of 10 K; whereas corresponding K-values of Reaction 2-1 and 4-1 decreased considerably. In contrast, the K-values of Reaction 1-1 and Reaction 3-1 increased slightly. The absolute values of reaction energies for each particular reaction step did not change considerably in this case; while the corresponding K-values were found relatively higher except those of Reaction 1-1 and 4-1. This result elucidated that the amount of EtOH feed does not significantly affect Gibbs free energies of reactions. It was calculated that the enthalpies of reactions in both cases changed neither with T nor with the feed amount of EtOH. A-88
382 APPENDICES Table S-9 Reaction energies and chemical equilibrium constants of transesterification reactions for 30% molar excess feed of EtOH. Reactions occurred in the corresponding solvent media Case 3: Two Arbitrary Compositions of Reactive Mixture as the Solvent Systems with 30% molar excess feed of EtOH In order to investigate the effect of solvent system, i.e., reactive mixture impact on the equilibrium constant and Gibbs free energy of reaction, two arbitrarily chosen mixture compositions were used as the solvent media. The first chosen molar composition for all three consecutive reactions (Reaction 1-1 to 3-1) was consisting of 14.3% triolein, 4.1% diolein, 2.1% monoolein and the rest was EtOH. As can be seen in Table S-10, the reaction energies of Reaction 1-1 are still positive, but the K-value is relatively higher when compared with Case 1 and Case 2. This might be due to relatively higher miscibility of diolein and monoolein than triolein with EtOH the impact of relatively more homogeneous reactive media. In this case the K-value of Reaction 2-1 was relatively higher; while the K-value of Reaction 3-1 is substantially lower due to the lower absolute value of its reaction energy. This might be the result of the solvent system. As it can be seen from the table, K-value of Reaction 1-1 in particular and Reaction 3-1 increased significantly with temperature except that of Reaction 2-1 which decreased considerably. In case of Reaction 4-1, the solvent system consisted of a mixture of 42.8% (n) EtOl; 14.3% (n) glycerol; and 36.7% (n) EtOH and some residues of tri-, di-, and mono-olein species. When results of Case 2 and Case 3 given in Table S-10 are compared, there found some slight increases in the absolute values of Gibbs free energies of reaction and as a result the K-values also augmented correspondingly for both T values. Again, the enthalpies of reaction were found ca kj per mole of EtOl (l) at both T values. Since it is a more representative composition that one can expect as the equilibrium composition, the same solvent system was used for Reaction 1-1 to 3-1, as shown in Table Simulation results evidenced that in comparison to Case 2 the K-values of Reaction 1-1 and 2-1 increased significantly; while that of Reaction 3-1 decreased more than 3-fold. Thus, it is likely to state that Reaction 2-1 and 3-1 can proceed spontaneously in the written direction, however, that of Reaction 1-1 possibly will not. In case of Reaction 4-1 the solvent system consisted of a mixture of 55.9% (n) EtOl; 18.6% (n) glycerol; and 22.2% (n) EtOH and some residues of tri-, di-, and mono-olein species. When results of Case 3 for Reaction 4-1 given in Table S-10 and in Table S-11 are compared, there can be seen considerable decrease in the absolute values of GfE of reaction and as a result K-values decreased ca. 34- A-89
383 APPENDICES fold for both T values. This might be due to increased amounts of EtOl and glycerol and decreased amount of EtOH which makes the reaction system more prone to forming two liquid phases. Table S-10 Reaction energies and chemical equilibrium constants of transesterification reactions for 30% molar excess feed of EtOH and for arbitrarily chosen solvent compositions. Table S-11 Reaction energies and chemical equilibrium constants of transesterification reactions for 30% molar excess feed of EtOH and for arbitrarily chosen but more realistic solvent compositions Case 4: Chemical Reaction Equilibria for Hydrolysis Reactions with Stoichiometric H 2 O Feed. The results presented in Table S-12 showed that Reaction 1-2 is more endothermic than Reaction 1-1 given in Table S-8. The Gibbs free energies of both reactions were found positive at the studied T values where that of Reaction 1-2 was relatively higher. Accordingly, the K-values of hydrolysis reaction step (Reaction 1-2 ) were computed 65-fold lower at 308 K and 69-fold lower at 318 K than those of corresponding transesterification step (Reaction 1-1). If the other two reaction steps were compared respectively, it can be obviously seen that transesterification steps have substantially higher K-values than hydrolysis ones. Even though it is not appropriate making a comparison, it is still practical to deduce that transesterification reactions are more thermodynamically favorable than hydrolysis reactions. In other words, COSMO-RS based chemical thermodynamics of the overall A-90

384 APPENDICES system favors the formation of EtOl than OlAc in case of using aq. EtOH as the acyl acceptor. Yet, it requires further study. In this reaction set it was deduced that Reaction 1-2 might be the thermodynamically rate limiting step. The pattern of changes with T in terms of reaction energies and K-values were found analogous to Case 1 of transesterification reaction set given above. However, in contrast to Reaction 4-1 the overall reaction (Reaction 4-2) was found endothermic with an enthalpy of reaction calculated as ca kj per mole of OlAc (l) formed. Table S-12 Reaction energies and chemical equilibrium constants of hydrolysis reactions for stoichiometric feeds of H 2 O and triolein taken place in the corresponding solvent system. øøø 3. Analysis of Chemical Reaction Equilibria by means of Pseudo-empirical Equilibrium Constant Method for Alternative Thermophysical Data Table Table A4-7 Alternative decisions made on energy values and boiling point temperatures of chemical species to use in pseudo-empirical K-value method. A-91

385 APPENDICES Table A4-8 Parameter coefficient values of pseudo-empirical K value models given by Eq. (12) in Section 3 of the main text for the alternative table determined (Table A4-7). (Temperature values are in Kelvin; Models for overall reactions - Reaction 4-1 and 4-2- are linear combinations of transesterification and hydrolysis reaction sets, respectively.) A4-3-1 Reaction Energies A Gibbs free Energies and Chemical Equilibrium Constants of Reactions As is seen from Table A4-9, all the energy values, except those of Reaction 5, are negative and their absolute values increases with temperature. On the contrary, the corresponding K-values decreases o, liq. G T at higher temperatures, with the exceptions of despite to more negative values of their ( ) A-92 rxn Reaction 1-2 and Reaction 5. Although the K-value changes for Reaction 1-1 and 2-1 with respect to T can be considered as negligible, the fastest decrease in equilibrium constant with the increase in T was observed for Reaction 3-1. In hydrolysis reactions the impact of higher T on the equilibrium constants is rather significant with the highest but inverse of Reaction 3-2 case. A Enthalpies of Reactions,. Analogously, reaction enthalpies, H o liq ( T) rxn were calculated through the corresponding procedure demonstrated in Fig. 4-5 of Section 3 in the main text and were presented in Table A4-9 for each particular reaction. As it can be seen, all reaction steps have negative reaction enthalpies with Reaction 1-2 as an exception. It is obvious that even though Reaction 1-2 has rather higher K-values it requires energy input in order to surpass the reaction energy barrier and proceed in the written direction. On the other hand, as it has been presented in Table A4-6 given in Appendix 4-2, the respective enthalpies of this reaction step at the reference T values of 293 K and 303 K are both negative. Though, in these reference temperatures both Reaction 1-1 and Reaction 5 have positive reaction heats. Furthermore, in contrast to T o as the usual reference temperature, the GfE of Reaction 1-1, Reaction 1-2 and Reaction 5 have positive values at both reference temperatures. The reaction enthalpy of Reaction 1-1 at 313 K was calculated as kj per mole of EtOl (l) produced. It should be recognized that this value of reaction enthalpy stands for an unmixed condition where 1 mole of triolein and 1 mole of EtOH react to produce 1 mole of EtOl and 1 mole of diolein. In addition, the enthalpies of Reaction 2-1 and 3-1 were calculated as kj and kj per mole of EtOl (l), respectively. In overall, the enthalpy of Reaction 4-1 can be calculated as kj per mole of EtOl (l). Hence, as it can be easily perceived, there is a significant difference in the reaction enthalpies of Reaction 1-1 and 4-1. This substantial difference stems from the fact that the last intermediate step (Reaction 3-1) having considerably high exothermic enthalpy of reaction at the same T. Recently, Sotoft and co-workers 89 have reported the isothermal microcalorimetric measurement of reaction enthalpy at the same T as -9.3±0.7 kj/mol for transesterification of rapeseed oil by using EtOH as the acyl acceptor. Furthermore, the reaction enthalpy of Reaction 5 was calculated through
386 APPENDICES K-value method as kj/mol in average; whereas it was reported by Bucalá and co-workers 90 as kj/mol (in average). This totally opposite value was considered to stem from the fact that reactive mixture has two equilibrated liquid phases throughout of the reaction (water rich phase and fatty rich phase). Thus, instead of single liquid phase assumption it is indispensable to couple and compute physical and chemical equilibria simultaneously. The logarithm of equilibrium constants versus T and versus the reciprocal of T are illustrated in Fig. A4-2 and Fig. A4-3, respectively. In Fig. A4-3, the gradients of each curve correspond to the negative of respective enthalpy of reaction di- o Hrxn ( T) vided by universal (ideal) gas constant R, ( R ). Therefore, it can be concluded that, except those of Reaction 3-1 and 3-2 and thus Reaction 4-1 and 4-2, all other reaction enthalpies are nearly constant for the T range from 300 K to 380 K. Additionally, as shown in Fig. A4-2, since Reaction 1-1 of the transesterification reaction set is more exothermic than its counterpart in hydrolysis set the equilibrium constant of Reaction 1-1 decreases with T. Therefore, as a practical approach in the transesterification reaction with aq. EtOH, lower T values should be preferred in order to produce higher amounts of EtOl. In concluding this sub-section, if the corresponding steps of transesterification and hydrolysis reactions are compared it can be easily seen that the former ones are more exothermic than the latter ones. This means that transesterification reactions require relatively lower heat duty in order to proceed in the directions written. Figure A4-2 The change in the logarithm of equilibrium constants, Reaction 3-1 and 3-2 show abrupt diminution with the increase in T. lnk liq. a, with temperature for the reaction schema used. Figure A4-3 The change in the logarithm of equilibrium constants, lnk liq. a, with the reciprocal of temperature for the alternative K-value models. Reaction 3-1 and 3-2 show abrupt increase with the decrease in 1 T. A-93
, and overall (Reaction 4-1 and 4-2) reactions at standard conditions and at three reaction temperatures for the alternative thermophysical property set presented in Table A4-7.")
387 APPENDICES Table A4-9 Reaction energies and chemical equilibrium constants of transesterification (Reaction 1-1 to 3-1); hydrolysis (Reaction 1-2 to 3-2); esterification (Reaction 5), and overall (Reaction 4-1 and 4-2) reactions at standard conditions and at three reaction temperatures for the alternative thermophysical property set presented in Table A4-7. A-94
388 APPENDICES A4-3-2 Simulations of Chemical Equilibria through pseudo-empirical K-value Models A Simulation A: Transesterification Reactions using Absolute Ethanol Simultaneous calculation of the transesterification reaction set of triolein with absolute EtOH as the substrates was simulated with the results presented in Table A4-10. In this simulation, analogous to constrained and unconstrained GfE minimization methods, a CSTR reactor connected by two feed lines was used (see Fig. 4-6 given in Section 4). The same convergence criteria expressed by Eq. (13) was used and the mole fraction based equilibrium constants were expressed in terms of reaction extent of each particular reaction (see Eq. (5) in Part 2 of Appendix 4-1). All calculations with pseudoempirical equilibrium constant method were done using equilibrium temperature approach expressed by Eq. (22) given in Part 3 of Appendix 4-1. As seen from Table A4-10, EtOl with 66.77% of the theoretically possible conversion was obtained for 0.67 molar equivalent of EtOH (Case 1) at 308 K as the highest conversion. The second highest conversion of theoretically possible EtOl was obtained in case of 1.30 equivalent feed at the same T. It was observed that although there is no significant difference in the unconverted triolein amounts in Case 1, the amount of diolein increased from 57.43% at 308 K to 84.95% at 328 K; whereas that of monoolein decreased from 38.04% at 308 K to 10.64% at 328 K which proves that the reverse reaction is more favorable. As a result, it can be concluded that the amounts of EtOl and monoolein decrease with the increase in T; while that of diolein has the opposite tendency. Despite to relatively higher amounts of EtOl production, there is no glycerol formation in all cases. These results are expectedly in significantly correlated with the corresponding K-values of each reaction. The molar equivalent amounts of EtOH feeds at constant T have reverse impacts on Reaction 2-1 and 3-1: The highest amount of monoolein was observed with Case 3 at 308 K; whereas diolein amount was the lowest for all three cases at the same T value. As a result, it can be deduced that in higher EtOH feeds at 308 K reaction system favors the formation of monoolein rather than EtOl; whereas at higher T values reaction system favors the formation of diolein with significant decreases in EtOl and monoolein amounts. Therefore, the intermediate reaction steps, Reaction 2-1 and particularly Reaction 3-1, are the rate limiting steps (cf. Table A4-10 for comparisons). In concluding this section, the optimum results with the highest possible EtOl amount can be obtained at 308 K and 0.67 molar equivalent of EtOH. A Simulation B: Simultaneous Solution of Transesterification and Hydrolysis Reaction Sets using Aqueous Ethanol Since it was not possible to solve six corresponding reactions simultaneously, an appropriate but not very representative method as presented in Section 4.2 of the main text was used. The results of this method were shown in the Table A4-11, A4-12 and A4-13 for the corresponding pairs of reactions. As is shown in Table A4-11, simultaneous solution of Reaction 1-1 and 1-2 showed the highest percentage of theoretically possible EtOl formation as 73.59% at 308 K for Case 1 (0.67 molar equivalent of aq. EtOH) where this amount remained constant at higher T values. However the amount of produced EtOl decreased with the increase in equivalent amounts of aq. EtOH for other cases. In all three cases, as expected, the formation of OlAc favored and the water fed with aq. EtOH was entirely consumed. The simultaneous solution of Reaction 2-1 and 2-2 showed the highest conversion of diolein to EtOl at the same T of 308 K but, at a higher aq. EtOH feed rate (Case 2; the molar equivalent aq. EtOH was given with respect to diolein feed). However, as is seen from Table A4-12 there is no significant difference in conversions for three cases at the same T value. In contrast to Reaction 1-1 and 1-2, there observed a considerable decrease in EtOl formation at higher temperatures for all three cases. A-95
389 APPENDICES Analogous to the former reaction set, however, the formation of OlAc favored in all three cases and the water fed with aq. EtOH was entirely consumed. Due to very small K-values of Reaction 3-1, as expected, the simultaneous solution of this reaction set (Reaction 3-1 and 3-2) did not favor the formation of EtOl. The results were presented in Table A4-13 with the highest percent of theoretically possible EtOl formation as 0.53% at 308 K and 1.0 molar equivalent of aq. EtOH (with respect to monoolein feed). As it can be obviously seen, the system proceeds in the written direction for the formation of OlAc and glycerol amount augmenting with the increases in water feed rates (in aq. EtOH). It is worth noting that Reaction 3-2 also favors lower T values where there observed an abrupt decrease in OlAc formation at higher temperatures. A Simulation C: Consecutive Solution for Transesterification and Hydrolysis Reactions using Aqueous Ethanol Instead of solving each reaction pairs simultaneously for feeds entering at the reference T of 298 K ( T o ), in this case a method similar to the relaxation method pointed out in Section 4.2 of the main text was applied where the outlet T of former reaction pairs was used as the inlet T of the consecutive pair. As a result, three reaction pairs were solved successively where each pair involve simultaneous solution of transesterification and hydrolysis reaction steps. It is worth stating that even in this case involvement of the third reaction (Reaction 5) did not allow for the simultaneous solution of triple set of reactions. The results of sequentially solved 3 reaction pairs were presented in Table A4-14. As is seen from this table, the results are quite similar to those of Table A4-10. In this case the highest EtOl formation was reached to 65.15% of the theoretically possible amount at 308 K and 0.67 molar equivalent of aq. EtOH feed. Since some amount of triolein was converted through hydrolysis reactions, the remained triolein amounts were relatively lower. In all three cases, the water fed was consumed, but in this case there was no glycerol formation thanks to Reaction 3-2 as observed in Simulation B (presented in Table A4-13). The output of Reaction 3-1 and 3-2 was fed into another serial reactor operating at the same T values in order to reduce the FFA content of final biodiesel (EtOl) through esterification (Reaction 5). However there was no conversion in all three cases with three reaction temperatures each owing to substantially low K-values of esterification reaction and already equilibrated reactive mixture feed. It is also noteworthy that the highest monoolein amount of 71% (of the triolein fed) was ca. 5% higher than in the case of absolute EtOH at the same T (308 K) and same molar equivalent feed of EtOH (1.30). In overall, reaction system again favors lower temperature values and lower EtOH feed rates, either with aqueous or dry EtOH feeds, in order to yield higher EtOl. A-96
 at all temperatures (see Table A4-9 for the corresponding K-values).")

390 APPENDICES Table A4-10 Equilibrium compositions of transesterification reaction for the pseudo-empirical chemical equilibrium constant method using absolute EtOH as the acyl acceptor. There was no glycerol formation due to very low K-value of corresponding reaction step (Reaction 3-1) at all temperatures (see Table A4-9 for the corresponding K-values). EtOl output flow rates were given in bold + italic. Table A4-11 Equilibrium compositions of Reaction 1-1 and Reaction 1-2 solved simultaneously for the pseudo-empirical chemical equilibrium constant method using aqueous EtOH as the acyl acceptor. There was no water remained due to substantially high K-values of corresponding reaction step at all temperatures (see Table A4-9 for the corresponding K-values). EtOl and diolein flow rates were given in bold + italic. A-97
.")

391 APPENDICES Table A4-12 Equilibrium compositions of Reaction 2-1 and Reaction 2-2 solved simultaneously for the pseudo-empirical chemical equilibrium constant method using aqueous EtOH as the acyl acceptor. There was no water remained due to substantially high K-values of corresponding reaction step at all temperatures (see Table A4-9 for the corresponding K-values). EtOl and monoolein flow rates were given in bold + italic. Table A4-13 Equilibrium compositions of Reaction 3-1 and Reaction 3-2 solved simultaneously for the pseudo-empirical chemical equilibrium constant method using aqueous EtOH as the acyl acceptor. There was no significant EtOl formation due to substantially low K-values of corresponding reaction step at all temperatures (see Table A4-9 for the corresponding K-values). EtOl and glycerol flow rates were given in bold + italic. A-98
392 APPENDICES Table A4-14 Equilibrium compositions of reaction system (transesterification + hydrolysis) solved simultaneously for reaction pairs with the pseudo-empirical chemical equilibrium constant method using aqueous EtOH as the acyl acceptor. There was no glycerol formation due to substantially low K values of corresponding reaction steps at all temperatures (see Table A4-9 for the corresponding K-values). EtOl output flow rates were given in bold. A-99
393 APPENDICES References 1. Ravasio, N.; Zaccheria, F.; Psaro, R. The use of catalysis in the production of high-quality biodiesel. In Catalysis for Sustainable Energy Production, Barbaro, P., Bianchini, C., Eds.; WILEY-VCH: Weinheim, 2009; pp Cabral, M.; Cahill, M. F.; Howell, S. Biodiesel Task Force Report - (White paper on internationally compatible biofuel standards); Dec, Sandler, S. I. Chemical, Biochemical, and Engineering Thermodynamics; 4th ed.; J. Wiley & Sons: Hoboken, NJ., USA, Michelsen, M. L.; Mollerup, J. M. Thermodynamic Models: Fundamentals & Computational Aspects; 2nd ed.; Tie-Line Publications: Holte, DK., Walas, S. M. Liquid-liquid equilibria. In Phase Equilibria in Chemical Engineering, Butterworth- Heinemann Ltd.: Boston, US., 1985; pp Poling, B. E.; Prausnitz, J. M.; O'Connell, J. P. The Properties of Gases and Liquids; 5th ed.; McGraw-Hill Co., Inc.: Singapore, França, B. B.; Pinto, F. M.; Pessoa, F. L. P.; Uller, A. M. C. Liquid-Liquid Equilibria for Castor Oil Biodiesel plus Glycerol plus Alcohol. J. Chem. Eng. Data 2009, 54 (9), Kuramochi, H.; Maeda, K.; Kato, S.; Osako, M.; Nakamura, K.; Sakai, S. Application of UNIFAC models for prediction of vapor-liquid and liquid-liquid equilibria relevant to separation and purification processes of crude biodiesel fuel. Fuel 2009, 88 (8), Lee, M.-J.; Lo, Y.-C.; Lin, H.-M. Liquid-liquid equilibria for mixtures containing water, methanol, fatty acid methyl esters, and glycerol. Fluid Phase Equilib. 2010, 299, Negi, D. S.; Sobotka, F.; Kimmel, T.; Wozny, G.; Schomacker, R. Liquid-liquid phase equilibrium in glycerol-methanol-methyl oleate and glycerol-monoolein-methyl oleate ternary systems. Ind. Eng. Chem. Res. 2006, 45 (10), Tizvar, R.; Mclean, D. D.; Kates, M.; Dube, M. A. Liquid-liquid equilibria of the methyl oleate-glycerolhexane-methanol system. Ind. Eng. Chem. Res. 2008, 47 (2), Zhang, Y.; Dube, M. A.; Mclean, D. D.; Kates, M. Biodiesel production from waste cooking oil: 1. Process design and technological assessment. Bioresour. Technol. 2003, 89 (1), Sofyan, Y.; Ghajar, A. J.; Gasem, K. A. M. Multiphase equilibrium calculations using Gibbs minimization techniques. Ind. Eng. Chern. Res. 2003, 42, Michelsen, M. L. The isothermal flash problem. Part I. Stability. Fluid Phase Equilib. 1982, 9 (1), Smith, W. R.; Missen, R. W. Chemical Reaction Equilibrium Analysis: Theory and Algorithm; Krieger Pub. Co.: Malabar, FL., Nelson, P. A. Rapid phase determination in multiple-phase flash calculations. Comput. Chem. Eng. 1987, 11 (6), Eckert, F. COSMOtherm Users Manual - Version C2.1 Release 01.11a; COSMOlogic GmbH & Co. KG: Leverkusen, Germany, Abbott, M. M.; Prausnitz, J. M. Modeling the excess gibbs energy. In Models for Thermodynamic and Phase Equilibria Calculations, Sandler, S. I., Ed.; CRC Press: New Jersey, USA, 1993; pp Shah, M. R.; Yadav, G. D. Prediction of liquid liquid equilibria for biofuel applications by quantum chemical calculations using the Cosmo-SAC method. Ind. Eng. Chem. Res 2011, 50, Swank, D. J.; Mullins, J. C. Evaluation of methods for calculating liquid-liquid phase-splitting. Fluid Phase Equilib. 1986, 30, Abrams, D. E.; Prausnitz, J. M. Statistical thermodynamics of liquid mixtures: A new expression for the excess gibbs energy of partly or completely miscible systems. AIChE Journal 1975, 21 (1), Prausnitz, J. M.; Lichtenthaler, R. N.; Azevedo de, E. G. Molecular Thermodynamics of Fluid Phase Equilibria; 3rd ed.; Prentice Hall PTR: New Jersey, Fredenslund, Aa.; Rasmussen, P. From Unifac to Superfac and Back? Fluid Phase Equilib. 1985, 24 (1-2), A-100
394 APPENDICES 24. Gmehling, J.; Li, J. D.; Schiller, M. A modified UNIFAC model.2. Present parameter matrix and results for different thermodynamic properties. Ind. Eng. Chem. Res. 1993, 32 (1), Hansen, H. K.; Rasmussen, P.; Fredenslund, A.; Schiller, M.; Gmehling, J. Vapor-liquid-equilibria by UNIFAC group contribution.5. Revision and extension. Ind. Eng. Chem. Res. 1991, 30 (10), Magnussen, T.; Rasmussen, P.; Fredenslund, A. UNIFAC parameter table for prediction of liquid-liquid equilibria. Ind. Eng. Chem. Process Des. Dev. 1981, 20 (2), Batista, E.; Monnerat, S.; Stragevitch, L.; Pina, C. G.; Gonçalves, C. B.; Meirelles, A. J. A. Prediction of liquid-liquid equilibrium for systems of vegetable oils, fatty acids, and ethanol. J. Chem. Eng. Data 1999, 44 (6), Tsuboka, T.; Katayama, T. Modified Wilson equation for vapor-liquid and liquid-liquid equilibria. J. Chem. Eng. Jpn. 1975, 8 (3), Jakob, A.; Grensemann, H.; Lohmann, J.; Gmehling, J. Further development of modified UNIFAC (Dortmund): Revision and extension 5. Ind. Eng. Chem. Res 2006, 45 (23), Kontogeorgis, G. M.; Folas, G. K. Activity coefficient models Part 2: local composition models, from Wilson and NRTL to UNIQUAC and UNIFAC. In Thermodynamic Models for Industrial Applications : From Classical and Advanced Mixing Rules to Association Theories, J. Wiley & Sons Ltd.: West Sussex, UK., 2010; pp Renon, H.; Prausnitz, J. M. Local compositions in thermodynamic excess functions for liquid mixtures. AIChE Journal 1968, 14 (1), Abbott, M. M.; Prausnitz, J. M. Phase equilibria. In Handbook of Separation Process Technology, Rousseau, R. W., Ed.; J. Wiley & Sons, Inc.: New York, US., 1987; pp Sørensen, J. M.; Magnussen, T.; Rasmussen, P.; Fredenslund, A. Liquid-liquid equilibrium data - their retrieval, correlation and prediction.1. Retrieval. Fluid Phase Equilib. 1979, 2 (4), Antczak, M. S.; Kubiak, A.; Antczak, T.; Bielecki, S. Enzymatic biodiesel synthesis - Key factors affecting efficiency of the process. Renewable Energy 2009, 34 (5), Cerce, T.; Peter, S.; Weidner, E. Biodiesel-transesterification of biological oils with liquid catalysts: Thermodynamic properties of oil-methanol-amine mixtures. Ind. Eng. Chem. Res. 2005, 44 (25), Makareviciene, V.; Sendzikiene, E.; Janulis, P. Solubility of multi-component biodiesel fuel systems. Bioresour. Technol. 2005, 96 (5), Larsen, B. L.; Rasmussen, P.; Fredenslund, A. A modified UNIFAC group-contribution model for prediction of phase-equilibria and heats of mixing. Ind. Eng. Chem. Res. 1987, 26 (11), Macedo, E. A.; Weidlich, U.; Gmehling, J.; Rasmussen, P. Vapor liquid equilibria by UNIFAC group contribution - Revision and extension.3. Ind. Eng. Chem. Process Des. Dev. 1983, 22 (4), Follegatti-Romero, L. A.; Oliveira, M. B.; Batista, F. R. M.; Batista, E. A. C.; Coutinho, J. A. P.; Meirelles, A. J. A. Liquid liquid equilibria for ternary systems containing ethyl esters, ethanol and glycerol at and K. Fuel Andrade, E. F.; Igarashi-Mafra, L.; Mafra, M. R.; Corazza, M. L. (Liquid + liquid) equilibrium for the system {ethyl stearate(1) + ethanol(2) + glycerol(3)}. J. Chem. Thermodyn. 2012, 47, Mohsen-Nia, M.; Dergahi, M. Liquid-liquid equilibrium for systems of (corn oil + oleic acid + methanol or ethanol) at ( and ) K. J. Chem. Eng. Data 2007, 52 (3), Knothe, G.; Van Gerpen, J.; Krahl, J. The Biodiesel Handbook; 2nd ed.; AOCS Press: Champaign, Illinois, USA, Lide, D. R. The CRC Handbook of Chemistry and Physics; 90 th ed.; CRC Press: Boca Raton, FL. / USA, Dean, J. A. Lange's Handbook of Chemistry; 15 th ed.; McGraw-Hill Professional: New York, USA, Kontogeorgis, G. M.; Folas, G. K. Applications of SAFT to polar and associating mixtures. In Thermodynamic Models for Industrial Applications : From Classical and Advanced Mixing Rules to Association Theories, J. Wiley & Sons Ltd.: West Sussex, UK., 2010; pp Economou, I. G. Statistical Associating Fluid Theory: A successful model for the calculation of thermodynamic and phase equilibrium properties of complex fluid mixtures. Ind. Eng. Chem. Res. 2002, 41 (5), A-101
395 APPENDICES 47. Müller, E. A.; Gubbins, K. E. Molecular-based equations of state for associating fluids: A review of SAFT and related approaches. Ind. Eng. Chem. Res. 2001, 40 (10), Tan, S. P.; Adidharma, H.; Radosz, M. Recent advances and applications of statistical associating fluid theory. Ind. Eng. Chem. Res. 2008, 47 (21), Chapman, W. G.; Gubbins, K. E.; Jackson, G.; Radosz, M. New reference equation of state for associating liquids. Ind. Eng. Chem. Res. 1990, 29 (8), Huang, S. H.; Radosz, M. Equation of state for small, large, polydisperse, and associating molecules - Extension to fluid mixtures. Ind. Eng. Chem. Res. 1991, 30 (8), Huang, S. H.; Radosz, M. Equation of state for small, large, polydisperse, and associating molecules. Ind. Eng. Chem. Res. 1990, 29 (11), Beret, S.; Prausnitz, J. M. Perturbed hard-chain theory: An equation of state for fluids containing small or large molecules. AIChE Journal 1975, 21 (6), Elliott, J. R.; Suresh, S. J.; Donohue, M. D. A simple equation of state for nonspherical and associating molecules. Ind. Eng. Chem. Res. 1990, 29 (7), Elliott, J. R.; Lira, C. T. Introductory Chemical Engineering Thermodynamics; Prentice Hall PTR: New Jersey, Elliott, J. R.; Natarajan, R. N. Extension of the Elliott-Suresh-Donohue equation of state to polymer solutions. Ind. Eng. Chem. Res 2002, 41 (5), Emami, F. S.; Vahid, A.; Elliott, J. R.; Feyzi, F. Group contribution prediction of vapor pressure with statistical associating fluid theory, perturbed-chain statistical associating fluid theory, and Elliott-Suresh-Donohue equations of state. Industrial & Engineering Chemistry Research 2008, 47 (21), Suresh, S. J.; Elliott, J. R. Multiphase equilibrium analysis via a generalized equation of state for associating mixtures. Ind. Eng. Chem. Res. 1992, 31 (12), Elliott, J. R. Efficient implementation of Wertheim's theory for multicomponent mixtures of polysegmented species. Ind. Eng. Chem. Res. 1996, 35 (5), Suresh, S. J.; Beckman, E. J. Prediction of liquid-liquid equilibria in ternary mixtures from binary data. Fluid Phase Equilib. 1994, 99, Huber, M. L.; Lemmon, E. W.; Kazakov, A.; Ou, L. S.; Bruno, T. J. Model for the thermodynamic properties of a biodiesel fuel. Energy & Fuels 2009, 23 (7), Perdomo, F. A.; Gil-Villegas, A. Molecular thermodynamics of biodiesel fuel compounds. Fluid Phase Equilib. 2010, 293 (2), Perdomo, F. A.; Gil-Villegas, A. Predicting thermophysical properties of biodiesel fuel blends using the SAFT-VR approach. Fluid Phase Equilib. 2011, 306 (1), Barreau, A.; Brunella, I.; de Hemptinne, J. C.; Coupard, V.; Canet, X.; Rivollet, F. Measurements of liquid-liquid equilibria for a methanol + glycerol + methyl oleate system and prediction using group contribution statistical associating fluid theory. Ind. Eng. Chem. Res. 2010, 49 (12), Kontogeorgis, G. M.; Economou, I. G. Equations of state: From the ideas of van der Waals to association theories. J. Supercrit. Fluids 2010, 55 (2), Economou, I. G.; Donohue, M. D. Equations of state for hydrogen bonding systems. Fluid Phase Equilib. 1996, 116 (1-2), Economou, I. G.; Tsonopoulos, C. Associating models and mixing rules in equations of state for water/hydrocarbon mixtures. Chemical Engineering Science 1997, 52 (4), Batista, E.; Monnerat, S.; Kato, K.; Stragevitch, L.; Meirelles, A. J. A. Liquid-liquid equilibrium for systems of canola oil, oleic acid, and short-chain alcohols. J. Chem. Eng. Data 1999, 44 (6), Mohsen-Nia, M.; Modarres, H.; Nabavi, H. R. Measuring and modeling liquid-liquid equilibria for a soybean oil, oleic acid, ethanol, and water system. J. Am. Oil Chem. Soc. 2008, 85 (10), Chiyoda, C.; Peixoto, E. C. D.; Meirelles, A. J. A.; Rodrigues, C. E. C. Liquid-liquid equilibria for systems composed of refined soybean oil, free fatty acids, ethanol, and water at different temperatures. Fluid Phase Equilib. 2010, 299 (1), Rodrigues, C. E. C.; Peixoto, E. C. D.; Meirelles, A. J. A. Phase equilibrium for systems composed by refined soybean oil plus commercial linoleic acid plus ethanol plus water, at K. Fluid Phase Equilib. 2007, 261 (1-2), A-102
396 APPENDICES 71. Follegatti-Romero, L. A.; Oliveira, M. B.; Batista, E. A. C.; Coutinho, J. A. P.; Meirelles, A. J. A. Liquid liquid equilibria for ethyl esters + ethanol + water systems: Experimental measurements and CPA EoS modeling. Fuel 2012, 96, Follegatti-Romero, L. A.; Lanza, M.; Batista, F. R. M.; Oliveira, M. B.; Coutinho, J. A. P.; Meirelles, A. J. A. Liquid-liquid equilibrium for ternary systems containing ethyl esters, anhydrous ethanol and water at , , and K. Ind. Eng. Chem. Res. 2010, 49 (24), Greiner, H. An efficient implementation of Newton's method for complex nonideal chemical equilibria. Comput. Chem. Eng. 1991, 15 (2), Fredenslund, Aa.; Jones, R. L.; Prausnitz, J. M. Group-contribution estimation of activity coefficients in nonideal liquid mixtures. AIChE Journal 1975, 21 (6), van Zeggeren, F.; Storey, S. H. The Computation of Chemical Equilibria; Cambridge University Press: Cambridge, UK., Constantinou, L.; Gani, R. New group contribution method for estimating properties of pure compounds. AIChE Journal 1994, 40, Marrero, J.; Gani, R. Group-contribution based estimation of pure component properties. Fluid Phase Equilib. 2001, 183, Kolská, Z.; Ružicka, V.; Gani, R. Estimation of the enthalpy of vaporization and the entropy of vaporization for pure organic compounds at K and at normal boiling temperature by a group contribution method. Ind. Eng. Chem. Res. 2005, 44 (22), Kolská, Z.; Kukal, Z.; Zábranský, M.; Ružicka, V. Estimation of the heat capacity of organic liquids as a function of temperature by a three-level group contribution method. Ind. Eng. Chem. Res. 2008, 47 (6), Kulkarni, C. V.; Wachter, W.; Iglesias-Salto, G.; Engelskirchen, S.; Ahualli, S. Monoolein: a magic lipid? Phys. Chem. Chem. Phys. 2011, 13 (8), Thermophysical properties of 'fatty' substances Ref Type: Online Source 82. Gautam, R.; Seider, W. D. Computation of phase and chemical equilibrium: Part II - Phase-splitting. AIChE Journal 1979, 25 (6), Klamt, A.; Schüürmann, G. COSMO: a new approach to dielectric screening in solvents with explicit expressions for the screening energy and its gradient. J. Chem. Soc., Perkin Trans , (5), Schafer, A.; Klamt, A.; Sattel, D.; ohrenz, J. C. W.; ckert, F. COSMO implementation in TURBOMOLE: Extension of an efficient quantum chemical code towards liquid systems. Phys. Chem. Chem. Phys. 2000, 2 (10), Eckert.F. COSMOtherm Users Manual - Version C2.1 Release 01.11a; COSMOlogic GmbH & Co. KG: Leverkusen, Germany, Klamt, A. Conductor-like screening model for real solvents: a new approach to the quantitative calculation of solvation phenomena. J. Phys. Chem. 1995, 99 (7), Lin, S.-T.; Sandler, S. I. A Priori Phase Equilibrium Prediction from a Segment Contribution Solvation Model. Ind. Eng. Chem. Res. 2002, 41, Klamt, A. The basic COSMO-RS. In COSMO-RS: From Quantum Chemistry to Fluid Phase Thermodynamics and Drug Design, Elsevier Science Ltd.: Amsterdam, The Netherlands, 2005; pp Sotoft, L. F.; Westh, P.; Christensen, K. V.; Norddahl, B. Novel investigation of enzymatic biodiesel reaction by isothermal calorimetry. Thermochim. Acta 2010, 501 (1-2), Bucalá, V.; Foresti, M. L.; Trubiano, G.; Briozzo, M.; Bottini, S. Analysis of solvent-free ethyl oleate enzymatic synthesis at equilibrium conditions. Enzyme Microb. Technol. 2006, 38 (7), A-103


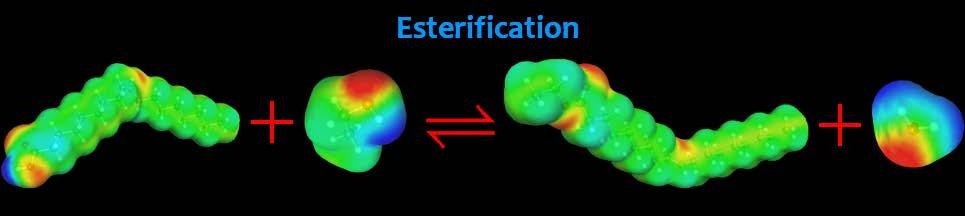
397
Abstract Process Economics Program Report 251 BIODIESEL PRODUCTION (November 2004)
") Abstract Process Economics Program Report 251 BIODIESEL PRODUCTION (November 2004) Biodiesel is an ester of fatty acids produced from renewable resources such as virgin vegetable oil, animal fats and used
Abstract Process Economics Program Report 251 BIODIESEL PRODUCTION (November 2004) Biodiesel is an ester of fatty acids produced from renewable resources such as virgin vegetable oil, animal fats and used
About the authors xi. Woodhead Publishing Series in Energy. Preface
 v Contents About the authors xi Woodhead Publishing Series in Energy Preface xiii xv 1 Biodiesel as a renewable energy source 1 1.1 Introduction 1 1.2 Energy policy 2 1.3 Transformation of biomass 20 1.4
CONVERSION OF GLYCEROL TO GREEN METHANOL IN SUPERCRITICAL WATER
 CONVERSION OF GLYCEROL TO GREEN METHANOL IN SUPERCRITICAL WATER Maša Knez Hrnčič, Mojca Škerget, Ljiljana Ilić, Ţeljko Knez*, University of Maribor, Faculty of Chemistry and Chemical Engineering, Laboratory
COMPARISON OF TOTAL ENERGY CONSUMPTION NECESSARY FOR SUBCRITICAL AND SUBCRITICAL SYNTHESIS OF BIODIESEL. S. Glisic 1, 2*, D.
 COMPARISON OF TOTAL ENERGY CONSUMPTION NECESSARY FOR SUBCRITICAL AND SUBCRITICAL SYNTHESIS OF BIODIESEL S. Glisic 1, 2*, D. Skala 1, 2 1 Faculty of Technology and Metallurgy, University of Belgrade, Karnegijeva
Methanol recovery during transesterification of palm oil in a TiO2/Al2O3 membrane reactor: Experimental study and neural network modeling
 University of Malaya From the SelectedWorks of Abdul Aziz Abdul Raman 2010 Methanol recovery during transesterification of palm oil in a TiO2/Al2O3 membrane reactor: Experimental study and neural network
V.Venkatakranthi Teja. N S Raju Institute of Technology (NSRIT), Sontyam, Visakhapatnam, Andhra Pradesh , India.
, Sontyam, Visakhapatnam, Andhra Pradesh , India.") Preparation of Waste Cooking Oil as Alternative Fuel and Experimental Investigation Using Bio-Diesel Setup a Comparative Study with Single Cylinder Diesel Engine Mr.S.Sanyasi Rao Pradesh - 531173, India.
Preparation of Waste Cooking Oil as Alternative Fuel and Experimental Investigation Using Bio-Diesel Setup a Comparative Study with Single Cylinder Diesel Engine Mr.S.Sanyasi Rao Pradesh - 531173, India.
POLLUTION CONTROL AND INCREASING EFFICIENCY OF DIESEL ENGINE USING BIODIESEL
 POLLUTION CONTROL AND INCREASING EFFICIENCY OF DIESEL ENGINE USING BIODIESEL Deepu T 1, Pradeesh A.R. 2, Vishnu Viswanath K 3 1, 2, Asst. Professors, Dept. of Mechanical Engineering, Ammini College of
Experimental Investigation and Modeling of Liquid-Liquid Equilibria in Biodiesel + Glycerol + Methanol
 11 2nd International Conference on Chemical Engineering and Applications IPCBEE vol. 23 (11) (11) IACSIT Press, Singapore Experimental Investigation and Modeling of Liquid-Liquid Equilibria in + + Methanol
Ayhan Demirbas. Biodiesel. A Realistic Fuel Alternative for Diesel Engines
 Biodiesel Ayhan Demirbas Biodiesel A Realistic Fuel Alternative for Diesel Engines 123 Ayhan Demirbas Professor of Energy Technology Sila Science and Energy Trabzon Turkey ISBN 978-1-84628-994-1 e-isbn
Phase Distribution of Ethanol, and Water in Ethyl Esters at K and K
 Phase Distribution of Ethanol, and Water in Ethyl Esters at 298.15 K and 333.15 K Luis A. Follegatti Romero, F. R. M. Batista, M. Lanza, E.A.C. Batista, and Antonio J.A. Meirelles a ExTrAE Laboratory of
This presentation focuses on Biodiesel, scientifically called FAME (Fatty Acid Methyl Ester); a fuel different in either perspective.
; a fuel different in either perspective.") Today, we know a huge variety of so-called alternative fuels which are usually regarded as biofuels, even though this is not always true. Alternative fuels can replace fossil fuels in existing combustion
Today, we know a huge variety of so-called alternative fuels which are usually regarded as biofuels, even though this is not always true. Alternative fuels can replace fossil fuels in existing combustion
Effects Of Free Fatty Acids, Water Content And Co- Solvent On Biodiesel Production By Supercritical Methanol Reaction
 Effects Of Free Fatty Acids, Water Content And Co- Solvent On Biodiesel Production By Supercritical Methanol Reaction Kok Tat Tan*, Keat Teong Lee, Abdul Rahman Mohamed School of Chemical Engineering,
Project Reference No.: 40S_B_MTECH_007
 PRODUCTION OF BIODIESEL FROM DAIRY WASH WATER SCUM THROUGH HETEROGENEOUS CATALYST AND PERFORMANCE EVALUATION OF TBC DIESEL ENGINE FOR DIFFERENT DIESEL AND METHANOL BLEND RATIOS Project Reference No.: 40S_B_MTECH_007
Production of Biodiesel from Waste Oil via Catalytic Distillation
 Production of Biodiesel from Waste Oil via Catalytic Distillation Zhiwen Qi, Yuanqing Liu, Blaise Pinaud, Peter Rehbein Flora T.T. Ng*, Garry L. Rempel Department of Chemical Engineering, University of
Production of Biodiesel from Used Groundnut Oil from Bosso Market, Minna, Niger State, Nigeria
 Production of Biodiesel from Used Groundnut Oil from Bosso Market, Minna, Niger State, Nigeria Alabadan B.A. Department of Agricultural and Bioresources Engineering, Federal University, Oye Ekiti. Ajayi
EXCESS METHANOL RECOVERY IN BIODIESEL PRODUCTION PROCESS USING A DISTILLATION COLUMN: A SIMULATION STUDY
 Chemical Engineering Research Bulletin 13 (2009) 55-60 Available online at http://www.banglajol.info/index.php/cerb EXCESS METHANOL RECOVERY IN BIODIESEL PRODUCTION PROCESS USING A DISTILLATION COLUMN:
CHAPTER 4 PRODUCTION OF BIODIESEL
 56 CHAPTER 4 PRODUCTION OF BIODIESEL 4.1 INTRODUCTION Biodiesel has been produced on a large scale in the European Union (EU) since 1992 (European Biodiesel Board 2008) and in the United States of America
RESEARCH REPORT PRODUCTION OF BIODIESEL FROM CHICKEN FAT WITH COMBINATION SUBCRITICAL METHANOL AND WATER PROCESS
 RESEARCH REPORT PRODUCTION OF BIODIESEL FROM CHICKEN FAT WITH COMBINATION SUBCRITICAL METHANOL AND WATER PROCESS Submitted by: Felix Harijaya Santosa NRP. 5203014015 Ryan Sumule NRP. 5203014037 DEPARTMENT
CHAPTER - 3 PREPARATION AND CHARACTERIZATION OF
 75 CHAPTER - 3 PREPARATION AND CHARACTERIZATION OF BIODIESEL FROM NON-EDIBLE VEGETABLE OILS Table of Contents Chapter 3: PREPARATION AND CHARACTERIZATION OF BIODIESEL FROM NON-EDIBLE VEGETABLE OILS S.
Phase Equilibrium and Emulsion Stability on Ethyl Biodiesel Production
 Phase Equilibrium and Emulsion Stability on Ethyl Biodiesel Production Bruno Bôscaro França 1 *, Hugo Gomes D`Amato Villardi 2, Tayná Esteves 2, Angela Maria Cohen Uller 1, Fernando Luiz Pellegrini Pessoa
Chemical Modification of Palm Oil for Low Temperature Applications and its Study on Tribological Properties
 Journal of Advanced Engineering Research ISSN: 2393-8447 Volume 4, Issue 2, 2017, pp.109-113 Chemical Modification of Palm Oil for Low Temperature Applications and its Study on Tribological Properties
Synthesis, Characterization and Evaluation of Sulphated Zirconias for Biodiesel Production by Triglyceride Cracking
 Synthesis, Characterization and Evaluation of Sulphated Zirconias for Biodiesel Production by Triglyceride Cracking Elizabeth J. Eterigho, J. G. M. Lee & A. P. Harvey School of Chemical Engineering and
International Journal of Chemical Engineering and Applications, Vol. 4, No. 5, October 2013
 Liquid-Liquid Equilibrium of Methyl Esters of Fatty Acid / Methanol / Glycerol and Fatty Acid Ethyl Esters / Ethanol / Glycerol: A Case Study for Biodiesel Application Ana Carolina de Sousa Maia, Iury
Non-catalytic alcoholysis process for production of biodiesel fuel by using bubble column reactor
 Journal of Physics: Conference Series OPEN ACCESS Non-catalytic alcoholysis process for production of biodiesel fuel by using bubble column reactor To cite this article: S Hagiwara et al 2015 J. Phys.:
Cataldo De Blasio, Dr. Sc. (Tech.)
") Biodiesel Cataldo De Blasio, Dr. Sc. (Tech.) Aalto University, School of Engineering. Department of Mechanical Engineering. Laboratory of Energy Engineering and Environmental Protection. Sähkömiehentie
Biodiesel Cataldo De Blasio, Dr. Sc. (Tech.) Aalto University, School of Engineering. Department of Mechanical Engineering. Laboratory of Energy Engineering and Environmental Protection. Sähkömiehentie
BIODIESEL PRODUCTION BY A CONTINUOUS PROCESS USING A HETEROGENEOUS CATALYST
 J. Curr. Chem. Pharm. Sc.: 2(1), 2012, 12-16 ISSN 2277-2871 BIODIESEL PRODUCTION BY A CONTINUOUS PROCESS USING A HETEROGENEOUS CATALYST SHARDA D. NAGE *, K. S. KULKARNI, A. D. KULKARNI and NIRAJ S. TOPARE
SYNTHESIS OF BIODIESEL
 SYNTHESIS OF BIODIESEL AIM 1. To generate laboratory know-how for the process of production of biodiesel from the given oil feed stock 2. To perform basic mass and energy balance calculations for a large
Production and Properties of Biodistillate Transportation Fuels
 Production and Properties of Biodistillate Transportation Fuels AWMA International Specialty Conference: Leapfrogging Opportunities for Air Quality Improvement May 10-14, 2010 Xi an, Shaanxi Province,
Quantitative Analysis of Chemical Compositions from Various Sources of Crude Glycerine
 CMU.J.Nat.Sci.Special Issue on Agricultural & Natural Resources (2012) Vol.11 (1) 157 Quantitative Analysis of Chemical Compositions from Various Sources of Crude Glycerine Adisorn Settapong * and Chaiyawan
Fischer-Tropsch Refining
 Fischer-Tropsch Refining by Arno de Klerk A thesis submitted in partial fulfillment of the requirements for the degree Philosophiae Doctor (Chemical Engineering) in the Department of Chemical Engineering
CHAPTER 1 INTRODUCTION
 1 CHAPTER 1 INTRODUCTION 1.1 GENERAL With a rapid increase in the demand of fossil fuel, decrease in the availability of crude oil supplies and greater environmental stringent norms on pollution has created
A Novel Non-catalytic Biodiesel Production Process by Supercritical Methanol as NEDO High Efficiency Bioenergy Conversion Project
 A Novel Non-catalytic Biodiesel Production Process by Supercritical Methanol as NEDO High Efficiency Bioenergy Conversion Project Shiro Saka * and Eiji Minami Graduate School of Energy Science, Kyoto University,
Production of Biodiesel from Palm Oil by Extractive Reaction
 CHEMICAL ENGINEERING TRANSACTIONS Volume 21, 2010 Editor J. J. Klemeš, H. L. Lam, P. S. Varbanov Copyright 2010, AIDIC Servizi S.r.l., ISBN 978-88-95608-05-1 ISSN 1974-9791 DOI: 10.3303/CET1021206 1231
Foundations of Thermodynamics and Chemistry. 1 Introduction Preface Model-Building Simulation... 5 References...
 Contents Part I Foundations of Thermodynamics and Chemistry 1 Introduction... 3 1.1 Preface.... 3 1.2 Model-Building... 3 1.3 Simulation... 5 References..... 8 2 Reciprocating Engines... 9 2.1 Energy Conversion...
Application Note. Author. Introduction. Energy and Fuels
 Analysis of Free and Total Glycerol in B-100 Biodiesel Methyl Esters Using Agilent Select Biodiesel for Glycerides Application Note Energy and Fuels Author John Oostdijk Agilent Technologies, Inc. Introduction
Study of viscosity - temperature characteristics of rapeseed oil biodiesel and its blends
 Study of viscosity - temperature characteristics of rapeseed oil biodiesel and its blends Li Kong 1, Xiu Chen 1, a, Xiaoling Chen 1, Lei Zhong 1, Yongbin Lai 2 and Guang Wu 2 1 School of Chemical Engineering,
Performance and Emissions Study in Diesel Engines Using Cotton Seed Biodiesel
 Performance and Emissions Study in Diesel Engines Using Cotton Seed Biodiesel K.Kusuma Kumari M.Tech (Thermal Engineering) Department of Mechanical Engineering VITS College of Engineering, Sontyam, Anandapuram,
Author: Vincenzo Piemonte, Associate Professor, University UCBM Rome (Italy)
") Green Diesel Author: Vincenzo Piemonte, Associate Professor, University UCBM Rome (Italy) 1. Theme description Around 50% of the produced crude petroleum in the world is refined into transportation fuels
Green Diesel Author: Vincenzo Piemonte, Associate Professor, University UCBM Rome (Italy) 1. Theme description Around 50% of the produced crude petroleum in the world is refined into transportation fuels
Proposal to Determine Various Properties of Biodiesel Fuels Based on Methyl Ester. Composition. Jason Freischlag. Dr. Porter Chem /25/2013
 1 Proposal to Determine Various Properties of Biodiesel Fuels Based on Methyl Ester Composition Jason Freischlag Dr. Porter Chem 402 11/25/2013 2 Specific Aims Biodiesel is an alternative fuel source that
Background on Biodiesel
 Background on Biodiesel Jon Van Gerpen Dept. of Biological and Agricultural Engineering University of Idaho Moscow, ID 83844 (208) 885-7891 jonvg@uidaho.edu Sustainable Transportation on Campus September
Determination of Free and Total Glycerin in B100 Biodiesel
 Page 1 of 5 Page 1 of 5 Return to Web Version Determination of Free and Total Glycerin in B100 Biodiesel By: Michael D. Buchanan, Katherine K. Stenerson, and Vicki Yearick, Reporter US Vol 27.1 techservice@sial.com
Experimental investigation on constant-speed diesel engine fueled with. biofuel mixtures under the effect of fuel injection
 Experimental investigation on constant-speed diesel engine fueled with biofuel mixtures under the effect of fuel injection 1 I. Vinoth kanna *, 2 K. Subramani, 3 A. Devaraj 1 2 3 Department of Mechanical
Biodiesel from Various Vegetable Oils as the Lubricity Additive for Ultra Low Sulphur Diesel (ULSD)
") AMM-5 The 2 st Conference of Mechanical Engineering Network of Thailand 7-9 October 27, Chonburi, Thailand Biodiesel from Various Vegetable Oils as the Lubricity Additive for Ultra Low Sulphur (ULSD) Subongkoj
AMM-5 The 2 st Conference of Mechanical Engineering Network of Thailand 7-9 October 27, Chonburi, Thailand Biodiesel from Various Vegetable Oils as the Lubricity Additive for Ultra Low Sulphur (ULSD) Subongkoj
Experimental Investigations on a Four Stoke Diesel Engine Operated by Jatropha Bio Diesel and its Blends with Diesel
 International Journal of Manufacturing and Mechanical Engineering Volume 1, Number 1 (2015), pp. 25-31 International Research Publication House http://www.irphouse.com Experimental Investigations on a
Energy requirement estimates for two step ethanolysis of waste vegetable oils for biodiesel production
 Energy requirement estimates for two step ethanolysis of waste vegetable oils for biodiesel production Nikolas Ligeris 1, a and Kalala Jalama 1,b 1 Department of Chemical Engineering, University of Johannesburg,
The Purification Feasibilityof GlycerinProduced During
 The Purification Feasibilityof GlycerinProduced During BiodieselProduction S. Soulayman, F. Mustafa, and A. Hadbah Higher Institute for Applied Sciences and technology, Damascus, P.O. Box 31983, Syria,
CHAPTER 3 VEGETABLE OIL, BIODIESEL AND OXYGENATES AN OVERVIEW
 38 CHAPTER 3 VEGETABLE OIL, BIODIESEL AND OXYGENATES AN OVERVIEW 3.1 VEGETABLE OIL AND ITS BLENDS Vegetable fats and oils are lipid materials derived from plants. Physically, oils are liquid at room temperature,
Evaluation of Biodiesel Production Process from Sapium Tree Oil Sebiferum using Exergy Analysis Methodology
 463 A publication of CHEMICAL ENGINEERING TRANSACTIONS VOL. 43, 2015 Chief Editors: Sauro Pierucci, Jiří J. Klemeš Copyright 2015, AIDIC Servizi S.r.l., ISBN 978-88-95608-34-1; ISSN 2283-9216 The Italian
Impact of Biodiesel Fuel on Engine Parts
 Impact of Biodiesel Fuel on Engine Parts Presented by Prof. Dr.Liaquat Ali Memon Department of Mechanical Engineering, Quaid-e-Awam University of Engineering, Science & Technology, Nawabshah, Sindh, PAKISTAN
PROJECT REFERENCE NO.: 39S_R_MTECH_1508
 DEVELOPMENT OF AGRICULTURAL WASTE BASED HETEROGENEOUS CATALYST FOR PRODUCTION OF BIODIESEL FROM MIXED WASTE COOKING OIL AND ITS PERFORMANCE ON DIESEL ENGINE PROJECT REFERENCE NO.: 39S_R_MTECH_1508 COLLEGE
DAVI DOS SANTOS, STEPHEN MONTGOMERY, ANN NUNNELLEY, MD NURUDDIN BSEN 5540/6540: BIOMASS AND BIOFUELS BIODIESEL PRODUCTION FROM VEGETABLE OIL GROUP:
 DAVI DOS SANTOS, STEPHEN MONTGOMERY, ANN NUNNELLEY, MD NURUDDIN BSEN 5540/6540: BIOMASS AND BIOFUELS BIODIESEL PRODUCTION FROM VEGETABLE OIL GROUP: POPLAR 13 NOVEMBER, 2015 Table of Contents Introduction
PERFORMANCE AND EMISSION CHARACTERISTICS OF DIESEL ENGINE USING RICE BRAN OIL METHYL ESTER BLEND WITH ADITIVE DIETHYL ETHER (DEE)
") International Journal of Science, Engineering and Technology Research (IJSETR), Volume 3, Issue 2, February 214 PERFORMANCE AND EMISSION CHARACTERISTICS OF DIESEL ENGINE USING RICE BRAN OIL METHYL ESTER
International Journal of Science, Engineering and Technology Research (IJSETR), Volume 3, Issue 2, February 214 PERFORMANCE AND EMISSION CHARACTERISTICS OF DIESEL ENGINE USING RICE BRAN OIL METHYL ESTER
Experimental Analysis of Cotton Seed oil Biodiesel in a Compression Ignition Engine
 Volume 6, Issue 3, March 217, ISSN: 2278-7798 Experimental Analysis of Cotton Seed oil Biodiesel in a Compression Ignition Engine Allen Jeffrey.J 1,Kiran Kumar.S 2,Antonynishanthraj.R 3,Arivoli.N 4,Balakrishnan.P
Report No. 35 BUTADIENE. March A private report by the PROCESS ECONOMICS PROGRAM STANFORD RESEARCH INSTITUTE I PARK, CALIFORNIA
 Report No. 35 BUTADIENE by GEORGE E. HADDELAND March 1968 A private report by the PROCESS ECONOMICS PROGRAM STANFORD RESEARCH INSTITUTE I MENLO PARK, CALIFORNIA CONTENTS 1 INTRODUCTION.......................
A Renewable Diesel from Algae: Synthesis and Characterization of Biodiesel in Situ Transesterification of Chloro Phycophyta (Green Algea)
") A Renewable Diesel from Algae: Synthesis and Characterization of Biodiesel in Situ Transesterification of Chloro Phycophyta (Green Algea) using Dodecane as a Solvent V.Naresh 1,S.Phabhakar 2, K.Annamalai
A Renewable Diesel from Algae: Synthesis and Characterization of Biodiesel in Situ Transesterification of Chloro Phycophyta (Green Algea) using Dodecane as a Solvent V.Naresh 1,S.Phabhakar 2, K.Annamalai
Green chemistry in the first year lab: Using biodiesel to teach general chemistry principles. Overview:
 Green chemistry in the first year lab: Using biodiesel to teach general chemistry principles Richard artmann Nazareth ollege hemistry Department verview:! What is green chemistry?! What is Biodiesel?!
Enzymatic Alholysis For Biodiesel Production From Waste Cooking Oil
 Enzymatic Alholysis For Biodiesel Production From Waste Cooking Oil R. Maceiras 1, A. Cancela*,1, M. Vega 2, M.C. Márquez 2 1 Chemical Engineering Department. University of Vigo. Campus Lagoas-Marcosende.
Biodiesel Production from Used Cooking Oil using Calcined Sodium Silicate Catalyst
 Biodiesel Production from Used Cooking Oil using Calcined Sodium Silicate Catalyst M.O. Daramola, D. Nkazi, K. Mtshali School of Chemical and Metallurgical Engineering, Faculty of Engineering and the Built
Biodiesel Solutions André Y. Tremblay, P.Eng., Ph.D. Department of Chemical and Biological Engineering University of Ottawa
 Biodiesel Solutions André Y. Tremblay, P.Eng., Ph.D. Department of Chemical and Biological Engineering University of Ottawa PEO - Ottawa Chapter- Sustainability Seminar January 24 th, 2013 CO2 and Temperature
Study on the compatibility of rubber materials in biodiesel derived from cottonseed oil
 Study on the compatibility of rubber materials in biodiesel derived from cottonseed oil Guang Wu 1, Yongbin Lai 1, a, Li Kong 2, Lei Zhong 2 and Xiu Chen 2 1 School of Mechanical Engineering, Anhui University
Non-Catalytic Production of Ethyl Esters Using Supercritical Ethanol in Continuous Mode
 Chapter 9 Non-Catalytic Production of Ethyl Esters Using Supercritical Ethanol in Continuous Mode Camila da Silva, Ignácio Vieitez, Ivan Jachmanián, Fernanda de Castilhos, Lúcio Cardozo Filho and José
Investigation of Single Cylinder Diesel Engine Using Bio Diesel from Marine Algae
 Investigation of Single Cylinder Diesel Engine Using Bio Diesel from Marine Algae R.Velappan 1, and S.Sivaprakasam 2 1 Assistant Professor, Department of Mechanical Engineering, Annamalai University. Annamalai
OPTIMIZATION OF BIODIESEL PRODCUTION FROM TRANSESTERIFICATION OF WASTE COOKING OILS USING ALKALINE CATALYSTS
 OPTIMIZATION OF BIODIESEL PRODCUTION FROM TRANSESTERIFICATION OF WASTE COOKING OILS USING ALKALINE CATALYSTS M.M. Zamberi 1,2 a, F.N.Ani 1,b and S. N. H. Hassan 2,c 1 Department of Thermodynamics and Fluid
WASTE TO ENERGY. Commercial Enzymatic Production of Biodiesel
 June 2018 Commercial Enzymatic Production of Biodiesel WASTE TO ENERGY UTILIZING TRANSBIODIESEL'S ENZYMATIC GAME-CHANGING TECHNOLOGY TO YOUR PROFIT OUR ENZYMATIC TECHNOLOGY IS SETTING THE BIODIESEL FUEL
SYNERGISTIC EFFECTS OF ALCOHOL- BASED RENEWABLE FUELS: FUEL PROPERTIES AND EMISSIONS
 SYNERGISTIC EFFECTS OF ALCOHOL- BASED RENEWABLE FUELS: FUEL PROPERTIES AND EMISSIONS by EKARONG SUKJIT School of Mechanical Engineering 1 Presentation layout 1. Rationality 2. Research aim 3. Research
Improving the Quality and Production of Biogas from Swine Manure and Jatropha (Jatropha curcas) Seeds
 Seeds") Improving the Quality and Production of Biogas from Swine Manure and Jatropha (Jatropha curcas) Seeds Amy Lizbeth J. Rico Company: Tarlac Agricultural University College of Engineering Technology Address:
Improving the Quality and Production of Biogas from Swine Manure and Jatropha (Jatropha curcas) Seeds Amy Lizbeth J. Rico Company: Tarlac Agricultural University College of Engineering Technology Address:
Biodiesel. As fossil fuels become increasingly expensive to extract and produce, bio-diesel is
 Aaron Paternoster CHEM 380 10D Prof. Laurie Grove January 30, 2015 Biodiesel Introduction As fossil fuels become increasingly expensive to extract and produce, bio-diesel is proving to be an economically
Biodiesel Lifespan Quality Performance
 Biodiesel Lifespan Quality Performance AGQM e.v. Page 1 of 12 Biodiesel Lifespan Quality Performance Monitoring and Assessment Evaluation of Quality Changes in Biodiesel along the Logistics Chain Project
Double- and Relay- Cropping Systems for Oil and Biomass Feedstock Production in the North Central Region
 North Central Regional SunGrant Center Annual Meeting, Indianapolis, IN Double- and Relay- Cropping Systems for Oil and Biomass Feedstock Production in the North Central Region Marisol Berti 1, B.L. Johnson
Performance Test of IC Engine Using Blends of Ethanol and Kerosene with Diesel
 Performance Test of IC Engine Using Blends of Ethanol and Kerosene with Diesel Er. Milind S Patil 1, Dr. R. S. Jahagirdar 2, Er. Eknath R Deore 3, 1. Sr. Lecturer in Mechanical Engineering 2. Principal
Power Performance and Exhaust Gas Analyses of Palm Oil and Used Cooking Oil Methyl Ester as Fuel for Diesel Engine
 ICCBT28 Power Performance and Exhaust Gas Analyses of Palm Oil and Used Cooking Oil Methyl Ester as Fuel for Diesel Engine R. Adnan *, Universiti Tenaga Nasional, MALAYSIA I. M. Azree, Universiti Tenaga
NEDO Biodiesel Production Process by Supercritical Methanol Technologies. Shiro Saka
 November 22, 2006 (9:30-9:45) The 2nd Joint International Conference on Sustainable Energy and Development (SEE2006) Bangkok, Thailand NEDO Biodiesel Production Process by Supercritical Methanol Technologies
KINETIC MODEL OF ALGAL BIODIESEL PRODUCTION UNDER SUPERCRITICAL METHANOLYSIS
 KINETIC MODEL OF ALGAL BIODIESEL PRODUCTION UNDER SUPERCRITICAL METHANOLYSIS Ashraf Amin, S. A. AboEl-Enin, G. El Diwani and S. Hawash Department of Chemical Engineering and Pilot Plant, National Research
Kinetic Processes Simulation for Production of the Biodiesel with Using as Enzyme
 Kinetic Processes Simulation for Production of the Biodiesel with Using as Enzyme H.T.Hamd Abstract The esters components were produced by transesterification of the plant oil or for animal fat with methanol
Experimental Study of Linseed Oil as an Alternative Fuel for Diesel Engine
 Experimental Study of as an Alternative Fuel for Engine Ashutosh Kumar Rai a, Bhupendra Singh Chauhan a, Amrita Pandey b, Haeng Muk Cho * a Department of Mechanical Engineering, Delhi Technological University,
Saddam H. Al-lwayzy. Supervisors: Dr. Talal Yusaf Dr. Paul Baker Dr. Troy Jensen 3/24/2013 1
 Saddam H. Al-lwayzy Supervisors: Dr. Talal Yusaf Dr. Paul Baker Dr. Troy Jensen 3/24/2013 1 1. Introduction 2. Literature review 3. Research aim 4. Methodology 5. Some results 3/24/2013 2 Introduction
Biofuels and characteristics
 Lecture-16 Biofuels and characteristics Biofuels and Ethanol Biofuels are transportation fuels like ethanol and biodiesel that are made from biomass materials. These fuels are usually blended with petroleum
Piedmont Biofuels R&A
 Piedmont Biofuels R&A Novel Biodiesel Processing Technologies Hydrodynamic Cavitation and Enzyme Catalyzed Biodiesel Production - descriptions and small-scale applications Greg Austic Research and Analytics
What is Biodiesel? Biodiesel consists of alkyl-esters derived from a biological source
 Biodiesel What is Biodiesel? Biodiesel consists of alkyl-esters derived from a biological source Biodiesel can be used as a fuel in compression ignition engines (i.e. diesels) Can be blended with petroleum
PRODUCTION OF BIODIESEL USING THE ONE STEP ALKALI-CATALYZED METHOD
 PRODUCTION OF BIODIESEL USING THE ONE STEP ALKALI-CATALYZED METHOD SINTEI EBITEI AND TRUST PROSPER GBORIENEMI Department of Chemical Engineering, Federal Polytechnic, Ekowe Bayelsa State, Nigeria. ABSTRACT
Rubber Seed Oil as an Alternative Fuel for CI Engine: Review
 Rubber Seed Oil as an Alternative Fuel for CI Engine: Review Jayshri S. Patil 1, Shanofar A. Bagwan 2, Praveen A. Harari 3, Arun Pattanashetti 4 1 Assistant Professor, Department of Automobile Engineering,
Lipase-Catalyzed Biodiesel Production with Methyl Acetate as Acyl Acceptor
 Lipase-Catalyzed Biodiesel Production with Methyl Acetate as Acyl Acceptor Ying Huang and Yunjun Yan* School of Life Science & Technology, Huazhong University of Science & Technology, Wuhan 430074, P.
Optimization of the Temperature and Reaction Duration of One Step Transesterification
 Optimization of the Temperature and Reaction Duration of One Step Transesterification Ding.Z 1 and Das.P 2 Department of Environmental Science and Engineering, School of Engineering, National university
Hydrothermal treatment of bio-oil for the production of biodiesel antioxidants
 Engineering Conferences International ECI Digital Archives 5th International Congress on Green Process Engineering (GPE 2016) Proceedings 6-20-2016 Hydrothermal treatment of bio-oil for the production
Flexible Modular Process Design for Enzymatic Biodiesel Production
 Flexible Modular Process Design for Enzymatic Biodiesel Production Catarina Sanches Seita Instituto Superior Técnico, Lisbon, Portugal June 2013 Abstract: Nowadays feedstock cost constitutes one of the
What s s in your Tank?
 What s s in your Tank? Biodiesel Could Be The Answer! Matthew Brown Lakewood High School Tom Hersh Golden West Community College Overview What is biodiesel? Chemistry of biodiesel Safety Making Biodiesel
8/3/2012 SIF: Energy School 2012,Varenna. Omar Said
 Omar Said Introduction to myself Name: Omar Said (I am in Petroleum and Petrochemicals Engineering senior student Cairo University). Experience : Schlumberger oil service company trainee (wire line segment).
Automotive Technology
 International Conference on Automotive Technology An Experimental Study on the Performance and Emission Characteristics of a Single Cylinder Diesel Engine Using CME- Diesel Blends. Hari Vasudevan a*,sandip
Study of Transesterification Reaction Using Batch Reactor
 Study of Transesterification Reaction Using Batch Reactor 1 Mehul M. Marvania, 2 Prof. Milap G. Nayak 1 PG. Student, 2 Assistant professor Chemical engineering department Vishwakarma Government engineering
Keywords: Simarouba Glauca, Heterogeneous base catalyst, Ultrasonic Processor, Phytochemicals.
 PRODUCTION OF FATTY ACID METHYL ESTERS FROM SIMAROUBA OIL VIA ULTRASONIC IRRADIATION PROCESS, EFFECTIVE UTILIZATION OF BYPRODUCTS. TESTING AND EXTRACTION OF PHYTOCHEMICALS FROM SIMAROUBA OIL AND CAKE COLLEGE
Confirmation of paper submission
 Dr. Marina Braun-Unkhoff Institute of Combustion Technology DLR - German Aerospace Centre Pfaffenwaldring 30-40 70569 Stuttgart 28. Mai 14 Confirmation of paper submission Name: Email: Co-author: 2nd co-author:
Biodiesel from soybean oil in supercritical methanol with co-solvent
 Available online at www.sciencedirect.com Energy Conversion and Management 49 (28) 98 912 www.elsevier.com/locate/enconman Biodiesel from soybean oil in supercritical methanol with co-solvent Jian-Zhong
GRADUATE AND POSTDOCTORAL STUDIES FINAL ORAL EXAMINATION
 GRADUATE AND POSTDOCTORAL STUDIES MCGILL UNIVERSITY FINAL ORAL EXAMINATION FOR THE DEGREE OF DOCTOR OF PHILOSOPHY OF PETER ADEWALE DEPARTMENT OF BIORESOURCE ENGINEERING INFLUENCE OF ULTRASONIC MIXING ON
International Journal of Advance Engineering and Research Development PRODUCTION OF AN ALTERNATIVE FUEL FROM A LOW COST FEEDSTOCK- AN ECONOMICAL VIEW
 Scientific Journal of Impact Factor (SJIF): 5.71 e-issn (O): 2348-4470 p-issn (P): 2348-6406 International Journal of Advance Engineering and Research Development International Conference on Momentous
Article: The Formation & Testing of Sludge in Bunker Fuels By Dr Sunil Kumar Laboratory Manager VPS Fujairah 15th January 2018
 Article: The Formation & Testing of Sludge in Bunker Fuels By Dr Sunil Kumar Laboratory Manager VPS Fujairah 15th January 2018 Introduction Sludge formation in bunker fuel is the source of major operational
CHAPTER II CURRENT STATUS OF BIODIESEL PRODUCTION PROCESS
 5 CHAPTER II CURRENT STATUS OF BIODIESEL PRODUCTION PROCESS Introduction As energy demands increase and fossil fuel reserves are limited, many research efforts are directed towards alternative renewable
RESEARCH PROJECT REPORT. Trash to Treasure. Clean Diesel Technologies for Air Pollution Reduction. Submitted to. The RET Site. For
 RESEARCH PROJECT REPORT Trash to Treasure Clean Diesel Technologies for Air Pollution Reduction Submitted to The RET Site For Civil Infrastructure Renewal and Rehabilitation Sponsored by The National Science
CHAPTER 2 LITERATURE REVIEW AND SCOPE OF THE PRESENT STUDY
 57 CHAPTER 2 LITERATURE REVIEW AND SCOPE OF THE PRESENT STUDY 2.1 LITERATURE REVIEW Biodiesel have been processed from various plant derived oil sources including both Edible and Non-Edible oils. But,
Biodiesel Production and Analysis
 Biodiesel Production and Analysis Introduction A key current focus in science and engineering is the development of technologies for generating and utilizing new sources of energy. Climate change, geopolitics,
Enzymatic transesterification of Hungarian rapeseed and
 Proceedings of European Congress of Chemical Engineering (ECCE-6) Copenhagen, 16-20 September 2007 Enzymatic transesterification of Hungarian rapeseed and sunflower oils Márton Krár, a Sándor Kovács, a