INCENTIVES FOR CLEANER VEHICLES AND FUEL ECONOMY FOR THE VEHICLE FLEET OF CHILE
|
|
|
- Marion Bailey
- 6 years ago
- Views:
Transcription

1 INCENTIVES FOR CLEANER VEHICLES AND FUEL ECONOMY FOR THE VEHICLE FLEET OF CHILE Prepared by Centro Mario Molina Chile Sponsored by GLOBAL FUEL ECONOMY INITIATIVE Action Plan Chile Pilot Project December,
2 2011, Centro Mario Molina Chile All rights reserved Neither partial nor total reproduction is permitted without indicating the source. The views expressed in this document are not necessarily the opinion of all partners of the Global Fuel Economy Initiative. Authors Gianni López, Centro Mario Molina Chile Marcela Castillo, Centro Mario Molina Chile Javier Valdivia, Sapag y Gonzalez Abogados Acknowledgements We thank all the support from the International Council on Clean Transportation during the preparation of this proposal, in particular that of Mr. John German and Mr. Anup Banvibadekar. We also thank the United Nations Environment Programme, in particular that of Mrs. Veronica Ruiz- Stannah. We thank the Ministry of Transport and Telecommunications, through Mr. Roberto Santana and Mr. Alfonso Cádiz, along with the Ministry of Environment, through Mr. Marcelo Fernández. We would also like to thank the professional team from Centro Mario Molina Chile, in particular that of Ms. Fernanda Aguilera. Finally, we thank Professor Mario Molina, Mr. Pedro Oyola and Mr. Jorge Cáceres, members of the Centro Mario Molina Chile Directory. 2
3 Contents 1. Executive Summary Global Fuel Economy Initiative Chilean automotive market diagnosis Incentive proposal Impact evaluation of the incentive system Recommendation for legal implementation Annex 1 Sales Matrix
4 Figures Figure 1. Average NOx emissions EURO models Figure 2. Average PM emissions EURO models Figure 3. Average emission compared to different automotive markets Figure 4. CO 2 emissions projection from national vehicular fleet Figure 5. Average performance compared to different automotive markets Figure 6. correction Figure sales distribution according to proposed categories Figure 8. National energetic efficiency labeling Figure 9. adjustment by CO 2 emissions for a model with footprint equal to the market s average [Chilean $] Figure 10. General representation of used evaluation methodology Figure 11. Emission comparison in the national market and CO 2 European standard, the size of the bubbles represents annual sales Figure 12. Incentives system effect in total sales Figure 13. Fiscal neutrality evaluation of the system (values in US$/year) Figure 14. Segments with incentives Figure 15. Segments with disincentives Figure 16. Estimated CO 2 average emission improvement in the national automotive market Figure 17. CO 2 emission estimation from the automotive park with incentives Figure 18. System s operation
5 Tables Table 1. Incentives and Disincentives, EURO Standard Table 2. Incentives and Disincentives, EPA Standard Table 3. CO 2 emissions reduction rate from 2010 expected by segment Table 4. adjustments by segment in 2010 scenario Table 5. adjustments by segment in 2014 scenario Table 6. Fulfillment of principles and limits from different benefits options and taxes Table 7. Previous experiences
6 Executive Summary This proposal is part of the Chilean Pilot Project of the Global Fuel Economy Initiative (GFEI), promoted by the United Nations Environment Programme, along with the International Energy Agency, the International Transport Forum and the FIA Foundation. It has been prepared by Centro Mario Molina Chile with the support of the International Council on Clean Transportation (ICCT), the Chilean Undersecretary of Transport and the Ministry of Environment. According to indicators developed as part of the Pilot Project of the Global Fuel Economy Initiative (GFEI) for Chile, Nitrogen dioxide and average Particulate Matter emissions, average CO 2 emissions and average fuel consumption for vehicles sold in Chile have not decreased since Currently in Chile, there exists a wide range of emissions and vehicle standards (EUROIII, EUROIV, EUROV, EPA94 and EPA2007 Tier2); some are applied in the Santiago Metropolitan Region and others in the rest of the country. There are also differences depending on whether the vehicles are diesel or gasoline. In this standard diversity, larger vehicles have lower requirements and additionally have a discount incentive on VAT taxes when bought through companies. The clear consequence of this is that SUV and light duty truck sales have increased by 244% 1 in the last six years, compared to merely 42% in the case of sedan and hatchback vehicles, reaching beyond the 30% of total sales in the country. It is important to note that the average Nitrogen oxide emission from new diesel SUV and light duty trucks is 30 times higher than the average emission from new gasoline sedans and hatchbacks. These larger vehicles have less performance and higher CO 2 emissions, which will deeply impact the future oil demand, increasing the energy dependence of Chile.. In order to make this vehicular fleet growth more sustainable, Centro Mario Molina Chile, responsible for the execution of the case study from GFEI for Chile, has proposed two complementary options: To immediately update emission standards to EURO V at a national level; To incorporate the best international experience on incentive policies for low emissions vehicles and fuel economy. Regarding the second point, it is proposed that the purchase of low emissions vehicles be a source of credit at the moment of declaring taxes and that purchase of high emission vehicles has a specific tax as a pollutant vehicle. The amount of the credit or tax, whichever is applicable, will be determined by the government authority in relation to the emission standard that the model to which vehicle corresponds complies and to the CO 2 emission level, all of this according to the efficiency label defined by the authority in December, This system has the advantage of being fiscally neutral and it produces a change towards cleaner vehicles in all segments of the vehicle fleet, as has been the case, for example, in France with the bonus/malus system, and in Denmark. This instrument is more efficient than the incentives for specific technologies, which have 1 Environmental Tracking study from Chilean Automotive Market, Centro Mario Molina Chile, Ministry of Transport and Telecommunications, ICCT
7 only demonstrated being effective in supporting the development of a new technology, such as hybrid vehicles, but that have had a marginal impact on the vehicle fleet. It is estimated that the incentive and disincentive system will imply a 5% reduction o CO 2 emissions from the total national vehicle fleet in 2014, obtaining a total CO 2 reduction of 2.15 million tons during the next 5 years. 7
8 Global Fuel Economy Initiative The Global Fuel Economy Initiative, launched in March 2009, has as an objective to create awareness about the potential fuel saving and the cost of the vehicles manufactured and sold worldwide. It also offers direction and support in the development of strategies to foment the introduction of low consume vehicles. Its activities include: Development of improved data and analysis on fuel economy around the world, monitoring trends and progress over time and assessing the potential for improvement. Work with governments to develop policies to encourage fuel economy improvement for vehicles produced or sold in their countries, and to improve the consistency and alignment in policies across regions in order to lower cost and maximize the benefits of improving vehicle fuel economy. Work with stakeholders including auto makers to better understand the potential for fuel economy improvement and to solicit their input and support in working toward improved fuel economy. Support regional awareness initiatives to provide consumers and decision makers with the information they need to make informed choices. This will include periodic reports by the initiative and support for the development of vehicle testing and consumer information systems in regions where these are not yet available The average fuel economy (L/100 km) of new cars in OECD countries could be improved 30% by 2020 and 50% by 2030 at low or negative cost taking into account fuel savings. Improvements of the same order of magnitude appear possible in non-oecd countries where car fleets are growing fastest. Improving the efficiency of new cars at this rate would make possible at least a 50% improvement in the average fuel economy of all cars on the road worldwide by 2050 thus, the 50:50 initiative. Even if vehicle kilometers driven double by 2050, efficiency improvements on this scale worldwide would effectively cap emissions of CO2 from cars at current levels. It is estimated that CO2 savings would exceed 1 Gt CO2 annually by 2025 and 2 Gt CO2 annually by Additional vehicular pollutants that also impact on the environment and contribute to climate change, including black carbon, would also be significantly reduced. 8
9 Chilean automotive market diagnosis The Chilean domestic vehicle fleet has shown an average growth rate of 13% between 2005 and 2010; except for 2008, where there was a stagnation as a consequence of the international financial crisis where sales decreased by 8%. The segment of larger vehicles, such as light duty trucks and SUV 2, has increased significantly, growing 242% in the period, accounting for almost a third of automobile sales, which affects a larger size and average displacement market. This is a phenomenon previously observed in other economies; for example, in the United States, in the late 90 s there was an increase in local and global pollution emissions and a deterioration in energy efficiency, with these low performance vehicles. The national legal framework also has an effect on this phenomenon, distortions such as tax rebate for the purchase of light duty trucks and four wheel drive vehicles. In Chile, the vehicles approved under EURO emission standards have displaced those certified under EPA standards. Diesel technology vehicles have progressively gained a larger market share, reaching 21% of total sales in This has produced two effects: a reduction in average CO 2 emissions and a substantial increase in Nitrogen oxide emissions. The average NOx emissions from all petrol EURO light duty vehicles sold in 2010 was grams per kilometer, while diesel EURO light duty vehicles corresponds to 0.18 grams per kilometer, that is eight times higher. In the case of commercial vehicles 3 emissions were 22 times higher, as shown in Figure 1. Average emissions from the sales have remained relatively stable. The commercial diesel vehicles segment shows an important increase in its emissions in 2007 and 2008, possibly due to an extension in the supply of light duty trucks and SUV EURO III vehicles, since this standard is still accepted in the country, although it is over 10 years old. 2 Sport Utility Vehicle; corresponds to a vehicle category produced from a commercial vehicle chassis, adapted as Station Wagon or similar for family use, often equipped with four wheel drive. Corresponding to its commercial category, environmental requirements are less than for regular vehicle, so its high growth has been a problem that has had to be faced at an international level through optimization of pollutants emission standards. 3 For the purpose of this study, commercial vehicles correspond to Euro categories N1 II/III and N2. For EPA vehicles, commercial correspond to LDV commercial type 2 and MDV. 9
10 Figure 1. Average NOx emissions EURO models In the case of particulate matter, there has been no improvement in the national vehicle fleet s average emissions, except for 2007 when the EURO IV standard took effect in the Metropolitan Region for light duty diesel vehicles. Figure 2. Average PM Emissions EURO models The domestic fleet shows average CO 2 emissions similar to the ones observed in South Korea, and close to the ones from Australia and USA. In order to understand this phenomenon, it is necessary to consider that the domestic fleet composition is very particular, because it has important sales in the segment of light duty trucks and SUV s, typical of the U.S., with plenty of sales in the segment of city cars (class A vehicles), nonexistent in the U.S. It is necessary to consider that the countries mentioned above, unlike Chile, have existing fuel economy standards, so the emissions difference is narrow. 10
11 Figure 3. Average emission are compared in different vehicle markets. With respect to the EU and Japan vehicle markets, Chile shows a significant lag, with 30% higher emissions. The reasons are that these countries show a smaller share of pick-up and SUV s purchases, and have existing or planned strong performance and CO 2 emissions regulations. The high average emissions of vehicles sold in the country will mean a significant increase of greenhouse gas emissions, as the vehicle fleet continues to grow in this decade. Figure 4 presents an estimate of the total emissions of the national light and medium vehicles fleet, in an identical scenario to the one observed in 2010, considering the fleet growth according to BBVA 4 s projections until 2012 and then based on projected growth rate over the past 5 years. An increase of more than double in 10 years will mean a significant increase of greenhouse gases in the country, because transport is responsible for one third of these emissions 4 Automotive situation in Chile, BBVA Research, December,

12 Figure 4. CO 2 emissions projection from Chilean national vehicular fleet. Related to the growing international concern about the problem of climate change, is the need to reduce dependence on fossil fuels, area in which Chile is extremely sensitive. This was demonstrated during the last crisis in 2008, where the State had to supplement 1 billion US dollars from the Oil s Stabilization Fund, along with a significant loss of revenue resulting from the temporary reduction in the gasoline tax. It can be observed in an international comparison that the average performance of the national automotive market is low, corresponding to the year 2010 to 31.2 mpg, which has important implications for future oil demand. Figure 5. Average performance compared to different automotive markets 12

13 Incentive proposal This proposes the establishment of a system of incentives for low emission and fuel efficient vehicles to promote a vehicle fleet transformation towards more efficient vehicles and that present less local and global pollutant emissions. This will advance compliance with air quality standards, especially in the case of PM2.5, along with reducing Chile s energy dependence and its CO 2 emissions. To meet these objectives, the scheme provides correction of the vehicle market based on compliant emission regulations and also on its level of CO 2 emissions (Figure6). CO 2 is considered because for conventional technology vehicles, this greenhouse gas emission is directly related to fuels consumption. Figure 6. correction. This system is proposed after a completed review of other developed countries experiences in the promotion of cleaner, more efficient vehicles. These efforts relate to the interest of these countries to increase their energy security and mitigate climate change. For this research the following publication has been extremely useful: A Review and Comparative Analysis of Fiscal Policies Associated with New Passenger Vehicle CO 2 Emissions-2011 from the International Council on Clean Transportation, as well as other publications provided by the institution. The main recommendations extracted from the aforementioned study are the following: Regulation should be directly linked to vehicle emissions. Regulation should apply to the entire vehicle fleet, not only to some segments. 13
14 The regulation must establish the amount of incentives/disincentives which vary continuously across the spectrum of emissions, and there must be no emission ranges affected by the same amount, for example, avoiding regulations in steps. Bigger emissions reductions are obtained if incentives/disincentives are complemented at the moment of purchase with a similar regulation that applies during the vehicle s lifetime, for example, through annual registration certificates. Incentives for specific technologies, such as hybrid vehicles, must be related to emissions. Cars correction according to their pollution contribution To this end, we propose six vehicle categories according to Nitrogen (NOx) emission limits, presented in Table 1 and 2, for EURO and EPA regulations respectively. In the case of EURO, in these six categories specific standards are classified for different types of vehicles, namely: light vehicles, called M1 and its commercial derivates (N1 class I), bigger size light duty vehicles, such as M1 class II and III and medium N2, according to the type of fuel used. It has been considered that vehicles corresponding to approved models for EURO standards, with NOx emission limits lower than gasoline EURO IV M1 type vehicle, should receive an incentive. This corresponds to categories 5 and 6. It is proposed that the amount of the incentive corresponds to the average cost - estimated by the European Commission for the Environment - of the required technology to go from EURO IV to EURO V 5. The incentive is progressive as the emissions are reduced. The category that receives the highest incentive is the one that considers vehicles without exhaust emissions. For vehicles belonging to approved models for EURO standards with NOx emissions limit higher than gasoline M1 type vehicles, it is proposed that they receive a disincentive. This disincentive has been defined as an equivalent to the average cost of the required technology to go from EURO IV to EURO V, and progressive as it meets higher emissions levels. In Figure 7 are shown 2010 sales classified according to the six proposed categories. It can be seen that most vehicles sold belong to category 3, due to use of the EURO III standard at national level, with exception of M1 diesel vehicles, which in the Metropolitan Region had to comply with EURO IV. 5 EURO5 technologies and costs, for light duty vehicles, TNO/EuropeanComission,
15 Figure sales distribution according to proposed categories. Table 1. Incentives and Disincentives, EURO Standard. NOx Category Type Standard Incentive US$ Disincentive US$ Zero emission M1 Gasoline EURO V / VI Ml Diesel EURO VI N1 Diesel Class I EURO VI 0.02 < NOx < N1 Gasoline Class I EURO V / VI N1 Gasoline Class II EURO V / VI N1 Gasoline Class III EURO V / VI N2 Gasoline EURO V / VI M1 Gasoline EURO IV M1 Diesel EURO V N1 Gasoline Class I EURO IV N1 Gasoline Class II EURO IV 0.1 < NOx < N1 Gasoline Class III EURO IV N1 Diesel Class I EURO V N1 Diesel Class II EURO VI N1 Diesel Class III EURO VI N2 Gasoline EURO IV N2 Diesel EURO VI 0 0 M1 Gasoline EURO III M1 Diesel EURO IV 15
16 N1 Gasoline Class I EURO III 0.2 < NOx < 0.3 B N1 Gasoline Class II EURO III N1 Diesel Class I EURO IV N1 Diesel Class II EURO V N1 Diesel Class III EURO V N2 Diesel EURO V M1 Diesel EURO III N1 Gasoline Class III EURO III 0.3 < NOx < N1 Diesel Class I EURO III N1 Diesel Class II EURO IV N1 Diesel Class III EURO IV < NOx < N1 Diesel Class II EURO III N1 Diesel Class III EURO III
17 Since 2005 the domestic fleet has begun to be dominated approved vehicle models under EURO standard, moving progressively to those certified under the EPA standard, which until 2010 represented only 32% of sales. For this segment the categories shown in Table 2 are proposed. Similar to the EURO standards, there are 6 identified EPA categories based on the levels of NOx emissions. It is suggested that vehicles to receive an incentive are those that are approved models for EPA standards with NOx emission limits equal to or lower than Tier 2 Bin5. In order to simplify the operation of this system, this amount is the same as the one defined for EURO categories, and progressive as it meets more stringent emission limits. In the case of EPA standard, Tier2 Bin1 and Bin2 type models belong to vehicles with zero or close to zero local pollutant emissions. For this reason, it is proposed that approved models under these standards receive the highest incentive. Vehicles belonging to approved models for EPA standards with NOx emission limits higher than Tier2 Bin8 are proposed to receive a disincentive. This disincentive has been defined as the equivalent to the average cost of the technology to go from EURO IV to EURO V, and progressive as the emission levels increase. Table 2. Incentives and Disincentives, EPA Standard NOx Category Type NOx <NOx <NOx <NOx <NOx <NOx Tier 2 Bin 1 Tier 2 Bin 2 Tier 2 Bin 3 Tier 2 Bin 4 Tier 2 Bin 5 Tier 2 Bin 6 Tier 2 Bin 7 Tier 2 Bin 8 Tier 2 Bin 9 Tier 2 Bin 10 Tier 2 Bin 11 Tier 1 Passenger cars Tier 1 LLDT <3750 lbs Incentive US$ Disincentive US$ lbs Tier 1 LLDT Tier 1 HLDT 5750 lbs lbs <Tier 1 HLDT
18 An important aspect related to the implementation of this proposal, is related to correcting the actual imperfection in emission standards applied to the vehicle fleet, which restricts the approval only to the valid standard at national level or in the Metropolitan Region, regardless of whether a particular model is capable of complying with the higher standards at the international level. This problem is manifested, for example, for a European gasoline vehicle, which in its country of origin is certified EURO V (current standard in Europe since 2009) but in Chile can only be approved as EURO IV. The way to resolve this imperfection is to dictate EURO V and EURO VI standards with voluntary compliance until the authority enact them as mandatory. In the same way it is necessary to proceed with the enactment of EPA standards Tier2 Bin 1, 2, 3 y 4. Another important aspect is the need to remove the categories corresponding to emission standards that over the years have been abolished. adjustment by Fuel Economy/CO 2 emission In vehicles with internal combustion engines, the fuel economy is directly related to CO 2 emissions. For this reason, it is proposed a market adjustment in relation to the grammes of CO 2 emission of the corresponding vehicle model, from the emissions reported according to the fuel economy labeling system agreed in December, 2010 between the Ministry of Environment, Energy, and Transports & Telecommunications, presented in Figure 8. This label presents information on CO2 emissions determined using the driving cycle NEDC 6. In the present proposal it is assumed that CO 2 assignation problems under NEDC cycle for approved vehicle models in the country under EPA standards will be resolved as part of the implementation of the fuel economy labeling system starting from July, For the impact assessment presented in the next chapter, NEDC s CO 2 emissions have been used. In the case of approved vehicle models under EPA standards, CO 2 emissions are expressed under the same driving cycle, the methodology used was from Seguimiento Ambiental del Mercado Automotriz Chileno ( Environmental Monitoring of the Chilean Automotive Market ) elaborated by Centro Mario Molina Chile. 6 NEDC:New European Driving Cycle. 18

19 Figure 8. National Fuel Economy Label The CO 2 adjustment has been defined from the adaptation mechanism of bonuses and penalties allocation used in France since January, 2008 (system Bonus/Malus). A constant CO 2 has been adopted instead of step function, according to ICCT s fiscal policies recommendations. Since the value of the bonus is directly related to savings in fuels, because CO2 is a direct measure of the amount of fuel used in internal combustion vehicles, the French model has been adapted using the relation of gasoline litre s in France and Chile (Metropolitan Region) observed in Along with fuel s, it has also considered the relation between the Euro and the Chilean Peso. 19
20 CO 2 emissions with a adjustment equal to zero, is called the pivot point. For vehicle models with lower emissions to the pivot point receive an incentive and those with high emissions to the pivot point receive disincentives, always in proportion to the emission. The pivot point was defined from the ratio between the pivot system used in the Bonus/Malus system in France (138.6 grams of CO 2 /km) and the average CO 2 emission observed in the French market before the implementation of this system (149 grams of CO 2 /km). The average observed in 2010 in the Chilean light duty vehicles fleet (185 grams of CO 2 /km) was multiplied for this reason, obtaining a pivot of 171 grams of CO 2 /km. Subsequently, the pivot point was adjusted to 175 grams to ensure fiscal neutrality of the system. It is necessary to consider the large diversity of the domestic vehicle fleet, in which different vehicle models coexist, such as city cars with SUV s and large pick-ups. Some smaller models can have relatively high emissions in comparison to their segment, as well as other larger vehicles can have lower emissions than, for example, SUV s. This can be the case for vehicle models that incorporate hybrid engines, weight reduction or some other technology to make them more efficient. According to international experience, it is possible to consider this factor by using the footprint, which corresponds to a size description of the vehicle model. The footprint corresponds to the multiplying the distance between the axes by distance between the centerline of the tires. Based on the above the following market adjustment equation is obtained as a function of CO 2 emissions: Market adjustment for a vehicle belonging = to a certain model (Chilean $) The factor was obtained from a linear regression of step function of French Bonus/Malus system, adjusting the coefficient by the ratio between French and Chilean gasoline for the year For an average size model in the fleet, this equation corresponds to the line presented in Figure 9. According to this figure, vehicles of this size with emissions lower than 175 grams of CO2 per kilometer will receive an incentive up to a maximum of $ 1,848,000, in the case of a vehicle with zero CO 2 emission at its tailpipe. In the opposite case, vehicles will receive a gradual disincentive, which can reach a total of $4,208,000 this corresponds to the model with the highest emissions sold in 2008 (557 grams of CO 2 /km). 20
21 Figure 9. adjustment for CO 2 emissions for a model with footprint equal to the average in the vehicle fleet [Chilean $] Final adjustment A vehicle corresponding to a given model will receive a correction of its market based on the sum of correction due to pollution contribution and for fuel economy/co 2. These adjustments are determined by the emissions standards which have been approved for the corresponding model to CO 2 emissions and to relevant vehicle size. An important aspect in the operation of the system is to promote a vehicle fleet transformation to more efficient and with less polluting vehicles, without imposing a cost on society. From this perspective, tax neutrality is an important objective for the system, so there should be a balance between amounts collected from disincentives and the amounts given as incentives. The gradual improvement of the proposal with more efficient and with less polluting vehicle models must be accompanied by an adjustment of the categories requiring incentives from the point of view of its contribution to pollution, and a displacement of CO 2 pivot point to the left, according to Figure 9. This is in order to keep the system neutral from a taxation point, and to provide a dynamic that seeks to improve supply in the long run. As shown below, this proposed tax incentive is fiscally neutral within 5 years of implementation, resulting in a higher collection in the first years, which is reduced with the gradual improvement of vehicle technology, to the same extent that disbursements are increasing incentives. 21

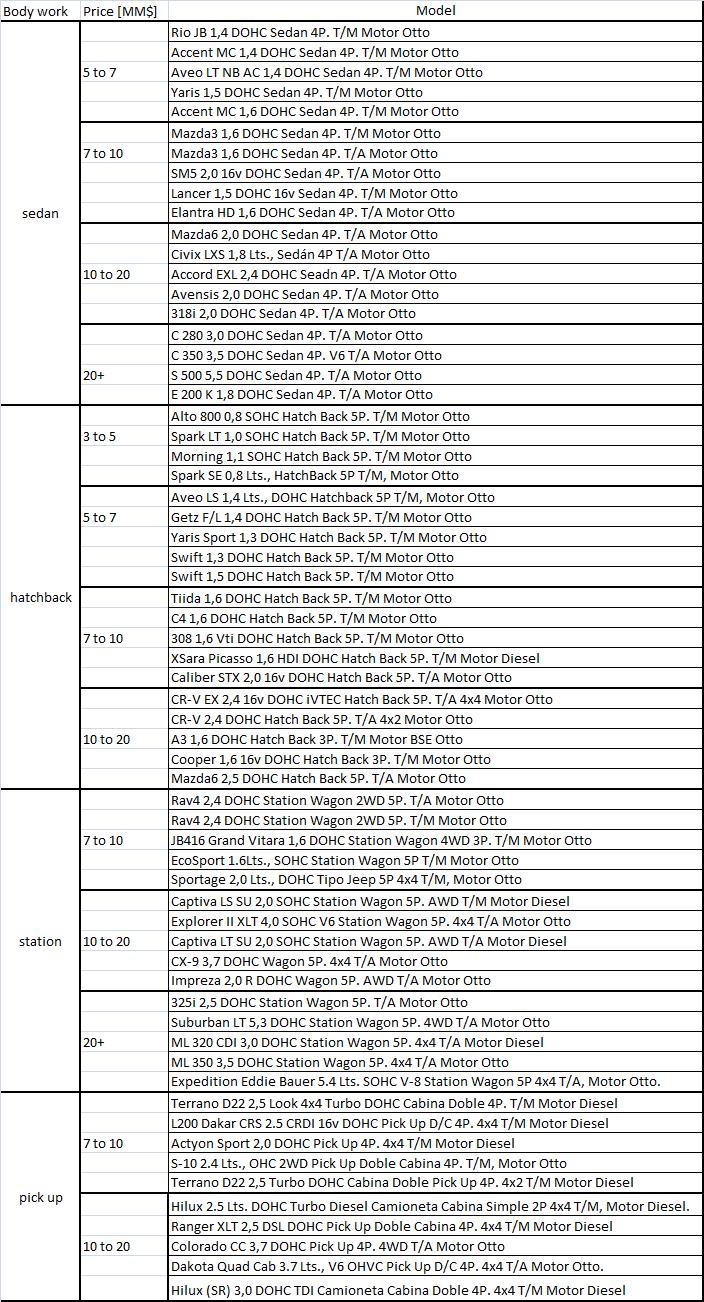
22 Impact evaluation of the incentive system Here follows an assessment of the impacts of the proposal on the promotion of cleaner vehicles in reducing CO2 emissions, together with an assessment of the balance of the system, in a scenario of five years. Methodology Figure 10 shows the general methodology used for the evaluation and adjustment of the system in its first 5 years of implementation. Figure 10. General representation of the evaluation methodology. Due to the complexity of the vehicle fleet, which by 2010 has 885 models the impact evaluation was analyzed using a database with information from a sample of vehicle models and sales, developed from the information provided to the Under Secretary of Transport by car dealerships. The market segments were defined based on the most common body types (hatchback, sedan, station and pickup) subdivided into segments by the National Vehicle Association of Chile (Asociación Nacional Automotriz de Chile (ANAC)). With this background, the Sales Matrix was populated, as shown in Annex 1. The matrix is composed of 63 models which represent 36% of total cars sold in The s were obtained by direct communication and through the national dealership web sites, as well as historical valuations of new vehicles, according to information published by the Internal Tax Authority (Servicio de Impuestos Internos). 22

23 For the first year it was considered that the incentive system will affect the range of models supplied in the market in For this scenario it is assumed that the supply of models remains the same, but that the models eligible for re -certification under stricter standards have done so. For subsequent years an improvement in the supply of a range of vehicle models, is estimated, in terms of CO2 emissions from the relationship between market segments and the emission standard for this pollutant as it begins to take effect in 2012 in Europe, and CO 2 trends observed in the French fleet in the period 2006 to Figure 11 shows the average emission of CO 2 and the average weight of on road vehicles by segment of the vehicle fleet. Fleet segments are presented for each body style, as those indicated in Annex 1, assigning similar categories as those used in Europe. Figure 11. Comparison of the Emissions in the domestic fleet and the CO 2 standards of Europe, the size of the bubbles represent annual sales 23
24 Figure 11 shows which fleet segments have higher emissions than those required by the European standard, and this distance is greater the heavier the vehicle weight. The exception is the segment of sedans and hatchback classes D and luxury because the corresponding models are mostly products equivalent to those currently marketed in Europe. It is expected that under an incentives system for more efficient vehicles with lower emissions the supply will improve faster in those segments furthest away from the European standard, because there is a growing alternative of vehicles that can meet these requirements and that can be imported into the domestic market. In the case of the segments and equivalent models to the European, the rates of emission reductions will be lower. Under this approach, and considering the emissions reduction rates observed for each vehicle segment in France 7 in the period 2006 to 2009, it is estimated that emission reduction rates in the domestic fleet under a system of incentives will be the ones presented in Table 3. 7 The French bonus/malus system: Objectives and achievements, Francoise Cuenot,IEA,

25 Table 3. CO 2 emissions reduction rate from 2010 expected by segment With the information from the sample of models and estimation of their improvement in the coming years, adjustments were determined for each model included in the sample, according to their pollution contribution using categories presented in Tables 1 and 2, and to their CO 2 emission using equation presented in Page 23. From this, the average adjustment per segment was obtained. In Table 4 and Table 5 adjustments are presented for each market segment and their relationship with average of a vehicle of the segment for the years 2010 and adjustments and percentages with a negative symbol correspond to incentives; those with a positive symbol correspond to disincentives. 25
26 Vehicle [MM Chilean $] 3 a 5 5 a 7 7 a a Table 4. adjustments by segment in 2010 scenario [Chilean $] $ 24,949 1% $ 53,113 1% $ 26,582 0% $ 16,534 0% -$ 169,153-2% $ 403,217 5% $ 756,518 7% -$ 201,171-2% -$ 198,590-2% $ 863,412 7% $ 917,608 8% Sedán Hatchback Station W Ligth Duty Trucks $ 46,976 0% $ 1,154,876 5% Table 5. adjustments by segment in 2014 scenario [Chilean $] Vehicle [MM Chilean $] 3 a 5 5 a 7 7 a a Sedán hatchback station Ligth Duty Trucks -$ 134,262-4% -$ 235,090-4% -$ 235,967-4% -$ 312,219-4% -$ 479,456 -$ $ 64,376-1% $ 254,067 3% -$ 434,537-4% -$ 422,705-4% $ 340,360 3% $ 55,877 0% -$ 321,625-1% $ 2,212,516 7% $ 306,324 1% $ 3,216,390 15% 26

27 With these amounts of incentives and disincentives, the impact on annual demand was estimated. It is important to mention that there are no publications on national automotive market behavior, which is why it was necessary to build a simple demand model from the pricing and sales information used to build the sales matrix. For each segment we determined the elasticity of annual sales on average observed since the year 2006 and the Gross Domestic Product (GDP). For segments with s less than 10 million pesos, regressions explaining their behavior were obtained. Segments with s over 10 million pesos are very inelastic, so if you assumed that those sales do not change with respect to a baseline scenario in which they grow with the rate observed in the last five years (6% annual growth in the vehicle fleet) but segments within each of these sales are distributed according to how the corrections affect the relative s of the models. Estimated impacts While the incentive system is at first a marginal effect on total annual vehicles sales, as shown in Figure 12, as the offer extends to vehicle models with lower emissions, the greater is the amount of incentives that are delivered. This is why there is a gradual increase in sales. A further increase in sales can compromise the expected emissions reductions as a result of the implementation of the incentive system. This is one reason, along with the need to maintain fiscal neutrality, to monitor and periodically adjust the pivot point of CO 2 and the proposed categories for the emissions standards. Figure 12. Incentives system effect in total sales 27

28 The system promotes improved technology of the vehicle models offered, and as emissions are lowered, it reduces the disincentives and increases revenue by spending on incentives. As shown in Figure 13, the system is fiscally neutral after 5 years. Figure 13. Fiscal neutrality evaluation of the system (values in US$/year) Fleet segments that receive the highest incentives are sedans and hatchback with s between 5 and 7 and between 7 and 10 million pesos (Figure 14). The segments with most disincentives payments are the pickups and station wagons (Figure 15). In this last category SUV's are included. Figure 14. Segments with incentives. 28

29 Figure 15. Segments with disincentives By the application of the incentive system, there is a gradual improvement in the average emissions of the fleet, particularly in CO 2 emissions. This effect allows the domestic fleet to behave similar to other countries with regulation proposals of fuel consumption and CO 2 emissions, such as Korea, and reduces the gap between Chile and the more developed countries like Japan and the European Union, as shown in Figure 16. Figure 16. Estimated CO 2 average emission improvement in the national automotive market 29
30 The average emission reduction of the fleet means lower emissions of greenhouse gases. It is estimated that the fifth year of the incentive system, CO 2 emission of the total national fleet of cars is reduced by 5%, equivalent to 833 thousand tons per year. During the evaluation period of five years, a total reduction of 2.1 million tons is achieved (Figure 17). Figure 17. CO 2 emission estimate from the automotive fleet - with incentives. In terms of fuel, it is estimated that the fifth year of implementation can achieve a national annual savings of $200 million pesos due to lower imports of gasoline and diesel. For car owners of a medium 5-door hatchback car it is estimated an average annual savings of $134,000 due to less fuel consumption. For owners of a double cab pick-up who use them as a work vehicle, these savings can be $ 400,
31 Recommendation for legal implementation The fee-bate system implementation needs an analysis of the local legal conditions and practices for this kind of policy, without diminishing key aspects, as for example, the importance of clear signals in vehicle at the moment of purchase of a new car. Some studies in the US suggest that customers discount rebates if they do not receive them immediately. This chapter presents a first analysis and recommendation for fee bate system implementation under the Chilean legal framework, considering some similar experiences, for example, in the promotion of fuel efficiency in other fields. Implementation options The proposed incentive system seeks to provide benefits to those who purchase vehicles that are considered more efficient and with low emissions, and implement tax those who purchase vehicles that are considered highly polluting and have high fuel consumption. The proper functioning of this system requires compliance of the following principles: Progressiveness: the benefits and penalties meet the pollutants emission levels of each particular vehicle, according to parameters previously established by the authority. Equivalence: the benefits provided must be equivalent to the fines or penalties, so that the effect of taxation is neutral. Final consumption: The model should be applied to the final consumer, so the reduction/penalty is applied directly and not indirectly through transfers or adjustments by the intermediary depending on the elasticity of demand. The legislative experience of recent years indicates that the road tax to encourage certain behaviors recognizes certain limits or conditions. In other words, it was decided to apply benefits within the following framework: No tariff: a tax could be considered a breach of trade tariff agreements between countries and thus are likely to object to their legality or constitutionality. Privileging the incentive more than the tax: the legal trend to generate consumer behaviors has been to establish incentives and benefits rather than applying taxes. This principle is expressly recognized in similar models as the law which created incentives for environmentally friendly vehicles. Limit regressive component: usually those measures that give tax incentives to investments or purchases are criticized during legislation discussions because they are considered of aggressive nature. Easy administration: for model as the one proposed to be easily administered requires the following basic conditions: i) the the purpose of the model approval is likely; ii) the purpose of the model is capable of integration into public records; iii) that the subject of the model can apply it simply and personally, iv) that the operation of the model is easily managed and of efficient control. 31

32 Table 6. Compliance with principles and limits of different benefit options and taxes Where: Impuestos de importación = importation tax, IVA y adicionales = VAT, Impuesto a la renta = Income tax. 32

33 Previous experiences The law of income tax has been the mechanism most commonly used when it is needed to promote certain behaviors, particularly by way of granting credits against the tax or rebates of the tax base. Table 7. Previous experiences Proposed model The existing tax mechanism that most closely matches the desired model is now established in the Art. 57 bis of the Law on Income Tax, which promotes the acquisition of certain financial assets of savings by way of granting a tax credit equivalent to a percentage of the investments and discourages the liquidation of such assets by implementation of a debit tax. Applying such a mechanism to the analyzed model, would imply that: 1. Taxpayers who buy a new pollutant vehicle will pay a specific tax on their declaration of income tax rent Taxpayers who purchase new lower-emission vehicles are entitled to a credit equal to a percentage of the value of the car. 3. When the taxpayer sells the car that gave the right to credit, he must replace as a debit the amount reduced by the purchase. 4. Then, if the taxpayer acquires a new car he will pay tax or will have the right to new credit as appropriate. 8 Mechanism 57 does not have this first entry tax 33

34 Operations The following table reflects the proposed tax model s operation and the participants. Figure 18. Operation of the system The sequence of steps, responsibilities and activities is as follows: 1. Vehicle Importer/distributor imports vehicles 2. Authority approves vehicles and defines models and amounts 3. Taxpayer purchases vehicle 4. Vehicle Importer/distributor issues an Affidavit to the SII and informs specifically about polluting and nonpolluting cars sold. 5. Vehicle Importer/distributor issues certificates to taxpayer buyer with information about approval and amount of tax or credit. 6. SII makes link with Affidavit information issued by the Automotive 7. Taxpayer states in F22 using the certificate information 8. SII audits with linking algorithm 34
35 Annex 1 Sales Matrix 35
36 36
37 Centro Mario Molina Chile Avenida del Valle 662, Of.:501 Ciudad Empresarial - Huechuraba Santiago CHILE T
Move forward fuel efficiency policy in Vietnam
 The ASEAN German Technical Cooperation Programme Cities, Environment and Transport Move forward fuel efficiency policy in Vietnam Alex Körner alex_koerner@gmx.de March 29 Hanoi Content Introduction: Some
U.S. Light-Duty Vehicle GHG and CAFE Standards
 Policy Update Number 7 April 9, 2010 U.S. Light-Duty Vehicle GHG and CAFE Standards Final Rule Summary On April 1, 2010, U.S. Environmental Protection Agency (EPA) and U.S. Department of Transportation
Executive Summary. Light-Duty Automotive Technology and Fuel Economy Trends: 1975 through EPA420-S and Air Quality July 2006
 Office of Transportation EPA420-S-06-003 and Air Quality July 2006 Light-Duty Automotive Technology and Fuel Economy Trends: 1975 through 2006 Executive Summary EPA420-S-06-003 July 2006 Light-Duty Automotive
The Global Fuel Economy Initiative. Jane Akumu UN Environment
 The Global Fuel Economy Initiative Jane Akumu UN Environment Historical High Growth Has Made Vehicles An Important Contributor To Local, Regional and Global Pollution Vehicle fleet to triple (from ~1 billion
BASELINE STUDY ON VEHICLE INVENTORY AND FUEL ECONOMY FOR MALAWI (KEY FINDINGS)
") BASELINE STUDY ON VEHICLE INVENTORY AND FUEL ECONOMY FOR MALAWI (KEY FINDINGS) TASK TEAM- LEAD INSTITUTION Ministry of Natural Resources, Energy and Mining Mount Soche Hotel, Blantyre. 11 th December 2017
BASELINE STUDY ON VEHICLE INVENTORY AND FUEL ECONOMY FOR MALAWI (KEY FINDINGS) TASK TEAM- LEAD INSTITUTION Ministry of Natural Resources, Energy and Mining Mount Soche Hotel, Blantyre. 11 th December 2017
California Feebate: Revenue Neutral Approach to Support Transition Towards More Energy Efficient Vehicles
 California Feebate: Revenue Neutral Approach to Support Transition Towards More Energy Efficient Vehicles A Research Report from the University of California Institute of Transportation Studies Alan Jenn,
PIVE 1 PIVE 2 PIVE 3 PIVE 4 PIVE 5 PIVE 6 PIVE 7 PIVE
 Title of the measure: SPA51-PIVE Efficient-Vehicle Incentive Programme General description PIVE Programme was approved in Cabinet Meeting of 27 September 2012 with an initial budget allocation of 75 million,
DEPLOYMENT STRATEGIES FOR CLEAN AND FUEL EFFICIENT VEHICLES: EFFECTIVENESS OF INFORMATION AND SENSITIZATION IN INFLUENCING PURCHASE BEHAVIOUR
 DEPLOYMENT STRATEGIES FOR CLEAN AND FUEL EFFICIENT VEHICLES: EFFECTIVENESS OF INFORMATION AND SENSITIZATION IN INFLUENCING PURCHASE BEHAVIOUR Leen GOVAERTS, Erwin CORNELIS VITO, leen.govaerts@vito.be ABSTRACT
Fiscal incentives and Feebates as tools for improving efficiency in transport sector
 Fiscal incentives and Feebates as tools for improving efficiency in transport sector Zifei Yang Researcher Taller sobre Propuestas para Impuestos e Incentivos para Promover la Importación de Vehículos
Overview of Global Fuel Economy Policies
 Overview of Global Fuel Economy Policies Zifei Yang Researcher 2018 APCAP Joint Forum and Clean Air Week Theme: Solutions Landscape for Clean Air Bangkok, Mar 20, 2018 What is ICCT? ICCT is an independent
DEVELOPING VEHICLE FUEL ECONOMY STANDARDS FOR SOUTH AFRICAN PASSENGER VEHICLES
 DEVELOPING VEHICLE FUEL ECONOMY STANDARDS FOR SOUTH AFRICAN PASSENGER VEHICLES INTRODUCTION: POLICY DIRECTIVE 2 Developing FES and the linkages with The Green Transport Strategy The Development of the
Fuel Economy Policy Pathways for the ASEAN Region
 Fuel Economy Policy Pathways for the ASEAN Region Fuel economy standards in Asia Few Asian countries have fuel economy standards but growing over the years! Standards for passenger cars (LDV) are given
Mauritius 1.1 Background
 Mauritius 1.1 Background Mauritius depends on imported fuel for close to 83% of its energy needs. The CO2 emissions associated with the burning of fossil fuels are on the rise, with per capita emissions
A CO2-fund for the transport industry: The case of Norway
 Summary: A CO2-fund for the transport industry: The case of Norway TØI Report 1479/2016 Author(s): Inger Beate Hovi and Daniel Ruben Pinchasik Oslo 2016, 37 pages Norwegian language Heavy transport makes
SUMMARY OF THE IMPACT ASSESSMENT
 COMMISSION OF THE EUROPEAN COMMUNITIES Brussels, 13.11.2008 SEC(2008) 2861 COMMISSION STAFF WORKING DOCUMT Accompanying document to the Proposal for a DIRECTIVE OF THE EUROPEAN PARLIAMT AND OF THE COUNCIL
Overview of policies related to low carbon transportation in China
 Overview of policies related to low carbon transportation in China LowCVP Annual Conference, June 9, 2011, London Hui He Policy Analyst International Council on Clean Transportation Goal of the ICCT is
Q&A ON EMISSIONS TESTING
 Q&A ON EMISSIONS TESTING 1. How does ACEA react to the VW situation?... 1 2. How does the current lab test work?... 1 3. Why are there differences between the lab tests and real-world emissions?... 3 4.
DAILY TRAVEL AND CO 2 EMISSIONS FROM PASSENGER TRANSPORT: A COMPARISON OF GERMANY AND THE UNITED STATES
 DAILY TRAVEL AND CO 2 EMISSIONS FROM PASSENGER TRANSPORT: A COMPARISON OF GERMANY AND THE UNITED STATES Ralph Buehler, Associate Professor, Virginia Tech, Alexandria, VA Supported by American Institute
H 2. State of the World Fuel Economy. Paris, 11 June 2015
 State of the World Fuel Economy Paris, 11 June 2015 Dr. Lewis Fulton, STEPS3 Program, Institute of Transportation Studies University of California, Davis H 2 www.steps.ucdavis.edu Typical national objectives
Improving fuel economy and integrating electric vehicles
 Improving fuel economy and integrating electric vehicles Air Quality & Mobility Unit March 2018 Global Fuel Economy Initiative Doubling LDV Fuel Efficiency Worldwide by 2050 Slowing improvement in OECD
Africa Used. Vehicle Report. Ariadne Baskin. African Clean Mobility Week March
 Africa Used Vehicle Report Ariadne Baskin African Clean Mobility Week March 13 2018 Content Africa Used Vehicles Report Regulatory Environment Supply Chain & Scale of Used Vehicle Flows Way forward 2 ?
REAL WORLD DRIVING. Fuel Efficiency & Emissions Testing. Prepared for the Australian Automobile Association
 REAL WORLD DRIVING Fuel Efficiency & Emissions Testing Prepared for the Australian Automobile Association - 2016 2016 ABMARC Disclaimer By accepting this report from ABMARC you acknowledge and agree to
Fuel Economy State of the World 2014: The World is Shifting into Gear on Fuel Economy
 Fuel Economy State of the World 2014: The World is Shifting into Gear on Fuel Economy BAQ Integrated Conference of BAQ 2014 and Intergovernmental 8th Regional EST Forum in Asia Session Topic: Doubling
H 2. State-of-the-World Fuel Economy. Paris, 11 June 2015
 LEW FULTON UC DAVIS State-of-the-World Fuel Economy Paris, 11 June 2015 Dr. Lewis Fulton, STEPS3 Program, Institute of Transportation Studies University of California, Davis H 2 www.steps.ucdavis.edu Typical
Aging of the light vehicle fleet May 2011
 Aging of the light vehicle fleet May 211 1 The Scope At an average age of 12.7 years in 21, New Zealand has one of the oldest light vehicle fleets in the developed world. This report looks at some of the
Cars and vans CO2 regulations: even ambitious EU standards deliver less than half transport emission reductions needed to meet 2030 climate targets
 Cars and vans CO2 regulations: even ambitious EU standards deliver less than half transport emission reductions needed to meet 2030 climate targets October 2017 Summary Road transport is one of the few
CNG as a Transport Fuel - Economic Benefits 17 th November 2011
 CNG as a Transport Fuel - Economic Benefits 17 th November 2011 6 Grand Canal Wharf, South Dock Road, Ringsend, Dublin 4, Ireland. Tel: +353 1 6670372 Fax: +353 1 6144499 Web: www.dkm.ie Our scope of work
The starting point: History of the VW defeat device scandal and lessons learned
 The starting point: History of the VW defeat device scandal and lessons learned Drew Kodjak and ICCT Compliance Team: Rachel Muncrief, Peter Mock, John German, Anup Bandivadekar, Hui He FIA Foundation
Technology and policy drivers of the fuel economy of new light-duty vehicles Comparative analysis across selected automotive markets
 Technology and policy drivers of the fuel economy of new light-duty vehicles Comparative analysis across selected automotive markets Pierpaolo Cazzola, International Energy Agency Content GFEI and the
H 2. Fiscal Fuel Economy Measures. GFEI Training Meeting Paris, 11 June 2015
 Fiscal Fuel Economy Measures GFEI Training Meeting 2015 Paris, 11 June 2015 Dr. Lewis Fulton, NextSTEPS Program, Institute of Transportation Studies University of California, Davis H 2 www.steps.ucdavis.edu
EU Light Duty Vehicles and CO 2 Policy
 EU Light Duty Vehicles and CO 2 Policy Malcolm Fergusson Senior Fellow www.ieep.eu Asilomar Conference Transportation and Climate Policy 21-24 August 2007 The EU Context EU seeking to lead in Kyoto commitments
CITY OF MINNEAPOLIS GREEN FLEET POLICY
 CITY OF MINNEAPOLIS GREEN FLEET POLICY TABLE OF CONTENTS I. Introduction Purpose & Objectives Oversight: The Green Fleet Team II. Establishing a Baseline for Inventory III. Implementation Strategies Optimize
A comparison of the impacts of Euro 6 diesel passenger cars and zero-emission vehicles on urban air quality compliance
 A comparison of the impacts of Euro 6 diesel passenger cars and zero-emission vehicles on urban air quality compliance Introduction A Concawe study aims to determine how real-driving emissions from the
Economic and Social Council
 UNITED NATIONS E Economic and Social Council Distr. GENERAL ECE/TRANS/WP.29/AC.3/26 18 December 2009 Original: ENGLISH ECONOMIC COMMISSION FOR EUROPE INLAND TRANSPORT COMMITTEE World Forum for Harmonization
Fueling Savings: Higher Fuel Economy Standards Result In Big Savings for Consumers
 Fueling Savings: Higher Fuel Economy Standards Result In Big Savings for Consumers Prepared for Consumers Union September 7, 2016 AUTHORS Tyler Comings Avi Allison Frank Ackerman, PhD 485 Massachusetts
1 Faculty advisor: Roland Geyer
 Reducing Greenhouse Gas Emissions with Hybrid-Electric Vehicles: An Environmental and Economic Analysis By: Kristina Estudillo, Jonathan Koehn, Catherine Levy, Tim Olsen, and Christopher Taylor 1 Introduction
International Research Journal of Applied Finance ISSN Audit Practices for Automobile Dealerships
 Audit Practices for Automobile Dealerships Paul C. Schauer Abstract One of the most important factors in a successful audit is a well-designed audit plan. The audit plan is a comprehensive process determining
Moving Forward On Vehicle Pollution Control In China
 Moving Forward On Vehicle Pollution Control In China May 12, 2010 Ray Minjares Michael P. Walsh International Council on Clean Transportation 1 International Council on Clean Transportation The goal of
FUEL ECONOMY BASELINE AND TRENDS- MALAWI INSTITUTIONS
 FUEL ECONOMY BASELINE AND TRENDS- MALAWI INSTITUTIONS Ministry of Natural Resources, Energy and Mining; Ministry of Transport and Public Works; University of Malawi; National Commission for Science and
How vehicle fuel economy improvements can save $2 trillion and help fund a long-term transition to plug-in vehicles
 How vehicle fuel economy improvements can save $2 trillion and help fund a long-term transition to plug-in vehicles Policy Institute, NextSTEPS and GFEI Webinar November 7, 2013 Dr. Lewis Fulton, NextSTEPS
Study of Fuel Economy Standard and Testing Procedure for Motor Vehicles in Thailand
 Study of Fuel Economy Standard and Testing Procedure for Motor Vehicles in Thailand MR.WORAWUTH KOVONGPANICH TESTING MANAGER THAILAND AUTOMOTIVE INSTITUTE June 20 th, 2014 Overview Background Terminology
Proportion of the vehicle fleet meeting certain emission standards
 The rate of penetration of new technologies is highly correlated with the average life-time of vehicles and the average age of the fleet. Estimates based on the numbers of cars fitted with catalytic converter
Electric Mobility in Africa Opportunities and Challenges. African Clean Mobility Week, Nairobi/Kenya, March
 Electric Mobility in Africa Opportunities and Challenges African Clean Mobility Week, Nairobi/Kenya, March 13 2018 alexander.koerner@un.org Content Setting the scene Opportunities and challenges for electric
Vehicle Fuel Economy Standards and Feebate System
 Vehicle Fuel Economy Standards and Feebate System Zifei Yang Researcher ACEEE International Symposium on Energy Efficiency Washington DC, June 26, 2018 What is ICCT? ICCT is an independent non-profit research
Vermont Public Power Supply Authority 2018 Tier 3 Annual Plan
 Vermont Public Power Supply Authority 2018 Tier 3 Annual Plan Vermont s Renewable Energy Standard ( RES ) enacted through Act 56 in 2015 requires electric distribution utilities to generate fossil fuel
Fuel Economy Standards in Asia
 Fuel Economy Standards in Asia Sophie Punte Executive Director Clean Air Initiative for Asian Cities Center (CAI-Asia Center) ADB Transport Forum Asian Development Bank 26 May 2010 Increasing Motorization
International Experience in Improving Fuel Efficiency and Reducing Greenhouse Gases
 International Experience in Improving Fuel Efficiency and Reducing Greenhouse Gases Michael P. Walsh Driving Lower Emissions Brussels, Belgium 13 September, 2006 Outline Vehicles Are Important Countries
AMBER M. KLESGES BOARD SECRETARY. No.\w-Tm
 \C. 9! J RECOMMENDATION APPROVED; RESOLUTION NO. 16-7999 AND TEMPORARY ORDER 16-7209 & PERMANENT ORDER 16-7210 ADOPTED; BY THE BOARD OF HARBOR COMMISSIONERS \b 1 September 15, 2016 1A THE PORT OF LOS ANGELES
An overview of International Policies on Vehicle Fuel Economy. Jane Akumu UN Environment
 An overview of International Policies on Vehicle Fuel Economy Jane Akumu UN Environment Fuel economy policies & instruments Target group: Consumer Monetary Fiscal instruments FE Consumer information Labelling
COATING YOUR WAY TO LOWER EMISSIONS
 COATING YOUR WAY TO LOWER EMISSIONS With vehicle production growing annually and manufacturers under pressure to reduce exhaust emissions, new and innovative methods will have to be found to increase engine
Application of claw-back
 Application of claw-back A report for Vector Dr. Tom Hird Daniel Young June 2012 Table of Contents 1. Introduction 1 2. How to determine the claw-back amount 2 2.1. Allowance for lower amount of claw-back
TTIP Regulatory Aspects
 TTIP Regulatory Aspects Automobile industry perspective JOINT JURI/INTA PUBLIC HEARING EUROPEAN PARLIAMENT TUESDAY, 27 JANUARY 2015 Erik Jonnaert Secretary General, ACEA Wednesday, 28 January 2015 ACEA
EU CO 2 emission policy : State of Play. European Commission, DG CLIMA. Climate Action
 EU CO 2 emission policy : State of Play European Commission, DG CLIMA Clean Mobility Package: an integrated approach 2016 Clean Energy Package RED II: lowemission fuels 2016 European Low-Emission Mobility
K.G. Duleep President, H-D Systems International Transport Forum, 2012 Global Fuel Economy Initiative
 K.G. Duleep President, H-D Systems International Transport Forum, 2012 Global Fuel Economy Initiative Fuel economy of the new car fleet is widely different across countries but there is no analysis of
Global EV Outlook 2017 Two million electric vehicles, and counting
 Global EV Outlook 217 Two million electric vehicles, and counting Pierpaolo Cazzola IEA Launch of Chile s electro-mobility strategy Santiago, 13 December 217 Electric Vehicles Initiative (EVI) Government-to-government
MEMORANDUM. Proposed Town of Chapel Hill Green Fleets Policy
 AGENDA #4k MEMORANDUM TO: FROM: SUBJECT: Mayor and Town Council W. Calvin Horton, Town Manager Proposed Town of Chapel Hill Green Fleets Policy DATE: June 15, 2005 The attached resolution would adopt the
Vehicle Emissions Standards, Fuel Quality, Air Pollution and Health
 Vehicle Emissions Standards, Fuel Quality, Air Pollution and Health Bert Fabian Programme Officer UNEP Energy, Climate, and Technology Branch Division of Technology, Industry and Economics Conclusion Cost
Review of the SMAQMD s Construction Mitigation Program Enhanced Exhaust Control Practices February 28, 2018, DRAFT for Outreach
 ABSTRACT The California Environmental Quality Act (CEQA) review process requires projects to mitigate their significant impacts. The Sacramento Metropolitan Air Quality Management District (SMAQMD or District)
Safety and Green Vehicle Performance Rating
 Safety and Green Vehicle Performance Rating presentation by David Ward Secretary General Global New Car Assessment Programme 2014 Fleet Forum Budapest 3 rd April 2014 Changing Geography of Vehicle Use
BENEFITS OF RECENT IMPROVEMENTS IN VEHICLE FUEL ECONOMY
 UMTRI-2014-28 OCTOBER 2014 BENEFITS OF RECENT IMPROVEMENTS IN VEHICLE FUEL ECONOMY MICHAEL SIVAK BRANDON SCHOETTLE BENEFITS OF RECENT IMPROVEMENTS IN VEHICLE FUEL ECONOMY Michael Sivak Brandon Schoettle
The Global Fuel Economy Ini3a3ve
 The Global Fuel Economy Ini3a3ve Elisa Dumitrescu, UN Environment Kiev, Ukraine 28 October 2016 q GFEI q Auto fuel economy - global view q Focus on Ukraine (baseline data) The global LDV fleet is set to
International comparison of light-duty vehicle fuel economy: An update using 2010 and 2011 new registration data Working Paper 8
 International comparison of light-duty vehicle fuel economy: An update using 2010 and 2011 new registration data Working Paper 8 UNEP Page 1 Page 1 François Cuenot Alexander Körner International comparison
Caltex Australia comments on Carbon Pollution Reduction Scheme White Paper February 2009
 Caltex Australia comments on Carbon Pollution Reduction Scheme White Paper February 2009 Upstream Point of Liability - Fuel Tax Package Outline of scheme The Carbon Pollution Reduction Scheme (CPRS) White
Index Long term vision Transport sector in the big picture Cost effectiveness of low carbon technologies investment Sales mix in the coming decades Sh
 Transport Future Workshop 2 nd Workshop for Automobile and Energy CO2 emission reduction from light duty vehicles by 2050: long term vision for short term actions François Cuenot International Energy Agency
A Guide to the medium General Service. BC Hydro Last Updated: February 24, 2012
 A Guide to the medium General Service Conservation Rate BC Hydro Last Updated: February 24, 2012 Executive summary The way Medium General Service (MGS) accounts pay for electricity is changing. MGS is
FURTHER TECHNICAL AND OPERATIONAL MEASURES FOR ENHANCING ENERGY EFFICIENCY OF INTERNATIONAL SHIPPING
 E MARINE ENVIRONMENT PROTECTION COMMITTEE 67th session Agenda item 5 MEPC 67/5 1 August 2014 Original: ENGLISH FURTHER TECHNICAL AND OPERATIONAL MEASURES FOR ENHANCING ENERGY EFFICIENCY OF INTERNATIONAL
The Introduction of Euro 5 and Euro 6 Emissions Regulations for Light Passenger and Commercial Vehicles
 The Introduction of Euro 5 and Euro 6 Emissions Regulations for Light Passenger and Commercial Vehicles Introduction As a member of the European Union, Ireland is obliged to introduce Regulation (EC) No.
Academia, Industry and Government: together for automotive engineering development
 Academia, Industry and Government: together for automotive engineering development code: EAEC- 15 009B-FEP Paper title: CO2 EMISSION DETERMINATION IN ACCORD WITH EUROPEAN REGULATION FOR OLD AND TODAY CARS
Official Journal L 076, 22/03/2003 P
 Directive 2003/17/EC of the European Parliament and of the Council of 3 March 2003 amending Directive 98/70/EC relating to the quality of petrol and diesel fuels (Text with EEA relevance) Official Journal
COMMISSION RECOMMENDATION. of XXX
 EUROPEAN COMMISSION Brussels, XXX [ ](2017) XXX draft COMMISSION RECOMMENDATION of XXX on the use of fuel consumption and CO 2 emission values type-approved and measured in accordance with the World Harmonised
The oil fields in the NCS are located in the North Sea, Norwegian Sea, and Barents Sea.
 A.2 Norway Volumes of Associated Gas Flared on Norwegian Continental Shelf Norway is a major oil producer, and its oil fields are located offshore in the Norwegian Continental Shelf (NCS). 81 In 2002,
FISCAL YEAR MARCH 2015 THIRD QUARTER FINANCIAL RESULTS. Updated Mazda CX-5 (Japanese specification model)
") FISCAL YEAR MARCH 2015 THIRD QUARTER FINANCIAL RESULTS Updated Mazda CX-5 (Japanese specification model) Mazda Motor Corporation February 4, 2015 1 PRESENTATION OUTLINE Highlights Fiscal Year March 2015
FISCAL YEAR MARCH 2015 THIRD QUARTER FINANCIAL RESULTS Updated Mazda CX-5 (Japanese specification model) Mazda Motor Corporation February 4, 2015 1 PRESENTATION OUTLINE Highlights Fiscal Year March 2015
ZEVs Role in Meeting Air Quality and Climate Targets. July 22, 2015 Karen Magliano, Chief Air Quality Planning and Science Division
 1 ZEVs Role in Meeting Air Quality and Climate Targets July 22, 2015 Karen Magliano, Chief Air Quality Planning and Science Division 2 Meeting Multiple Goals Stable Global Climate 2030 Greenhouse Gas Emission
Efficiency Standards for External Power Supplies
 A Dynamic Regulatory Environment By Jeff Schnabel, VP of Marketing The global regulatory environment surrounding the legislation of external power supply efficiency and no-load power draw has rapidly evolved
FUEL CONSUMPTION STANDARDS FOR HEAVY-DUTY VEHICLES IN INDIA
 INTERNATIONAL COUNCIL ON CLEAN TRANSPORTATION POLICY UPDATE DECEMBER 17 FUEL CONSUMPTION STANDARDS FOR HEAVY-DUTY VEHICLES IN INDIA ICCT POLICY UPDATES SUMMARIZE REGULATORY AND OTHER DEVELOPMENTS RELATED
Taxing Petrol and Diesel
 Taxing Petrol and Diesel Colm Farrell Key Point Under the polluter pays principle, tax rates on diesel and petrol fuels should be at a rate which is commensurate with the total environmental costs they
FISCAL YEAR MARCH 2014 FINANCIAL RESULTS
 FISCAL YEAR MARCH 214 FINANCIAL RESULTS Mazda CX-5 Mazda Atenza Mazda Motor Corporation April 25, 214 New Mazda Axela 1 PRESENTATION OUTLINE Highlights Fiscal Year March 214 Results Fiscal Year March 215
Challenges for sustainable freight transport Maritime transport. Elena Seco Gª Valdecasas Director Spanish Shipowners Association - ANAVE
 Challenges for sustainable freight transport Maritime transport Elena Seco Gª Valdecasas Director Spanish Shipowners Association - ANAVE Index 1. Shipping air emissions vs other transport modes. 2. How
Support for the revision of the CO 2 Regulation for light duty vehicles
 Support for the revision of the CO 2 Regulation for light duty vehicles and #3 for - No, Maarten Verbeek, Jordy Spreen ICCT-workshop, Brussels, April 27, 2012 Objectives of projects Assist European Commission
Zorik Pirveysian, Air Quality Policy and Management Division Manager Policy and Planning Department
 Environment Committee Meeting: April 11, 2006 To: From: Environment Committee Zorik Pirveysian, Air Quality Policy and Management Division Manager Policy and Planning Department Date: March 20, 2006 Subject:
Brief on the PCFV Used Vehicle Working Group. Partnership for Clean Fuels and Vehicles (PCFV)
") Brief on the PCFV Used Vehicle Working Group Partnership for Clean Fuels and Vehicles (PCFV) Henry Kamau Establishment of the Used Vehicles Working Group The Partnership for Clean Fuels and Vehicles (PCFV)
Brief on the PCFV Used Vehicle Working Group Partnership for Clean Fuels and Vehicles (PCFV) Henry Kamau Establishment of the Used Vehicles Working Group The Partnership for Clean Fuels and Vehicles (PCFV)
FISCAL YEAR MARCH 2018 FIRST HALF FINANCIAL RESULTS
 FISCAL YEAR MARCH 2018 FIRST HALF FINANCIAL RESULTS PRESENTATION OUTLINE Highlights Fiscal Year March 2018 First Half Results Fiscal Year March 2018 Full Year Forecast Progress of Key Initiatives/ Business
NEW-VEHICLE MARKET SHARES OF CARS VERSUS LIGHT TRUCKS IN THE U.S.: RECENT TRENDS AND FUTURE OUTLOOK
 SWT-2017-10 JUNE 2017 NEW-VEHICLE MARKET SHARES OF CARS VERSUS LIGHT TRUCKS IN THE U.S.: RECENT TRENDS AND FUTURE OUTLOOK MICHAEL SIVAK BRANDON SCHOETTLE SUSTAINABLE WORLDWIDE TRANSPORTATION NEW-VEHICLE
WLTP for fleet. How the new test procedure affects the fleet business
 WLTP for fleet How the new test procedure affects the fleet business Editorial Ladies and Gentlemen, The automotive industry is facing a major transformation process that will also affect the fleet business
An overview of Directive (EU) 2015/2193 from the Power Generation business perspective
 2015/2193 from the Power Generation business perspective") Our energy working for you. TM Power topic #EMERPT-6194-EN Technical information from Cummins Power Generation Medium Combustion Plants Directive White Paper By Pedro Ponte, Project Application Engineer
Our energy working for you. TM Power topic #EMERPT-6194-EN Technical information from Cummins Power Generation Medium Combustion Plants Directive White Paper By Pedro Ponte, Project Application Engineer
PGE Sustainability Report Key Metrics FISCAL YEAR 2017
 PGE Sustainability Report Key Metrics FISCAL YEAR 2017 Data in this report is from our 2017 fiscal year (Jan. 1, 2017, to Dec. 31, 2017), unless otherwise noted. CORPORATE FACTS 2013 2014 2015 2016 2017
California Greenhouse Gas Vehicle and Fuel Programs
 NCSL Advisory Council on Energy California Greenhouse Gas Vehicle and Fuel Programs Charles M. Shulock California Air Resources Board November 28, 2007 Overview AB 32 basics GHG tailpipe standards Low
The right utility parameter mass or footprint (or both)?
?") January 2013 Briefing The right utility parameter mass or footprint (or both)? Context In 2009, the EU set legally-binding targets for new cars to emit 130 grams of CO 2 per kilometer (g/km) by 2015 and
January 2013 Briefing The right utility parameter mass or footprint (or both)? Context In 2009, the EU set legally-binding targets for new cars to emit 130 grams of CO 2 per kilometer (g/km) by 2015 and
CO2 BASED MOTOR VEHICLE TAXES IN THE EU
 CO2 BASED MOTOR VEHICLE TAXES IN THE EU AUSTRIA A deduction of VAT is applicable for zero CO2 emission passenger cars. Fuel consumption/pollution tax (Normverbrauchsabgabe or NoVA) is levied on the purchase
Electric Vehicles and State Funds
 Electric s and State Funds Current Contributions in Massachusetts and Long-Term Solutions to Transportation Funding March 2018 Overview Electric vehicles are a practical, commercially available option
BIODIESEL CHAINS. Biofuels in Poland
 BIODIESEL CHAINS Nicosia, 18th January 2007 Biofuels in Poland Oskar Mikucki KAPE 2007-08-29 The Polish National Energy Conservation Agency 1 Development of biofuels market Development of biofuels in Poland
PECC Seminar Perth. Clean transportation and carbon-free electric vehicles, short and long term vision
 PECC Seminar Perth Clean transportation and carbon-free electric vehicles, short and long term vision Henri Boyé, French Ministry of Sustainable Development Transport Stakes : The most GHG emitting sector
Fleet Sustainability Policy
 Fleet Sustainability Policy Scope: CITYWIDE Policy Contact Mark Stevens Fleet Manager Department of Public Works (916) 808-5869 MStevens@cityofsacramento.org Table of Contents A. Emissions Reductions B.
Consistent implementation of the 2020 sulphur limit and work to further address GHG emissions from international shipping
 Consistent implementation of the 2020 sulphur limit and work to further address GHG emissions from international shipping IBIA/BMS United A glimpse into the future of shipping 30 May 2018, Athens, Greece
FISCAL YEAR MARCH 2018 FIRST QUARTER FINANCIAL RESULTS
 FISCAL YEAR MARCH 2018 FIRST QUARTER FINANCIAL RESULTS PRESENTATION OUTLINE Highlights Fiscal Year March 2018 First Quarter Results Fiscal Year March 2018 Full Year Forecast Structural Reform Stage 2 Progress
COMMISSION OF THE EUROPEAN COMMUNITIES REPORT FROM THE COMMISSION. Quality of petrol and diesel fuel used for road transport in the European Union
 COMMISSION OF THE EUROPEAN COMMUNITIES Brussels, 2.3.2005 COM(2005) 69 final REPORT FROM THE COMMISSION Quality of petrol and diesel fuel used for road transport in the European Union Second annual report
Average Fuel Economy of Korea
 Average Fuel Economy of Korea 2016. 8. 31 Sangjune PARK The Korea Transport Institute Contents 1. Background 2. Average Fuel Economy of Korea 3. Implication 2/25 1. Background Average Fuel Economy System
Your Fuel Can Pay You: Maximize the Carbon Value of Your Fuel Purchases. Sean H. Turner October 18, 2017
 Your Fuel Can Pay You: Maximize the Carbon Value of Your Fuel Purchases Sean H. Turner October 18, 2017 Agenda Traditional Funding Mechanisms vs. Market- Based Incentives for Renewable Fuels and Electric
ON-ROAD FUEL ECONOMY OF VEHICLES
 SWT-2017-5 MARCH 2017 ON-ROAD FUEL ECONOMY OF VEHICLES IN THE UNITED STATES: 1923-2015 MICHAEL SIVAK BRANDON SCHOETTLE SUSTAINABLE WORLDWIDE TRANSPORTATION ON-ROAD FUEL ECONOMY OF VEHICLES IN THE UNITED
Biofuels - Global Situation, Concerns and the Future
 Brazilian Association of Vegetable Oil Industries Biofuels - Global Situation, Concerns and the Future International Oilseed Producers Dialogue - IOPD Daniel Furlan Amaral Rio de Janeiro RJ Brazil June