THESIS INVESTIGATION OF SUPERTURBOCHARGER PERFORMANCE IMPROVEMENTS THROUGH STEADY STATE ENGINE SIMULATION. Submitted by.
|
|
|
- Brittney McBride
- 6 years ago
- Views:
Transcription
1 THESIS INVESTIGATION OF SUPERTURBOCHARGER PERFORMANCE IMPROVEMENTS THROUGH STEADY STATE ENGINE SIMULATION Submitted by Kevin Whitley Department of Mechanical Engineering In partial fulfillment of the requirements For the Degree of Master of Science Colorado State University Fort Collins, Colorado Fall 2010 Master s Committee: Department Chair: Susan James Advisor: Daniel Olsen Thomas Bradley Daniel Zimmerle John Labadie
2 ABSTRACT INVESTIGATION OF SUPERTURBOCHARGER PERFORMANCE IMPROVEMENTS THROUGH STEADY STATE ENGINE SIMULATION An integrated supercharger/turbocharger (SuperTurbo) is a device that combines the advantages of a supercharging, turbocharging and turbocompounding while eliminating some of their individual disadvantages. High boost, turbocompounding, and advanced controls are important strategies in meeting impending fuel economy requirements. High boost increases engine power output while many losses remain constant, producing an overall efficiency gain. Turbocompounding increases engine efficiency by capturing excess exhaust turbine power at high speed and torque. Supercharging increases low speed high torque operating performance. Steady state performance gains of a Superturbocharger equipped engine are investigated using engine simulation software. The engine simulation software uses a 1-D wave flow assumption to model the engine s unsteady flow behavior through one dimensional pipes. With these pipes connected to other engine components the overall performance of the engine can be modeled. GT-Power was chosen to run the simulations due to an already correlated engine model being available. This software is used to tune an existing stock engine model to approximate stock engine data over the full speed and ii
3 torque range. The SuperTurbo is added to the model and simulations are performed over the full engine speed and torque range for direct comparison with the stock engine. The model results show turbocompounding to be most effective at high speeds and torques in the area above 10 bar BMEP in the RPM range and above 5 bar BMEP in the RPM range. In addition to turbocompounding there are fuel savings due to the reduced use of the compressor when it is not needed. With the stock configuration there is boost pressure created by compressor power that is then restricted by the throttle in the 2500 RPM range in the 8-12 bar BMEP range on up to 6000 RPM in the 2-10 bar BMEP range. The control of compressor speed to produce no boost at these locations improves efficiency by not wasting energy creating boost that is not needed. iii
4 TABLE OF CONTENTS ABSTRACT... ii TABLE OF CONTENTS... iv List of Tables... vi List of Figures... vii CHAPTER 1: INTRODUCTION Scope and Focus of Thesis Literature Review Transient and Steady State Performance Forced Induction Waste Heat Recovery Control Strategies SuperTurbo CHAPTER 2: ENGINE MODEL GT Power Stock model from Volkswagen SuperTurbo added by SwRI Stock Engine Model Tuning CHAPTER 3: ENGINE SIMULATIONS Simulation of Stock Engine Configuration Comparison of SuperTurbo Model to SuperTurbo Test Data Simulation of SuperTurbo Engine Configuration Results CHAPTER 4: SUMMARY AND CONCLUSION Summary Conclusion and Future Work iv
5 References Appendix A: Volkswagen Test Data Appendix B: Volkswagen Stock Modeling Data Appendix C: Volkswagen SuperTurbo Modeling Data Appendix D: Comparison of SuperTurbo test data to modeling data v
6 List of Tables Table 1.1: Level road acceleration tests (2) vi
7 List of Figures Figure 1.1: 1980 Scirocco fuel economy and 0 60 mph times (1)... 5 Figure 1.2: 1979 Omni fuel economy and 0 60 mph times (1)... 6 Figure 1.3: Comparison of turbocharged/supercharged 2.3l EFI spark ignited engine performance of WOT transient at 2000 rpm (left) and 3000 rpm (right) (4)... 9 Figure 1.4: Steady state WOT performance tests (4) Figure 1.5: Comparison of load acceptance response between (15) turbocharged and series turbocompounded engine Figure 1.6: Acceleration speeds and types (7) Figure 1.7: MAP responses according to the throttle valve opening speed (left) and acceleration type (right) (7) Figure 1.8: Air excess ratio responses according to the valve opening speed and acceleration type (7) Figure 1.9: Transient response specifications of RPM (7) Figure 1.10: Comparison of fuel consumptions for three types of supercharger regulation (5) Figure 1.11: Turbocharger speed for conventional system (TA) and for zero airflow (FR) for two sub ambient pressures (2) Figure 1.12: Control of zero flow compressor speed for fast response system (2) Figure 1.13: Transient response of conventional ( ) and fast response ( ) system (2) Figure 1.14: Ratio of efficiency of strategy V I to strategy V II for different values of F (left) and ratio of peak pressure of strategy V I to strategy V II for different values of F (right) (19) Figure 1.15: Ratio of efficiency of strategy V I to strategy I for different values of F (left) and ratio of peak pressure of strategy V I to strategy I for different values of F (right) (19) Figure 1.16: SuperTurbo power flow diagram Figure 1.17: The SuperTurbocharger combines the advantages of a supercharger and a turbocharger as well as eliminating some of their individual disadvantages Figure 1.18: Simulated improvement in BSFC of Hyundai natural gas engine with mechanical/hydraulic transmission to transfer power between crankshaft and turbine shaft (17) Figure 1.19: Improvement in BSFC for Mack E7G engine with SuperTurbocharger compared to stock turbocharger (17) Figure 1.20: WOT curve for MACK E7G with SuperTurbocharger and stock turbocharger (17) Figure 1.21: Step change response of a SuperTurbocharger compared to stock turbo (17) Figure 1.22: SuperTurbo transient response for a pedal snap from 2 bar BMEP to WOT at 2000 RPM. The engine reaches 90% of the peak in 0.36 seconds (17) vii
8 Figure 1.23: Torque curve of the SuperTurbocharged 2.0 Liter versus a N/A 3.2 Liter V6 (17) Figure 1.24: Full load efficiency curve of the SuperTurbocharged 2.0 Liter versus a N/A 3.2 Liter V6 (17) Figure 2.1: Volumetric efficiency correlation (20) Figure 2.2: Airflow correlation (20) Figure 2.3: Performance Correlation (20) Figure 2.4: Compressor Outlet Conditions (20) Figure 2.5: Turbine Inlet Conditions (20) Figure 2.6: Main View of GT Power Model in original form from Volkswagen Figure 2.7: View of the controls page dealing with temperature corrections, wastegate control, and lambda control Figure 2.8: SuperTurbo Model added by SwRI Figure 2.9: In Cylinder Timing Events Figure 2.10: Error in BMEP values for modeling data compared to test data Figure 2.11: FMEP Model Output from GT Power Figure 2.12: Error in BMEP values for modeling data compared to test data Figure 2.13: Turbine Map Data Analysis Plots for Turbine Map 1 (above) and Turbine Map 2 (below) Figure 2.14: Turbine Map Data Analysis Plots for Turbine Map 1 (left) and Turbine Map 2 (right); the Blade Speed Ratio (BSR) is used for normalization and extrapolation calculations in GT Power Figure 3.1: Wastegate flow versus engine speed (RPM/1000) and load (bar) Figure 3.2: Boost pressure created by the compressor that is unneeded Figure 3.3: The new turbine design has a wider inlet area to allow less back pressure as well as longer blades to improve efficiency Figure 3.4: Brake specific fuel consumption improvement over stock engine Figure 3.5: At this higher load point the contribution from turbocompounding dominates the contribution from throttle/gear ratio control Figure 3.6: Brake specific fuel consumption improvement over stock engine Figure 3.7: Power transferred from SuperTurbo to Crankshaft Figure 3.8: BMEP contribution from Turbocompounding Figure 3.9: Pressure at different locations through the engine for 3000 RPM 8 bar BMEP Figure 3.10: Power transferred from SuperTurbo to Crankshaft Figure 3.11: Wasted boost pressure and compressor power as a function of SuperTurbo gear ratio Figure 3.12: While the pressure drop across the throttle reduces with gear ratio, the pumping losses increase slightly Figure 3.13: The reduced backpressure more than compensates for the increased pumping losses from the reduced intake manifold pressure Figure 3.14: Log P V plot comparing pumping losses at 3500 RPM 4 bar BMEP Figure 3.15: Log P V plot comparing pumping losses at 3500 RPM 15 bar BMEP viii
9 Figure 3.16: Difference in intake manifold pressure calculated as stock pressure minus SuperTurbo pressure so (+) indicates stock pressure is greater Figure 3.17: Difference in pre turbine pressure calculated as stock pressure minus SuperTurbo pressure so (+) indicates stock pressure is greater Figure 3.18: Stock PMEP minus SuperTurbo PMEP Figure 3.19: Overall gear ratio from turbine shaft to crankshaft ix
10 CHAPTER 1: INTRODUCTION 1.1 Scope and Focus of Thesis In this work, an already calibrated engine model is modified by adding a model of a device called a superturbocharger (SuperTurbo). This device incorporates a transmission between the turbocharger shaft and the engine s crankshaft. The transmission consists of a high speed traction drive section and a continuously variable section that will allow control of turbocharger speed, independent of crankshaft speed. This allows for more options for load control as the load can now be adjusted with both the SuperTurbo gear ratio and the throttle valve. Chapter one discusses work leading up to this investigation as well as the current status of the SuperTurbo development. Chapter two describes the modeling software and the available calibrated stock engine model, as well as the SuperTurbo addition. Chapter three describes the simulations of the two independent load control mechanisms consisting of the throttle and the SuperTurbo. Chapter four summarizes the results, presents a conclusion and possibilities for future work. 1.2 Literature Review There are several aspects of engines that relate to current efforts to make them more fuel efficient, while keeping emissions low and maintaining drivability. Both steady state and transient modes are considered. Forced induction as a means of downsizing the engine is 1
11 investigated. Waste heat recovery methods can be used to increase fuel efficiency. Control efforts are also an important consideration Transient and Steady State Performance It has become increasingly common for smaller, better performing engines to replace larger engines in automobiles. In the past, engine manufacturers were able to accommodate increased performance requirements with increased displacement. However, since the advent of political uncertainty surrounding emissions and fuel prices, it has become necessary for engine and automobile manufacturers to continually improve fuel economy and lower emissions without sacrificing drivability. A common goal has been to produce equivalent power, through means such as boosting, from a smaller engine leading to potential fuel and emissions savings (1), (2), (3), (4). This technique has often been referred to as engine downsizing (1), (5), (6). Through the study of previous and current efforts along with modern engine modeling software, further engine downsizing can be realized. Engine performance relating to fuel economy, emissions, and power can be divided into two operating modes: transient and steady state. Steady state behavior has usually been characterized by low load constant speed driving, such as on the highway. In stationary applications where engines run at near constant speed and load, the engines can be designed around a single operating point, making them among the most efficient of all reciprocating engines available. The problem arises with trying to obtain improved fuel economy while at the same time having satisfactory transient performance. A vehicle can experience several different types of transients. One type of transient response is when the speed remains relatively constant while the load is changed, which occurs as the clutch is being let out on an automobile with a manual transmission. Another type of 2
12 transient situation is where the load is kept relatively constant while the speed undergoes transient behavior. In urban settings automobiles most often undergo a combination of the two where load and speed are both experiencing transient behavior (7), (8). This is where drivability of the downsized engine comes into play. The automobile will intermittently need extra power for the quick accelerations necessary in daily driving. If the downsized engine is not able to adequately accept its given load at a given speed, the engine speed will drop and in the extreme case, eventually stall if corrective measures such as downshifting are not implemented (8). When a torque (or horsepower) curve vs. engine speed is given for a specific engine, it indicates the steady state torque at a given engine speed. Loading (increased torque) the engine above this line results in a decrease in engine speed. Steady state loads are associated with friction in the system as well as air drag forces. The transient situation must also take into account the energy used to accelerate the inertial loads (8), (9), (10). As a car is accelerating through its gear range, it is continually going through the speed range of the engine. This requires the engine to overcome inertia from the engine, the drive train, and from the automobile itself, in addition to the friction and air resistance that is also experienced at steady state operation. This plays an important role in the drivability of an automobile. Another disadvantage during transient performance is the rapidly changing intake air. In contrast with steady state operation, where there is ample time for the ECU to optimize the air fuel ratio accurately, transient response is susceptible to transient response characteristics in all control systems, such as overshoot and settling time, resulting in poorer fuel and emissions ratings (7). When an automobile engine operates at steady state mode, it has the advantage of being able to accurately keep the air to fuel (A/F) ratio at the desired level with an O 2 sensor due to the near constant rate of air being delivered. Along with the use of a 3 way catalyst, satisfactory power, fuel consumption, and emissions can be realized. 3
13 Automobile engines require a large range of operating conditions that need to be considered for overall performance. Engines must have satisfactory steady state fuel and emissions performance and maintain this performance during transient operation, which require dramatic increases in load. These considerations must also take into account the overall economic value with respect to the additional complexity. Boosted engines are becoming increasingly more complex, but the cost benefit ratio of such systems has been realized through their ever increasing use Forced Induction As the saying goes, There is no replacement for displacement. A forced induction engine is simply not capable of meeting the transient performance of a naturally aspirated engine of the same power output (3), (4), (8), (9). This has been the main challenge confronting the use of forced induction engines with regards to both superchargers and turbochargers. Forced induction refers to the concept of forcing more air into the intake manifold stream than a naturally aspirated engine is capable of. This compressed air is referred to as boost. The two most common types of forced induction are supercharging and turbocharging. While turbocharging is sometimes referred to as a type of supercharging (1), they will be referred to as two separate concepts herein. Supercharging uses energy from the crankshaft to drive a compressor; turbochargers use exhaust gas energy to drive a compressor. Another type of forced induction is the Comprex pressure wave charger (9), (10), (11). This system uses the exhaust gas pulses as a means for compressing the intake air. There are also studies on injecting a stored source of compressed air into the intake stream (8). Supercharging is historically associated with high performance and racing applications without regard for fuel economy. Compared to other pressure charging methods, supercharging 4
14 is not very desirable for steady state performance as it requires crankshaft power. Additionally, at steady state operation this extra power is not needed. Through the technique of downsizing, a supercharged engine can replace a larger naturally aspirated engine for transient needs while still having adequate low load capability for steady state operation. A supercharger needs to be selected that can quickly develop boost with minimal losses at low loads when not in use. In one study, a positive displacement backflow vane type supercharger was selected for its capability of developing the necessary boost at speeds close to engine speed due to its closely matched volumetric efficiency (1). This eliminated the complexity of high speed operation. It was also chosen since it was compact and lightweight compared to compressors with similar outputs. With the proper selection of a supercharger, the engine acts as a smaller naturally aspirated engine at steady state speeds while still being able to develop the torque needed at higher loads with the assistance of the supercharger. While good results were obtained, this design was not widely implemented. Figure 1.1 shows fuel economy and 0 60 mph time Figure 1.1: 1980 Scirocco fuel economy and 0 60 mph times (1) 5
15 comparisons for a 1980 Volkswagen Scirocco with a 1.6 liter inline 4 cylinder engine with a 5 speed manual transmission. The axle ratio was kept constant at 3.89:1 and the continuous fuel injection system left unchanged. The graph shows almost identical city fuel economy with slightly worse highway fuel economy, but a 0 60 mph time decrease from 11.5 to 8.9 seconds (23% decrease). Figure 1.2 shows the same comparison for a 1979 Dodge Omni with a 1.7 liter Figure 1.2: 1979 Omni fuel economy and 0 60 mph times (1) inline 4 cylinder engine with a 4 speed manual transmission. The axel ratio was 3.47:1 as received and reduced to 3.08:1 for the supercharged testing. The fuel system was switched from a Holley 2v to a Pierburg 1v most likely in order to be able to operate under boost pressure. The 6
16 results show improved fuel economy for both city and highway (about 17% and 9% respectively), as well as improved 0 60 mph time response (13% faster). Turbochargers are becoming increasingly used for improved efficiency. Unlike the supercharger, a turbine in the exhaust system powers the compressor instead of the crankshaft. The losses due to the increased back pressure in the exhaust are overcome, by the advantages of the forced induction. This makes it ideal for improved load acceptance during steady state applications where the engine performance can be designed around a smaller range of operating points. However, turbochargers have inherent disadvantages with transient performance. In a turbocharger, the compressor and turbine must be matched for a required pressure ratio and mass flow. Perfect matching can only be accomplished for one particular operating point (12). Due to this, compromises in efficiency are often made in order to enable operation over a wider range of conditions. When a turbocharged engine increases its speed, the excess turbine power needed to accelerate the turbo machinery inertia can result in what is known as turbo lag, a temporary mismatch of the turbocharger engine system. This causes reduced fuel efficiency and higher emissions during this period. A turbocharger that is optimized for steady state performance will have a considerable amount of turbo lag. To address this issue it is common practice to sacrifice efficiency even further in order to reduce the inertia and thus the turbo lag (12). Boosted engines also have the disadvantage of an increased likelihood of self ignition, commonly known as knock. This is often dealt with by a retarded spark advance. Turbocharged engines have yet another disadvantage involving exhaust gas temperatures. The maximum turbine inlet temperature can easily be exceeded during full load operation, requiring the engine to run rich in order to reduce turbine inlet temperature to an acceptable level, as well to 7
17 decrease the tendency for knock by reducing in cylinder temperature. Periods of transient response, where the engine is required to run rich, leads to higher fuel consumption and emissions (5). Testing was done to compare the differences between a turbocharger and a supercharger on a 2.3 liter spark ignition engine (4). The first objective was to optimize the turbocharger operation in two areas. First, tests were conducted to evaluate the effect of turbine inlet temperature on turbocharger performance. The stock manifold used was excessively long resulting in a temperature loss of about 56 C compared to the rerouted crossover pipe, which was 60% shorter. The shortened pipe had a significant impact in turbocharger speed change with an improvement of about 31%, while steady state tests showed only a slight improvement. Next, the effect of intake volume between the compressor discharge and the ends of the intake manifold were investigated. Through calculations it was predicted that a 25 fold increase in volume (from 40 to 1000 cu. In.) would affect the response time by 0.1 seconds. These surprising results were then verified experimentally where an increase from 50.6 cu. in. to 1174 cu. in. resulted in a delay in the range of 0.1 to seconds. Following the turbocharger optimization tests were a series of tests to compare the supercharger setup with the turbocharger setup. The supercharger used was the Bendix clutched, positive displacement type referenced earlier. The transient tests conducted consist of transient load only, from an idle condition at a set speed to wide open throttle at that same speed. The results are shown in Figure 1.3. The supercharger shows a quick response in the time it takes to develop boost, where the turbocharger comes up to ambient pressure quickly as the throttle is opened, but then develops boost at a much slower rate taking up to a second longer at 3000 RPM and never reaching full boost at the 2000 RPM condition. The slow turbocharger boost rise in the 2000 RPM condition triggered the ignition timing switch, which 8
18 Figure 1.3: Comparison of turbocharged/supercharged 2.3l EFI spark ignited engine performance of WOT transient at 2000 rpm (left) and 3000 rpm (right) (4) resulted in 6 degrees of spark retard and added to the torque difference as shown. The steady state performance tests are shown in Figure 1.4. The major differences between supercharging and turbocharging appear to be the higher temperature difference across the supercharger compressor indicating more parasitic losses, whereas the turbine in the turbocharger has a much higher level of backpressure in the exhaust, which also leads to pumping inefficiencies. Another tradeoff between these two setups was that the supercharger was capable of accepting load more quickly while the turbocharger was able to accept more load overall Waste Heat Recovery For reciprocating engines there is a rule of thirds which approximately states that only one third of the combustion energy is used as mechanical energy with another third of the 9
19 energy transferred to the cooling system and the final third wasted in exhaust heat. While modern engines are more efficient thermal energy in the exhaust still accounts for a significant amount of the total thermal energy released during combustion. A turbocharger is capable of converting some of this energy into compressed air, but there is Figure 1.4: Steady state WOT performance tests (4) considerably more energy available to a turbine than a compressor is capable of using at steady state. This leads to the method of turbocompounding where extra energy available in the exhaust that is not used for turbocharging is converted to mechanical energy with a power turbine and then transferred to the crankshaft of the reciprocating engine. Mechanical turbocompounding has an extensive history dating back to WWII with a wide range in application and arrangement (13), (14). While turbocompounding might commonly be thought of as a solution to improved steady state operation, it has been shown that if the turbines are placed in series, the compressor turbine is able to maintain higher speeds during transient load tests, which in turn improves the transient response of the system (15) as shown in 10
20 Figure 1.5. This figure shows the turbocompounded engine reaching 85% of maximum load from one half to over a second faster across the engine speed range shown. Both electrical and mechanical turbocompounding have been studied (12), (16). Mechanical turbocompounding seems to be the preferred method due to Figure 1.5: Comparison of load acceptance response between (15) the electrical system s increased inertia and its sensitivity to the high temperatures inherent in the turbocharger system (17). Other methods studied for recovering waste heat energy include Rankine bottoming cycles (16) and charge air cooling (18). Rankine bottoming cycles use exhaust heat to create a steam cycle that goes through a power turbine. Charge air cooling uses exhaust gas energy in combination with heat exchangers, suction compressors, and expanders to cool the intake air Control Strategies With the increased complexity of modern engines due to downsizing techniques, it is becoming necessary for controls to play a larger role in engine performance. Modern fuel systems are able to deliver fuel at a very controllable rate. The more difficult part of air fuel ratio control deals with precise control of the intake air. 11
21 Although there has been much research going on in the area of transient engine system control, it helps to first have an accurate and quantified analysis and evaluation of the transient behavior. This has led to the development of transient response specifications as well as the classification and evaluation of different acceleration types as shown in Figure 1.6. These correspond to throttle changes from 10 17% assuming 0% is fully closed and 100% is fully open. The speeds were changed at a constant load setting. It was shown that the driving behavior of an individual can also have an effect on Figure 1.7: Acceleration speeds and types (7) performance. Figure 1.7 shows the Figure 1.6: MAP responses according to the throttle valve opening speed (left) and acceleration type (iht) (7) 12
22 difference in manifold absolute pressure (MAP) vs. time for the different acceleration types. The air excess ratio of an automobile (7) was also affected as shown in Figure 1.8, which in turn leads Figure 1.8: Air excess ratio responses according to the valve opening speed and acceleration type (7) to poorer emissions. The engine speed response for all acceleration types except for the two slowest linear types were shown to be fairly similar indicating that there is a limit to acceleration performance as shown in Figure 1.9, and anything beyond that limit only leads to poorer fuel economy and emissions. This lead to the idea that control of throttle position, Figure 1.9: Transient response specifications of RPM (7) independent from pedal position, could be a desired control strategy for improved fuel and emissions performance. 13
23 Integration of throttle and wastegate control for turbocharged engines has been studied (3). Due to the increased need for accurate throttle control with turbine engines, control strategies have been developed for electronically actuated intake throttles for improved response. The airflow can then be controlled independently of the foot pedal position. With this setup, the driver still requests a speed or load increase, but the control of the intake throttle valve are performed by the computer controlling the overall system. Decoupling the throttle response from the foot pedal has led the way to additional improvements in air flow control. Modeling performed on an engine using GT Power engine simulation software shows the effect of different throttle arrangements for a supercharger and compares them to the effects of different fueling and wastegate management for a turbocharger (5). The engine simulations were first calibrated according to experiments involving spark advance, combustion, max combustion pressure, full load curves, etc. Once the engine model was validated, changes to the model involving the location of the throttle were implemented. Intake air can be controlled by many different throttle arrangements for a supercharged engine. The throttle can be placed either before or after the compressor. There was also the option of having a bypass/recirculating valve for the compressor on both of the previous conditions for a total of 4 different arrangements. Modeling on 3 of the 4 configurations, leaving out throttle after the compressor with bypass, showed that throttle before the compressor, with bypass, has the best low load fuel consumption with the same version without the bypass slightly higher as shown in Figure The condition with the throttle after the compressor with no bypass was shown to be much less efficient at these operating points, largely due to the operating points being at high compression ratios lying outside the original compressor map which only went up to a pressure ratio of 3. The effect of having a bypass with the throttle after the compressor was not shown. The use of bypass in this 14

24 situation could have resulted in lower pressure ratios that are inside the compressor map. This engine was compared to a turbocharged version with different variations in fuel control and wastegate control. Figure 1.10: Comparison of fuel consumptions for three types of supercharger regulation (5) The turbocharged version was shown to produce more power at reduced fuel consumption over the full load range at maximum turbo speed. The first condition was the maximum allowable torque and power with the disadvantage of poorest fuel economy. The second condition was modified by reducing fuel use at lower engine speeds, only so that the high speed power and fuel consumption is the same. The third version was the economic version where the wastegate diameter was enlarged causing both power and fuel consumption to drop. The first situation had the wastegate open during low engine speeds on the full load curve. A more optimum situation would be that the wastegate is closed at lower engine speeds and then opened at the higher engine speeds. These results lead to the idea that a larger turbocharger could reduce fuel consumption and increase efficiency (5). Another valve control approach consists of a valve system that closes off the intake to the compressor and bypasses it at low loads for a turbocharged engine, labeled as the fast response turbocharging method. This testing was done empirically due to unavailability of turbine maps and zero flow compressor maps. Figure 1.11 shows that by having zero flow through the compressor, the speed of the compressor was substantially higher at a lower load than the WOT compressor speed. This implied the possibility of improved transient response (2). 15
25 After this finding, the turbo shaft speed was limited by the use of a throttle that choked the bypassing airflow through the engine to a level low enough that the turbine had only enough power to keep the compressor speed at an acceptable level, as shown Figure 1.12: Turbocharger speed for conventional system (TA) and for zero airflow (FR) for two sub ambient pressures (2) in Figure It was also determined that bearing losses in the compressor dominated at low speeds while turbulent losses dominated at higher speeds, which helps to keep the compressor from spinning too fast. Figure 1.11: Control of zero flow compressor speed for fast response system (2) Other methods 16
26 such as use of a wastegate control to maintain shaft speed were also found to be effective, but not essential. After the effective valve areas were chosen in a manner to ensure smooth airflow transfer, transient tests were implemented. Tests were carried out where the engine speed was held constant at a low load and then the throttle was opened suddenly as shown in Figure Figure 1.13: Transient response of conventional ( ) and fast response ( ) system (2) It was found that when initial low load turbo speed was below steady state full load speed, manifold pressure immediately following fast throttle opening was above ambient pressure but less than full load. If the initial low load turbo speed was above steady state full load speed, the manifold pressure would temporarily exceed steady state full load pressure while the turbo speed decelerated. When installed in the same automobile, the fast response system showed significant improvement over the traditional system as shown in Table 1.1. The fast response system also allowed the turbine shaft to maintain its speed during gear changes. Some drawbacks to this system were the complexity of the mechanical valve linkages and the possibility of surge instability, although in the experiments carried out, no evidence of surge was found. There were additional measures suggested that could help suppress surge oscillations if 17
27 Table 1.1: Level road acceleration tests (2) present. Overall, the fast response system was shown to improve performance over a conventional turbocharging system (2). Air cycle calculations were carried out to investigate several load control strategies as alternatives to throttling for an Otto cycle engine (19). This study was motivated by the fact that Otto cycle engines are not capable of the part load efficiencies of a diesel engine due primarily to throttling losses. After presenting the base case of a throttled engine (strategy I), several alternatives were presented consisting of variable fueling, variable compression ratio, and early intake valve closing. After studying the tradeoffs between these strategies, the final two strategies for comparison consisted of versions of variable valve timing with boost. The first strategy met load demand first with boost, and if no boost was available, would utilize delayed intake valve closing (strategy V I). The second concept delayed valve timing first, then used turbocharger boost to meet the high load demands (strategy V II). The results indicated that the first method had increased thermal efficiency and reduced peak pressure over the second method as shown in Figure Then when compared to the naturally aspirated throttled engine, it was shown that there are efficiency gains over the full range of loads, as well as peak pressure reductions over much of the range as shown in Figure
 and ratio of")
 and ratio of peak pressure of")


28 Figure 1.14: Ratio of efficiency of strategy V I to strategy V II for different values of F (left) and ratio of peak pressure of strategy V I to strategy V II for different values of F (right) (19) Figure 1.15: Ratio of efficiency of strategy V I to strategy I for different values of F (left) and ratio of peak pressure of strategy V I to strategy I for different values of F (right) (19) 1.3 SuperTurbo The SuperTurbocharger is a concept currently being developed by VanDyne SuperTurbo. As shown in Figure 1.16, it allows power to flow from the crankshaft to the turbine shaft to supplement turbine power when substantial boost is needed and it also allows turbocompounding where excess turbine power flows back to the crankshaft. As Figure 1.17 illustrates it combines the advantages of a Figure 1.16: SuperTurbo power flow diagram 19

29 Figure 1.17: The SuperTurbocharger combines the advantages of a supercharger and a turbocharger as well as eliminating some of their individual disadvantages supercharger and a turbocharger while eliminating some of their individual disadvantages. The rationale for design consisted of a comparison of double stage turbocompound, single stage turbocompounding, and electrical turbocompounding to the already established single stage conventional turbocharger setup. It was decided that the thermal sensitivity and added inertia of the electrical system were larger drawbacks than the mechanical and packaging constraints inherent with the single stage mechanical SuperTurbocharger concept. Initial modeling work was done with GT Power on an 11 liter Hyundai natural gas engine (17). The modeling showed an improvement in brake specific fuel consumption (BSFC) of as much as 10% for high speed and load as shown in Figure This was due in part to the extra 22kW of power available from the turbine shaft, which was estimated to make up approximately 6% of the total power output. 20

 engine, but was considered over others due to the variable nozzle turbine feature that increased the controllable parameters.")


30 The Hyundai engine was not available for testing, so a Mack E7G engine with similar geometry and performance was selected. The turbocharger selected was not ideal for this Figure 1.19: Simulated improvement in BSFC of Hyundai natural gas engine with mechanical/hydraulic transmission to transfer power between crankshaft and turbine shaft (17) engine, but was considered over others due to the variable nozzle turbine feature that increased the controllable parameters. The turbocharger was left unmodified except for the turbo shaft, which was modified for a planetary gear arrangement. Once the speed was reduced significantly from the planetary gear arrangement, it was connected to the crankshaft through a continuously variable hydraulic transmission. Testing showed an almost 6% gain in BSFC at high engine speed and load as shown in Figure 1.19, while also showing reduced efficiency at other operating points. These results were consistent with the belief that the current turbocompounding setup was not as optimized as it would need to be to fully realize these benefits due to turbocharger miss match and the Figure 1.18: Improvement in BSFC for Mack E7G engine with SuperTurbocharger compared to stock turbocharger (17) use of off the shelf 21
 indicate a slight improvement in torque at lower speeds.")

31 hydraulic transmission components. Wide open throttle (WOT) results shown in Figure 1.20 Figure 1.20: WOT curve for MACK E7G with SuperTurbocharger and stock turbocharger (17) indicate a slight improvement in torque at lower speeds. These results were thought to be less than optimal due to the pressure limits on the hydraulic system as well as the overall limits of the speed ratio between the turbine and crank shaft. During a load acceptance test from 50 ft lb to 400 ft lb at 1600 RPM, the two methods were almost identical in load acceptance up to 300 ft lb. The major difference was once boosting was required to get from 300 to 400 ft lb, the SuperTurbo application was able to accept the load in less than 1.5 seconds due to the supercharging effect of using crankshaft power to supplement turbine power, while the regular turbocharger application took almost 13 seconds to reach full load as shown in Figure Some challenges realized were the turbocharger mismatch due to unavailability of turbo maps from the manufacturer, as well as the inefficiencies of the hydraulic transmission chosen for this application due to non optimized operating points (17). Since its first prototype demonstration, VanDyne SuperTurbo has spun out of its parent company Woodward Governor to focus more on automobile applications. 22
 Current work has focused on development of a SuperTurbo application for a 2L Volkswagen inline 4 cylinder engine as a")
32 Figure 1.21: Step change response of a SuperTurbocharger compared to stock turbo (17) Current work has focused on development of a SuperTurbo application for a 2L Volkswagen inline 4 cylinder engine as a downsized candidate for replacing a larger 3.2L V6 engine. Using engine data to compare the SuperTurbo L4 with a naturally aspirated 3.2L V6, it was estimated that the EPA city fuel efficiency would increase by as much as 17% (6). Transient load simulation tests showed a time of 0.3 seconds to reach production Brake Mean Effective Pressure (BMEP) limit and 0.36 seconds to reach 90% of the peak BMEP for this configuration as shown in Figure As shown in Figure 1.23, the WOT torque curve of the SuperTurbo L4 engine exceeds the naturally aspirated V6 except for the 1000 RPM operating point which is likely not to be experienced by the engine due to the stall speed limit on the torque converter and the fact that the vehicle s acceleration will be accompanied by an increase in engine speed. At wide open throttle the BSFC was higher on the SuperTurbo version as expected due to the need for retarded timing to prevent knock, which led to higher temperatures than the turbine could stand, which in turn led to fuel enrichment and higher BSFC numbers as shown in Figure Although the BSFC numbers were higher than the naturally aspirated configuration, they 23
33 Figure 1.23: SuperTurbo transient response for a pedal snap from 2 bar BMEP to WOT at 2000 RPM. The engine reaches 90% of the peak in 0.36 seconds (17) were still lower than expected stock engine values due to the added advantage of turbocompounding. The current development of the SuperTurbo consists of a new design for the high speed section of the transmission as well as new concepts for the continuously variable transmission (CVT) part of the SuperTurbo. The high speed section of the transmission makes use of traction fluid instead of gears for the planetary set up which is supposed to be more efficient at the high rotational speeds Figure 1.22: Torque curve of the SuperTurbocharged 2.0 Liter versus a N/A 3.2 Liter V6 (17) associated with a turbocharger. The focus of this 24
34 project will be the calibration and use of an already developed engine model with a SuperTurbo model added in to see what efficiency gains are possible with this technology. Figure 1.24: Full load efficiency curve of the SuperTurbocharged 2.0 Liter versus a N/A 3.2 Liter V6 (17) 25
35 CHAPTER 2: ENGINE MODEL 2.1 GT Power Engine simulation software is becoming increasingly common as evidenced by its use in the above examples. Its iterative use during the phases of engine concept, design, and development for a turbocharged engine has been thoroughly investigated (20). Most engine simulation software makes use of 1D flow simulation to approximate the flow behavior due to the highly reduced computational demand. With simulation software, the performance of new concepts can be investigated during the design process. These models are often based on previously developed models from existing engines. Although this is an approximation, it can still provide valuable insight into concept performance at a low cost. The major computations involve the gas conditions in the pipes. This leads to a calculation of the trapped air mass used in the combustion calculation to determine the indicated mean effective pressure (IMEP). Friction and pumping losses (FMEP and PMEP) are subtracted from IMEP to give predicted performance. This dependency makes the later calculations involving performance less accurate than the initial calculations about gas conditions. A fully developed model relies on test data, which is typically not available during the initial concept stage of the engine. This requires assumptions to be made or data to be taken from elsewhere. The combustion model requires in cylinder pressure data that must be estimated from similar engine data in the absence of test data. Until data is available for correlation, the accuracy will be affected according to how close the assumed data matches test data. Application to the design process includes optimization of the intake and exhaust 26
36 manifold, variable valve timing if available and turbocharger match. While going through the iterative process of choosing a proper turbocharger, it is important to work closely with the design engineers to realize all of the constraints in the design. GT Power can be a valuable tool for selecting a particular turbocharger based on the tradeoffs between minimizing the turbo lag for low speed torque and higher power output. The modeling of the compressor and turbocharger is accomplished with the use of compressor and turbine maps, which relate pressure ratios to mass flow for constant speed lines and efficiency contours. The simulation software assumes quasi steady flow, meaning that it assumes steady flow relationships at instantaneous conditions. However, the unsteady flow that a turbine experiences is most likely outside the turbine map provided by the manufacturer. An extrapolation method is suggested by the software manufacture to account for this. When modeling the effect of a turbocharger, it is suggested that the inlet conditions be set to the compressor outlet conditions and a nozzle added to the exhaust to simulate the backpressure from a turbine. This gives a good estimate, but does not take into account the link between intake and exhaust. Once a prototype engine is available, it is likely that test data is available to validate and update the current model to provide greater accuracy. For turbocharged engines correlation data is very important because the model is especially dependent on turbocharger performance, particularly at low speeds where the wastegate is shut (20). As shown in Figures , a close match to test data can be modeled to within about 5% accuracy for most of the speed range of this WOT test. Discrepancies in volumetric efficiency are attributed to the combustion model as shown in Figure 2.1. The difference between compressor pressure outputs in Figure 2.4 is due to the difference in tested and manufacturer supplied compressor efficiency. The heat transfer model 27
37 used for the exhaust is cited as the cause for turbine inlet temperature discrepancies in Figure 2.5. These discrepancies are thought to cause the air flow and torque discrepancies of Figure 2.2 and Figure 2.3. With the proper correlation data, an engine s performance can be modeled with Figure 29: Volumetric efficiency correlation (20) Figure 28: Airflow correlation (20) Figure 27: Performance Correlation (20) Figure 26: Compressor Outlet Conditions (20) validated accuracy. With the proper test data to validate a model, it is still possible to investigate different design strategies Figure 25: Turbine Inlet Conditions (20) that deviate from the original model, but at a reduced level of accuracy. 28
 received of a 2.0L L4 turbocharged GDI engine is validated against test data (6).")
38 2.2 Stock model from Volkswagen GT Power is chosen as the modeling software due to the availability of a previously developed stock engine model from Volkswagen. The original model Southwest Research Institute (SwRI) received of a 2.0L L4 turbocharged GDI engine is validated against test data (6). Although it is cited as being validated, it is unknown to what extent the original model is validated. Additional validation is carried out for this project using a more extensive data set provided by Volkswagen that covers the entire speed and load range. The original model did not have a throttle so it is likely only validated against WOT data with the timing parameters set for WOT operation only. The data provided by Volkswagen is contained in Appendix A. A map view of the simulation layout along with a map view of the controls layout is shown in Figures 2.6 and Figure 30: Main View of GT Power Model in original form from Volkswagen 29


39 2.7, respectively. The map view of the engine model has several of the major components labeled. On the left side of the map view, the tree view shows all of the parts currently set up to use in the model. The majority of the components used are pipe objects as they represent the flow boundaries throughout the system. Figure 31: View of the controls page dealing with temperature corrections, wastegate control, and lambda control. For this original model the wastegate is set up to control desired engine brake mean effective pressure (BMEP) since there is no throttle. For this project a throttle is added and the wastegate is used to control boost pressure rather than BMEP so that the throttle is able to independently control BMEP. The original model contains two sets of maps for both the turbine and compressor. The GT Power model is set up to run until it converges based on several requirements specified in the Run Setup menu. There are a maximum number of periods or engine cycles the 30
40 user must specify that the simulation will not go over, but it will not necessarily converge by this point. The output file provides information on the number of cycles run for each case and convergence. There are also a minimum number of cycles the user can set that the simulation must run before being allowed to stop even if all the convergence parameters are met. In the flow convergence tab a mass flow steady state auto shut off limit is set. There is another tab that lets the user select which result (RLT) variable should converge before the simulation ends. RLT variables are the single valued results such as averages, maximums, and minimums during a cycle as opposed to instantaneous values which are usually plotted versus crank angle or time. The RLT variables that are listed to define convergence are the turbine shaft speed, the shaft torque imbalance between the compressor and the turbine, BMEP, and the orifice diameter of the wastegate. With the exception of the shaft torque imbalance being set to target zero, the parameters are set to converge on a cycle to cycle basis all within a certain user defined tolerance. 2.3 SuperTurbo added by SwRI The main addition to the model by SwRI is the transmission between the turbocharger and the engine crankshaft. In some of SwRI models the wastegate is removed while it remains in other versions of the model from SwRI. The most used version has a gear ratio controller that would adjust the gear ratio according to a desired air mass flow rate through the compressor. The addition of the CVT to the SuperTurbo transmission presents challenges with torque oscillations due to the cyclic behavior of the engine and the pressure pulses on the turbine. It is assumed during the initial modeling done by SwRI that the final version of the transmission will have some way of dampening these oscillations (6). This method is not yet finalized so the SwRI model without the gear ratio control and with wastegate control is used for this project. To deal 31
41 with the torque oscillations the SwRI model senses a torque value from the SuperTurbo shaft. These sensed instantaneous torque value are then averaged over two cycles at an interval of twelve times per cycle. This averaged value is multiplied by the efficiency if it is positive and divided by the efficiency if it is negative. This final value is imposed on the shaft labeled ST_TQeff_shaft_01 with a torque object which is in turn connected to the CVT transmission as shown in Figure 2.8. In addition to the assumption that the final version of the CVT will include damping, it is also assumed that the mechanical efficiency will be 80%. GT Power defines the efficiency based on torque so that torque out will be 80% of the torque in value. This Figure 32: SuperTurbo Model added by SwRI efficiency is an estimation and will need to be modified once data is available on efficiency versus speed, load, gear ratio and parasitic losses. 32
42 2.4 Stock Engine Model Tuning In addition to the modification to the SuperTurbo model, there are several changes that need to be made in order to compare the stock simulation against the stock test data. The original model is set to operate at wide open throttle, so it has no information or controls to allow operation at part load or throttled operation. In addition, the engine has several parameters that change depending on both load and engine speed such as ignition timing, camshaft timing, and injection timing. An example of these timing events relative to crank angle and piston location is shown in Figure 2.9. This extended validation concentrates on getting a Figure 33: In Cylinder Timing Events close match for BMEP and BSFC while also checking that other parameters do not have excessive discrepancies. In order to isolate different tuning effects the original model is stripped down to start at the intake manifold and end at the exhaust manifold. This version of the model is labeled m1. 33
43 Intake and exhaust manifold pressures and temperatures are available from test data to set as ambient intake and exhaust conditions for this configuration. This configuration allows for isolated tuning of parameters within this flow path of the engine. Another advantage model m1 has over the full engine model is the elimination of the turbocharger and associated wastegate control. The wastegate control and turbo lag associated with the turbocharger s large inertia take a considerable amount of computational time to converge to steady state values. The elimination of this part of the model allows for much faster tuning of the parameters that are independent of the turbocharger operation except for minor pressure pulse effects. To get the most accurate comparison several parameters from the test data are specified for the engine in the design of experiment (DOE) setup folder. The parameters imposed on the model from test data include compressor outlet temperature, compressor outlet pressure, turbine inlet temperature, turbine inlet pressure, ignition timing, fuel injection timing, fuel injection duration, lambda, camshaft timing, and engine speed. Since the original model is set up for WOT operation only, it has no information or controls for these parameters during part load operation. The lambda values available from test data are imposed on the model as targets. In the controls page of the model there is a group of objects used to control the amount of fuel injected based on the desired lambda value and the air flow through the engine. For turbocharged engines this is an especially important aspect since fuel is often used to cool down the turbine at high engine speeds and loads. If the temperature limit is exceeded the turbine can expand and cause catastrophic failure. Extra fueling is also sometimes used to prevent predetonation. The injected fuel mass is an important parameter for characterizing the improvements in BSFC. 34
44 The first parameter to tune in model version m1 is the camshaft timing data. While all of the other timing parameters are referenced relative to the crank shaft top dead center (TDC) position the crankshaft timing data is not referenced to anything. The timing has to be referenced to before or after TDC and can be referenced to the crankshaft angle or the camshaft angle. All of these possibilities are run and the case with the closest BMEP match to the test data is chosen. While this initial tuning is able to show an overall BMEP trend match to test data for the camshaft timing reference chosen, the model is not able to reach as high of values for BMEP as the test engine is able to at lower loads as depicted in Figure The error is larger as the reference BMEP is reduced. Analysis of IMEP, trapped air mass and other parameters indicate that the FMEP model is inaccurate. At higher loads this difference is not as significant since FMEP is a smaller fraction of IMEP. Figure 34: Error in BMEP values for modeling data compared to test data GT Power uses the Chen Flynn engine friction model to calculate FMEP values as shown below FMEP (bar) = C + PCPF + MPSF + MPSSF where, C = Constant Term PCPF = Peak Cylinder Pressure Factor 35
45 MPSF = Mean Piston Speed Factor MPSSF = Mean Piston Speed Squared Factor The C value for the original model is set at bar when the recommended value for this is suggested by the GT Power Help Navigator to be between 0.3 and 0.5 bar. Several different versions of FMEP were modeled by varying the different coefficients to be mostly within the range suggested by GT Power in an effort to lower the error in the low BMEP range of the map. The old and new output of the FMEP model is shown in Figure Ideally there would be test data for FMEP values so that the FMEP model could be evaluated directly, but unfortunately this data is not available. After this change the BMEP error Figure 35: FMEP Model Output from GT Power comes down to more acceptable levels as shown in Figure The next step in tuning the stock model consists of adding a throttle component to the model and extending the inlet conditions back to the outlet of the compressor. The addition of the throttle makes this model m2. The new inlet conditions are then set to the outlet conditions of the compressor based on the available test data. The flow through the throttle is based on an array of discharge coefficients versus throttle angles. The discharge coefficients are defined by the ratio of effective flow area to the reference flow area which originates from the isentropic velocity equation for flow through orifices. The flow coefficients were determined as follows: First, an initial guess is used and a simulation ran over the BMEP range for an engine speed of 36
46 1000 RPM at the throttle angles listed in the test data. The model predicted pressure drop values were compared with test data and then the flow coefficients were adjusted iteratively Figure 36: Error in BMEP values for modeling data compared to test data until a close match is achieved. This is done for 1500 RPM as well and then the results were applied to the whole speed range to verify that they are a good match for the entire speed range. GT Power has an Excel spreadsheet that calculates coefficients automatically if the specified test data is available. The final step of validating the model against test data requires the addition of the turbocharger into the model (model m3 and m4). As previously mentioned the wastegate in the original model is used to control BMEP instead of the more typical configuration of controlling boost pressure. Since the throttle is controlling BMEP, the wastegate controller is altered to control the desired boost pressure sensed after the intercooler. The reference boost pressure is based on post intercooler pressure measurements from the test data. The final comparison will consist of two configurations. In the first round of this final comparison the throttle angle will continue to be specified based on the test data (model m3) while the second round will use a throttle controller object that will adjust to give the desired BMEP (model m4). This will allow for the comparison of matching parameters based on the 37
47 exact throttle angle, and a slightly different version where the throttle angle can vary to give the referenced BMEP values. The test data imposed on this simulation configuration include ignition timing, injection timing, injection duration, camshaft timing, lambda values, and engine speed as well as the throttle angle added for the previous configuration. In addition to these, reference boost pressure sensed after the intercooler is added as a target for the wastegate controller. Depending on the simulation type mentioned above, reference BMEP will also be used in place of the imposed throttle angles and the throttle will be controlled to try to match this reference BMEP value. The results from these simulations show a close overall match to the test data for both configuration setups. While the first version has larger BMEP difference, the second one has throttle angle differences as expected. The for the configuration where throttle angle was adjusted to match BMEP values the average BSFC error is about 3.2% with a standard deviation of 4.3%. Even though most of the parameters of importance match well with test data, the exhaust temperatures are much higher than those reported in the test data. This would have been apparent with the earlier models, except this parameter is not directly compared upstream of the boundary conditions that are specified to match the test data in model m1. It appears that there are heat transfer discrepancies between the model and the test data that have not been accounted for since the individual exhaust runners were all indicating higher exhaust temperature directly out of the cylinder model. This difference is likely due to several issues unrelated to the heat transfer model of the cylinder. The precise location of the measurement is unknown. The measurements themselves are difficult to interpret due to radiation and conduction losses that need to be accounted for. Additionally, the temperature at 38
48 this location is undergoing rapid oscillations. The errors in the GT Power model as they correlate to the given test data are also dependant on the inherent error in the actual measuring of the test data. GT Power s manual indicates that this is to be expected and correlations are given to how much these exhaust temperatures are likely to be off depending on different wall and ambient air temperatures. Another noticeable difference is the modeling output of the turbine pressure and temperature drops across the turbine. More research into the details of the GT Power turbine model reveals some possible reasons for these differences. The turbine map data entered into GT Power goes through pre processing which extrapolates the data over a wider range and fits it to a curve for use in the actual simulation. In post processing there are plots which indicate how well the turbine data is suited for this processing. Analysis of the plots reveals that both sets of turbine data provided in the original model are for a very narrow range compared to the range that the turbine data will be extrapolated out to as shown in Figure Data for the first turbine map does not fit the normalized curve as well as the second turbine map and the pressure ratio curve for the second turbine map also gives a better fit as shown in Figure The efficiency curve of the second map is less smooth and shows two local maximums when it is desirable to have only one maximum. This leads to an experiment comparing two simulation runs with the two different turbine maps. The results from the second turbine map are very similar to the results of the first map with a few exceptions. The second turbine map is unable to produce results for a few of the low load, low speed cases. This is presumably due to the fact that the data seems to be slightly more towards the higher end of the blade speed ratio (BSR) line causing the low speed, low load operating points to use data extrapolated out to a distance that is unreliable. The second map does not match the temperature 39
49 Figure 37: Turbine Map Data Analysis Plots for Turbine Map 1 (above) and Turbine Map 2 (below) Figure 38: Turbine Map Data Analysis Plots for Turbine Map 1 (left) and Turbine Map 2 (right); the Blade Speed Ratio (BSR) is used for normalization and extrapolation calculations in GT Power and pressure drops across the turbine as well as the first turbine map, although the difference between the two are much smaller than the overall difference from the test data. Since the second map does not match as well the best option is to continue using the first map. Despite 40
50 these obvious faults of the model, they will still serve as a useful tool for evaluating a comparison between the original stock engine model and a SuperTurbo version of the model. While it is preferable to have a more extensive set of data that will allow for more precise correlation, as well as more information about the iterative build up of the model, the current model will still be adequate in serving its purpose of showing improvements to the SuperTurbo model over the stock engine model. 41
51 CHAPTER 3: ENGINE SIMULATIONS With a stock simulation model ready for use simulations are run to see where efficiency improvements can be made and then the SuperTurbo version is ran for comparison. The stock model is modified to be able to run at engine speed and load points not listed in the test data. Stock model runs at these new data points are analyzed to see what areas of the BSFC map may offer the most improvement. The SuperTurbo is added to the model to evaluate the improvements. 3.1 Simulation of Stock Engine Configuration For the remaining simulations the engine model is modified to be able to run at operating points other than those listed in the test data. This allows operation between test data points where the exact load and speed dependant parameters are not provided. The new data points are at BMEP intervals of one bar and engine speed intervals of 500 RPM. The results from this simulation are analyzed to see areas of potential BSFC improvements. Modifying the model to be able to run at points other than those listed in the test data is accomplished through the use of the neural network tool in GT Power. Neural networks consist of interconnected processing elements called neurons which work together in parallel to compute an output based off one or more inputs. Neural networks are trained to interpolate the nonlinear behavior of important engine parameters that vary based on engine load and speed. The neural network tool consists of a training tool and a neural network control component for use in the simulation model. The neural network training tool teaches a neural 42
52 network the desired output based on a given set of inputs. The use of neural networks instead of a simple look up table has several advantages such as being able to determine the output in a shorter amount of time, being able to handle data where linear interpolation is insufficient, and being able to handle more inputs. The different training methods are briefly explained in the Train Neural Network document provided with the software (21). Once the neural network is trained, a file is created that can be accessed by the neural network control component for use in any model. To train the neural network, the user specifies input data such as BMEP and engine speed values. The desired output values are entered, such as camshaft timing, ignition timing, etc. The user selects one of the various training methods or lets the software automatically choose one. If automatic is chosen the software runs several training methods and output the results of the method that provided the lowest root mean square (RMS) training and testing error. As a built in default, the training methods set aside 10% of the data to validate the training once the training is complete. Parameter modeling using this method consists of ignition timing, injection timing, injection duration, camshaft timing, lambda values, reference boost pressure, and reference BMEP. With a more general model capable of running at any point within the range of engine speeds and BMEPs, the model is run for comparison against a SuperTurbo configuration. Since wastegate data is not included in the test data, the modeling is split into two sections with overlap in the transition area. One section contains data points where the wastegate is closed. The second set uses the wastegate to control desired boost. Based on results from the stock engine modeling there are several areas of possible BSFC improvement. The first case occurs when the wastegate is open. With typical turbocharger configurations the wastegate is open when the exhaust gas supplies the turbine with more energy than the compressor is able to effectively use. This area of the map covers the higher 43
53 Wastegate Flow Mass Flow (g/s) BMEP (bar) Engine Speed (RPM/1000) 10 0 Figure 39: Wastegate flow versus engine speed (RPM/1000) and load (bar) engine speed and load regions of the engines operating range as shown in Figure 3.1. The wasted exhaust gas flow corresponds to the additional energy available that can be used for turbocompounding with the red highest flow area able to show the most improvement. The wastegate diameter is evaluated using the model by controlling the diameter based on desired boost pressure input from the test data available. With the SuperTurbo configuration the wastegate is closed and the gear ratio is controlled to act as a brake on the turbine so that it does not over speed. This braking energy is fed back to the crankshaft through the transmission. The second case occurs when the compressor is creating boost pressure that is not needed. The compressor uses energy from the turbine to create boost and the throttle is actuated to control engine load so that much of the energy spent on creating boost is lost through the pressure drop across the throttle. This is done with the stock configuration to keep turbine speeds high. Even though boost is not needed the stock configuration creates the boost in anticipation that boost will be needed soon. The turbo speed is kept high and a recirculation valve is used when the boost is not needed. Once boost is needed the turbo is already at or near 44
54 a speed where it is able to adequately provide boost so that turbo lag is less of an issue. The area of the map with boost pressure higher than atmospheric pressure and manifold pressure less than atmospheric pressure covers a large area of the map except for high load cases where the throttle is at or near wide open position and low load and speed cases where the boost pressure is already near atmospheric as shown in Figure 3.2. The wasted boost pressure is calculated by subtracting manifold pressure from boost pressure if manifold pressure is greater Wasted Boost Pressure 0.4 Pressure (bar) BMEP (bar) Engine Speed 2 (RPM/1000) Figure 40: Boost pressure created by the compressor that is unneeded than atmospheric pressure and by subtracting atmospheric pressure from boost pressure when manifold pressure is lower than atmospheric pressure. The compressor is wasting the most power in the red higher pressure difference area so it should show the most improvement. When boost pressure is not needed the compressor can be controlled to provide almost no boost with the braking energy going to the crankshaft instead of being wasted. Reduced low load compressor use also has the advantage of supplying the cylinder with cooler air. Since the air is not being compressed as much before passing through the throttle restriction the intake air temperature is denser due to its lower temperature. 45
55 Another source of improvement is the substitution of the stock turbine design for a new turbine design that is optimized for this type of application. Turbochargers have a tradeoff between turbine efficiency and turbo lag. The turbine must be larger in order to be more efficient causing the turbo lag to increase. With the SuperTurbo design the turbine inertia is less of an issue since engine power is available to accelerate the turbine so the size can be increased to make it more efficient. 3.2 Comparison of SuperTurbo Model to SuperTurbo Test Data While development of the SuperTurbo is in the early stages some test data is available which demonstrates turbocompounding ability. The configuration consists of the high speed section of the SuperTurbo and a fixed gear ratio pulley between the high speed section and the crankshaft. In addition it utilizes the lower efficiency stock turbine. The test data currently available uses a pulley from a 4000 RPM max load test at 2707 RPM part load conditions. Unfortunately, the engine speed and load tested do not deviate much in ratio from the 4000 RPM full load condition so the improvement is not as much as it could be for this operating point. While there is some turbocompounding benefit due to the wastegate being closed the gear ratio is not optimal for this condition since the boost pressure is higher than the required manifold pressure and the throttle is not wide open. The more optimal comparison for this operating point would be at a condition where the throttle is wide open or a gear ratio where wasted boost is not created. The model is run with the parameters available from test data imposed into the model. These include lambda, ignition timing, gear ratio, and atmospheric conditions. While not all of the results match the test data parameters that are available they are close enough of a match to provide validation in terms of turbocompounding ability. While the ignition timing is imposed 46
56 on the model from the test data, there seems to be some discrepancy with regards to the combustion model with the 50% burned crank angle location being a couple of degrees off. The BMEP and IMEP(360) data points show less than one percent difference and the IMEP(720) data shows about two and a half percent difference. However, the FMEP data show a difference of sixty percent. This is due to the way it is calculated. The BMEP value is calculated based on the brake torque measured. This gives an unrealistic number for the actual in cylinder BMEP value since it now incorporates turbocompounding power. Since the BMEP now incorporates turbocompounding power, the calculation of FMEP based on BMEP, IMEP(360) and PMEP is off. The modeling data is available for comparison in Appendix D. The BSFC values are between one and two percent off but it is still possible to determine the benefits of the turbocompounding by comparing the SuperTurbo model to the stock model at these same conditions. The BSFC improvement of the SuperTurbo model over stock model is about 1.2%. The amount of torque added to the crankshaft in the test data is 4.31 Newton meters (N m) which is close to the modeling prediction of 4.51 N m. This close match of transferred torque provides validation that the model is capable of predicting the improvements due to turbocompounding. 3.3 Simulation of SuperTurbo Engine Configuration The SuperTurbo configuration incorporates a new turbine wheel in production form so a different model is used for the SuperTurbo turbine. Since the design is not fully developed and tested a simplified version of a turbine is modeled. GT Power has a simplified turbine model that predicts output power, mass flow rate and outlet temperature using an orifice flow model and imposed efficiency. The new turbine design is capable of much higher efficiencies than a normal turbocharger turbine since there is no longer a tradeoff between turbine inertia and turbo lag. 47

57 The differences in the two designs are illustrated in Figure 3.3. The figure shows that the new turbine design has noticeably longer blades and a larger inlet area. The orifice diameter in the model is determined based on matching the pre turbine pressure of the stock configuration at 5000 RPM full load with the SuperTurbo version at the same load, but with the wastegate closed. The final configuration is split into a high load section where boost is needed, and a low load section where boost is not needed. The high load cases will have a wide open throttle and will use the Figure 41: The new turbine design has a wider inlet area to allow less back pressure as well as longer blades to improve efficiency SuperTurbo gear ratio to control engine load. The limit on how low of a load can be achieved with this method is dependent on the compressor pressure ratio. Modeling of pressure ratios below one without test data is not recommended by GT Power due to the need to extrapolate the available data out to these points. The second section uses the throttle to control load while the SuperTurbo gear ratio is used to control the speed of the compressor such that its pressure ratio remains slightly above one. Initial modeling with the simple turbine reveals that flow convergence parameters are not converging for some cases. The flow convergence is specified in terms of change in mass and pressure flow from one period to the next at any flow path location. The location of the changing flow is further down the exhaust stream in the muffler section of the model. The source of this is thought to be due to the simple turbine having less of a pressure drop across the turbine part of the system. While the pressure drop across the turbine is the same, the stock 48
58 model s wastegate is open allowing for more of an overall pressure drop which dampens the pressure oscillations coming from the engine. Due to this the flow convergence parameters were slightly relaxed from a fractional value of.002 to Results The primary parameter of interest for this modeling is brake specific fuel consumption (BSFC). The results show improvement in BSFC over the entire range of the map as shown in Figure 3.4. The improvements correspond to the predicted areas of improvement in the range of BSFC Improvement % Improvement BMEP (bar) Engine Speed (RPM/1000) Figure 42: Brake specific fuel consumption improvement over stock engine 2 6 % over stock conditions. The high load and speed areas are affected more by turbocompounding from the wastegate being closed as shown in Figure 3.5. The middle to lower region is affected most by the reduced losses associated with using energy to compress air that is later restricted by the throttle as Figure 3.6 illustrates. The power transfer from the turbine to the crankshaft is higher with increasing speed and load as shown in Figure 3.7 maxing out at 6000 RPM 14 bar BMEP. This correlates well with 49
59 Figure 44: At this higher load point the contribution from turbocompounding dominates the Figure 43: Brake specific fuel consumption improvement over stock engine as low load case where BMEP contribution from the turbocompounding as shown in Figure 3.8. This contribution means the in cylinder power requirement is reduced resulting in overall fuel savings. BMEP contribution is obtained by calculating in cylinder BMEP values as listed below and subtracting that number from the overall BMEP for the entire engine system reported by GT Power. 50
60 Turbocompounding Power Power (kw) BMEP (bar) Engine Speed (RPM/1000) Figure 46: Power transferred from SuperTurbo to Crankshaft Turbocompounding BMEP Contribution Pressure (bar) BMEP (bar) Engine Speed (RPM/1000) Figure 45: BMEP contribution from Turbocompounding 51
61 BMEP = IMEP(360) + PMEP FMEP where, BMEP = Brake Mean Effective Pressure IMEP(360) = Indicated Mean Effective Pressure (during compression/combustion stroke) PMEP = Pumping Mean Effective Pressure FMEP = Friction Mean Effective Pressure The mid to lower load region of the map is improved by the reduced use of the compressor when it is not needed as illustrated in Figure 3.9. The mid region of the map saves Pressure (bar) Comparison of Average Pressure Through Engine at 3000 RPM 8 bar BMEP Location Through Engine Stock SuperTurbo 1 Compressor In 2 Compressor Out 3 Intercooler Out 4 Intake Manifold 5 Pre Turbine Figure 47: Pressure at different locations through the engine for 3000 RPM 8 bar BMEP up to three or four kilowatts that are typically wasted by the compressor due to the SuperTurbo control of the gear ratio as illustrated in Figure The difference is due to the ability of the superturbo to control the pressure ratio of the compressor. At low loads where the intake manifold pressure is below atmospheric the pressure ratio is controlled to be just above one where at higher loads the throttle is wide open and the gear ratio is controlled to give the required manifold pressure. This power difference correlates well with Figure 3.2 above showing areas where boost pressure is not needed. This reduction in power also corresponds to a reduction in in cylinder power requirement for the same brake power. 52
62 Compressor Power Difference 4 6 Power (kw) BMEP (bar) Engine Speed (RPM/1000) 1 Figure 48: Power transferred from SuperTurbo to Crankshaft While the wasted compressor boost pressure and power goes down with lower gear ratio as shown in Figure 3.11, the PMEP rises slightly with decreasing gear ratio even though pressure drop across the throttle is decreasing as shown in Figure From the stock configuration to the superturbo configuration there is a reduction in pumping losses, but as the gear ratio is reduced the pumping losses gradually creep higher. The reduction in pumping losses at this location comes from the reduced backpressure of the improved turbine design as illustrated in Figure With the stock gear ratio imposed there are additional pumping losses on the intake side due to the slightly lower manifold pressure. These losses are made up for by the higher reduction in pumping losses on the exhaust side. As the gear ratio is reduced the exhaust pressure drops, but not as much as the intake pressure drops which causes a very slight increase in pumping losses. These pumping losses are insignificant compared to the reduced compressor power losses shown above leading to overall BSFC improvement. 53
63 Figure 50: Wasted boost pressure and compressor power as a function of SuperTurbo gear ratio A comparison of the log pressure vs. volume (P V) plots shows the difference in intake and exhaust pressures in Figure For the 3500 RPM 4 bar BMEP case the savings from lower exhaust back pressure clearly makes up for the lower intake manifold pressure. For the higher load case of 15 bar BMEP the pumping losses are higher than stock as illustrated in Figure For this case the backpressure is close to stock, but the intake pressure is reduced enough to Figure 49: While the pressure drop across the throttle reduces with gear ratio, the pumping losses increase slightly 54
64 Figure 51: The reduced backpressure more than compensates for the increased pumping losses from the reduced intake manifold pressure cause an overall increase in pumping losses. Although the pumping losses are higher compared to stock, they are insignificant compared to the turbocompounding benefit. The intake manifold pressure is lower for the SuperTurbo configuration over the entire operating range as shown in Figure The entire area has a reduction in pressure of about 2 7%. This is to be expected since the cylinder does not need as much air to create the same overall power in the system. While the new turbine design allows reduced backpressure for much of the operating range as shown in Figure 3.17 the higher speed Figure 52: Log P V plot comparing pumping losses at 3500 RPM 4 55
65 and load area has higher backpressure due to the wastegate being closed for turbocompounding. These pressure differences correlate to lower pumping losses in the mid range of the engine while the high load and high engine speed Figure 53: Log P V plot comparing pumping losses at 3500 RPM 15 area of the engine experiences higher pumping losses compared to stock as illustrated in Figure The low load and speed area shows almost no difference. The overall gear ratio used stays under 30 for most of the map except for the low speed high load region as Figure 3.19 shows. Another source of improvement not realized with the modeling relates to the intake air % D ifference Intake Manifold Pressure Difference BMEP (bar) Engine Speed (RPM/1000) % Difference BMEP (bar) Pre-Turbine Pressure Difference Engine Speed (RPM/1000) Figure 54: Difference in intake manifold pressure calculated as stock pressure minus SuperTurbo pressure so (+) indicates stock pressure is greater Figure 55: Difference in pre turbine pressure calculated as stock pressure minus SuperTurbo pressure so (+) indicates stock pressure is greater 56
66 PMEP Difference 0.2 Pressure (bar) BMEP (bar) Engine Speed (RPM/1000) Figure 57: Stock PMEP minus SuperTurbo PMEP temperature. The model does a poor job of estimating the temperature rise across the compressor, but the differences can be estimated with the use of test data. The lower load region of the map where the compressor is controlled to produce no boost should have almost Gear Ratio Map Gear Ratio BMEP (bar) Engine Speed (RPM/1000) 10 Figure 56: Overall gear ratio from turbine shaft to crankshaft 57
67 no temperature rise compared to the stock configuration. This results in lower intake manifold temperatures which provide denser in cylinder air meaning less pressure is required. The model results help solidify the understanding of how the SuperTurbo is able to benefit a reciprocating engine over the entire steady state operating range. The turbocompounding advantage goes up with higher load and engine speed since that is the area where most of the additional exhaust energy is passed through the wastegate. The mid to lower load range of the engine is able to realize more benefit due to the control of the compressor speed. Instead of creating boost that is not needed to prevent turbo lag boost is able to be created on demand at any given operating point with the use of the SuperTurbo. The mid range also benefits from reduced pumping losses. Even though the higher load and speed range has higher pumping losses compared to stock, the benefits from turbocompounding more than make up for the pumping losses and is able to supplement some of the in cylinder BMEP requirement. 58
68 CHAPTER 4: SUMMARY AND CONCLUSION 4.1 Summary A modeling project was carried out on a Volkswagen engine model using GT Power. The addition of a SuperTurbo to the model was used to predict potential BSFC improvements. The SuperTurbo acts as a supercharger for the engine giving the intake manifold boost when it is needed and provides turbocompounding when excess boost is available. The stock engine model was used that Volkswagen had already correlated with test data for a wide open throttle configuration. Additional test data was used to correlate the data over the entire range of operating points. The SuperTurbo model developed by SwRI was added to the model and the original turbine model was replaced by a simplified version of a turbine model to represent characteristics of a new turbine design for use in the superturbo configuration. It was predicted that the improvements would come from two sources. One source of improvement is where the turbine wastegate is open. This wasted energy was available to offset in cylinder power with the use of turbocompounding. The second source of improvement comes from the reduced use of the compressor at low loads where boost is not needed. The modeling results confirmed the areas of improvement. The actual magnitude of improvements will depend on transmission efficiencies yet to be determined. 59
69 4.2 Conclusion and Future Work The original model required modification for accurate part load simulations. The improved model is able to match stock data with acceptable accuracy due to imposing engine timing parameters from the test data as well as modifying the FMEP model and throttle model. The SuperTurbo simulations resulted in significant BSFC benefits. The area of operation where the stock engine wastegate is normally open shows improvement due to utilization of excess exhaust energy through turbocompounding with a maximum of 6.7% improvement at 5000 RPM; 17 bar BMEP although the maximum amount of turbocompounding is kw at 6000 RPM; 14 bar BMEP. The area of operation where boost pressure is limited when it is not needed also shows improvement due to the minimization of wasted compressor power with the largest power savings being 4.3 kw at 5500 RPM; 8 bar BMEP which coincides with the highest point for wasted boost pressure. The simulations showed approximate magnitudes of possible improvements with an assumed transmission mechanical efficiency of 80%. The actual magnitudes of improvements will depend heavily on the final efficiency of the turbocompounding action of the transmission between the turbine shaft and the crankshaft. Possibilities of future work consist of further improvements to the current configuration by optimizing the timing parameters. This will require knowledge about the limitations affecting the current timing parameters. Once more information is known about the parasitic losses and 60
70 mechanical efficiency of the final transmission it can be included into the model to show more realistic improvements. Now that steady state results have been modeled these can be incorporated into transient models that are able to benefit more from the supercharging function of the SuperTurbo. The combination of transient and steady state modeling can then be used to determine fuel saving benefits over prescribed drive cycles. With a working model capable of both transient and steady state operation, control strategies can be developed and tested before being implemented on hardware. 61
71 References 1. Supercharging for Fuel Economy. J. Buike, J. Davis, J. Marsh, and L. Ryder. s.l. : SAE, A Fast Response Turbocharging System. A. Nekut, R. Callaway, and C. Kuenhl. s.l. : SAE, Electronic Throttle and Wastegate Control for Turbocharged Gasonline Engines. A. Y. Karnik, J. H. Buckland and J. S. Freudenberg. Portland : American Control Conference, Comparison of a turbocharger to a supercharger on a spark ignited engine. Adams, T. G. s.l. : SAE, Simulation of Supercharged and Turbocharged Small Spark Ignition Engine. J.i Navratil, M.s Polasek, O.h Vitek, J. Macek, P.l Baumruk. Prague : Journal of Middle European Construction and Design of Cars, Analysis of a SuperTurbocharged Downsized Engine Using 1 D CFD Simulation. C.J. Chadwell, M. Walls. s.l. : SAE, Transient performance of an SI engine by transient response specifications. J. H. Kwark, C. H. Jeon and Y. J. Chang. 3, Busan : International Journal of Automotive Technology, 2003, Vol Janota, N. Watson and M.S. Turbocharging the Internal Combustion Engine. New York : John Wiley & Sons, A Comparitive Study of The Acceleration Performance of a Truck Diesel Engine With Exhaust Gas Turbocharger and with Pressure Wave Supercharger Comprex. I. Summerauer, F. Spinnler, A. Mayer and A. Hafner. London : Turbocharging and Turbochargers Conference, Testing Methods for the Transient Behavior of Charged Vehicle Engines. Hiereth, H. s.l. : SAE, Investigation on performance of a compression ignition engine with pressure wave supercharger. Y. Lei, D. S. Zhou, H. G. Zhang. s.l. : Elsevier, Turbocharger motor generator for improvement of transient performance in an internal combustion engine. J. Panting, K. R. Pullen, and R. F. Martinez Botas. 3, London : Professional 62
72 Engineering Publishing, 2001, Proceedings of the Institution of Mechanical Engineers, Part D: Journal of Automobile Engineering, Vol The Turbocompound Diesel Engine. D. W. H. Tennant, B. E. Walsham. Huddersfield : SAE Technical Paper Series, Compound piston and turbine engines. London, A. L. s.l. : Gas and Oil Power, Testing of a Low Specific Fuel Consumption Turbocompound Engine. Holtman, R. H. s.l. : SAE, Study of available exhaust gas heat recovery technologies for HD diesel engine applications. D.T. Hountalas, C.O. Katsanos, D.A. Kouremenos, E.D. Rogdakis. 2, s.l. : International Journal of Alternative Propulsion, 2007, Vol An Advanced Turbocharging System for Improved Fuel Efficiency. E. A. Vandyne, M. B. Riley. s.l. : ASME, Turbo Cool turbocharging system for spark ignition engines. L. S. Wang, S. Yang. s.l. : Professional Engineering Publishing, 2006, Vol An Air Cycle Analysis of Alternatives to Throttling in the Otto Cycle Engine. Y. Yacoub, C. Atkinson. s.l. : American Society of Mechanical Engineers, Internal Combustion Engine Division. 20. The Design of Turbocharged Engines Using 1D Simulation. Gurney, D. s.l. : SAE, GT Power Help Navigator. s.l. : Gamma Technologies. Vol. V

73 Appendix A: Volkswagen Test Data 64
74 65
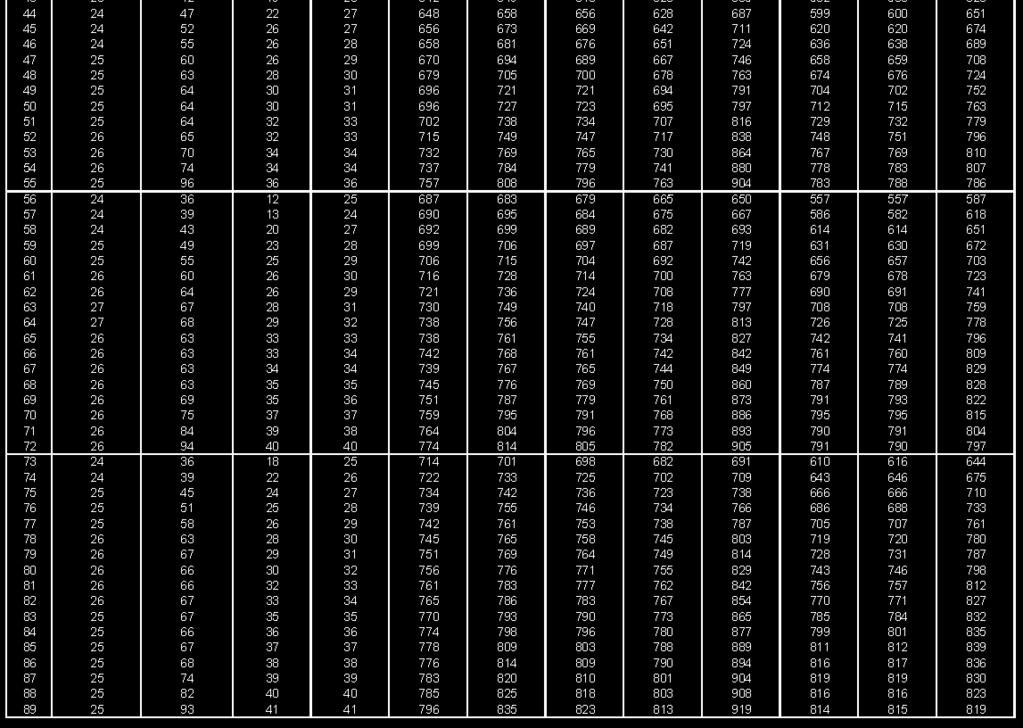
75 66
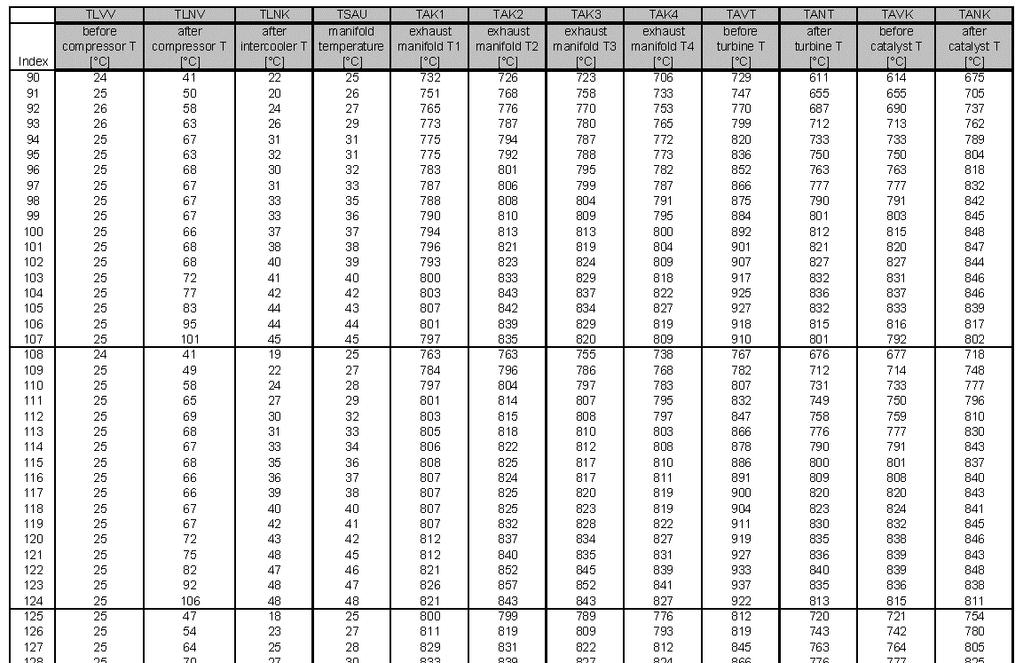
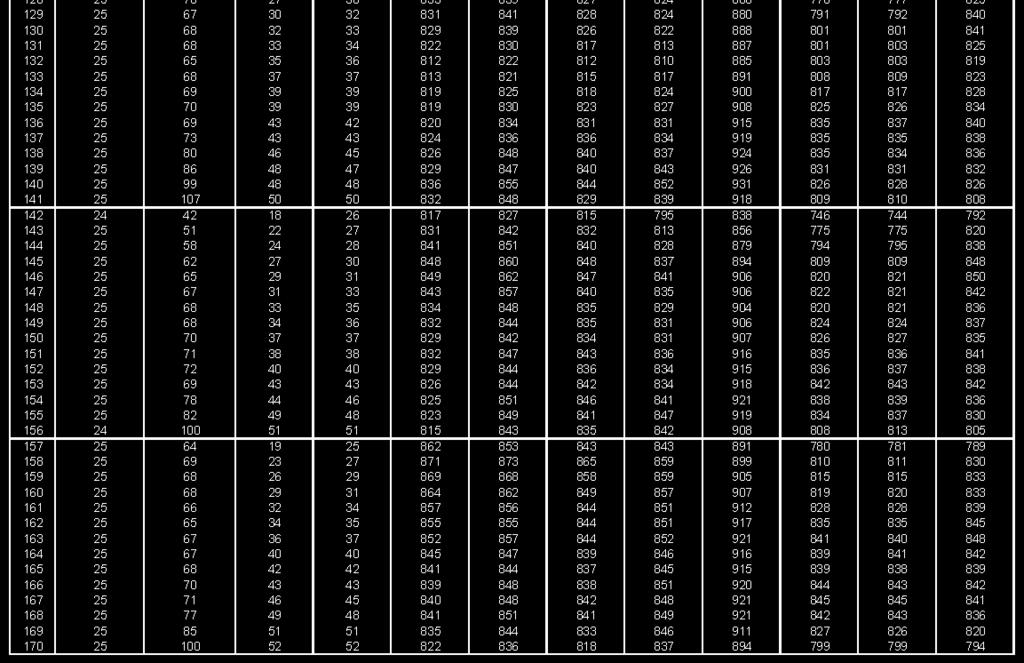
76 67
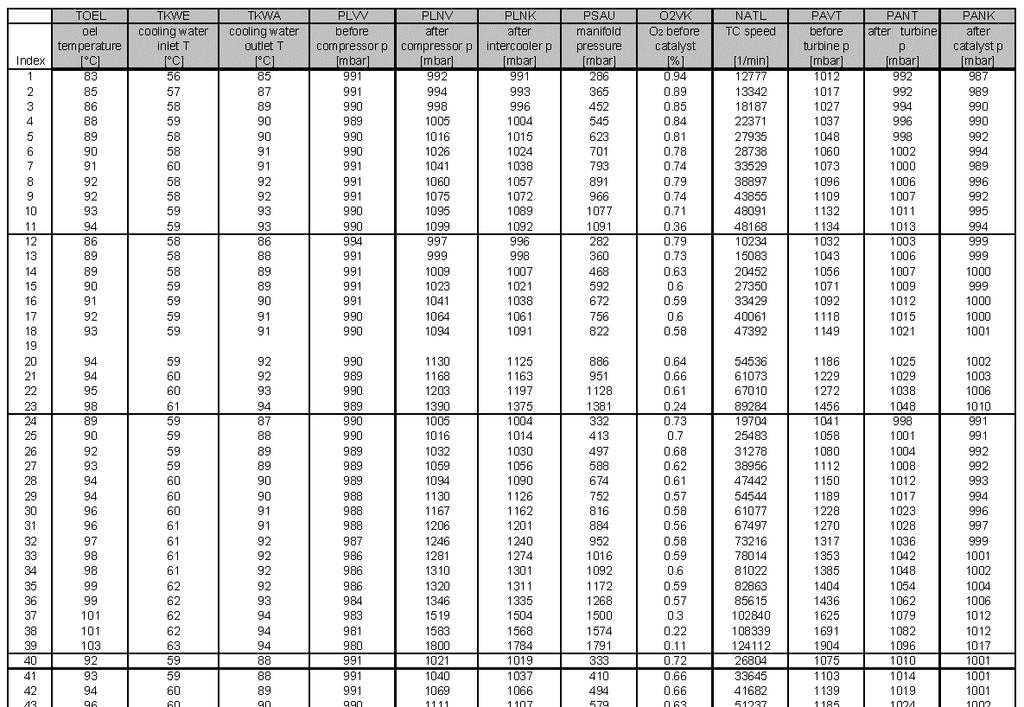
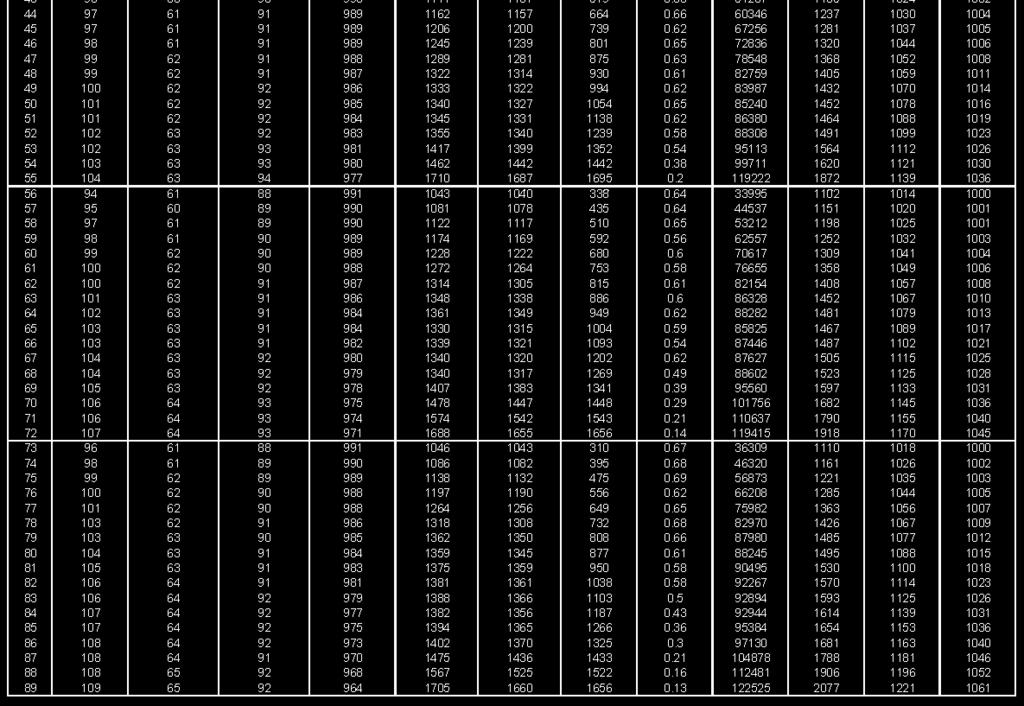
77 68
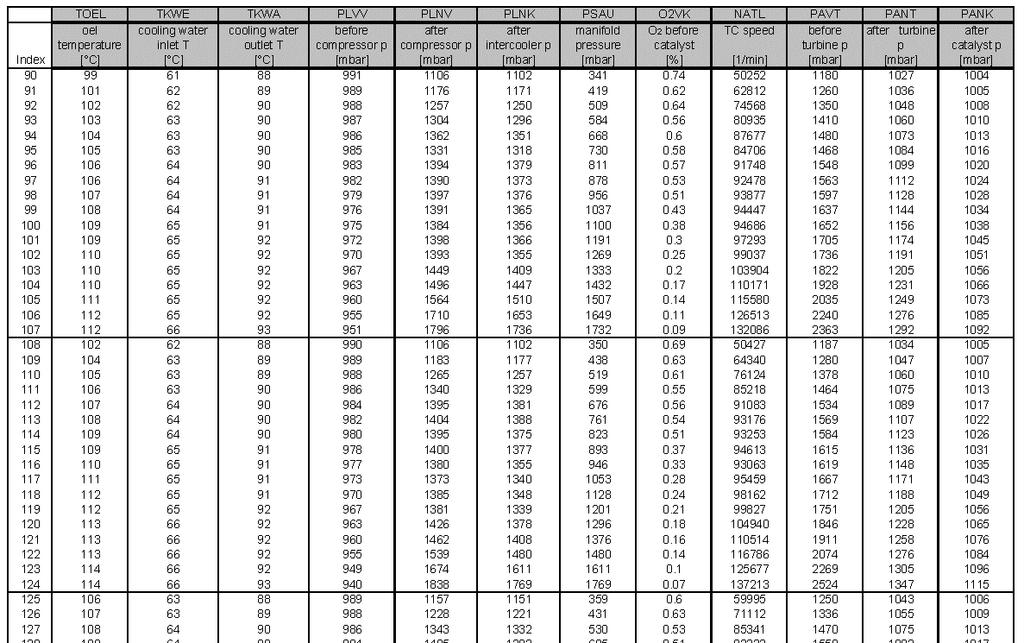
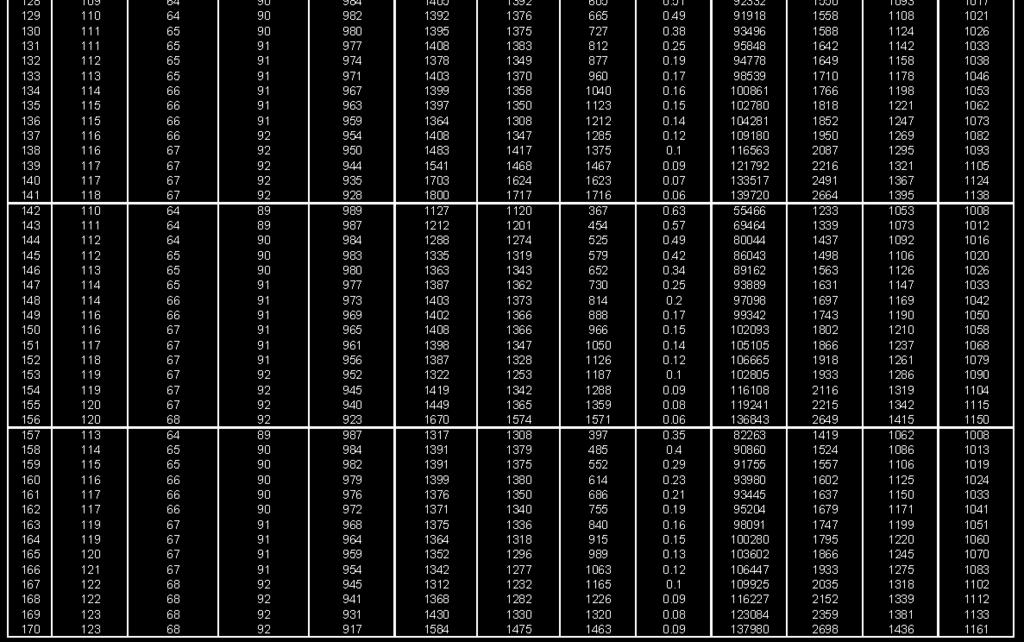
78 69
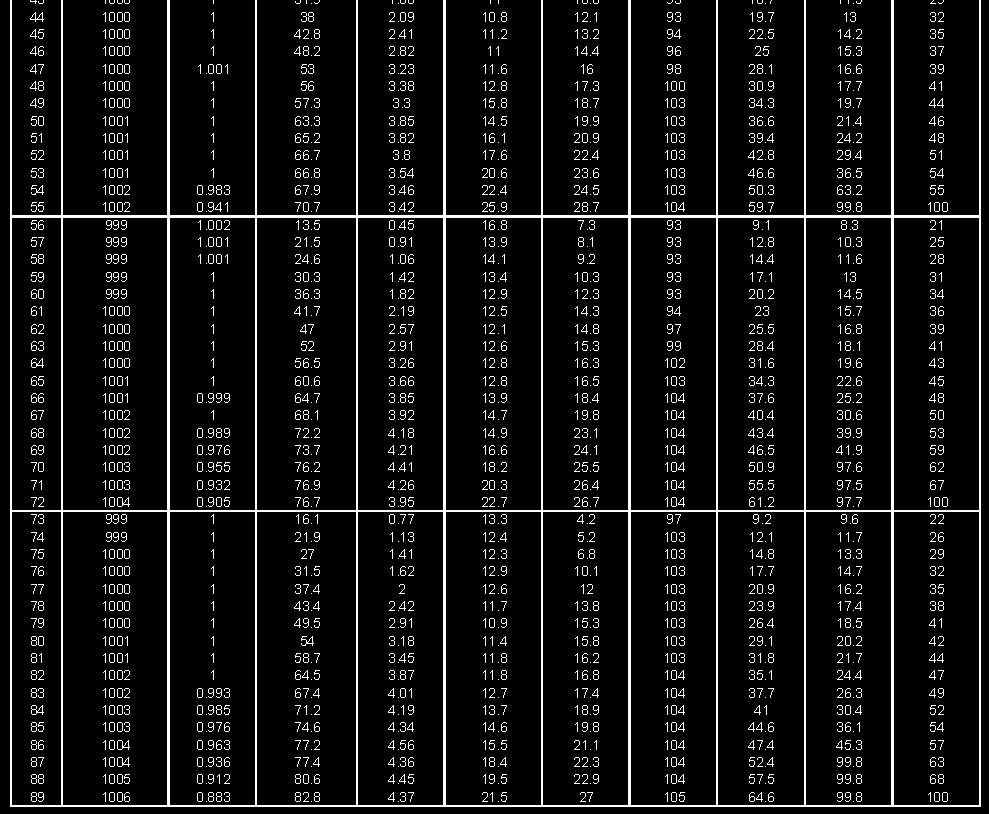
79 70
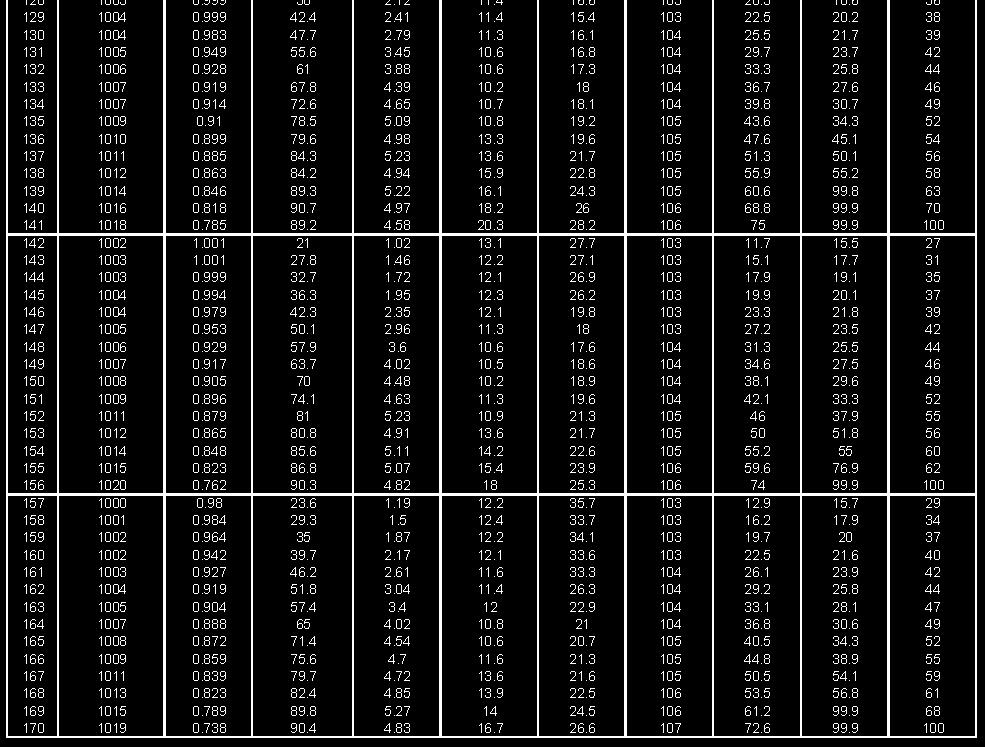
80 71
Boosting the Starting Torque of Downsized SI Engines GT-Suite User s Conference 2002
 GT-Suite User s Conference 2002 Hans Rohs Inst. For Combustion Engines (VKA) RWTH Aachen Knut Habermann, Oliver Lang, Martin Rauscher, Christof Schernus FEV Motorentechnik GmbH Acknowledgement: Some of
Variable Intake Manifold Development trend and technology
 Variable Intake Manifold Development trend and technology Author Taehwan Kim Managed Programs LLC (tkim@managed-programs.com) Abstract The automotive air intake manifold has been playing a critical role
Chapter 6. Supercharging
 SHROFF S. R. ROTARY INSTITUTE OF CHEMICAL TECHNOLOGY (SRICT) DEPARTMENT OF MECHANICAL ENGINEERING. Chapter 6. Supercharging Subject: Internal Combustion Engine 1 Outline Chapter 6. Supercharging 6.1 Need
Development of Two-stage Electric Turbocharging system for Automobiles
 Development of Two-stage Electric Turbocharging system for Automobiles 71 BYEONGIL AN *1 NAOMICHI SHIBATA *2 HIROSHI SUZUKI *3 MOTOKI EBISU *1 Engine downsizing using supercharging is progressing to cope
Turbo Tech 101 ( Basic )
") Turbo Tech 101 ( Basic ) How a Turbo System Works Engine power is proportional to the amount of air and fuel that can get into the cylinders. All things being equal, larger engines flow more air and as
Turbo Tech 101 ( Basic ) How a Turbo System Works Engine power is proportional to the amount of air and fuel that can get into the cylinders. All things being equal, larger engines flow more air and as
Turbo boost. ACTUS is ABB s new simulation software for large turbocharged combustion engines
 Turbo boost ACTUS is ABB s new simulation software for large turbocharged combustion engines THOMAS BÖHME, ROMAN MÖLLER, HERVÉ MARTIN The performance of turbocharged combustion engines depends heavily
So how does a turbocharger get more air into the engine? Let us first look at the schematic below:
 How a Turbo System Works Engine power is proportional to the amount of air and fuel that can get into the cylinders. All things being equal, larger engines flow more air and as such will produce more power.
Engine Cycles. T Alrayyes
 Engine Cycles T Alrayyes Introduction The cycle experienced in the cylinder of an internal combustion engine is very complex. The cycle in SI and diesel engine were discussed in detail in the previous
Development of Variable Geometry Turbocharger Contributes to Improvement of Gasoline Engine Fuel Economy
 Development of Variable Geometry Turbocharger Contributes to Improvement of Gasoline Engine Fuel Economy 30 MOTOKI EBISU *1 YOSUKE DANMOTO *1 YOJI AKIYAMA *2 HIROYUKI ARIMIZU *3 KEIGO SAKAMOTO *4 Every
Powertrain Efficiency Technologies. Turbochargers
 Powertrain Efficiency Technologies Turbochargers Turbochargers increasingly are being used by automakers to make it possible to use downsized gasoline engines that consume less fuel but still deliver the
Increasing Low Speed Engine Response of a Downsized CI Engine Equipped with a Twin-Entry Turbocharger
 Increasing Low Speed Engine Response of a Downsized CI Engine Equipped with a Twin-Entry Turbocharger A. Kusztelan, Y. F. Yao, D. Marchant and Y. Wang Benefits of a Turbocharger Increases the volumetric
Boosting System Challenges for Extreme Downsizing
 Department of Mechanical Engineering Powertrain & Vehicle Research Centre Boosting System Challenges for Extreme Downsizing 1 Thanks to contributors to this presentation UNIVERSITY OF BATH Andrew Lewis
Electromagnetic Fully Flexible Valve Actuator
 Electromagnetic Fully Flexible Valve Actuator A traditional cam drive train, shown in Figure 1, acts on the valve stems to open and close the valves. As the crankshaft drives the camshaft through gears
Optimising Aeristech FETT (Fully Electric Turbocharger Technology) for Future Gasoline Engine Requirements
 for Future Gasoline Engine Requirements") Optimising Aeristech FETT (Fully Electric Turbocharger Technology) for Future Gasoline Engine Requirements Dr Sam Akehurst, Dr Nic Zhang 25 th April 2017 1 Contents Introduction to the Fully Electric Turbocharging
Optimising Aeristech FETT (Fully Electric Turbocharger Technology) for Future Gasoline Engine Requirements Dr Sam Akehurst, Dr Nic Zhang 25 th April 2017 1 Contents Introduction to the Fully Electric Turbocharging
IC Engine Control - the Challenge of Downsizing
 IC Engine Control - the Challenge of Downsizing Dariusz Cieslar* 2nd Workshop on Control of Uncertain Systems: Modelling, Approximation, and Design Department of Engineering, University of Cambridge 23-24/9/2013
Direct Injection Ethanol Boosted Gasoline Engines: Biofuel Leveraging For Cost Effective Reduction of Oil Dependence and CO 2 Emissions
 Direct Injection Ethanol Boosted Gasoline Engines: Biofuel Leveraging For Cost Effective Reduction of Oil Dependence and CO 2 Emissions D.R. Cohn* L. Bromberg* J.B. Heywood Massachusetts Institute of Technology
Application of the SuperGen Electro-Mechanical Supercharger to Miller-Cycle Gasoline Turbocharged Engines
 Application of the SuperGen Electro-Mechanical Supercharger to Miller-Cycle Gasoline Turbocharged Engines A. H. Guzel, J. Martin North American GT Conference 2017 11/14/2017 1 Overview Program Goal & Technology
Performance Enhancement of Multi-Cylinder Common Rail Diesel Engine for Automotive Application
 Performance Enhancement of Multi-Cylinder Common Rail Diesel Engine for Automotive Application SUNDHARAM K, PG student, Department of Mechanical Engineering, Internal Combustion Engineering Divisions,
Subaru BRZ Toyota GT86 Scion FR-S
 RaceROM Features for Subaru BRZ Toyota GT86 Scion FR-S v1.8 Index Warning... 3 Introduction... 4 Feature list... 4 Supported Vehicle Models... 4 Availability... 4 Overview... 5 Map Switching**... 5 Speed
Engine Transient Characteristics Simulation Technology using Zero-dimensional Combustion Model
 25 Engine Transient Characteristics Simulation Technology using Zero-dimensional Combustion Model TAKAYUKI YAMAMOTO *1 KENJI HIRAOKA *2 NAOYUKI MORI *2 YUJI ODA *3 AKIHIRO YUUKI *4 KENICHI ISONO *5 The
AN ANALYSIS OF EFFECT OF VARIABLE COMPRESSION RATIO IN C.I. ENGINE USING TURBOCHARGER
 AN ANALYSIS OF EFFECT OF VARIABLE COMPRESSION RATIO IN C.I. ENGINE USING TURBOCHARGER E.Saravanapprabhu 1, M.Mahendran 2 1E.Saravanapprabhu, PG Student, Thermal Engineering, Department of Mechanical Engineering,
Controller Ground (dual black 12awg) should be connected to chassis ground as close as possible to the battery.
 should be connected to chassis ground as close as possible to the battery.") 1. Overview The Maximizer 4 progressive nitrous controller operates one or two separate stages of nitrous based on either time, RPM, MPH, throttle percentage or boost pressure. Whether your engine is naturally
1. Overview The Maximizer 4 progressive nitrous controller operates one or two separate stages of nitrous based on either time, RPM, MPH, throttle percentage or boost pressure. Whether your engine is naturally
Dipl.-Ing. Frank Pflüger. A new charging system for commercial diesel engines. Academy
 Dipl.-Ing. Frank Pflüger A new charging system for commercial diesel engines Academy Regulated Two-Stage Turbocharging - 3K-Warner's New Charging System for Commercial Diesel Engines Dipl.-Ing. Frank Pflüger,
Highly transient gas engine operation from a turbocharging perspective
 HERVÉ MARTIN, ABB TURBO SYSTEMS LTD Highly transient gas engine operation from a turbocharging perspective 10th CIMAC CASCADES, Kobe, 12 th October 2018 Overview Introduction Basics of load pick-up Modeling
GT-Suite Users Conference
 GT-Suite Users Conference Thomas Steidten VKA RWTH Aachen Dr. Philip Adomeit, Bernd Kircher, Stefan Wedowski FEV Motorentechnik GmbH Frankfurt a. M., October 2005 1 Content 2 Introduction Criterion for
Porsche Engineering driving technologies
 European GT-Suite User Conference 2016 Frankfurt am Main, 17. Oktober 2016 Real Drive Efficiency Improvement in turbocharged Engines by the use of Expansion Intake Manifold Content > Introduction Motivation
GASOLINE DIRECT INJECTION IN SI ENGINES B. PAVAN VISWANADH P. ASHOK KUMAR. Mobile No : Mobile No:
 GASOLINE DIRECT INJECTION IN SI ENGINES SUBMIT TED BY B. PAVAN VISWANADH P. ASHOK KUMAR Y06ME011, III/IV B. Tech Y06ME003, III/IV B. Tech Pavan.visu@gmail.com ashok.me003@gmail.com Mobile No :9291323516
VT2+: Further improving the fuel economy of the VT2 transmission
 VT2+: Further improving the fuel economy of the VT2 transmission Gert-Jan Vogelaar, Punch Powertrain Abstract This paper reports the study performed at Punch Powertrain on the investigations on the VT2
THE FKFS 0D/1D-SIMULATION. Concepts studies, engineering services and consulting
 THE FKFS 0D/1D-SIMULATION Concepts studies, engineering services and consulting r e s e a r c h i n m o t i o n. VEHICLE IN MOTION On the basis of constant engine speeds and loads, the combustion engine
VALVE TIMING DIAGRAM FOR SI ENGINE VALVE TIMING DIAGRAM FOR CI ENGINE
 VALVE TIMING DIAGRAM FOR SI ENGINE VALVE TIMING DIAGRAM FOR CI ENGINE Page 1 of 13 EFFECT OF VALVE TIMING DIAGRAM ON VOLUMETRIC EFFICIENCY: Qu. 1:Why Inlet valve is closed after the Bottom Dead Centre
Hybrid Architectures for Automated Transmission Systems
 1 / 5 Hybrid Architectures for Automated Transmission Systems - add-on and integrated solutions - Dierk REITZ, Uwe WAGNER, Reinhard BERGER LuK GmbH & Co. ohg Bussmatten 2, 77815 Bühl, Germany (E-Mail:
Foundations of Thermodynamics and Chemistry. 1 Introduction Preface Model-Building Simulation... 5 References...
 Contents Part I Foundations of Thermodynamics and Chemistry 1 Introduction... 3 1.1 Preface.... 3 1.2 Model-Building... 3 1.3 Simulation... 5 References..... 8 2 Reciprocating Engines... 9 2.1 Energy Conversion...
GT-Suite European User Conference
 GT-Suite European User Conference E-Charging on a High Performance Diesel engine D. Peci, C. Venezia EMEA Region - Powertrain Engineering Powertrain Research&Technology Frankfurt, Germany October 26th,
2. Turbocharger System
 INTAKE (INDUCTION) 2. Turbocharger System A: GENERAL The turbocharger system consists of a water-cooled turbocharger, air-cooled intercooler, wastegate control solenoid valve, etc. The turbine rotated
ACTUAL CYCLE. Actual engine cycle
 1 ACTUAL CYCLE Actual engine cycle Introduction 2 Ideal Gas Cycle (Air Standard Cycle) Idealized processes Idealize working Fluid Fuel-Air Cycle Idealized Processes Accurate Working Fluid Model Actual
Development of High-efficiency Gas Engine with Two-stage Turbocharging System
 64 Development of High-efficiency Gas Engine with Two-stage Turbocharging System YUTA FURUKAWA *1 MINORU ICHIHARA *2 KAZUO OGURA *2 AKIHIRO YUKI *3 KAZURO HOTTA *4 DAISUKE TAKEMOTO *4 A new G16NB gas engine
FE151 Aluminum Association Inc. Impact of Vehicle Weight Reduction on a Class 8 Truck for Fuel Economy Benefits
 FE151 Aluminum Association Inc. Impact of Vehicle Weight Reduction on a Class 8 Truck for Fuel Economy Benefits 08 February, 2010 www.ricardo.com Agenda Scope and Approach Vehicle Modeling in MSC.EASY5
Experimental Investigation of Acceleration Test in Spark Ignition Engine
 Experimental Investigation of Acceleration Test in Spark Ignition Engine M. F. Tantawy Basic and Applied Science Department. College of Engineering and Technology, Arab Academy for Science, Technology
Gasoline Engine Performance and Emissions Future Technologies and Optimization
 Gasoline Engine Performance and Emissions Future Technologies and Optimization Paul Whitaker - Technical Specialist - Ricardo 8 th June 2005 RD. 05/52402.1 Contents Fuel Economy Trends and Drivers USA
Vehicle simulation with cylinder deactivation
 Vehicle simulation with cylinder deactivation Potential analysis of cylinder deactivation using a detailed Cyrille Frottier, Lars Böttcher, GT-SUITE Users Conference, October 2011 Vehicle simulation with
FLUID DYNAMICS TRANSIENT RESPONSE SIMULATION OF A VEHICLE EQUIPPED WITH A TURBOCHARGED DIESEL ENGINE USING GT-POWER
 GT-SUITE USERS CONFERENCE FRANKFURT, OCTOBER 20 TH 2003 FLUID DYNAMICS TRANSIENT RESPONSE SIMULATION OF A VEHICLE EQUIPPED WITH A TURBOCHARGED DIESEL ENGINE USING GT-POWER TEAM OF WORK: A. GALLONE, C.
SUPERCHARGER AND TURBOCHARGER
 SUPERCHARGER AND TURBOCHARGER 1 Turbocharger and supercharger 2 To increase the output of any engine more fuel can be burned and make bigger explosion in every cycle. i. One way to add power is to build
Improving the Fuel Economy of Heavy Duty Fleets II San Diego, CA February 20th, 2008
 Improving the Fuel Economy of Heavy Duty Fleets II San Diego, CA February 20th, 2008 Heavy Duty Truck Fuel Economy Options Southwest Research Institute David Branyon 1 Outline Background/history Current
COBB TUNING. AccessTUNER. USDM Mitsubishi Table Descriptions and Tuning Tips. Copyright 2008 Cobb Tuning Products, LLC. All Rights Reserved. P.
 COBB TUNING AccessTUNER TM USDM Mitsubishi Table Descriptions and P.1 Note: This is a list of tables available on all Mitsubishi AccessTUNER products. Not all tables are available in your software. Boost
Potential of Turbocharging
 29119_VB_PES_GT-Suite-Coference.ppt Vincenzo Bevilacqua, PE-AB Potential of Turbocharging 11.12.28 Seite 1 von 24 29119_VB_PES_GT-Suite-Coference.ppt Vincenzo Bevilacqua, PE-AB Potential of Turbocharging
R&D on Environment-Friendly, Electronically Controlled Diesel Engine
 20000 M4.2.2 R&D on Environment-Friendly, Electronically Controlled Diesel Engine (Electronically Controlled Diesel Engine Group) Nobuyasu Matsudaira, Koji Imoto, Hiroshi Morimoto, Akira Numata, Toshimitsu
Tuning the System. I. Introduction to Tuning II. Understanding System Response III. Control Scheme Theory IV. BCU Settings and Parameter Ranges
 I. Introduction to Tuning II. Understanding System Response III. Control Scheme Theory IV. BCU Settings and Parameter Ranges a. Determining Initial Settings The Basics b. Determining Initial Settings -
AVO380lgt Ball-bearing Turbocharger for the Subaru Legacy GT, Spec B, and Outback XT
 AVO380lgt Ball-bearing Turbocharger for the Subaru Legacy GT, Spec B, and Outback XT PN#LEG-1270-034 After extensive testing in America, AVO is proud to announce the new AVO380lgt boltin ball-bearing turbocharger,
Application Note Original Instructions Development of Gas Fuel Control Systems for Dry Low NOx (DLN) Aero-Derivative Gas Turbines
 Aero-Derivative Gas Turbines") Application Note 83404 Original Instructions Development of Gas Fuel Control Systems for Dry Low NOx (DLN) Aero-Derivative Gas Turbines Woodward reserves the right to update any portion of this publication
Application Note 83404 Original Instructions Development of Gas Fuel Control Systems for Dry Low NOx (DLN) Aero-Derivative Gas Turbines Woodward reserves the right to update any portion of this publication
9 th Diesel Engine Emission Reduction Conference Newport, Rhode Island, August 2003
 9 th Diesel Engine Emission Reduction Conference Newport, Rhode Island, 24. 28. August 2003 Recent Developments in BMW s Diesel Technology Fritz Steinparzer, BMW Motoren, Austria 1. Introduction The image
LECTURE NOTES INTERNAL COMBUSTION ENGINES SI AN INTEGRATED EVALUATION
 LECTURE NOTES on INTERNAL COMBUSTION ENGINES SI AN INTEGRATED EVALUATION Integrated Master Course on Mechanical Engineering Mechanical Engineering Department November 2015 Approach SI _ indirect injection
Steel Intensive Engine Executive Summary
 a business unit of AISI www.smdisteel.org Steel Intensive Engine Executive Summary 2013 Contributors MAHLE Long Products Market Development Group members: Gerdau Nucor Corporation The Timkin Company Presentation
Common Terms Selecting a Turbocharger Compressor... 4
 TURBOCHARGERS Common Terms... 2 Adiabatic Efficiency... 2 Pressure Ratio... 2 Density Ratio... 2 Turbine... 2 A/R Ratio... 2 Charge-Air-Cooler... 2 Boost... 3 Waste Gate... 3 Turbo Lag... 3 Boost Threshold...
High- or Medium-Speed Generator Sets: Which Is Right for Your Application?
 Our energy working for you. Power topic #6001 Technical information from Cummins Power Generation High- or Medium-Speed Generator Sets: Which Is Right for Your Application? White Paper Joel Puncochar Marketing
Accelerating the Development of a 2500bar Common Rail Fuel System for a Locomotive Application by using GT-SUITE Woodward Inc.
 Accelerating the Development of a 2500bar Common Rail Fuel System for a Locomotive Application by using GT-SUITE 2017-11-05 Woodward Inc. PAGE 1 Overview Who is Woodward? What is the EMD 1010J engine?
ProECU EVO X. Tuning Guide 2008-onward Model Year. v1.8
 ProECU EVO X Tuning Guide 2008-onward Model Year v1.8 Contents ECU Map Descriptions... 3 3D Maps... 3 Fuel Maps Shown in Live Data as Injector % and Injector ms... 3 High Octane... 3 Low Octane... 3 Ignition
The TL Series is available with either a 3.2-liter V-6 or a 2.5-liter, inline fivecylinder,
 OVERVIEW The TL Series is available with either a 3.2-liter V-6 or a 2.5-liter, inline fivecylinder, engine. The 3.2TL engine, like all other Acura engines, is made of aluminum alloy and is equipped with
INTERNAL COMBUSTION ENGINE (SKMM 4413)
") INTERNAL COMBUSTION ENGINE (SKMM 4413) Dr. Mohd Farid bin Muhamad Said Room : Block P21, Level 1, Automotive Development Centre (ADC) Tel : 07-5535449 Email: mfarid@fkm.utm.my HISTORY OF ICE History of
INTERNAL COMBUSTION ENGINE (SKMM 4413) Dr. Mohd Farid bin Muhamad Said Room : Block P21, Level 1, Automotive Development Centre (ADC) Tel : 07-5535449 Email: mfarid@fkm.utm.my HISTORY OF ICE History of
APPLICATION OF STAR-CCM+ TO TURBOCHARGER MODELING AT BORGWARNER TURBO SYSTEMS
 APPLICATION OF STAR-CCM+ TO TURBOCHARGER MODELING AT BORGWARNER TURBO SYSTEMS BorgWarner: David Grabowska 9th November 2010 CD-adapco: Dean Palfreyman Bob Reynolds Introduction This presentation will focus
EGR Transient Simulation of a Turbocharged Diesel Engine using GT-Power
 GT-SUITE USERS CONFERENCE FRANKFURT, OCTOBER 4 TH 2004 EGR Transient Simulation of a Turbocharged Diesel Engine using GT-Power TEAM OF WORK: G. GIAFFREDA, C. VENEZIA RESEARCH CENTRE ENGINE ENGINEERING
Use of Flow Network Modeling for the Design of an Intricate Cooling Manifold
 Use of Flow Network Modeling for the Design of an Intricate Cooling Manifold Neeta Verma Teradyne, Inc. 880 Fox Lane San Jose, CA 94086 neeta.verma@teradyne.com ABSTRACT The automatic test equipment designed
AVO450lgt Ball-bearing Turbocharger for the Subaru Legacy GT, Spec B, and Outback XT
 AVO450lgt Ball-bearing Turbocharger for the Subaru Legacy GT, Spec B, and Outback XT PN#LEG-1300-000 AVO's big ball-bearing turbocharger for the Subaru Legacy GT, Spec B, and Outback XT is here! Based
How to: Test & Evaluate Motors in Your Application
 How to: Test & Evaluate Motors in Your Application Table of Contents 1 INTRODUCTION... 1 2 UNDERSTANDING THE APPLICATION INPUT... 1 2.1 Input Power... 2 2.2 Load & Speed... 3 2.2.1 Starting Torque... 3
Technical Brief Prodrive Performance Packs Subaru WRX PPP Stage 2
 Technical Brief Prodrive Performance Packs Subaru WRX PPP Stage 2 Date: September 21, 2003 System: Prodrive Performance Pack Stage 2 Subaru WRX Tests: Independent Third Party Dynamometer Tests Prodrive
Part Load Engine Performance prediction for a gasoline engine using Neural Networks. Sreekanth R, Sundar S, Rangarajan S, Anand G -System Simulation
 Part Load Engine Performance prediction for a gasoline engine using Neural Networks Sreekanth R, Sundar S, Rangarajan S, Anand G -System Simulation CAE-2 System Simulation GT-SUITE User Conference Feb
Module7:Advanced Combustion Systems and Alternative Powerplants Lecture 32:Stratified Charge Engines
 ADVANCED COMBUSTION SYSTEMS AND ALTERNATIVE POWERPLANTS The Lecture Contains: DIRECT INJECTION STRATIFIED CHARGE (DISC) ENGINES Historical Overview Potential Advantages of DISC Engines DISC Engine Combustion
ENERGY ANALYSIS OF A POWERTRAIN AND CHASSIS INTEGRATED SIMULATION ON A MILITARY DUTY CYCLE
 U.S. ARMY TANK AUTOMOTIVE RESEARCH, DEVELOPMENT AND ENGINEERING CENTER ENERGY ANALYSIS OF A POWERTRAIN AND CHASSIS INTEGRATED SIMULATION ON A MILITARY DUTY CYCLE GT Suite User s Conference: 9 November
ENGINE 3S GTE ENGINE DESCRIPTION ENGINE 3S GTE ENGINE
 39 ENGINE 3S GTE ENGINE DESCRIPTION The new MR2 has the 2.0 liter, 16 valve, DOHC 3S GTE engine with turbocharger which is used in the Celica All Trac/4WD models and has been well received. The 3S GTE
INVENTION DISCLOSURE MECHANICAL SUBJECT MATTER EFFICIENCY ENHANCEMENT OF A NEW TWO-MOTOR HYBRID SYSTEM
 INVENTION DISCLOSURE MECHANICAL SUBJECT MATTER EFFICIENCY ENHANCEMENT OF A NEW TWO-MOTOR HYBRID SYSTEM ABSTRACT: A new two-motor hybrid system is developed to maximize powertrain efficiency. Efficiency
Development of Motor-Assisted Hybrid Traction System
 Development of -Assisted Hybrid Traction System 1 H. IHARA, H. KAKINUMA, I. SATO, T. INABA, K. ANADA, 2 M. MORIMOTO, Tetsuya ODA, S. KOBAYASHI, T. ONO, R. KARASAWA Hokkaido Railway Company, Sapporo, Japan
Durability Aspects of Turbocharged Vs Naturally Aspirated Racing Engines
 22-1-3362 Durability Aspects of Turbocharged Vs Naturally Aspirated Racing Engines Doug Milliken Garrett Engine Boosting Systems, Inc. Copyright 22 Society of Automotive Engineers, Inc. ABSTRACT One of
 www.thecarproblems.com/automotive-service-centre How You Diagnose Your Car Problems And Save Money A Quick Look At An Automotive Service Turbo For Your Car - Benefits, Precautions And Just How Does It
Problem 1 (ECU Priority)
") 151-0567-00 Engine Systems (HS 2016) Exercise 6 Topic: Optional Exercises Raffi Hedinger (hraffael@ethz.ch), Norbert Zsiga (nzsiga@ethz.ch); November 28, 2016 Problem 1 (ECU Priority) Use the information
151-0567-00 Engine Systems (HS 2016) Exercise 6 Topic: Optional Exercises Raffi Hedinger (hraffael@ethz.ch), Norbert Zsiga (nzsiga@ethz.ch); November 28, 2016 Problem 1 (ECU Priority) Use the information
In order to discuss powerplants in any depth, it is essential to understand the concepts of POWER and TORQUE.
 -Power and Torque - ESSENTIAL CONCEPTS: Torque is measured; Power is calculated In order to discuss powerplants in any depth, it is essential to understand the concepts of POWER and TORQUE. HOWEVER, in
Turbocharger Compressor Calculations
 Turbocharger Compressor Calculations Introduction The purpose of this little paper is to show the reader how to calculate the volume and mass of air moving through his engine, and how to size a turbochargers'
VARIABLE DISPLACEMENT OIL PUMP IMPROVES TRACKED VEHICLE TRANSMISSION EFFICIENCY
 2018 NDIA GROUND VEHICLE SYSTEMS ENGINEERING AND TECHNOLOGY SYMPOSIUM POWER & MOBILITY (P&M) TECHNICAL SESSION AUGUST 7-9, 2018 NOVI, MICHIGAN VARIABLE DISPLACEMENT OIL PUMP IMPROVES TRACKED VEHICLE TRANSMISSION
Mechanism Investigation: Automotive Charging Systems. April 16, by Kyle Oliver EMA 202 UW-Madison Rob Olson, T.A.
 Mechanism Investigation: Automotive Charging Systems April 16, 2004 by Kyle Oliver EMA 202 UW-Madison Rob Olson, T.A. Introduction Since automobile engines require both fuel and oxygen for the combustion
1. ENGINE ECU AND OTHER COMPONENTS
 09-3 EGINE CONTROL SYSTEM 1. ENGINE ECU AND OTHER COMPONENTS ECU/Barometric Sensor Camshaft Position Sensor HFM Sensor / Intake Air Temperature Sensor Fuel Filter (Water Sensor) Preheating Relay Accelerator
Asynchronous Restriking CDI 2 channel
 Asynchronous Restriking CDI 2 channel Parts List ARC-2 module Decals Power Cable Fuse Specifications Operating Voltage: 8-20V Operating Current: Max Operating RPM: Ambient Temp range: Ignition inputs:
Appendix A: Motion Control Theory
 Appendix A: Motion Control Theory Objectives The objectives for this appendix are as follows: Learn about valve step response. Show examples and terminology related to valve and system damping. Gain an
Addressing performance balancing in fuel economy driven vehicle programs
 EAEC-ESFA 2015 Presenter: Dr. Filip Deblauwe Addressing performance balancing in fuel economy driven vehicle programs Smarter decisions, better products. Introduction Performance balancing Application
Switching Control for Smooth Mode Changes in Hybrid Electric Vehicles
 Switching Control for Smooth Mode Changes in Hybrid Electric Vehicles Kerem Koprubasi (1), Eric Westervelt (2), Giorgio Rizzoni (3) (1) PhD Student, (2) Assistant Professor, (3) Professor Department of
ANALYTICAL EVALUATION OF ENGINE AND VEHICLE HARDWARE EFFECTS ON VEHICLE RESPONSE. Drew Raftopoulos
 ANALYTICAL EVALUATION OF ENGINE AND VEHICLE HARDWARE EFFECTS ON VEHICLE RESPONSE Drew Raftopoulos WHY IS TRANSIENT RESPONSE IMPORTANT? The focus on vehicle transient response has become important with
Development of a Double Variable Cam Phasing Strategy for Turbocharged SIDI Engines
 !"" #$!%& Development of a Double Variable Cam Phasing Strategy for Turbocharged SIDI Engines GMPT Europe, Engine Development & Simulation Vincenzo Bevilacqua, Jany Krieg, Roland Maucher, Raymond Reinmann
TDG-F-113 CEC New Test Development Proposal for a New Engine Fuels Test Procedure
 TDG-F-113 CEC New Test Development Proposal for a New Engine Fuels Test Procedure DISI (Direct Injection spark ignited engine) Injector fouling Test 1. Demonstrated need- The proposed test will address
The Effect of Efi to the Carbureted Single Cylinder Four Stroke Engine
 Journal of Mechanical Engineering Vol. 7, No. 2, 53-64, 2010 The Effect of Efi to the Carbureted Single Cylinder Four Stroke Engine Idris Ibrahim Adibah Abdul Jalil Shaharin A. Sulaiman Department of Mechanical
A FEASIBILITY STUDY ON WASTE HEAT RECOVERY IN AN IC ENGINE USING ELECTRO TURBO GENERATION
 A FEASIBILITY STUDY ON WASTE HEAT RECOVERY IN AN IC ENGINE USING ELECTRO TURBO GENERATION S.N.Srinivasa Dhaya Prasad 1 N.Parameshwari 2 1 Assistant Professor, Department of Automobile Engg., SACS MAVMM
Integrated Simulation of a Truck Diesel Engine with a Hydraulic Engine Braking System
 Integrated Simulation of a Truck Diesel Engine with a Hydraulic Engine Braking System N. Brinkert, K. Kanning GT-Suite Users Conference 2008 I want to give you a short presentation about a project we work
Innovative Racing Electronics
 FOR IMMEDIATE RELEASE Contact: Dan Rudd Phone: 407.330.9727 FAX: 407.322.8632 E-Mail: sales@mpsracing.com Web: www.mpsracing.com Holley Commander 950 Universal 4 Cylinder Fuel Injection Kit Sanford, Florida,
INDIAN INSTITUTE OF TECHNOLOGY KHARAGPUR NPTEL ONLINE CERTIFICATION COURSE. On Industrial Automation and Control
 INDIAN INSTITUTE OF TECHNOLOGY KHARAGPUR NPTEL ONLINE CERTIFICATION COURSE On Industrial Automation and Control By Prof. S. Mukhopadhyay Department of Electrical Engineering IIT Kharagpur Topic Lecture
Analytical and Experimental Evaluation of Cylinder Deactivation on a Diesel Engine. S. Pillai, J. LoRusso, M. Van Benschoten, Roush Industries
 Analytical and Experimental Evaluation of Cylinder Deactivation on a Diesel Engine S. Pillai, J. LoRusso, M. Van Benschoten, Roush Industries GT Users Conference November 9, 2015 Contents Introduction
AME 436. Energy and Propulsion. Lecture 6 Unsteady-flow (reciprocating) engines 1: Basic operating principles, design & performance parameters
 engines 1: Basic operating principles, design & performance parameters") AME 436 Energy and Propulsion Lecture 6 Unsteady-flow (reciprocating) engines 1: Basic operating principles, design & performance parameters Outline Classification of unsteady-flow engines Basic operating
AME 436 Energy and Propulsion Lecture 6 Unsteady-flow (reciprocating) engines 1: Basic operating principles, design & performance parameters Outline Classification of unsteady-flow engines Basic operating
Common Terms Types of Intake Manifolds... 5
 INDUCTION SYSTEMS Common Terms... 2 Plenum... 2 Helmholtz Resonator... 2 Intake Runners... 2 Carburetor Spacers... 2 Individual Runners (IR)... 2 Tuned Port... 3 Manifold Heat... 3 Venturi... 3 Booster
Engine Performance Analysis
 Engine Performance Analysis Introduction The basics of engine performance analysis The parameters and tools used in engine performance analysis Introduction Parametric cycle analysis: Independently selected
Homogeneous Charge Compression Ignition (HCCI) Engines
 Engines") Homogeneous Charge Compression Ignition (HCCI) Engines Aravind. I. Garagad. Shri Dharmasthala Manjunatheshwara College of Engineering and Technology, Dharwad, Karnataka, India. ABSTRACT Large reductions
Homogeneous Charge Compression Ignition (HCCI) Engines Aravind. I. Garagad. Shri Dharmasthala Manjunatheshwara College of Engineering and Technology, Dharwad, Karnataka, India. ABSTRACT Large reductions
Comparison of Swirl, Turbulence Generating Devices in Compression ignition Engine
 Available online atwww.scholarsresearchlibrary.com Archives of Applied Science Research, 2016, 8 (7):31-40 (http://scholarsresearchlibrary.com/archive.html) ISSN 0975-508X CODEN (USA) AASRC9 Comparison
QUICK START GUIDE 199R10546
 QUICK START GUIDE 199R10546 1.0 Overview This contains detailed information on how to use Holley EFI software and perform tuning that is included within the software itself. Once you load the software,
Exhaust System Bypass Valves and Exhaust Valve Bypass Controller
 Exhaust System Bypass Valves and Exhaust Valve Bypass Controller Basic Primer on Exhaust System Flow Velocity and Backpressure The information about exhaust system theory was obtained from research on
Dual VCP Optimization at WOT & part loads for a Gasoline engine
 Dual VCP Optimization at WOT & part loads for a Gasoline engine Indian GT-Suite Conference Yashaswi R Padmavathi R Saravanan Muthiah Mahindra & Mahindra Ltd. th Sep Copyright Mahindra & Mahindra Ltd. All
Crankcase scavenging.
 Software for engine simulation and optimization www.diesel-rk.bmstu.ru The full cycle thermodynamic engine simulation software DIESEL-RK is designed for simulating and optimizing working processes of two-