CRANFIELD UNIVERSITY ROLANDO VEGA DÍAZ
|
|
|
- Sophia Sullivan
- 6 years ago
- Views:
Transcription
1 CRANFIELD UNIVERSITY ROLANDO VEGA DÍAZ ANALYSIS OF AN ELECTRIC ENVIRONMENTAL CONTROL SYSTEM TO REDUCE THE ENERGY CONSUMPTION OF FIXED-WING AND ROTARY-WING AIRCRAFT SCHOOL OF ENGINEERING MSc by research MSc BY RESEARCH THESIS Academic Year: Supervisor: Dr Craig Lawson October
2
3 CRANFIELD UNIVERSITY School of Engineering MSc by Research THESIS Academic Year ROLANDO VEGA DÍAZ ANALYSIS OF AN ELECTRIC ENVIRONMENTAL CONTROL SYSTEM TO REDUCE THE ENERGY CONSUMPTION OF FIXED-WING AND ROTARY-WING AIRCRAFT Supervisor: Dr Craig LAWSON October 2011 This thesis is submitted in fulfilment of the requirements for the degree of Master of Sciences by research Cranfield University All rights reserved. No part of this publication may be reproduced without the written permission of the copyright owner 3
4 4
5 ABSTRACT Nowadays the aviation industry is playing an important role in our daily life, since is the main medium that satisfies the present human needs to reach long distances in the fastest way. But such benefit doesn t come free of collateral consequences. It is estimated that each year, only the air transport industry produces 628 mega tonnes of CO 2. Therefore, urgently actions need to be implemented considering that the current commercial fleet will be doubled by The research field for more efficient aircraft systems is a very constructive field; where novel ideas can be exploited towards the mitigation of the coming air transport development. In this research the configuration of the Environmental Control System (ECS) has been analysed aiming to reduce its energy consumption for both, fixed-wing and rotary-wing aircraft. This goal is expected to be achieved mainly through the replacement of the main source of power that supplies the ECS, from pneumatic to electric. Differently from the conventional ECS, a new electric-source technology is integrated in the system configuration to compare its effects on the energy consumption. This new technology doesn t bleed air directly from the engines; instead of that, it takes the air directly from the atmosphere through the implementation of an electric compressor. This new technology has been implemented by Boeing in one of its most recent airplanes, the B787. Towards achieving the main goal, a framework integrated with five steps has been designed. An algorithmic analysis is integrated on the framework. The first step meets the required aircraft characteristics for the analysis. The second step is in charge of meeting the mission profile characteristics where the overall analysis will be carried out. The third step assesses the conventional ECS penalties. The fourth step carries out a complex analysis for the proposed electric ECS model, from its design up to its penalties assessment. The fifth step compares the analysis results for both, the conventional and the electric models. The fourth step of the framework, which analyses the electric ECS, is considered the most critic one; therefore is divided in three main tasks. Firstly, a small parametric study is done to select an optimum configuration. This task is carried out towards meeting the ECS air conditioning requirements of a selected aircraft. i
6 Secondly, the cabin temperature and pressurization are simulated to analyse the response of the configured electric ECS for a mission profile. And finally, the fuel penalties are assessed in terms of system weight, drag and fuel due power-off take. To achieve the framework results, a model which receives the name ELENA has been created using the tool Simulink. This model contains 5 interconnected modules; each one reads a series of inputs to perform calculations and exchange information with other modules. Keywords: Environmental Control System, Fixed-Wing, Rotary-Wing, Energy, Fuel Penalty, Mission, Air Conditioning, Pressurization, Thermal Balance. ii
7 ACKONOWLEDGEMENTS Firstly, I want to give very special thanks to my mother Rosa Díaz; without such effort you have placed through my entire life I wouldn t be the person I am today. Thanks, thanks so much, mother! To my entire family whom have been beside me since my childhood in the best and most difficult moments; especially to my aunts María Elena Díaz and Victoria Díaz; and my uncle Eduardo Díaz. Great thanks to you. At Cranfield University I want to give especial thanks to my supervisor Dr Craig Lawson for his support and guidance. To Professor Howard Smith by have been sharing his experience. To Prof Dieter Scholz for its feedback received. To Shelagh and Francis Glenister by open me its great home and to make me live this England experience on an unforgettable way. To Carlos Linares by share its friendship over this MSc experience. To Ignacio Sanchez by its encouraging words. To those friends and staff; who make this academic year so enjoyable and constructive. Finally, I want to acknowledge Clean Sky JTI (Joint Technology Initiative) for have been sponsored my research. iii
8
9 TABLE OF CONTENTS ABSTRACT... i ACKONOWLEDGEMENTS... iii LIST OF FIGURES... xi LIST OF TABLES... xv NOTATIONS... xvii 1. ABREVIATIONS... xvii 2. LIST OF SYMBOLS... xix CHAPTER 1 INTRODUCTION The research for less-energy consuming systems The Environmental Control System Aim and objective Methodology Thesis Scheme... 5 CHAPTER 2 THE ENVIRONMENTAL CONTROL SYSTEM The ECS Principles Air Conditioning Configurations Air Cycle Machine Principles The Atmosphere Temperature Static pressure Density Speed of sound Pressurisation Flow Distribution Cabin Thermodynamic Balance Heat Exchangers Combustion Heating Principles Airworthiness Requirements Models to Simulate the ECS New Technologies The Fuel Penalty v
10 2.14. Measurement Cost Estimation Depreciation Cost Fuel Cost Direct Maintenance Cost Airbus A ATR Bell The Engine Performance Simulation Tool Engine Data for the Engine Performance Tool CHAPTER 3 THE METHODOLOGY OF ANALYSING THE ENVIRONMENTAL CONTROL SYSTEM Research Framework Process Aircraft Selection Mission Profile Conventional ECS analysis Electric ECS analysis Results comparison The Software for Analysis ELENA v1 Environmental Control System Analysis Tool Framework scheme Simulink scheme AIRCRAFT INPUTS MISSION PROFILE CALCULATIONS Mission Inputs Mission Outputs Cruise Values Mission profile signals Departure/Arrival airport values ELECTRIC ECS CONDITIONING PACK ECS Conditioning Pack Inputs Conditioning Pack Outputs Compressor Fan vi
11 Heat Exchanger Turbine Manifold ECS Selection Signal SFC rate increase due to Pneumatic and Electric Powers CABIN SIMULATION CALCULATIONS Thermal Balance Pressure Module FUEL PENALTY CALCULATIONS ECS Fuel Flow Penalties ECS Drag Penalties ECS Weight Penalties ECS Total Fuel Weight for the Mission FUEL PENALTY FOR A COMBUSTION HEATER MODEL SPECIFICATIONS VALIDATION PROCESS Mission Profile ECS power consumption Electric ECS power Consumption Temperature Pressure Fuel penalties CHAPTER 4 FIXED-WING AIRCRAFT ANALISYS 1 - A CIVIL TURBO-FAN AIRPLANE Aircraft Selection Mission Profile Conventional ECS Analysis Pneumatic energy required Engine SFC impact Conventional model impact Electric ECS Analysis Conditioning pack configuration Electric ECS electric energy required vii
12 Engine SFC impact Electric ECS model impact Results comparison Fuel Cost CHAPTER 5 FIXED-WING AIRCRAFT ANALISYS 2 - A REGIONAL TURBO-PROP AIRPLANE Aircraft Selection Mission Profile Conventional ECS Analysis Pneumatic energy required Engine SFC impact Conventional model impact Electric ECS Analysis Conditioning pack configuration Electric ECS electric energy required Engine SFC impact Electric ECS model impact Results comparison Fuel Cost CHAPTER 6 ROTARY-WING AIRCRAFT ANALISYS FOR A 5 PASSENGERS HELICOPTER Aircraft Selection Mission Profile Conventional ECS Analysis Pneumatic energy required Engine SFC impact Conventional model impact Electric ECS Analysis Conditioning pack configuration Electric ECS electric energy required Engine SFC impact Electric ECS model impact Combustion heater Results comparison viii
13 6.7. Fuel Cost CHAPTER 7 CONCLUSIONS CHAPTER 8 RECOMMENDATIONS FOR FUTURE WORK REFERENCES BIBLIOGRAPHY APPENDIX A PREVIOUS SIMULATION FRAMEWORK APPENDIX B Alternative method to calculate the fuel penalty APPENDIX C PREVIOUR FRAMEWORK PROCESS APPENDIX D - CONCEPTUAL ELECTRIC ECS DESIGN FOR A FLYING WING ix
14
15 LIST OF FIGURES Page. Figure 1: Common ECS scheme for fixed-wing aircraft... 2 Figure 2: Framework flowchart... 4 Figure 3: Common ECS scheme for fixed-wing aircraft... 7 Figure 4: ECS air sources distribution... 8 Figure 5: Pneumatic energy outputs... 9 Figure 6: Engine bleed flow pressure and temperature at various flight stages... 9 Figure 7: ECS air conditioning section Figure 8: Basic ECS scheme with the control unit Figure 9: ECS cockpit control unit Figure 10: Common ECS scheme for rotary-wing aircraft Figure 11: Air Cycle Machine - Turbofan Figure 12: Air Cycle Machine - Bootstrap Figure 13: Air Cycle Machine - 3-Wheel Figure 14: Temperature values for different altitudes at the atmosphere Figure 15: Pressure levels at different altitudes Figure 16: Cabin pressurization achieved by the control unit Figure 17: Airplane cabin air distribution Figure 18: Helicopter air distribution Figure 19: Heat Exchanger Figure 20: Combustion Heater Figure 21: Flowmaster V Figure 22: Decimals Figure 23: Depreciation over time Figure 24: Airbus A Figure 25: Airbus A321 Air Cycle Machine Figure 26: Airbus 321 ECS scheme Figure 27: ATR Figure 28: Cabin of the ATR Figure 29: Bell Figure 30: Turbomatch Figure 31: GasTurb 11 Entry Level Version Figure 32: Detailed flowchart for the analysis process Figure 33: Mission profile for ELENA Figure 34: Simulation framework for ELENA v Figure 35: Simulation framework for the rotary-wing aircraft Figure 36: Final version of the Simulink model ELENA Figure 37: Final version of the Simulink model ELENA (Left view) Figure 38: Final version of the Simulink model ELENA (Right view) Figure 39: Simulink model for the rotary-wing aircraft Figure 40: Aircraft Database Characteristics xi
16 Figure 41: Mission Profile Module Figure 42: Content for the box of mission profile calculations Figure 43: Mission cruise calculations in ELENA Figure 44: Aircraft speed calculation in ELENA Figure 45: Flight path to be followed by the algorithm Figure 46: Algorithm for the flight path, designed in ELENA Figure 47: Box for departure/arrival airport in ELENA Figure 48: Departure airport calculations in ELENA Figure 49: Arrival airport calculations in ELENA Figure 50: Electric ECS typical components Figure 51: Conditioning Pack Module Figure 52: Conditioning pack module in ELENA Figure 53: Conditioning pack module in ELENA (Left side) Figure 54: Conditioning pack module in ELENA (Right side) Figure 55: ECS flow requirement in ELENA Figure 56: Air Cycle Machine - Compressor calculations in ELENA Figure 57: Air Cycle Machine - Fan calculations in ELENA Figure 58: Air Cycle Machine - Heat exchanger calculations for ELENA Figure 59: Air Cycle Machine - Turbine calculations for ELENA Figure 60: Air Cycle Machine - Manifold calculations for ELENA Figure 61: Cabin simulator module in ELENA Figure 62: Content of the module for simulation Figure 63: Calculations for the thermal balance inside ELENA Figure 64: Heat loads Figure 65: Internal volume energy Figure 66: Strategy to regulate the cabin temperature Figure 67: Calculations for pressurization in ELENA Figure 68: Pressurization box in ELENA Figure 69: Rate of pressure entering in the aircraft cabin Figure 70: Calculations for the Pressure Release Valve Area in ELENA Figure 71: Fuel Penalty Module for ELENA Figure 72: Energy penalties calculations in ELENA Figure 73: Fuel penalties calculations due to power-off take Figure 74: Aircraft performance calculations Figure 75: System weight penalty in ELENA Figure 76: Combustion heater module on a first-stage model version Figure 77: Combustion heater scheme Figure 78: Mission profile validation Figure 79: Electric power consumption depending on the aircraft size (image from Lebherr) Figure 80: Cabin temperature for the A Figure 81: Cabin temperature for the ATR Figure 82: Cabin temperature for the Bell Figure 83: Pressurization validation Figure 84: Mission profile: Route London Heathrow-Paris Charles De Gaulle xii
17 Figure 85: Input data for the mission profile between the airports, London Heathrow and Paris Charles De Gaulle Figure 86: Time [s] vs. Altitude, Temperature and Pressure outputs delivered by the conditioning pack Figure 87: Time [s] vs. Altitude and Cabin Temperature Figure 88: Time [s] vs. Cabin Temperature Figure 89: Time [s] vs. Altitude, Cabin and Atmospheric Pressures, Pressure Differential and Pressure Release Valve Area Figure 90: Estimated fuel cost for the electric and conventional ECS's in the Airbus A Figure 91: Mission profile: Route Barcelona El Prat and Madrid Barajas Figure 92: Input data for the mission profile between Barcelona El Prat and Madrid Barajas Figure 93: Time [s] vs. Altitude, Temperature and Pressure outputs delivered by the conditioning pack Figure 94: Time [s] vs. Altitude and Cabin Temperature Figure 95: Time [s] vs. Cabin Temperature Figure 96: Time [s] vs. Altitude, Cabin and Atmospheric Pressures, Pressure Differential and Pressure Release Valve Area Figure 97: Estimated fuel cost for the electric and conventional ECS's in the ATR Figure 98: Mission profile: Route Cranfield University Airport to London City Airport 132 Figure 99: Input data for the mission profile between Cranfield University Airport and London City Airport Figure 100: Temperature range output delivered by the conditioning pack Figure 101: Temperature output delivered by the conditioning pack Figure 102: Temperature output delivered by the conditioning pack Figure 103: Estimated fuel cost for the electric and conventional ECS's in the Bell Figure 104: Scheme for the previous version of the analysis model Figure 105: Previous version, built on Simulink, of the ECS simulation model xiii
18
19 LIST OF TABLES Page. Table 1: Most common helicopters registered in the United Kingdom Table 2: ISA sea level conditions Table 3: ECS concepts comparison Table 4: Data for the 787 ECS Table 5: Considerations for future direct maintenance cost estimations Table 6: Engine inputs for the engine performance simulation tool Table 7: Level of model accuracy Table 8: Aircraft inputs Table 9: Mission Inputs Table 10: Electric ECS typical components Table 11: Conditioning Pack Configuration Inputs Table 12: Difference in components for the electric and conventional ECS's Table 13: ECS model interface Table 14: Electric ECS power consumption per passenger Table 15: Aircraft inputs: Airbus A Table 16: Mission Inputs Table 17: Pneumatic power required Table 18: Engine SFC Impact Table 19: ECS configuration inputs Table 20: Conventional ECS fuel penalties Table 21: ECS configuration inputs Table 22: Electric energy requirement Table 23: Engine SFC Impact Table 24: ECS configuration inputs Table 25: Electric ECS fuel penalties Table 26: Results comparison for the conventional and electric ECS's Table 27: Results comparison for the conventional and electric ECS's (with the 90 % of the original ECS weight) Table 28: Results comparison for the conventional and electric ECS's (with the 110 % of the original ECS weight) Table 29: Aircraft inputs: ATR Table 30: Pneumatic power required Table 31: Engine SFC Impact Table 32: ECS configuration inputs Table 33: Conventional ECS fuel penalties Table 34: ECS configuration inputs Table 35: Electric energy required Table 36: Engine SFC Impact Table 37: ECS configuration inputs Table 38: Electric ECS fuel penalties xv
20 Table 39: Results comparison for the conventional and electric ECS's Table 40: Results comparison for the conventional and electric ECS's (with the 90 % of the original ECS weight) Table 41: Results comparison for the conventional and electric ECS's (with the 110 % of the original ECS weight) Table 42: Aircraft inputs: Bell Table 43: Pneumatic power required Table 44: Engine SFC Impact Table 45: ECS configuration inputs Table 46: Conventional ECS fuel penalties Table 47: ECS configuration inputs Table 48: Electric ECS energy required Table 49: Engine SFC Impact Table 50: ECS configuration inputs Table 51: Electric ECS fuel penalties Table 52: Combustion Heater requirements Table 53: Combustion Heater requirements Table 54: Combustion Heater results Table 55: Results comparison for the conventional and electric ECS's Table 56: Results comparison for the conventional and electric ECS's (with the 90 % of the original ECS weight) Table 57: Results comparison for the conventional and electric ECS's (with the 110 % of the original ECS weight) xvi
21 NOTATIONS 1. ABREVIATIONS Units (International System) AMSL Above the Mean Sea Level m AMSL Above the Mean Sea Level AUM All Up Mass kg AUM All Up Mass kg ATM BPR cab ETA C CECS Atmosphere Bypass Ratio Cabin Combustion Efficiency Compressor Conventional Environmental Control System CFR Cooling mass flow ratio - CFR DOC EECS EM Cooling Mass Flow Ratio Direct Operational Cost Electric Environmental Control System Electric Motor EPW Electric Power W ECS ELENA Environmental Control System Environmental Control System Analysis Tool FAR Fuel air ratio - FDM Fuel Design Mass kg FW Fuel flow kg/s xvii
22 FHV Fuel heating value J/kg fus hx in ISA Ma mf max Fuselage Heat Exchanger Inlet parameter International Standard Atmosphere Mach number Manifold Maximum PW Net Shaft Power W FN Net Thrust N EN EN PAX out PDV PRV Number of engines Number of engines Number of passengers Outlet parameter Pressure reduction valve Pressure release valve SPW Shaft Power W SRI Solar Radiation Index - SFC Specific Fuel Consumption kg/(n s) T Turbine xviii
23 Chapter 1 Introduction 2. LIST OF SYMBOLS Units (International System) h Altitude m A Area m 2 ρ Density kg/m 3 D Drag N η Efficiency - γ Gamma - g Gravity m/s 2 q c Heat by convection W q sr Heat by sun radiation W q G Heat generated in inside the system W τ Heat transfer coefficient W/(m 2 K) R Ideal gas constant J/(kg K) or J/(K mol) E Internal energy J L Lift N r Lift to Drag Ratio Ma Mach number - m Mass kg ṁ Mass flow/pneumatic Power kg/s M Molar mass kg/mol Pressure drop - π Pressure ratio - π Pressure Ratio - σ sr Radiation intensity by the sun W/m 2 d Range/distance m f s Security factor - SFC increase/decrease ratio - C P Specific Heat J/(kg K) c Speed of Sound m/s P Static pressure Pa T Temperature K or C t Time s xix
24 Chapter 1 Introduction t Time sec Q Total heat W v Velocity/Speed m/s vs Vertical speed m/s V Volume m 3 W Weight N xx
25 Chapter 1 Introduction CHAPTER 1 INTRODUCTION 1.1. The research for less-energy consuming systems Nowadays the environmental impact produced by the air transportation industry has been a matter of big concern; according with [1]Clean Sky JTI (Joint Technology Initiative) it represents 2% of human-induced CO 2 emissions and 12% of the overall transport systems. This impact is reflected by the 628 mega tonnes of CO 2 produced yearly. Urgently strategies need to be implemented since it is estimated that the commercial fleet will be doubled by 2050 due to the introduction of about 1300 new international airports. Such strategies can be implemented with the research on lessenergy consumer technologies in the aircraft systems. This is a field where novel ideas can be exploited to mitigate the coming collateral effects of the air transport industry The Environmental Control System The Environmental Control System (ECS) is the responsible to provide a conditioned cabin for the crew and passengers on modern aircraft. This system must achieve requirements of pressure, temperature and air quality; especially in high altitudes where those aircraft perform its missions and where the conditions are too adverse for the human survival. Considering study purposes, a conventional ECS is principally integrated with four sections; the air or pneumatic energy sources, the air conditioning pack, the cabin and the control unit. The following figure has been drawn to show the scheme for a fixedwing aircraft. Other components like filters, intakes and ozone reduction packs are included in the ECS conditioning pack. Since such components don t represent a considerable impact for the final comparison result, currently are not considered for this research. 1
26 Chapter 1 Introduction Figure 1: Common ECS scheme for fixed-wing aircraft As seen on the previous figure, the pneumatic energy source provides the flow with an internal energy, which can be measured in terms of mass flow for thermal balance calculations. This mass flow is associated with their respective temperature, pressure and density. Depending on the kind of pneumatic source and the mission status, the mass flow can be provided with different characteristics. The pneumatic energy can be provided from engine bleeding, an Alternate Power Unit APU or simply form ground services when the aircraft is parked at the airport Aim and objective Following the strategies to mitigate the environmental impact, a research is outlined for the energy consumption of the Environmental Control System (ECS). The ECS is the most energy-demanding system in the aircraft, consuming up to [2]75% of the energy designated for the aircraft systems and the 3-5% of the power produced by the engines. The importance in analysing the energy consumption of the ECS, allow us to improve the efficiency of the entire system altering their configuration, hence resulting on a reduction of the energy requirement for the aircraft and consequently for their emissions. 2
27 Chapter 1 Introduction Is expected that the application of an electric ECS will achieve positive values on the reduction of the fuel penalty; since the process of bleeding air involves a considerable quantity of energy lose. This energy lose is represented with the reduction on the engine mass flow available; pressure drops through the ECS pipelines and temperature lose through the overall system Methodology Aiming to achieve the main goal, the main source of power that supplies the ECS is replaced, from pneumatic to electric. Differently from the conventional ECS, a new electric-source technology is integrated in the system configuration to compare its effects on the energy consumption. This new technology doesn t bleed air directly from the engines; instead of that, it takes the air directly from the atmosphere through the implementation of an electric compressor. This new technology has been implemented by Boeing in one of its most recent airplanes, the B787. In addition, to achieve the main goal a framework integrated with five steps has been designed. An algorithmic analysis is integrated on the framework. The first step meets the required aircraft characteristics for the analysis. The second step is in charge of meeting the mission profile characteristics where the overall analysis will be carried out; this mission profile includes the three main flight phases, climbing, cruise and a descent. The third step assesses the conventional ECS fuel penalties. The fourth step carries out a complex analysis for the proposed electric ECS model. The fifth step compares the analysis results for both, the conventional and the electric models. The framework algorithm is shown in the following figure. 3


28 Chapter 1 Introduction Figure 2: Framework flowchart The fourth step of the framework, which analyses the electric ECS, is considered the most complex; therefore is divided in three main tasks. Firstly, a small parametric study to select an optimum configuration is made. This task is carried out towards meeting the ECS air conditioning requirements of a selected aircraft. Secondly, the cabin temperature and pressurization are simulated to analyse the response of the configured electric ECS for this mission profile; this simulation lets conclude if the new 4
29 Chapter 1 Introduction proposed ECS configuration achieves the cabin requirements for this mission profile. And finally, the fuel penalties are assessed in terms of fuel flow due power-off take, system drag generated and system weight. To achieve the framework results, a model which receives the name ELENA has been created using the tool Simulink. This model contains 5 interconnected modules; each one reads a series of inputs to perform calculations and exchange information with other modules. The name ELENA has been selected as an acronym for Environmental Control System Analysis Tool. The main analysis is performed for both, fixed-wing and rotary-wing aircraft, though a contribution for two areas of a project from Clean Sky JTI (Joint Technology Initiative); that belongs to the European Commission for funding research on Europe. The fixedwing analysis is part of the area Technology Evaluator and the rotary-wing analysis is part of the area Systems for Green Operation Thesis Scheme The chapter one gives a general overview of the research, giving an introduction about the research justification, the main objective and the proposed methodology. The second chapter presents the main concepts which were acquired with the literature review. Chapter three presents the implemented methodology with the design of the frame work and the design of the simulation tool ELENA. Chapter four and five present the results for fixed-wing aircraft; each chapter is focused on a different aircraft. Chapter five presents the results for the rotary-wing aircraft. Chapter six presents the conclusions. The seventh chapter presents recommendations for future work related with this research. 5
30

, which combines the principles of thermodynamics and fluid dynamics to achieve its goal.")
31 Chapter 2 The Environmental Control System CHAPTER 2 THE ENVIRONMENTAL CONTROL SYSTEM 2.1. The ECS Principles Nowadays with the increasing demand on the modern commercial air transportation jet-propelled, high speed and very manoeuvred aircraft it has been very essential to maintain a conformable cabin for the passengers in all the phases of any flight mission. This job can only be done by the [3]Environmental Control System (ECS), which combines the principles of thermodynamics and fluid dynamics to achieve its goal. However it is not easy to maintain desire air cabin requirements, since any flight mission involves various phases, each one with a particular atmospheric condition. Figure 3: Common ECS scheme for fixed-wing aircraft Considering study purposes, a conventional ECS is principally integrated with four sections; the air or pneumatic energy sources, the air conditioning pack, the cabin and the control unit. The previous figure has been drawn to show the scheme for a fixedwing aircraft. Other [4]components like filters, intakes and ozone reduction packs are included in the ECS conditioning pack. Since such components don t represent a 7

32 Chapter 2 The Environmental Control System considerable impact for the final comparison result, currently are not considered for this research. As seen on the previous figure, the pneumatic energy source provides the flow with an internal energy, which can be measured in terms of mass flow for thermal balance calculations. This mass flow is associated with their respective temperature, pressure and density. Depending on the kind of pneumatic source and the mission status, the mass flow can be provided with different characteristics. This pneumatic energy can be provided from engine bleeding, an Alternate Power Unit APU or simply form ground services when the aircraft is parked at the airport. The following figure has been drawn to show the distribution of pneumatic power from its sources. Figure 4: ECS air sources distribution The main parameters that are considered for the engine sources are the mass flow, temperature and pressure. Those parameters change depending on the flight stage. 8
![Chapter 2 The Environmental Control System Figure 5: Pneumatic energy outputs The following [4]figure has been drawn](/docs-images/76/73863396/images/33-0.jpg "to show some typical values of pressure and temperature provided by aircraft engines at the three flight stages, idle,")


33 Chapter 2 The Environmental Control System Figure 5: Pneumatic energy outputs The following [4]figure has been drawn to show some typical values of pressure and temperature provided by aircraft engines at the three flight stages, idle, cruise and take-off. Figure 6: Engine bleed flow pressure and temperature at various flight stages The air conditioning section transforms the internal energy of this flow, which have high pressure and temperature, to provide an appropriate air flow for the passengers. This component works with components such as pressure reduction valves, heat exchangers and conditioning packs. The following figure has been drawn to show the flow distribution for the conditioning packs. 9

34 Chapter 2 The Environmental Control System Figure 7: ECS air conditioning section The cabin establishes the quantity of energy required; hence, it is affected by its volume and heat loads. The control unit regulates the entire air conditioning following the normal operational requirements. That unit sends signals to regulate automatically the pressure and with reduction valves and the temperature with the operation of valves located in the manifold. The pressurization is regulated as well with the action of a Pressure Release Valve. The following figure has been drawn to show the function of the control unit. 10


35 Chapter 2 The Environmental Control System Figure 8: Basic ECS scheme with the control unit Depending on the aircraft manufacturer, the control unit has basic manual controls to adjust the ECS operation. For normal scheduled flights, those controls are mainly used to control the temperature for the cabin sections and the cockpit. The following figure shows a control unit which is located in the aircraft cockpit. Figure 9: ECS cockpit control unit 11
36 Chapter 2 The Environmental Control System 2.2. Air Conditioning Configurations The ECS provides a confortable cabin for the passengers instead of the adverse ambient conditions which can be present during a flight mission. However to aim its objective, various [5]configurations in the conditioning section can be selected depending on the customer requirements. Those configurations include the Air Cycle Machine, the Vapour Cycle Machine, the Combustion Heater and the Exhaust Gases Heater. The following table shows the capabilities of each system. Conditioning pack Air Cycle Machine Vapour Cycle Machine Combustion Heater Exhaust Gases Heater Capability Cooling and heating Cooling Heating Heating The Air Cycle Machine, in spite of consuming more energy and produce more payload penalty, offers both capabilities which makes it the most common conditioning pack used in aviation. This component works with the principle of transforming heat into work. The Vapour Cycle Machine is light weighted, but can t afford big demands for big commercial airplanes and only is capable to provide cooling, also is efficient in a 60%. This component works with a HCFC refrigerant, dropping the temperature of a system volume by removing heat and sending it elsewhere. The Combustion Heater only provides heating; their advantages are presented with its low fuel consumption. This system works heating fresh air flow through a heat exchanger that receives heat from a combustion chamber; this process uses the convection principle of the thermodynamics. Since this conditioning pack only heats atmospheric air, is not suitable for pressurized cabins or non-pressurized cabins that require cooling. 12
![Chapter 2 The Environmental Control System The [6]exhaust gases heater only provides heating.](/docs-images/76/73863396/images/37-0.jpg "This conditioning pack works though a heat exchanger that transfer the heat produced by the exhaust gases to fresh air taken from the atmosphere; is commonly presented on light trainee aircraft.")
37 Chapter 2 The Environmental Control System The [6]exhaust gases heater only provides heating. This conditioning pack works though a heat exchanger that transfer the heat produced by the exhaust gases to fresh air taken from the atmosphere; is commonly presented on light trainee aircraft. The major disadvantage is the risk of mixture with exhaust gases if a rupture is presented in the system distribution. In the case of the fixed-wing aircraft the most common configuration is the Air Cycle Machine; therefore will be considered for this research. In the other hand for the rotarywing aircraft the selection was more complex. Therefore, a survey was done to determinate the common ECS conditioning packs. The following condition, civil helicopters registered in the United Kingdom with more than 20 units, was used as constrain for this survey. The next table shows the results. Table 1: Most common helicopters registered in the United Kingdom Seeking at [7]Jane s references, the ECS is optional for civil helicopters. For heating purposes, a combustion heater or direct hot bleed air is used; and for cooling purposes an air cycle/vapour machine is used. The selection of the ECS depends on the costumer requirement regarding the operation purpose. For this research the Air Cycle Machine and the Combustion Heater will be analysed; placing more emphasis in the 13

38 Chapter 2 The Environmental Control System first one. The next figure has been drawn to show the conventional ECS scheme for rotary-wing. Figure 10: Common ECS scheme for rotary-wing aircraft 2.3. Air Cycle Machine Principles For cooling purposes an Air Cycle Machine is analysed, following the previous analysis made in the sub-chapter 2.2. The following figures have been drawn to show the principle of the Air Cycle Machine. 14


39 Chapter 2 The Environmental Control System Figure 11: Air Cycle Machine - Turbofan Figure 12: Air Cycle Machine - Bootstrap 15

40 Chapter 2 The Environmental Control System Figure 13: Air Cycle Machine - 3-Wheel From the prevous analysis in the configuration of the Air Cycle Mahcine, the following equations have been taken. Those equations derive the main parameters mentioned in the subchapter 2.1, the pressure, temperature and mass flow. Fan/Compressor outlet temperature [ ( ) ] Turbine out temperature 16
41 Chapter 2 The Environmental Control System 2.4. The Atmosphere The earth atmosphere is an important field of consideration for ECS analysis since is the main aspect that affects its performance during a mission profile. Common civil aviation performs its activities in the troposphere which contains approximately the 80% of the complete atmospheric mass. The variation of the atmospheric parameters, such as temperature, pressure, density and speed of sound; are referenced by the International Standard Atmosphere model. The model gives the following reference data for sea level conditions. Table 2: ISA sea level conditions Typical Sea Level Conditions Temperature base 15 C Pressure Pa Density kg/m 3 17
42 Chapter 2 The Environmental Control System Figure 14: Temperature values for different altitudes at the atmosphere For calculations of the atmospheric conditions, the following equations are used in ranges between 0 and meters above the sea level. Temperature [ ( * ] Static pressure ( * 18
43 Chapter 2 The Environmental Control System Density Speed of sound 2.5. Pressurisation The main purpose of the pressurization aims to provide acceptable levels of oxygen for the passengers and crew. Basically, since the pressure levels at normal operation conditions are too low, with values around 25 kpa; the oxygen concentration is too low. Hence, the ECS needs to provide acceptable pressure levels for at least 75 kpa or the equivalent for an altitude of 2400 m above the main sea level. This value represents a pressure differential of around 50 kpa. Major values for a better cabin air quality, higher than 75 kpa, can be achieved on the cabin pressurization; but since the pressure differential would be higher, the security factor for the pressurized structure should be as well. Hence, for civil aviation the limits are conservative. The following figure shows the behaviour of the pressure at respective altitudes. 19


44 Chapter 2 The Environmental Control System Figure 15: Pressure levels at different altitudes Following the previous ideas, the pressurization is controlled automatically by a control unit. Aiming to achieve the previous requirements, this unit must achieve the following path in real mission profiles. Figure 16: Cabin pressurization achieved by the control unit 20
45 Chapter 2 The Environmental Control System For calculation purposes some equations have been considered form the field of fluid dynamics. Pressure rate of change for entry flow Pressure rate of change for the output valve 2.6. Flow Distribution For a manifold with one entry and two exits the temperature is calculates with the energy conservation principle: 2.7. Cabin Thermodynamic Balance The calculations of the thermal balance analyse the temperature behaviour through the time under certain conditions like, solar radiation, heat produced by passengers, atmosphere temperature and air ventilation for cabin temperature regulation. The following figures show the air distribution for the aircraft cabin; as seen, the air comes from the roof section towards the floor sections. This 21


46 Chapter 2 The Environmental Control System distribution path aims to reduce the possible biological effects, like virus or bacteria, that can be affect the passengers or crew members. Figure 17: Airplane cabin air distribution Figure 18: Helicopter air distribution The results of the thermal balance give signals for the conditioning pack which allows it to control the air flow towards achieve a specific temperature given by the crew. The main calculations for the thermal balance come form the study of the first law of thermodynamics. 22
47 Chapter 2 The Environmental Control System Below is the appropriated equation to be used on the system, considering the current configuration. Some aspects must be considered to perform thermal balance calculations, since are heat contributors. Energy by solar radiation Energy by convection Energy generated in the system 2.8. Heat Exchangers The heat exchangers are an important component for the environmental control system. Its main function aims to reduce the high flow temperature which has been achieved through the flow compression. 23

48 Chapter 2 The Environmental Control System Figure 19: 1 Heat Exchanger Heat exchanger equation The following equation has been considered to perform calculations on heat exchangers Combustion Heating Principles The Combustion Heater only provides heating, their disadvantages are presented with it high fuel consumption, which can only be affordable for small aircraft. This system works heating fresh air flow with a heat exchanger that receives heat from a combustion chamber; this process uses the convection principle of the thermodynamics

49 Chapter 2 The Environmental Control System Figure 20: 2 Combustion Heater Airworthiness Requirements For considerations of the ECS design; According to the Certification Specifications, for [8]Large Aeroplanes CS25 and [9]Large Rotorcraft CS29, an air flow of 0.3 m 3 are required, which are equivalent to a mass flow of kg/s at an air density of 1.29kg/m 3 (such calculation is described with the following procedure. Even so, some [10]literature for engine design purposes establishes a mass flow of kg/s, which is a higher value and with a better approach to be consider on this calculations. 0.3m 3 /min per passenger 0.005m 3 /sec per passenger Minimum Fresh Air = kg/s
.")
50 Chapter 2 The Environmental Control System Models to Simulate the ECS For simulation purposes of the ECS, the Flowmaster Group offers the software Flowmaster V7, which is capable of perform 1D Computational Fluid Dynamics (CFD). This tool allows the analysis and modelling of the fluid mechanics with diverse system configurations and distributions. The next figure shows a display of the software framework. Figure 21: Flowmaster V New Technologies For the new Boeing 787, a new all electric concept (AE-ECS) has been integrated by Boeing. This ECS doesn t use pneumatic power from the engine; instead of that it uses its electrical power to take air directly from the atmosphere. Compared to a bleed air system, this concept offers lower pressure and temperature for the Air Cycle Machine, therefore less energy loses as no pre-cooling is required. [11]Next table shows the air characteristics for concepts, the conventional and the more electrical. 26
51 Chapter 2 The Environmental Control System Table 3: ECS concepts comparison ECS Temperature ( C) Pressure (Pa) Conventional Electrical Next table shows some [12]data for the All Electrical ECS in the Boeing 787. Table 4: Data for the 787 ECS Number of passengers 300 Cabin pressure at cruising 82kPa Ram air compressors diameter 0.3m Ram air compressors RPM Ram air compressors pressure-ratio 5 Ram air compressors temperature increment System weight 90 C 200kg Estimated fuel saving 5000kg or 5% On the other hand Airbus continues with the conventional ECS, but looks for an efficiency improvement with advanced engines, the RR Trent 1700 and the GE GEnx 1A The Fuel Penalty For calculations of the fuel penalties, two methodologies have been analysed. The first methodology has been taken from the [13]Applied Thermodynamics Manual. The results for this methodology are presented on the annex B. The second methodology 27
52 Chapter 2 The Environmental Control System has been taken form the [11]lectures of the Dr C.P. Lawson and has been selected for this research, since the first one has presented difficulties to be applied for a rotarywing aircraft and for the electric ECS. Hence, from the Dr Lawson lectures, the following equation is used to obtain the increased weight of fuel used due to the system ( ). ( * ( ) Where, Subsequently, the following equation is used to derive the fuel weight due to system weight. ( ) Subsequently, the following equation is used to derive the fuel weight due to system power-off take. ( ) 28

53 Chapter 2 The Environmental Control System Subsequently, the following equation is used to derive the fuel weight due to system drag. ( ) Measurement Two ideas are implemented to facilitate the calculation procedures. The first idea involves the application of the International Measurement System. Thus, the possibility by getting mistakes is minimized. The second idea looks for easy data reading and handling with the use of few decimals as possible, no more than thousandths as seen on the next figure. Figure 22: Decimals Aiming to achieve this objective for easy understanding and mistake prevention, the appropriate mathematic conversions will be performed Cost Estimation A [14]method proposed by Prof Dieter Scholz has been selected aiming to assess further impact in terms of direct operational cost for the ECS. This method called fundamental DOC SYS is divided in three main contributions; System Depreciation, Fuel and Direct Maintenance Cost. For the case of this study, the System depreciation has been generalized to analyse the depreciation in 20 years. For Fuel Cost contribution, 29
54 Chapter 2 The Environmental Control System each one of the three different cases, presented in this research, is analysed. And for Direct Maintenance Cost a basic introduction of what can be expected is done. Depreciation Cost Where, Following this methodology, the following chart has been generated to show how the system depreciation cost over its original value, for a period of 20 years. This study has been done with three different residuals, 0.15, 0.3, 0.45 and 0.6. Figure 23: Depreciation over time 30
55 Chapter 2 The Environmental Control System Fuel Cost To assess the fuel cost this methodology is mainly based in the amount of fuel for the mission, the current fuel price and the number of this kind of flight missions per year. To assess the amount of fuel used in the mission, this methodology applies their respective methodology. For this research the methodology of Dr Lawson will be applied in conjunction with the overall study framework. Where, Jet A-1 Price on 27 Nov 2011 [15] Current price = cents/gal Jet A-1 Density = kg/l 1gal=4.546 Litres Then, ( * ( * ( * 31
56 Chapter 2 The Environmental Control System Direct Maintenance Cost The calculation of direct maintenance cost requires exhaustive analysis. Therefore, the main methodology procedure is mentioned for future work. Hence the following equation describes this estimation. Where, ( ) Aiming to support future research in the Direct Maintenance Cost, the following considerations should be taken. Those considerations have been established due to the new electric ECS components. Table 5: Considerations for future direct maintenance cost estimations Extra electric ECS Component Compressor for the ram air Electric motor Wiring to run the electric motor Note Degradation of the compressor materials which can generates reduction in its compression capability. Degradation of internal mechanism due to kinetic forces resulting in its torque capacity to move the compressor. Degradation of wiring due to external factors such as corrosion produced by hydraulic/oil/fuel fluids that could generate a short circuit. On the other hand, since the new components of the electric ECS are not innovative, only its configuration; then is not expected a big cost increment for this maintenance estimation cost. 32
57 Chapter 2 The Environmental Control System Airbus A The first of two models, which has been selected in the fixed-wing aircraft analysis, is the Airbus A This airplane, the largest version of the family A320, offers one of the best seat-mile cots against its competitors; putting this airplane on a big demand for the air transport market. This aspect makes the A a good model for this study. The A has a narrow body configuration, which can accommodate up to 220 passengers on a single class configuration. Among its characteristics, the airplane has an overall length of 44.5 m; a range of operation of up to 5500 km and a maximum take-off mass of 95.5 tonnes. Those characteristics make the airplane a mid-range purpose. The following figure shows the A Figure 24: Airbus A This twin-engine airplane, which requires 148 kn per engine, can be powered with two engine options; the CFM56 or the International Aero Engines V2500. Been the first engine the most common. Its ECS is composed by an Air Cycle Machine which can be seen on the following figure. 33
58 Chapter 2 The Environmental Control System Figure 25: Airbus A321 Air Cycle Machine The air distribution in the A follows a standard path, which is divided on three zones, the cockpit, forward and backward cabin sections. The air distribution can be seen on the following image. Figure 26: Airbus 321 ECS scheme 34
![Chapter 2 The Environmental Control System 2.17. ATR 72-500 The second selected airplane to be case of study for this research is the [16]ATR 72-500.](/docs-images/76/73863396/images/59-0.jpg "This airplane is a small regional civil fixed-wing aircraft, which can carry up to 74 passengers plus 2 crew members. This model is the latest development of the ATR 72 family.")
59 Chapter 2 The Environmental Control System ATR The second selected airplane to be case of study for this research is the [16]ATR This airplane is a small regional civil fixed-wing aircraft, which can carry up to 74 passengers plus 2 crew members. This model is the latest development of the ATR 72 family. Among its characteristics, this airplane has a maximum range of 1800 km and is powered by two turbo-prop engines, the PW127F. The following figure shows the ATR Figure 27: ATR The cabin of the ATR provides a pressurized environment. Since the main source of thrust comes from two turbo-prop engines the maximum altitude that the 35


60 Chapter 2 The Environmental Control System airplane can climb for cruise purposes is 7600m. The following figure shows the passengers cabin. Figure 28: Cabin of the ATR Bell 206 For rotary-wing analysis, the Bell 206 JetRanger has been selected as model of study. This helicopter is mainly operated for corporate transportation, gas and oils industries, law enforcement and fire fighting. Figure 29: Bell


61 Chapter 2 The Environmental Control System The Engine Performance Simulation Tool Performance simulation tools are used for this research to carry out the calculations of Specific Fuel Consumption due to power off-take. Hence, Turbomatch of Cranfield University and Gasturb 11 Entry Level Version have been selected. Both tools were used to complement each other. This simulation is made in design point conditions for the cruise level. [17]Turbomatch is a computational model based on a FORTRAN structure which can perform calculations of performance for gas turbine engines, basically through some input parameters which are the engine characteristics; those input parameters are written in a text format. The results on Turbomatch are generated in a format of text format which can be loaded in an excel table. The interface of Turbomatch is shown in the following figure. Figure 30: Turbomatch [18]The GasTurb 11 Entry Level Version is a fully working program which can perform simulations for turbofan, turbojet, turboshaft and turboprop configurations. However, due to this is an entry level version it is limited to the Basic Scope except for the turbojet which allows unrestricted use of all programed options in the tool. The interface of Gasturb 11 Entry Level Version is shown in the following figure. 37

62 Chapter 2 The Environmental Control System Figure 31: GasTurb 11 Entry Level Version Engine Data for the Engine Performance Tool To carry out the SFC increase ratio, the following inputs are taken for each engine. Those values are simulated in the cruise level conditions of each case of study. Table 6: Engine inputs for the engine performance simulation tool Parameters Airbus [CFM56-5b2] ATR [PW127F] Bell 206 [Allison 250 C20J] Mass Flow [kg/s] By Pass Ratio Turbofan engines [BPR] Overall Pressure Ratio [π O ] Fan Pressure Ratio Turbofan engines [π F ] Compressor Pressure Ratio [π C ] HPC [π HPC ] TET [K]

63 CHAPTER 3 THE METHODOLOGY OF ANALISYNG THE ECS CHAPTER 3 THE METHODOLOGY OF ANALYSING THE ENVIRONMENTAL CONTROL SYSTEM 3.1. Research Framework Process The analysis of the energy management on a system is complex. Therefore, a research framework has been designed aiming to provide a schematized and reliable process to achieve the main objective, simulate both ECS models; the conventional and the electric ones. This framework has been divided in 5 main steps, beginning with the aircraft selection and ending up with the system penalties comparison. The following figure shows the proposed framework. Figure 32: Detailed flowchart for the analysis process 39
64 CHAPTER 3 THE METHODOLOGY OF ANALISYNG THE ECS Aircraft Selection Describing the simulation process with the algorithm of the previous figure, the first step involves establishing the requirements, which are parameters that are fixed for a specific aircraft model and cannot be changed like the geometry or the number of passengers. Mission Profile The next stage sets up the mission profile parameters, which are established by the ambient conditions regardless the flight altitude, and temperature selected by the crew. A powerful flight path has been created inside ELENA. Such flight path can follow a mission with three stages; climb, cruise and descent. Therefore some basic inputs need to be loaded, such like departure altitude, rate of climb, cruise altitude, cruise Mach number, cruise range, rate of descent and destination airport. The following figure has been generated to show this scheme. Figure 33: Mission profile for ELENA Conventional ECS analysis The third stage aims basically to establish the energy penalties produced by a conventional ECS. At this point the required pneumatic energy is calculated for this particular aircraft. For the next task it is necessary to use a performance simulation tool like Turbomatch or Gasturb; hence, the engine performance is simulated to assess the increment on the Specific Fuel Consumption due to this pneumatic energy. The inputs taken in account for this simulation are listed in the table 5 and are based on the cruise altitude. Subsequently this increment percentage in SFC is used in ELENA. Hence, the 40
65 CHAPTER 3 THE METHODOLOGY OF ANALISYNG THE ECS fuel penalty is assessed in conjunction with other parameters; such as the system drag and system mass contribution. If the results are acceptable with the real ones, the simulation process can be finished and continued to the next step. Electric ECS analysis The next step aims to set up electric ECS configuration. Hence, following the main purpose of the flow chart, this configuration can be changed towards achieving a system that is capable to meet the air conditioning requirements for the selected aircraft. Those requirements are mainly the temperature control and the pressurization if the aircraft is a fixed-wing type. Hence, aiming to develop a reliable analysis for the electric conditioning pack design, this stage has been divided into three main steps. Firstly, a small parametric study is done to establish the configuration for an electric ECS conditioning pack which is capable to meet the flight mission requirements. Secondly, the cabin temperature and pressurization are simulated to analyse the response of the configured conditioning pack for a mission profile. The mission profile includes the three main flight phases, climbing, cruise and a descent. And finally, the fuel penalty is assessed in conjunction with other parameters; such as the system drag and system mass contribution. If the results are acceptable the simulation process can be finished and continued to the final step. This step is done with the same methodology for the conventional ECS, with the difference that the power off take will be electrical and not pneumatic. Results comparison The main goal in the final step is to compare the results for both, the conventional and electric ECS s. Hence, is possible to analyse on a first view the achievements, advantages and disadvantages for an electric ECS. 41
66 CHAPTER 3 THE METHODOLOGY OF ANALISYNG THE ECS 3.2. The Software for Analysis The ECS Model was developed with Simulink which allows an easy integration with the other systems. An interface was built to provide a structured method to place inputs and display outputs, and to be properly configurable with Simulink as well. To define the level of accuracy some parameters were considered in the next table. A mid accuracy method was selected for the simulation model. Table 7: Level of model accuracy MID HIGH REQUIREMENTS: Airplane basic Internal Geometry Type of condition pack PROS: Can be used easily with any other aircraft model and for energy consumption estimations. CONS: Is not suitable for a detailed analysis of a specific aircraft, especially for real design process. REQUIREMENTS: Airplane detailed Internal Geometry ECS distribution (Pipe lines, geometry, materials) Real ECS Automatic Operation PROS: Is more accurate for a single analysis and real design processes CONS: Require a specific configuration for each specific aircraft model. Requires confidential design data. 42

67 CHAPTER 3 THE METHODOLOGY OF ANALISYNG THE ECS 3.3. ELENA v1 Environmental Control System Analysis Tool Framework scheme A general framework for ELENA was designed, taking the concepts and equations to establish the simulation code. For rotary-wing analysis, an initial model has been used but only considering the combustion heating calculations. This initial model was created on the first stage of the research. The next figures have been generated to show the framework for both aircraft types. Figure 34: Simulation framework for ELENA v1 43


68 CHAPTER 3 THE METHODOLOGY OF ANALISYNG THE ECS Simulink scheme Figure 35: Simulation framework for the rotary-wing aircraft To understand the model ELENA is necessary to recognize its interface on Simulink. As seen on the sollowing figure, its scheme is similar to that one proposed on the previous figures. This capability makes Simulink a powerful tool for calculations and simulation purposes.the main interface contains a region for Inputs, located at the left; and another for Outputs located at the right, the boxes or modules are the processing units and contain all the code which allows the simulation to be carried out. The interconnection lines send information between inputs, boxes and outputs. The gross lines are buses, which can carry a huge group of values; hence, the model becomes easier for handling on. Figure 36: Final version of the Simulink model ELENA 44

69 CHAPTER 3 THE METHODOLOGY OF ANALISYNG THE ECS Figure 37: Final version of the Simulink model ELENA (Left view) 45

70 CHAPTER 3 THE METHODOLOGY OF ANALISYNG THE ECS Figure 38: Final version of the Simulink model ELENA (Right view) The following figure shows the Simulink model of a previous version which was created on the first stages of this research. This model in difference to ELENA only was capable to simulate rotary-wing aircraft. Its main outputs required mass flow if the air 46

71 CHAPTER 3 THE METHODOLOGY OF ANALISYNG THE ECS cycle machine is selected or the fuel flow if the combustion heater is selected; and the electric power consumed by minor components in any of both systems. This model is other different and interesting approach with different inputs and outputs, and will be considered only for combustion heater calculations in the helicopter. Figure 39: Simulink model for the rotary-wing aircraft 47

72 CHAPTER 3 THE METHODOLOGY OF ANALISYNG THE ECS 3.4. AIRCRAFT INPUTS Describing the simulation process with the algorithm of the previous figure, the first step involves establishing the requirements, which are parameters that are fixed for a specific aircraft model and cannot be changed like the geometry or the number of passengers. As seen; all the inputs are the standard requirement for this analysis, to be carried out. Figure 40: Aircraft Database Characteristics The following table shows the data with its nomenclature, which has been selected on International Metric System. 48
73 CHAPTER 3 THE METHODOLOGY OF ANALISYNG THE ECS Table 8: Aircraft inputs Input Units Optimal range 1. Aircraft selection signal - 1=(Fixed-Wing) 2=(Rotary-Wing) 2. Number of passengers [PN] - [0 to 800] 3. All up mass [AUM] kg [1000 to ] 4. Fuel weight [W F ] kg [50 to 80000] 5. Cabin Volume [V cab ] m 3 [10 to 1000] 6. Fuselage Area [A fus ] m 2 [2 to 2000] 7. Engine SFC [SFC] 8. Maximum Pressurization Deferential [ P MAX ] g/kns (Turbojet) kg/kwh (Turboprop/shaft) kpa [2 to 40] [0.2 to 0.4] [about 55 kpa] 9. Engine net thrust or net shaft power at cruise [FN] or [PW] N or W [50000 to 2X10 6 ] 10. Number of engines [EN] MISSION PROFILE CALCULATIONS As mentioned previously; the next stage sets up the mission profile parameters which are established by the ambient conditions regardless the flight altitude, and temperature selected by the crew. A powerful flight path has been created inside ELENA. Such flight path can follow a mission with three stages; climb, cruise and descent. Therefore some basic inputs need to be loaded, such like departure altitude, rate of climb, cruise altitude, cruise Mach number, cruise range, rate of descent and destination airport. The following figure shows the inputs and the module for mission profiles calculations, both part of ELENA. 49

74 CHAPTER 3 THE METHODOLOGY OF ANALISYNG THE ECS Figure 41: Mission Profile Module Inside this module, various calculations are performed aiming to achieve the complete flight path with all its three phases, climb, cruise and descent. The following figure shows an approach of this module content. 50

75 CHAPTER 3 THE METHODOLOGY OF ANALISYNG THE ECS Figure 42: Content for the box of mission profile calculations Mission Inputs Once the previous scheme has been programed in for ELENA, a case study can be carried out using the next inputs. 51
76 CHAPTER 3 THE METHODOLOGY OF ANALISYNG THE ECS Mission Inputs: Table 9: Mission Inputs Input Units Optimal Range 1. Departure airport/cabin - Initial temperature (T 0ab ) C [-5 to 30] 2. Solar Isolation Index (SRI) - [0 to 1] 3. Isa deviation ( T ISA ) C [-20 to 25] 4. Aircraft cruise altitude (h 1-2 ) m [0 to 11000] 5. Flight Mach number (Ma) - [0 to 0.9] 6. Cruise range (d 1-2 ) km [0 to 20000] 7. Departure airport altitude (h 0 ) m [0 to 3000] 8. Arrival airport altitude (h 3 ) m [0 to 3000] 9. Rate of Climb (vs 0-1 ) m/s [1 to 8] 10. Rate of Descent (vs 2-3 ) m/s [-1 to -6] A Sun Heat Index has been integrated with values ranging from 0 to 1. A minor value, approximated to 0 means no sun heat radiation or a night condition. A major value near 1 means a sunny day condition with an average of 250 W/m 2. Mission Outputs Desired cabin temperature Following standardization, the cabin temperature is managed as Kelvin nomenclature. Since the values are placed in Celsius degrees for easy model management, the following equation is used. This equation delivers the temperature with Kelvin nomenclature. 52
77 CHAPTER 3 THE METHODOLOGY OF ANALISYNG THE ECS Solar radiation For easy management of the model, an Index (SRI) value has been applied for the solar radiation conditions. This index value is considered on a range between 0 and 1. The average value that the solar radiation can achieve on the atmosphere, 250 W/m 2, is associated to 1. On the other hand the value of 0 represents nocturnal conditions; and a value of 0.5 would represent cloudy days. Cruise Values The following calculations were carried out to find the values of pressure, temperature, density and speed of sound for given altitude and ISA deviation. The following figure shows its programing inside ELENA. Figure 43: Mission cruise calculations in ELENA 53
78 CHAPTER 3 THE METHODOLOGY OF ANALISYNG THE ECS The cruise temperature is given by the following calculations: [ ( * ] Where, The cruise pressure is given by the following calculations: ( * Where, The cruise density is given by the following calculations: Where, The cruise speed of sound is given by the following calculations: 54

79 CHAPTER 3 THE METHODOLOGY OF ANALISYNG THE ECS The cruise range is given by the following calculation, which basically converts km to m: The aircraft speed is given by the following calculations: Figure 44: Aircraft speed calculation in ELENA Mission profile signals To generate flight path for a mission profile with three stages is necessary to create an algorithmic process similar to any one programed for a real ECS control unit. The following figure shows the boxes that calculate and generate this flight path in ELENA; in the left side is seen the box for the algorithmic code that generates the altitude signals and in the right side is the box that calculates temperature and pressure for all the generated altitude signals. Following the main concept for the mission profile; since the equations to calculate atmospheric temperature and pressure are in function of altitude, an algorithm was 55
80 CHAPTER 3 THE METHODOLOGY OF ANALISYNG THE ECS created to generate the altitude for the mission profile. This profile is composed by three stages, climb cruise and descent. Once this altitude signal is provided by the algorithm, it is possible to calculate the temperature and pressure for the complete mission profile. Figure 45: Flight path to be followed by the algorithm The algorithm is described with the following equation and commands. Where, Where, 56
81 CHAPTER 3 THE METHODOLOGY OF ANALISYNG THE ECS The following figure shows the code of the algorithm in ELENA. Figure 46: Algorithm for the flight path, designed in ELENA Once the altitude signal can be generated, the calculations their respective pressure and temperature can be performed. The temperature for the mission profile is given by the following calculations: [ ( * ] The pressure for the mission profile is given by the following calculations: ( * Hence, the following figure shows the calculations of pressure and temperature for the given altitude signal. 57

82 CHAPTER 3 THE METHODOLOGY OF ANALISYNG THE ECS Rate of Climb This value s output is the same value s input. Departure/Arrival airport values To perform the further simulations, it is necessary to perform fixed point calculations for the departure and arrival airports; as were performed with the cruise sections. For the departure airport, the temperature and pressure are calculated. For the arrival airport only the pressure is calculated. Figure 47: Box for departure/arrival airport in ELENA Inside the box the following calculations are established. Figure 48: Departure airport calculations in ELENA 58
83 CHAPTER 3 THE METHODOLOGY OF ANALISYNG THE ECS Hence, for the departure airport temperature the following calculation has been used. [ ( * ] For the departure airport pressure the following calculation has been used. ( * For the arrival airport pressure the following calculation has been used. ( * Figure 49: Arrival airport calculations in ELENA 3.6. ELECTRIC ECS CONDITIONING PACK Design Philosophy and Target The main purpose of the ECS is to supply a survivable and confortable cabin environment for the passengers, under certain properties such as pressure, temperature and moisture. Those characteristics must be maintained with acceptable limits through the entire mission profile, such mission involves various phases, each one with a particular atmospheric condition. 59
84 CHAPTER 3 THE METHODOLOGY OF ANALISYNG THE ECS Technical Description Following innovative concepts to reduce the energy consumption, a no-bleed air ECS is selected. Therefore the main source of energy, the pneumatic power, is eliminated and replaced by electrical power. In this case, the air is taken as ram-air and subsequently is conditioned with the design requirements established by the CS25. EXPECTED TYPICAL CHARACTERISTICS FOR THE ELECTRIC ECS Estimated energy consumption *E+ Temperature range for the ECS pack *T kw per passenger 90 C to -5 C Cabin temperature range *T+ 18 C to 30 C ECS cabin pressure operation limit *P+ Security factor for structure design (f s ) 75 kpa or 2440 m AMSL 1.5 Table 10: Electric ECS typical components EXPECTED TYPICALELECTRIC ECS COMPONETNS 2 Conditioning Packs: 1 inertial water separator 1 compressor + 1 electric motor 1 pressure reduction valve Ozone reduction unit Air Cycle Machine Heat exchanger +1 fan + 1 electric motor 1 centrifugal water separator 1 manifold mixing unit + 1 control valve Pipelines 1 pressure control outflow valve 2 emergency positive-pressure relief valves 2 emergency negative-pressure relief valves 60


85 CHAPTER 3 THE METHODOLOGY OF ANALISYNG THE ECS Figure 50: Electric ECS typical components Following the expected electric ECS architecture, the following scheme has been designed on ELENA. Some components like ozone separator, water separator and filters are not taken into account, since are considered that do not affect the main analysis results. Figure 51: Conditioning Pack Module 61


86 CHAPTER 3 THE METHODOLOGY OF ANALISYNG THE ECS As seen on the following figure, the conditioning pack follows the architecture of the expected electric ECS design. Figure 52: Conditioning pack module in ELENA Figure 53: Conditioning pack module in ELENA (Left side) 62

87 CHAPTER 3 THE METHODOLOGY OF ANALISYNG THE ECS Figure 54: Conditioning pack module in ELENA (Right side) ECS Conditioning Pack Inputs Once the previous scheme has been programed in ELENA, a case study can be carried out using the next inputs. 63
88 CHAPTER 3 THE METHODOLOGY OF ANALISYNG THE ECS Table 11: Conditioning Pack Configuration Inputs Input Units Optimal Range Note 1. ECS Selection - [1 or 2] 1= Conventional 2= Electrical 2. Compressor Pressure Ratio ( 3. Fan Pressure Ratio ( 4. Cooling mass flow ratio (CFR) 5. Power/Weight ratio for an electric motor [PW] 6. SFC rate increase due to Pneumatic Power [ ] 7. SFC Increase due to Electric Power [ ] - [0.8 to 0.95] - [0.8 to 0.95] - [0 to 1] kw/kg [2 to 10] Ratio [0 to 1] Ratio [0 to 1] This value represents how much mass flow is used for cooling 0=0% 1=100% 0=0% 1=100% Conditioning Pack Outputs For aircraft with passengers, the minimum air flow requirement is established by the rules CS25 and CS29. On the other hand; for design purposes of modern aircraft a bigger [10]value is taken to improve passenger comfort and to have an acceptable range of flow in real operation. Hence, the following calculations are taken into account. The mass flow for the ECS is given by the following calculations: 64
89 CHAPTER 3 THE METHODOLOGY OF ANALISYNG THE ECS Where, Figure 55: ECS flow requirement in ELENA Compressor [10]Thermo-gas dynamic calculations have been taken into account for compressor and fan calculations. Figure 56: Air Cycle Machine - Compressor calculations in ELENA The mass flow for the compressor is given by the following calculations: 65
90 CHAPTER 3 THE METHODOLOGY OF ANALISYNG THE ECS The temperature for the compressor is given by the following calculations: [ ( ) ] Where, The pressure for the compressor is given by the following calculations: The electric power for the compressor is given by the following calculations: Where, Fan Figure 57: Air Cycle Machine - Fan calculations in ELENA 66
91 CHAPTER 3 THE METHODOLOGY OF ANALISYNG THE ECS The mass flow for the fan is given by the following calculations: The temperature for the fan is given by the following calculations: [ ( ) ] Where, The pressure for the fan is given by the following calculations: The shaft power for the fan is given by the following calculations: ( ) Where, 67
92 CHAPTER 3 THE METHODOLOGY OF ANALISYNG THE ECS Heat Exchanger Figure 58: Air Cycle Machine - Heat exchanger calculations for ELENA The mass flow for the heat exchanger is given by the following calculations: The temperature for the heat exchanger is given by the following calculations: The pressure drop for the heat exchanger is given by the following calculations: Where, 68
93 CHAPTER 3 THE METHODOLOGY OF ANALISYNG THE ECS Turbine Figure 59: Air Cycle Machine - Turbine calculations for ELENA The mass flow for the turbine is given by the following calculations: The temperature for the turbine is given by the following calculations: The pressure for the turbine is given by the following calculations: ( ) 69
94 CHAPTER 3 THE METHODOLOGY OF ANALISYNG THE ECS Where, Manifold Figure 60: Air Cycle Machine - Manifold calculations for ELENA The mass flow for the manifold is given by the following calculations: The temperature for the manifold is given by the following calculations: The pressure for the manifold is given by the following calculations: 70
95 CHAPTER 3 THE METHODOLOGY OF ANALISYNG THE ECS Where, ECS Selection Signal The ECS selection signal gives a command for perform calculations on conventional or electric models. SFC rate increase due to Pneumatic and Electric Powers At this point, depending if it is a conventional or electric ECS s analysis; the required pneumatic and electric energies are calculated for this particular aircraft. For the next task it is necessary to use a performance simulation tool. Turbomatch and Gasturb were used for this research; where basically the engine is simulated to assess the increment on the Specific Fuel Consumption due to the power-off take extraction. Subsequently this increment percentage in SFC is used in ELENA. Hence, the fuel penalty is assessed in conjunction with other parameters; such as the system drag and system mass contribution. The inputs used for this research are described in the Chapter From the basic proportions method, the SFC increase rate is calculated using the following procedure. -1 The same procedure is applied for the electric ECS -1 71


96 CHAPTER 3 THE METHODOLOGY OF ANALISYNG THE ECS 3.7. CABIN SIMULATION CALCULATIONS Those calculations aim to simulate the cabin temperature and pressurization. Hence, the response of the configured conditioning pack for a mission profile can be analysed. The mission profile includes the three main flight phases, climbing, cruise and a descent. Figure 61: Cabin simulator module in ELENA Thermal Balance Figure 62: Content of the module for simulation 72

97 CHAPTER 3 THE METHODOLOGY OF ANALISYNG THE ECS The calculations of the thermal balance analyse the temperature behaviour through the time under 4 main conditions or heat contributors; such conditions are the solar radiation, heat produced by passengers, atmosphere temperature and air ventilation for cabin temperature regulation. For the cabin volume, only the air occupying this space is considered. Other components which occupy volume and affect the internal energy distribution, such as chairs or utility equipment were not considered since they didn t represent a relevant change for the final results. Figure 63: Calculations for the thermal balance inside ELENA 73
98 CHAPTER 3 THE METHODOLOGY OF ANALISYNG THE ECS Figure 64: Heat loads Figure 65: Internal volume energy Hence, the cabin temperature for the thermal balance is given by the following calculations, which have been derived from the first law of thermodynamics. For this thermal balance calculation, only the cabin air mass is considered, since the furnishing become more complex the analysis and is not relevant enough for the final result. 74
99 CHAPTER 3 THE METHODOLOGY OF ANALISYNG THE ECS Where, ( * ( ) ( ) ( * The regulation of the cabin temperature is achieved in the manifold with the mixture of the cold ( and hot flow. This mixture is regulated through a thermostat system which mainly calculates the difference between the current temperature and the desired temperature. Hence; if this temperature difference shows that the cabin temperature is higher than the desired one, then a signal closes the valve of the hot flow in the manifold section. Otherwise if the temperature is below the desired the signal opens this valve. The maximum tolerance range for this temperature difference was programed as 2 C. This automatic control was done with a preconfigured command in Simulink which sends a signal of 0 or 1, in terms of a condition. 75
100 CHAPTER 3 THE METHODOLOGY OF ANALISYNG THE ECS Figure 66: Strategy to regulate the cabin temperature As the previous image shows; in that case the desired temperature for the cabin is K. The cabin temperature with the thermal balance is K which is above my requirement or hotter. Therefore, the Automatic Control Valve Signal sends a signal to close the valve of the Hot Flow in the manifold section. Pressure Module As mentioned previously; the main purpose of the pressurization is to provide acceptable levels of oxygen for the passengers and crew. Hence, the following requirement must be accomplished for the ECS. Acceptable pressure levels for at least 75 kpa or the equivalent for an altitude of 2400 m above the main sea level. This value represents a pressure differential of around 50 kpa. Major values for a better cabin air quality, higher than 75 kpa, can be achieved on the cabin pressurization. In real operation, this requirement is achieved through the control unit, which mainly operates a Pressure Release Valve. Hence; for this research, an algorithm which is restrained with this requirement, has been designed. The following figure shows the box which performs the pressurization calculation. The Cabin Pressurization box simulates the cabin pressurization through an algorithm, which is similar to those ones that can be found on real control units for ECS operation. The Rate of Pressurization box performs calculations for the flow that is coming from the conditioning pack; this calculation is fundamental since it affects the overall pressurization depending on the air pack characteristics. The Pressure Release Valve 76

101 CHAPTER 3 THE METHODOLOGY OF ANALISYNG THE ECS Area box performs calculations to establish the operation of the PRV through the entire mission. Figure 67: Calculations for pressurization in ELENA The following figure shows the box containing the code for the pressurization. Figure 68: Pressurization box in ELENA Hence, the pressure for the cabin is given by the following calculations: 77
102 CHAPTER 3 THE METHODOLOGY OF ANALISYNG THE ECS Where, The pressure differential between the cabin and the atmosphere is given by the following calculations: The rate of pressure entering to the aircraft cabin is given by the following calculations: Figure 69: Rate of pressure entering in the aircraft cabin 78
103 CHAPTER 3 THE METHODOLOGY OF ANALISYNG THE ECS Where, The following calculations were performed to establish the operation of the Pressure Release Valve. Basically those calculations give the required area of aperture for this valve to achieve the requirements of pressurization. Figure 70: Calculations for the Pressure Release Valve Area in ELENA Hence, the Pressure Release Valve area for the pressurization is given by the following calculations: ( ) ( ) 79

104 CHAPTER 3 THE METHODOLOGY OF ANALISYNG THE ECS Where, 3.8. FUEL PENALTY CALCULATIONS The fuel penalties are assessed in terms of fuel flow due power-off take, system drag and system weight. Those calculations were taken from the method presented in the section 2.13 Figure 71: Fuel Penalty Module for ELENA The following figure shows the content of the module for Fuel Penalty. 80

105 CHAPTER 3 THE METHODOLOGY OF ANALISYNG THE ECS Figure 72: Energy penalties calculations in ELENA 81
106 CHAPTER 3 THE METHODOLOGY OF ANALISYNG THE ECS ECS Fuel Flow Penalties Figure 73: Fuel penalties calculations due to power-off take The ECS fuel penalty for the energy impact is given by the following calculations taken from the method presented in the section Firstly the fuel flow due power-off take is calculated. 82
107 CHAPTER 3 THE METHODOLOGY OF ANALISYNG THE ECS Where, The fuel increment rate is taken form the analysis in the Engine Performance Simulation Tools. Now the weight due power-off take is calculated. Hence ( * Where, ECS Drag Penalties Continuing with the procedure, the ECS drag penalties are calculated through the following interface in ELENA. 83
108 CHAPTER 3 THE METHODOLOGY OF ANALISYNG THE ECS Figure 74: Aircraft performance calculations Where the ECS drag penalty is derived with the following equation: Where, The cooling flow ratio defines the amount of mass flow to be used for cooling the main mass flow. Hence, if the required ECS mass flow is 1.8 kg/s and the CRF is 0.5 then the flow required for cooling will be 0.9 kg/s. Now the weight due the drag generated by the system is derived with the following equation. ( * 84
109 CHAPTER 3 THE METHODOLOGY OF ANALISYNG THE ECS ECS Weight Penalties Since the electric ECS has further components, a study has been perform to analyse how those extra components would affect the electric ECS weight in comparison with the conventional ECS. Hence, the following table was developed. Table 12: Difference in components for the electric and conventional ECS's Component Conventional ECS Electric ECS Note Compressor for the ram air Is estimated, based in the mass of a titanium disc with the area required to ram the required cabin air flow. Electric motor Is estimated though the power to weight ratio of an electric motor capable to supply 120 kw Wiring to run the electric motor Offset by the pipelines of the conventional ECS Engine electric generator Is estimated using the same method for the electric motor Piping from the engine Offset by the extra wiring of the electric ECS Hence, from the previous study the mass penalty produced by the electric ECS is calculated using the procedure for conventional ECS plus the addition of the following weights; motor, engine electric generator impact and compressor. The weight of the extra wiring that comes from the engine to supply electric power to the ECS is offset by elimination of pipelines that, in the same way, would come from the engine to provide pneumatic power to the ECS conditioning packs. Hence, the calculations inside ELENA have been programed in the following way. 85
110 CHAPTER 3 THE METHODOLOGY OF ANALISYNG THE ECS Figure 75: System weight penalty in ELENA 86
111 CHAPTER 3 THE METHODOLOGY OF ANALISYNG THE ECS The conventional ECS weight for the mass penalty is given by the following calculations: Where, The electric ECS mass for the mass penalty is given by the following calculations. To calculate the mass contribution of the electric motors, a [19]power-to-weight ratio term has been used. Following the requirements of the electric ECS electric motors and in reference to the electric motor Hi-Pa Drive HPD40, which can generate up to 120 kw, this value for power-to-weight is considered as 4.8 kw/kg. This value is multiplied by 2 since represents the mass of both, the electric motor and the extra mass for the engine electric generator. Where, ( ) ( * ECS Total Fuel Weight for the Mission In conclusion; for the total weight penalty due the impact on the system power-off take, system grad and its own weight, the following equation is used. 87

112 CHAPTER 3 THE METHODOLOGY OF ANALISYNG THE ECS Where, 3.9. FUEL PENALTY FOR A COMBUSTION HEATER Only for rotary-wing purposes, a combustion heater has been analysed using the following calculations. Figure 76: Combustion heater module on a first-stage model version The following figure was generated to integrate different equations and simulate a combustion heater. 88
 ] The power consumed by the fan in the hot zone is given with the following calculations.")
113 CHAPTER 3 THE METHODOLOGY OF ANALISYNG THE ECS Figure 77: Combustion heater scheme Hence, the temperature after fan zone 3 is given with the following calculations. [ ( ) ] The power consumed by the fan in the hot zone is given with the following calculations. The Input temperature in the cold zone after the fan is given with the following calculations. [ ( ) ] 89
114 CHAPTER 3 THE METHODOLOGY OF ANALISYNG THE ECS The power consumed by the fan in the cold zone is given with the following calculations. The Fuel Air Ratio required for the combustion process is given with the following calculations. The Fuel flow for the combustion process is given with the following calculations. The output temperature in the hot zone after the combustion is given with the following calculations. 1 The output temperature after the heat transfer process is given with the following calculations. This temperature is going into the cabin and is given with the following calculations. Where, 90
115 CHAPTER 3 THE METHODOLOGY OF ANALISYNG THE ECS MODEL SPECIFICATIONS The final model was developed under the next interface. Table 13: ECS model interface File Name Format Input Format Output Format Platform Execution Time Test Platform Model Developer/Keeper ELENA_v1.mdl Simulink File Simulink Interface Simulink Interface Microsoft Windows 1-5 seconds Processor: Intel Core Duo 2.10GHz Memory : 4GB OS: MS Windows 7 Professional Rolando Vega Díaz VALIDATION PROCESS Mission Profile A comparison with the results of the mission profile was done. Its results were compared with values of the International Standard Atmosphere. The next figure shows the values of temperature and pressure for the mission profile module in ELENA. The altitude is analysed for a range between 0 and meters above the mean sea 91
116 CHAPTER 3 THE METHODOLOGY OF ANALISYNG THE ECS level. According with the results; as the altitude increases, ELENA derives a temperature ranging from 15 C to C and a pressure ranging from Pa to Pa. Hence, the mission profile calculations are accepted. Figure 78: Mission profile validation ECS power consumption For the validation of the ECS pneumatic power consumption, the Airbus A has been taken as its ECS pneumatic power consumption value could be found in the literature review [2]. The A consumes around 1.2 up to 2 kg/s for both engines. The results from ELENA derive a pneumatic consumption of 1.83kg/s. Hence this calculation is acceptable. Electric ECS power Consumption For validation of the electric ECS concept, figures from [20]Lebherr have been taken. As seen in the following figure, their model establishes an electric power consumption average value of 1.14 kw per passenger (considering cooling). 92
117 CHAPTER 3 THE METHODOLOGY OF ANALISYNG THE ECS Figure 79: Electric power consumption depending on the aircraft size (image from Lebherr) The following table has been generated with ELENA. As seen the average power consumption of the Electric ECS is 1.23 kw. Hence; comparing ELENA results with Liebherr estimations, the ELENA calculations for electric ECS power consumption are accepted. Table 14: Electric ECS power consumption per passenger Aircraft Passengers Electric power consumption Consumption per passenger A kw 1.3 kw ATR kw 1 kw Bell kw 0.42 kw Average power consumption 1.23 kw 93
118 CHAPTER 3 THE METHODOLOGY OF ANALISYNG THE ECS Temperature For validation of temperature calculations, the time it takes for the conditioning pack to reach the desired cabin temperature was analysed. Hence; if the desired cabin temperature is achieved in the first 1-2 minutes, normal time for normal ECS operation, then it is possible to conclude that the calculations of thermal balance were developed with the correct procedure. Figure 80: Cabin temperature for the A Figure 81: Cabin temperature for the ATR Figure 82: Cabin temperature for the Bell 206 Calculations in ELENA have shown that the average time to reach the desired temperature, for each aircraft, has ranging from 40 to 50 seconds. Furthermore, for thermostat validation; the previous figures show that once the desired temperature is achieved it is maintained by its automatic control over the manifold valves. Hence, the model has reached the temperature requirements for standard operation. 94
119 CHAPTER 3 THE METHODOLOGY OF ANALISYNG THE ECS Pressure For pressure validation the final pressures figures have been compared with standard pressurization figures. The Airbus A was used as case of study. As seen in the following figure, as the aircraft altitude increases the atmospheric pressure decreases up to 22.6 kpa. At this point the cabin must have higher pressure than the atmosphere; otherwise the passengers couldn t have a survivable cabin environment. According with structure limits, the cabin supports a maximum pressure differential of around 55 kpa. As seen on ELENA figures, as the aircraft increases its altitude up to cruise level; the cabin pressure is decrease as well but in a lower rate until it achieves 80 kpa. Hence, the model has reached an acceptable level for pressurization. Figure 83: Pressurization validation Fuel penalties To perform validation of fuel penalties, the results related with ECS of a case of study from Dr Lawson [21]Lectures AVD 0504 are used. This case of study has been developed as an example to explain the procedure of this method which is described in the [11]Lectures AVD The aircraft involved in this analysis is one designed at Cranfield University to meet future needs of a military transport aircraft in Europe. This aircraft uses four turbofan engines. Further detail, considered for this validation for ELENA, is described in the following table. 95
120 CHAPTER 3 THE METHODOLOGY OF ANALISYNG THE ECS Input Data 1. All up mass kg 2. Design Fuel weight kg 3. Engine SFC at cruise g/kns 4. Number of engines 4 5. Isa Deviation 0 C 6. Aircraft cruise altitude m 7. Flight Mach Number Mission Range 5000 km 9. Total ECS required Mass flow 2.4 kg/s 10. ECS required Mass flow per engine kg/s 11. Cooling mass flow ratio SFC g/kns 13. SFC Increase due to ECS % 14. SFC Increase due to electric ECS components % The following table shows the equivalence of the data obtained with ELENA and the data of the lecture notes. As seen, all the values have an acceptable level of equivalence. The ECS fuel weight due to system weight is the value with less equivalence. This result is due to the different method applied by ELENA to calculate the system weight. Input AVD 0504 ELENA Equivalence 1. ECS Fuel Flow g/s 41.9 g/s 100 % 2. ECS Fuel Weight due to Fuel Flow N N % 96
121 CHAPTER 3 THE METHODOLOGY OF ANALISYNG THE ECS 3. ECS Drag 628 N N % 4. ECS Fuel Weight due to Drag N N % 5. ECS Weight N N % 6. ECS Fuel weight due to ECS weight N N % To validate the penalties due to electric power the section related to the overall electric penalty has been taken. Since this part is taken only for the impact of the ECS electric power consumption; then only calculations for fuel flow and fuel weight due to fuel flow are taken into account. Input AVD 0504 ELENA Equivalence 1. Electric Component Fuel Flow 2. Electric Component Weight due to Fuel Flow g/s g/s 100 % N N % As seen in the previous table, the electric consumption is in acceptable levels. 97
122
123 CHAPTER 4 FIXED-WING AIRCRAFT ANALISYS 1 CHAPTER 4 FIXED-WING AIRCRAFT ANALISYS 1 - A CIVIL TURBO-FAN AIRPLANE 4.1. Aircraft Selection Following the methodology to analyse the electric ECS, the first step is carried out. An Airbus has been selected due to its current high demand on the airline transport market. Hence, the ECS of the A is simulated firstly on a conventional state to analyse its impact on the fuel penalty and other negative performance contributions in terms of system mass, drag contribution and quantity of fuel burned on an established mission profile. The next step on the Aircraft selection is to write the required data that the model will use to perform the calculations Aircraft Inputs: Table 15: Aircraft inputs: Airbus A Input Data 1. Aircraft selection code 1 2. Number of passengers All up mass kg 4. Design fuel mass kg 5. Cabin pressurized volume 418 m 3 6. Fuselage area (Estimated) 440 m 2 7. Engine SFC at cruise g/kns 8. Maximum Pressurization Deferential 55 kpa 9. Engine net thrust at cruise level N 10. Number of Engines 2 99


124 CHAPTER 4 FIXED-WING AIRCRAFT ANALISYS Mission Profile For this analysis, the route between London Heathrow and Paris Charles De Gaulle has been selected. According to 2008 data from the Eurostat, with 1,491,801 passengers, this air route is the third most busy for London Heathrow among European flights; and is in the 17 th place among all the European airports for European air routes. London Heathrow airport Paris Charles De Gaulle airport Figure 84: Mission profile: Route London Heathrow-Paris Charles De Gaulle The following figure describes the input data for the mission profile. Figure 85: Input data for the mission profile between the airports, London Heathrow and Paris Charles De Gaulle 100
125 CHAPTER 4 FIXED-WING AIRCRAFT ANALISYS 1 The following table gives a reference for the selected data Table 16: Mission Inputs Mission Input Data Note 1. Cabin - Wanted temperature 22 C 2. Sun isolation index 1 3. Isa Deviation +2 C 4. Aircraft cruise altitude m 5. Flight Mach Number Mission Range 350 km The range of temperatures for operation are between 18 C and 28 C This value represents a sunny day without clouds. This is the maximum index value and means 250 W/m 2 For a temperature of 17 C at the sea level Cruise altitude for the A321 following the route London- Paris where the rule RVSM establishes odd flight levels. This value is equivalent to FL350. Cruise Mach number for the A Between London Heathrow and Paris Charles de Gaulle 7. Departure airport altitude 260 m London Heathrow 8. Destination airport altitude 270 m Paris Charles de Gaulle 9. Rate of Climb 8 m/s Average rate of climb 10. Rate of Descent 6.1 m/s Average rate of descent 101
126 CHAPTER 4 FIXED-WING AIRCRAFT ANALISYS Conventional ECS Analysis Pneumatic energy required Now the pneumatic energy is calculated. This parameter will be used, as an input, over an engine performance simulation tool. The main purpose of getting this data is to compare the SFC engine with and without the extraction of this form of energy. The following table shows the results. Table 17: Pneumatic power required Parameter Result 1. Total ECS required Mass flow 1.83 kg/s 2. ECS required Mass flow per engine kg/s Engine SFC impact Once the simulation has been carried out, the SFC results are compared. The following table shows the achieved results. Table 18: Engine SFC Impact Parameter Result 1. SFC without ECS g/kns 2. SFC with conventional ECS g/kns 3. SFC Increase 3.83% 102
127 CHAPTER 4 FIXED-WING AIRCRAFT ANALISYS 1 Table 19: ECS configuration inputs Parameter Result 1. ECS selection code 1 2. Cooling mass flow ratio 1 3. SFC increase rate Conventional model impact The next step involves the use of the SFC increasing rates on ELENA v1. The next table shows the results for the conventional model. Mission cruise time: min Table 20: Conventional ECS fuel penalties Input 1. ECS fuel flow due to Power-off Take 2. ECS Drag due to ram air Impact value g/s N 3. ECS Weight 8255 N 4. Fuel Weight due to ECS Power-off Take 5. Fuel Weight due to ECS Drag 6. Fuel Weight due to ECS Weight 7. Total ECS Fuel Weight 8. Total ECS Weight (ECS weight + ECS fuel weight) N N N N N 103
128 CHAPTER 4 FIXED-WING AIRCRAFT ANALISYS Electric ECS Analysis Conditioning pack configuration The next step takes us to select the input data for the Electric-ECS. This selection is made to achieve the cabin requirements for temperature and pressure. Table 21: ECS configuration inputs Input Units 1. ECS selection code 2 2. Compressor Pressure Ratio 5 3. Fan Pressure Ratio Cooling mass flow ratio 5. Power/Weight ratio for an electric motor kw/kg As seen on the following figure, the input data for the compressor and fan pressure ratios and cooling mass flow was modified towards achieve desired output values of temperature and pressure. The first chart on the figure shows that the configured conditioned pack, for the Electric ECS, can deliver temperature ranges between 7 C and 90 C. This means that our system operates on an acceptable range of temperatures for the mixing unit manifold ; hence, will be capable of maintain a range of temperatures between 18 C and 30 C for the cabin, depending on crew interest. On the other hand, the chart for delivered pressure shows that the conditioning pack can deliver a range between 90 kpa and 370 kpa. Those values are acceptable since the conditioning pack must deliver a bigger pressure than the outside one; otherwise the conditioning pack won t be capable to pressurise the cabin. 104
129 CHAPTER 4 FIXED-WING AIRCRAFT ANALISYS 1 Figure 86: Time [s] vs. Altitude, Temperature and Pressure outputs delivered by the conditioning pack As seen on the last figure. The configuration for the Electric ECS achieves the requirements of pressure and temperature at the same time. Now, the next step can be followed to analyse the cabin simulation through the proposed mission profile. Following the framework procedure, the cabin temperature is analysed. As seen on the following figure the cabin temperature achieves its desired range. Such range is generated by controlled mixture of flows produced on the manifold. Such mixture is with the operation of valves. A range between 22 C and 24 C is appreciated; this range can be smoothed with action of a more automatized thermostat and a control unit. 105
130 CHAPTER 4 FIXED-WING AIRCRAFT ANALISYS 1 Figure 87: Time [s] vs. Altitude and Cabin Temperature Other important factor of a conditioning pack is the capability to perform a thermal balance on a reasonable time. As seen on the following figure, the initial cabin temperature was equivalent to 15 C. The system took about 40 seconds to warm up the cabin towards the desired temperature of 22 C. A discrepancy of 2 C is generated according with the thermostat capabilities. Figure 88: Time [s] vs. Cabin Temperature The following step show the pressurization simulation been carried out. As seen on the second chart of the next figure, the conditioning pack has been capable to pressurize and depressurize the cabin during the climb and descent stages. The pressure differential has been preserved on the required range of 55 kpa as seen on the third chart. Finally in the last chart is seen how the outflow release valve has been operating to maintain the correct pressurization for the cabin. 106
131 CHAPTER 4 FIXED-WING AIRCRAFT ANALISYS 1 Cabin Atmosphere Figure 89: Time [s] vs. Altitude, Cabin and Atmospheric Pressures, Pressure Differential and Pressure Release Valve Area The previous analysis has shown that the selected configuration for the conditioning pack achieves the air conditioning requirements. 107
132 CHAPTER 4 FIXED-WING AIRCRAFT ANALISYS 1 Electric ECS electric energy required Now the electric energy is calculated. This parameter will be used, as an input, over an engine performance simulation tool. The main purpose of getting this data is to compare the SFC engine with and without the extraction of this form of energy. The following table shows the results. Table 22: Electric energy requirement Parameter 1. Electric ECS required electric power 3. Electric ECS required electric power per engine Result W W Engine SFC impact Once the simulation has been carried out, the SFC results are compared. The following table shows the achieved results. Table 23: Engine SFC Impact Parameter Result 1. SFC w/o without ECS g/kns 2. SFC with conventional ECS g/kns 3. SFC Increase per engine 0.61% Table 24: ECS configuration inputs Parameter Result 1. SFC increase rate
133 CHAPTER 4 FIXED-WING AIRCRAFT ANALISYS 1 Electric ECS model impact The next step involves the use of the SFC increasing rates on ELENA v1. The next table shows the results for the conventional model. Mission cruise time: min Table 25: Electric ECS fuel penalties Input 1. ECS fuel flow due to Power-off Take 2. ECS Drag due to ram air Impact value g/s N 3. ECS Weight 9460 N 4. Fuel Weight due to ECS Power-off Take 5. Fuel Weight due to ECS Drag 6. Fuel Weight due to ECS Weight 7. Total ECS Fuel Weight 8. Total ECS Weight (ECS weight + ECS fuel weight) N N N N N 109
134 CHAPTER 4 FIXED-WING AIRCRAFT ANALISYS Results comparison Table 26: Results comparison for the conventional and electric ECS's Input Conventional ECS Electric ECS Difference Electric to Conventional 1. ECS fuel flow due to Power-off Take 2. ECS Drag due to ram air g/s g/s % N N 0.00 % 3. ECS Weight 8255 N 9460 N % 4. Fuel Weight due to ECS Power-off Take 5. Fuel Weight due to ECS Drag 6. Fuel Weight due to ECS Weight 7. Total ECS Fuel Weight 8. Total ECS Weight (ECS weight + ECS fuel weight) N N % N N 0.00 % N N % N N % N N 6.97 % As seen on this final stage of the analysis, the electric ECS has shown a negative contribution for the aircraft performance; this is related with an increase in the total system weight in a 6.97 % over the conventional ECS. In spite of this negative result a positive and more significant result was achieved, the total mission fuel weight has been reduced in %. This result has shown a significant reduction on the fuel required to operate the Electric ECS; consecutively in the costs and the environment al impact. 110
135 CHAPTER 4 FIXED-WING AIRCRAFT ANALISYS 1 Uncertainty Analysis Since the weight estimation used in this analysis has include a new concept due to the extra electric ECS components; then, a further analysis has been done to find the spread and the uncertainty value over the total system weight estimation. Therefore, two additional cases have been carried out; one case considers the ECS weight as 110% over its original value, and the other case considers it as 90%. The following tables show those results. Table 27: Results comparison for the conventional and electric ECS's (with the 90 % of the original ECS weight) Input Conventional ECS Electric ECS Difference Electric to Conventional 1. ECS fuel flow due to Power-off Take 2. ECS Drag due to ram air g/s g/s % N N 0.00 % 3. ECS Weight 7430 N 8514 N % 4. Fuel Weight due to ECS Power-off Take 5. Fuel Weight due to ECS Drag 6. Fuel Weight due to ECS Weight 7. Total ECS Fuel Weight 8. Total ECS Weight (ECS weight + ECS fuel weight) N N % N N 0.00 % N N % N N % N N 6.21 % 111
136 CHAPTER 4 FIXED-WING AIRCRAFT ANALISYS 1 Table 28: Results comparison for the conventional and electric ECS's (with the 110 % of the original ECS weight) Input Conventional ECS Electric ECS Difference Electric to Conventional 1. ECS fuel flow due to Power-off Take 2. ECS Drag due to ram air g/s g/s % N N 0.00 % 3. ECS Weight 9081 N N % 4. Fuel Weight due to ECS Power-off Take 5. Fuel Weight due to ECS Drag 6. Fuel Weight due to ECS Weight 7. Total ECS Fuel Weight 8. Total ECS Weight (ECS weight + ECS fuel weight) N N % N N 0.00 % N N % N N % N N 7.60 % The following table shows that for the conventional ECS the spread is of 1686 N, which represents an uncertainty value of 18 %. In the case of the electric ECS the spread is of 1932 N, which represents an uncertainty value of 19.3 %. Total ECS Weight (ECS weight + ECS fuel weight) 100% 90% 110% Value Value [N] [N] Difference [%] Value [N] Difference [%] Spread [N] Uncertainty [%] Conventional ECS Electric ECS
137 CHAPTER 4 FIXED-WING AIRCRAFT ANALISYS Fuel Cost Taking the results from ELENA and applying the methodology of Prof Dieter Scholz, mentioned in the chapter 2. The following chart has been generated. The number of flights are ranging from 2200 to 3800, which are values considered from 7 to 12 daily flights for the selected mission in the study. The number of days taken from the 365 days in the year is estimated as 320; such estimation was done considered the days which the aircraft is in-operative due maintenance and flight cancellations. Further analysis can be done in future research to estimate more accurately this value. Figure 90: Estimated fuel cost for the electric and conventional ECS's in the Airbus A
138
139 CHAPTER 5 FIXED-WING AIRCRAFT ANALISYS 2 CHAPTER 5 FIXED-WING AIRCRAFT ANALISYS 2 - A 5.1. Aircraft Selection REGIONAL TURBO-PROP AIRPLANE Following the methodology to analyse the electric ECS, the first step is carried out. Differently form the last case of study; an ATR is selected towards compare the ECS energy impact for a regional turbo-prop airplane. Hence, the ECS of the ATR is simulated firstly on a conventional state to analyse its impact on the fuel penalty and other negative performance contributions in terms of system mass, drag contribution and quantity of fuel burned on an established mission profile. The next step on the Aircraft selection is to write the required data that the model will use to perform the calculations. Aircraft Inputs [16]: Table 29: Aircraft inputs: ATR Input Data 1. Aircraft selection code 1 2. Number of passengers All up mass kg 4. Design Fuel weight 5000 kg 5. Cabin pressurized volume (Estimated) 112 m 3 6. Fuselage Area (Estimated) 131 m 2 7. Engine SFC at cruise kg/wh 8. Maximum Pressurization Deferential 9. Engine net power at cruise level 55 kpa W 10. Number of engines 2 115


140 CHAPTER 5 FIXED-WING AIRCRAFT ANALISYS Mission Profile For this analysis, the route between Barcelona El Prat and Madrid Barajas has been selected. According to 2008 data from the Eurostat, with 3,497,696 passengers, this air route is the first most busy among European passenger air routes. Barcelona El Prat airport Madrid Barajas airport Figure 91: Mission profile: Route Barcelona El Prat and Madrid Barajas The following figure describes the input data for the mission profile. Figure 92: Input data for the mission profile between Barcelona El Prat and Madrid Barajas 116
141 CHAPTER 5 FIXED-WING AIRCRAFT ANALISYS 2 The following table gives a reference for the selected data Mission Input Data Note 1. Cabin - Wanted temperature 24 C 2. Sun Heating Index Isa Deviation -3 C 4. Aircraft cruise altitude m 5. Flight Mach Number Mission Range 508 km The range of temperatures for operation are between 18 C and 28 C This index represents a sunny day with a little few clouds. For a temperature of 12 C at the sea level Cruise altitude for the ATR 72 following the route London-Paris where the rule RVSM establishes even flight levels. This value is equivalent to FL240. Cruise Mach number for the ATR Between Barcelona El Prat and Madrid Barajas 7. Departure airport altitude 4 m Barcelona El Prat 8. Destination airport altitude 610 m Madrid Barajas 9. Rate of Climb 8 m/s Average rate of climb 10. Rate of Descent -6.1 m/s Average rate of descent 117
142 CHAPTER 5 FIXED-WING AIRCRAFT ANALISYS Conventional ECS Analysis Pneumatic energy required Now the pneumatic energy is calculated. This parameter will be used, as an input, over an engine performance simulation tool. The main purpose of getting this data is to compare the SFC engine with and without the extraction of this form of energy. The following table shows the results. Table 30: Pneumatic power required Parameter Result 1. Total ECS required Mass flow 0.63 kg/s 2. ECS required Mass flow per engine kg/s Engine SFC impact Once the simulation has been carried out, the SFC results are compared. The following table shows the achieved results. Table 31: Engine SFC Impact Parameter Result 1. SFC w/o without ECS kg/kwh 2. SFC with conventional ECS kg/kwh 3. SFC Increase 13.33% 118
143 CHAPTER 5 FIXED-WING AIRCRAFT ANALISYS 2 Table 32: ECS configuration inputs Parameter Result 1. ECS selection code 1 2. Cooling mass flow ratio SFC increase rate Conventional model impact The next step involves the use of the SFC increasing rates on ELENA v1. The next table shows the results for the conventional model. Mission cruise time: min Table 33: Conventional ECS fuel penalties Input 1. ECS fuel flow due to Power-off Take 2. ECS Drag due to ram air Impact value g/s N 3. ECS Weight 1987 N 4. Fuel Weight due to ECS Power-off Take 5. Fuel Weight due to ECS Drag 6. Fuel Weight due to ECS Weight 7. Total ECS Fuel Weight 8. Total ECS Weight (ECS weight + ECS fuel weight) N N N N N 119
144 CHAPTER 5 FIXED-WING AIRCRAFT ANALISYS Electric ECS Analysis Conditioning pack configuration The next step takes us to select the input data for the Electric-ECS. This selection is made to achieve the cabin requirements for temperature and pressure. Table 34: ECS configuration inputs Input Units 1. ECS selection code 2 2. Compressor Pressure Ratio Fan Pressure Ratio Cooling mass flow ratio 5. Power/Weight ratio for an electric motor kw/kg As seen on the next figure, the input data for the compressor and fan pressure ratios and cooling mass flow was modified towards achieve desired output values of temperature and pressure. The first chart on the figure shows that the configured conditioned pack, for the Electric ECS, can deliver temperature ranges between 10 C and 65 C. This means that our system operates on an acceptable range of temperatures for the mixing unit manifold ; hence, will be capable of maintain a range of temperatures between 18 C and 30 C for the cabin, depending on crew interest. On the other hand, the chart for delivered pressure shows that the conditioning pack can deliver a range between 95 kpa and 250 kpa. Those values are acceptable since the conditioning pack must deliver a bigger pressure than the outside one; otherwise the conditioning pack won t be capable to pressurise the cabin. 120
145 CHAPTER 5 FIXED-WING AIRCRAFT ANALISYS 2 Figure 93: Time [s] vs. Altitude, Temperature and Pressure outputs delivered by the conditioning pack As seen on the last figure. The configuration for the Electric ECS achieves the requirements of pressure and temperature at the same time. Now, the next step can be followed to analyse the cabin simulation through the proposed mission profile. Following the framework procedure, the cabin temperature is analysed. As seen on the following figure the cabin temperature achieves its desired range. Such range is generated by controlled mixture of flows produced on the manifold. Such mixture is with the operation of valves. A range 25 C is appreciated; this range can be smoothed with action of a more automatized thermostat and a control unit. 121
146 CHAPTER 5 FIXED-WING AIRCRAFT ANALISYS 2 Figure 94: Time [s] vs. Altitude and Cabin Temperature Other important factor of a conditioning pack is the capability to perform a thermal balance on a reasonable time. As seen on the following figure, the initial cabin temperature was equivalent to 15 C. The system took about 50 seconds to warm up the cabin towards the desired temperature of 24 C. A discrepancy of 2 C is generated according with the thermostat capabilities. Figure 95: Time [s] vs. Cabin Temperature The following step show the pressurization simulation been carried out. As seen on the second chart of the next figure, the conditioning pack has been capable to pressurize 122
147 CHAPTER 5 FIXED-WING AIRCRAFT ANALISYS 2 and depressurize the cabin during the climb and descent stages. The pressure differential has been preserved on the required range of 55 kpa as seen on the third chart. Finally in the last chart is seen how the outflow release valve has been operating to maintain the correct pressurization for the cabin. Cabin Atmosphere Figure 96: Time [s] vs. Altitude, Cabin and Atmospheric Pressures, Pressure Differential and Pressure Release Valve Area 123
148 CHAPTER 5 FIXED-WING AIRCRAFT ANALISYS 2 The previous analysis has shown that the selected configuration for the conditioning pack achieves the air conditioning requirements. Electric ECS electric energy required Table 35: Electric energy required Parameter 1. Electric ECS required electric power 2. Electric ECS required electric power per engine Result W W Engine SFC impact Table 36: Engine SFC Impact Parameter Result 1. SFC w/o without ECS kg/kwh 2. SFC with conventional ECS kg/kwh 3. SFC Increase 3.18% Table 37: ECS configuration inputs Parameter Result 1. SFC increase rate
149 CHAPTER 5 FIXED-WING AIRCRAFT ANALISYS 2 Electric ECS model impact Mission cruise time: min Table 38: Electric ECS fuel penalties Input 1. ECS fuel flow due to Power-off Take 2. ECS Drag due to ram air Impact value g/s N 3. ECS Weight 2280 N 4. Fuel Weight due to ECS Power-off Take 5. Fuel Weight due to ECS Drag 6. Fuel Weight due to ECS Weight 7. Total ECS Fuel Weight 8. Total ECS Weight (ECS weight + ECS fuel weight) N N N N N 125
150 CHAPTER 5 FIXED-WING AIRCRAFT ANALISYS Results comparison Table 39: Results comparison for the conventional and electric ECS's Input Conventional ECS Electric ECS Difference Electric to Conventional 1. ECS fuel flow due to Power-off Take 2. ECS Drag due to ram air g/s g/s % N N 0.00 % 3. ECS Weight 1987 N 2280 N % 4. Fuel Weight due to ECS Power-off Take 5. Fuel Weight due to ECS Drag 6. Fuel Weight due to ECS Weight 7. Total ECS Fuel Weight 8. Total ECS Weight (ECS weight + ECS fuel weight) N N % N N 0.00 % N N % N N % N N % As seen on this final stage of the analysis, the electric ECS has shown a positive contribution for the aircraft performance; this is related with a decrease in the total system weight in a % over the conventional ECS. Additionally, a further positive and more significant result was achieved; the total mission fuel weight has been reduced in %. This result has shown a significant reduction on the fuel required to operate the Electric ECS; consecutively in the costs and the environment al impact. 126
151 CHAPTER 5 FIXED-WING AIRCRAFT ANALISYS 2 Uncertainty Analysis Since the weight estimation used in this analysis has include a new concept due to the extra electric ECS components; then, a further analysis has been done to find the spread and the uncertainty value over the total system weight estimation. Therefore, two additional cases have been carried out; one case considers the ECS weight as 110% over its original value, and the other case considers it as 90%. The following tables show those results. Table 40: Results comparison for the conventional and electric ECS's (with the 90 % of the original ECS weight) Input Conventional ECS Electric ECS Difference Electric to Conventional 1. ECS fuel flow due to Power-off Take 2. ECS Drag due to ram air g/s g/s % N N 0.00 % 3. ECS Weight 1788 N 2052 N % 4. Fuel Weight due to ECS Power-off Take 5. Fuel Weight due to ECS Drag 6. Fuel Weight due to ECS Weight 7. Total ECS Fuel Weight 8. Total ECS Weight (ECS weight + ECS fuel weight) N N % N N 0.00 % N N % N N % N N % 127
152 CHAPTER 5 FIXED-WING AIRCRAFT ANALISYS 2 Table 41: Results comparison for the conventional and electric ECS's (with the 110 % of the original ECS weight) Input Conventional ECS Electric ECS Difference Electric to Conventional 1. ECS fuel flow due to Power-off Take 2. ECS Drag due to ram air g/s g/s % N N 0.00 % 3. ECS Weight 2185 N 2508 N % 4. Fuel Weight due to ECS Power-off Take 5. Fuel Weight due to ECS Drag 6. Fuel Weight due to ECS Weight 7. Total ECS Fuel Weight 8. Total ECS Weight (ECS weight + ECS fuel weight) N N % N N 0.00 % N N % N N % N N % The following table shows that for the conventional ECS the spread is of 436 N, which represents an uncertainty value of 9.1 %. In the case of the electric ECS the spread is of 500 N, which represents an uncertainty value of 16.0 %. Total ECS Weight (ECS weight + ECS fuel weight) 100% 90% 110% Value Value [N] [N] Difference [%] Value [N] Difference [%] Spread [N] Uncertainty [%] Conventional ECS Electric ECS
153 CHAPTER 5 FIXED-WING AIRCRAFT ANALISYS Fuel Cost Taking the results from ELENA and applying the methodology of Prof Dieter Scholz, mentioned in the chapter 2. The following chart has been generated. The number of flights are ranging from 2200 to 3800, which are values considered from 7 to 12 daily flights for the selected mission in the study. The number of days taken from the 365 days in the year is estimated as 320; such estimation was done considered the days which the aircraft is in-operative due maintenance and flight cancellations. Further analysis can be done in future research to estimate more accurately this value. Figure 97: Estimated fuel cost for the electric and conventional ECS's in the ATR
154
155 CHAPTER 6 ROTARY-WING AIRCRAFT ANALISYS CHAPTER 6 ROTARY-WING AIRCRAFT ANALISYS FOR A 5 PASSENGERS HELICOPTER 6.1. Aircraft Selection Following the methodology to analyse the electric ECS, the first step is carried out. A Bell 206 has been selected to assess the application of an electric ECS. Hence, a conventional ECS for the Bell 206 is simulated firstly on a conventional state to analyse its impact on the fuel penalty and other negative performance contributions in terms of system mass, drag contribution and quantity of fuel burned on an established mission profile. The next step on the Aircraft selection is to write the required data that the model will use to perform the calculations Aircraft Inputs: Table 42: Aircraft inputs: Bell 206 Input Units 1. Aircraft selection code 2 2. Number of passengers 5 3. All up mass 1451 kg 4. Design Fuel weight 230 kg 5. Cabin volume (Estimated) 2.2 m 3 6. Fuselage Area (Estimated) 15 m 2 7. Engine SFC at cruise kg/wh 8. Engine power at cruise level W 9. Number of engines 1 131

156 CHAPTER 6 ROTARY-WING AIRCRAFT ANALISYS 6.2. Mission Profile For this analysis a local route has been selected; from Cranfield University Airport to London City Airport. This route covers 70 km and is completed on approximately 20 minutes. Cranfield airport University London City airport Figure 98: Mission profile: Route Cranfield University Airport to London City Airport The following figure describes the input data for the mission profile. Figure 99: Input data for the mission profile between Cranfield University Airport and London City Airport 132
157 CHAPTER 6 ROTARY-WING AIRCRAFT ANALISYS The following table gives a reference for the selected data Mission Input Units Note 1. Cabin - Wanted temperature 20 C 2. Sun Heating Index Isa Deviation -10 C 4. Aircraft cruise altitude 3000 m 5. Flight Mach Number Mission Range 70 km The range of temperatures for operation are between 18 C and 28 C This index represents a sunny day with a little few clouds. For a temperature of 5 C at the sea level Typical high cruise level for a helicopter Cruise Mach number for the Bell 206 Between Cranfield University Airport and London City Airport 7. Departure airport altitude 109 m Cranfield University Airport 8. Destination airport altitude 6 m London City Airport 9. Rate of Climb 8 m/s Average rate of climb 10. Rate of Descent -6.1 m/s Average rate of descent 6.3. Conventional ECS Analysis Now the pneumatic energy is calculated. This parameter will be used, as an input, on an engine performance simulation tool. The main purpose of getting this data is to compare the SFC engine with and without the extraction of this form of energy. 133
158 CHAPTER 6 ROTARY-WING AIRCRAFT ANALISYS Pneumatic energy required Table 43: Pneumatic power required Parameter Result 1. Total ECS required Mass flow kg/s 2. ECS required Mass flow per engine kg/s Engine SFC impact Table 44: Engine SFC Impact Parameter Result 1. SFC w/o without ECS kg/kwh 2. SFC with conventional ECS kg/kwh 3. SFC Increase % Table 45: ECS configuration inputs Parameter Result 1. ECS selection code 1 2. Cooling mass flow ratio SFC increase rate
159 CHAPTER 6 ROTARY-WING AIRCRAFT ANALISYS Conventional model impact Mission cruise time: min Table 46: Conventional ECS fuel penalties Input 1. ECS fuel flow due to Power-off Take 2. ECS Drag due to ram air Impact value g/s 4.1 N 3. ECS Weight N 4. Fuel Weight due to ECS Power-off Take 5. Fuel Weight due to ECS Drag 6. Fuel Weight due to ECS Weight 7. Total ECS Fuel Weight 8. Total ECS Weight (ECS weight + ECS fuel weight) N N 3 N N N 6.4. Electric ECS Analysis Conditioning pack configuration The next step takes us to select the input data for the Electric-ECS. This selection is made to achieve the cabin requirements for temperature and pressure. 135
160 CHAPTER 6 ROTARY-WING AIRCRAFT ANALISYS Table 47: ECS configuration inputs Input Units 1. ECS selection code 2 2. Compressor Pressure Ratio Fan Pressure Ratio Cooling mass flow ratio 5. Power/Weight ratio for an electric motor kw/kg As seen on the next figure, the input data for the compressor and fan pressure ratios and cooling mass flow was modified towards achieve desired output values of temperature and pressure. The first chart on the figure shows that the configured conditioned pack, for the Electric ECS, can deliver temperature ranges between 7 C and 90 C. This means that our system operates on an acceptable range of temperatures for the mixing unit manifold ; hence, will be capable of maintain a range of temperatures between 18 C and 30 C for the cabin, depending on crew interest. Figure 100: Temperature range output delivered by the conditioning pack 136
161 CHAPTER 6 ROTARY-WING AIRCRAFT ANALISYS As seen on the last figure. The configuration for the Electric ECS achieves the requirements of pressure and temperature at the same time. Now, the next step can be followed to analyse the cabin simulation through the proposed mission profile. Following the framework procedure, the cabin temperature is analysed. As seen on the following figure the cabin temperature achieves its desired range. Such range is generated by controlled mixture of flows produced on the manifold. Such mixture is with the operation of valves. A range between 20 C and 22 C is appreciated; this range can be smoothed with action of a more automatized thermostat and a control unit. Figure 101: Temperature output delivered by the conditioning pack Other important factor of a conditioning pack is the capability to perform a thermal balance on a reasonable time. As seen on the following figure, the initial cabin temperature was equivalent to 5 C. The system took about 44 seconds to warm up the cabin towards the desired temperature of 20 C. A discrepancy of 2 C is generated according with the thermostat capabilities. 137
162 CHAPTER 6 ROTARY-WING AIRCRAFT ANALISYS Figure 102: Temperature output delivered by the conditioning pack Electric ECS electric energy required Table 48: Electric ECS energy required Parameter 1. Electric ECS required electric power 2. Electric ECS required electric power per engine Result W W Engine SFC impact Table 49: Engine SFC Impact Parameter Result 1. SFC w/o without ECS kg/kwh 2. SFC with conventional ECS kg/kwh 3. SFC Increase % Table 50: ECS configuration inputs Parameter Result 1. SFC increase rate
163 CHAPTER 6 ROTARY-WING AIRCRAFT ANALISYS Electric ECS model impact Mission cruise time: min Table 51: Electric ECS fuel penalties Input 1. ECS fuel flow due to Power-off Take 2. ECS Drag due to ram air Impact value g/s 4.1 N 3. ECS Weight N 4. Fuel Weight due to ECS Power-off Take 5. Fuel Weight due to ECS Drag 6. Fuel Weight due to ECS Weight 7. Total ECS Fuel Weight 8. Total ECS Weight (ECS weight + ECS fuel weight) 2.35 N N 3.22 N 5.57 N N 6.5. Combustion heater The Environmental Control System of a helicopter is simulated, using the previous version tool, to obtain its energy consumption; consequently the energy is analysed in terms fuel flow under certain components configuration and a fixed operational point. The simulation is carried out under low fidelity conditions for combustion heater conditioning system. 139
164 CHAPTER 6 ROTARY-WING AIRCRAFT ANALISYS Table 52: Combustion Heater requirements Parameter Value Note Number of Passengers CS29 Air Flow per Passenger Heat Load per Passenger Cabin Skin Heat Conductivity 5 Bell kg/s 110W Although the CS29 establish kg/s, some literature establishes kg/s for design purposes. This is an average taking form the heat load produced by passengers and crew members which is 70W and 650W respectively. This average is considered as the best option for a helicopter. 10 m² Assumed for a small helicopter 1.4 W/m²K For a normal material. Cabin Volume 2.26 m³ Bell 206 Estimated Heating mission Scenario with Combustion Heater Only a heating capability can be carried out in this scenario, thus cold ambient conditions are set. Table 53: Combustion Heater requirements Parameter Value Note Temperature of the cabin 5 C Assumed Solar Radiation 0W/m 2 For a night conditions ISA Deviation -20 C For winter conditions Altitude [0m m] 3000 Performing a cruise flight 140
165 CHAPTER 6 ROTARY-WING AIRCRAFT ANALISYS Table 54: Combustion Heater results Parameter Results 1. Combustion heater fuel flow g/s 2. Electric power W 6.6. Results comparison Table 55: Results comparison for the conventional and electric ECS's Input Conventional ECS Electric ECS Difference Electric to Conventional 1. ECS fuel flow due to Power-off Take 2. ECS Drag due to ram air g/s g/s % 4.1 N 4.1 N 0.00 % 3. ECS Weight N N 7.10 % 4. Fuel Weight due to ECS Power-off Take 5. Fuel Weight due to ECS Drag 6. Fuel Weight due to ECS Weight 7. Total ECS Fuel Weight 8. Total ECS Weight (ECS weight + ECS fuel weight) N 2.35 N % N N 0.00 % 3 N 3.22 N 7.33 % N 5.57 N % N N 0.42 % As seen on this final stage of the analysis, the electric ECS has shown a negative contribution for the aircraft performance; this is related with an increase in the total system weight in a 0.42 % over the conventional ECS. In spite of this negative result a 141
166 CHAPTER 6 ROTARY-WING AIRCRAFT ANALISYS positive and more significant result was achieved, the total mission fuel weight has been reduced in %. This result has shown a significant reduction on the fuel required to operate the Electric ECS; consecutively in the costs and the environment al impact. Uncertainty Analysis Since the weight estimation used in this analysis has include a new concept due to the extra electric ECS components; then, a further analysis has been done to find the spread and the uncertainty value over the total system weight estimation. Therefore, two additional cases have been carried out; one case considers the ECS weight as 110% over its original value, and the other case considers it as 90%. The following tables show those results. Table 56: Results comparison for the conventional and electric ECS's (with the 90 % of the original ECS weight) Input Conventional ECS Electric ECS Difference Electric to Conventional 1. ECS fuel flow due to Power-off Take 2. ECS Drag due to ram air g/s g/s % 4.1 N 4.1 N 0.00 % 3. ECS Weight N N 7.11 % 4. Fuel Weight due to ECS Power-off Take 5. Fuel Weight due to ECS Drag 6. Fuel Weight due to ECS Weight 7. Total ECS Fuel Weight 8. Total ECS Weight (ECS weight + ECS fuel weight) N 2.35 N % N N 0.00 % 2.7 N 2.9 N 7.41 % N 5.25 N % N N % 142
167 CHAPTER 6 ROTARY-WING AIRCRAFT ANALISYS Table 57: Results comparison for the conventional and electric ECS's (with the 110 % of the original ECS weight) Input Conventional ECS Electric ECS Difference Electric to Conventional 1. ECS fuel flow due to Power-off Take 2. ECS Drag due to ram air g/s g/s % 4.1 N 4.1 N 0.00 % 3. ECS Weight N 151 N 7.17 % 4. Fuel Weight due to ECS Power-off Take 5. Fuel Weight due to ECS Drag 6. Fuel Weight due to ECS Weight 7. Total ECS Fuel Weight 8. Total ECS Weight (ECS weight + ECS fuel weight) N 2.35 N % N N 0.00 % 3.3 N 3.54 N 7.27 % N 5.9 N % N N 1.05 % The following table shows that for the conventional ECS the spread is of 26 N, which represents an uncertainty value of 18.4 %. In the case of the electric ECS the spread is of 28 N, which represents an uncertainty value of 19.7 %. Total ECS Weight (ECS weight + ECS fuel weight) 100% 90% 110% Value Value [N] [N] Difference [%] Value [N] Difference [%] Spread [N] Uncertainty [%] Conventional ECS Electric ECS
168 CHAPTER 6 ROTARY-WING AIRCRAFT ANALISYS 6.7. Fuel Cost Taking the results from ELENA and applying the methodology of Prof Dieter Scholz, mentioned in the chapter 2. The following chart has been generated. The number of flights are ranging from 2200 to 3800, which are values considered from 7 to 12 daily flights for the selected mission in the study. The number of days taken from the 365 days in the year is estimated as 320; such estimation was done considered the days which the aircraft is in-operative due maintenance and flight cancellations. Further analysis can be done in future research to estimate more accurately this value. Figure 103: Estimated fuel cost for the electric and conventional ECS's in the Bell
169 CHAPTER 7 CONCLUSIONS CHAPTER 7 CONCLUSIONS Generally speaking; the Electric ECS has shown a reduction from 51.2% up to 72.76% for the total fuel penalties. The lower reduction was achieved for the Airbus A The bigger reduction was achieved for the ATR and Bell 206. This considerable reduction for the system has shown that the amount of energy to run a system is considerable bigger when is extracted as pneumatic instead of electric. In the case of the ATR and the Bell 206, the benefit has been better due to turboshaft/prop engines lose more net shaft power when power-off take is pneumatic, in comparison with turbojet engines. This conclusion shows that the energy losses are lower when a thermodynamic process is made by action of the thermoelectric effect, rather than when is made by action of the convection principle. As seen in the tables, 18, 31 and 44; the average increment on the SFC, due to conventional ECS power extraction was 7.14 %; for the three aircraft object of study. In the case of the Airbus A , this increase was 3.83%. This increment gives a reliable capability to the process used in ELENA, since the real [2]ECS power consumption is ranging from 3 to 5 %. In the case of the Electric ECS, this value average increase of SCF was 1.56%. A negative contribution that this research has shown is the impact on the system weight, being higher than the conventional system. This result is achieved due to the additional components, mainly the electric motors and compressors. For the case of the extra wiring required to provide electrical power to the Electric ECS, there is not considerable contribution because the lack of pipelines from the engine counteracts with this negative contribution. In spite of this negative impact produced by an Electric-ECS weight, the improvement in the reduction of the total fuel penalties has been quantitatively better. Therefore, this research shows that the application of an Electric ECS has reached the main goal, towards a reduction on the system energy consumption. Speaking about reliability in the results and the model ELENA, the overall validation process, presented in the section 3.11, has shown acceptable values through each characteristic that contributes towards the final analysis: the mission profile, ECS 145
170 CHAPTER 7 CONCLUSIONS conventional power consumption, Electric ECS power consumption, thermodynamic balance, pressurization and fuel penalties. The use of Simulink for this study has shown very powerful capabilities to design and simulate the ECS. Among those capabilities, the graphical block diagramming tool and the customizable set of block libraries are the most highlighted characteristics. The graphical block diagramming tool makes the programming easier to understand since each calculation step is built up through diagram connections. On the other hand the block libraries offer a wide range of possibilities to read inputs, interconnect calculations and generate results. As seen on previous scenarios; for an Air Cycle Machine the cooling requires more bleed air taken from the engine. This fact shows that the cooling process is the major energy consumer. This research has shown that when configuring a conditioning pack, the most critical parameters that defined the energy consumption were the pressure ratios and the flow amount relations. As seen, when increased the compressor pressure ratio for the ram air, the flow temperature and pressure increased subsequently; becoming more difficult the capacity of the air cycle machine to provide a cold flow. On the other hand, when decreasing this value, the capability to produce enough pressure for the pressurization is reduced. Aiming to achieve better cabin requirements, the Air Cycle Machine response results can be improved with the implementation of two heat exchangers instead of one. More system weight and electric power consumption must be considered, but it is estimated that the final energy penalties will not be higher than a conventional ECS. 146
171 CHAPTER 8 RECOMMENDATIONS FOR FUTURE WORK CHAPTER 8 RECOMMENDATIONS FOR FUTURE WORK The model is a powerful tool which can be used for further and more detailed analysis through the implementation of more components; such components can include more automatized processes, and more detailed parametric studies. The automation of processes can improve the data reading for automatic control. As an example; the model can perform a better flow mixture on the manifold section to perform a smoother temperature control into the cabin. On the other hand a more detailed parametric study can achieve more improvement on the final energy consumption. As seen on the research, the most important parameters to select the configuration for the Electric ECS were the compressor pressure ratio for the ram air, the fan compressor ratio for the cooling flow and the ram-cooling flows ratio. A methodology on a better parametric study at this stage should achieve better parameters which would achieve less electric energy requirement; subsequently, less mass contribution due to smaller electric motors. 147
172
173 REFERENCES 1. Clean Sky JTI (Joint Technology Initiative). [Online] [Cited: 15 September 2011.] 2. Martínez, Isidoro. Aircraft Environmental Control. [Online] [Cited: ] 3. Neese, Bill. Aircraft Environmental Systems. Casper : Endeavor Books, Moir, Ian and Seabridge, Allan. Aircraft Systems: Mechanical, Electrical, and Avionics Subsystems Integration. The Atrium : John Wiley & Sons, Ltd, Mannini, Achille. Vapor Cycle Versus Air Cycle Environmental Control System Selection Criteria on Modern Helicopters. s.l. : NLR, Garrett, D. F. Aircraft Systems and Components. s.l. : IAP, Jane's Helicopter Markets and Systems. s.l. : Janes' Information Group. 8. Certification Specifications for Large Aeroplanes CS25: Annex to ED Decision 2010/005/R. s.l. : European Aviation Safety Agency, 5 August Certification Specifications for Large Rotorcraft CS29: Annex to ED Desicion 2008/010/R. s.l. : European Aviation Safety Agency, 17 November Walsh, Philip P. and Fletcher, Paul. Gas Turbine Performance. Oxford : Blackwell Science Ltd, Lawson, Dr Craig. Analisys of the Fuel Penalties of Airframe Systems AVD s.l. : Cranfield University, Martínez, Isidro. Aircraft Environmental Control. [Online] [Cited: 7 July 2011.] Aerospace Information Report: Aircraft Fuel Penalty Due to Air Conditioning. s.l. : SAE, A Method to Evaluate Aircraft Systems. Scholz, Dieter IATA. [Online] [Cited: ] ATR [Online] [Cited: ] html. 149
174
175 BIBLIOGRAPHY 1. Clean Sky JTI (Joint Technology Initiative). [Online] [Cited: 15 September 2011.] 2. Martínez, Isidoro. Aircraft Environmental Control. [Online] [Cited: ] 3. Neese, Bill. Aircraft Environmental Systems. Casper : Endeavor Books, Moir, Ian and Seabridge, Allan. Aircraft Systems: Mechanical, Electrical, and Avionics Subsystems Integration. The Atrium : John Wiley & Sons, Ltd, Mannini, Achille. Vapor Cycle Versus Air Cycle Environmental Control System Selection Criteria on Modern Helicopters. s.l. : NLR, Garrett, D. F. Aircraft Systems and Components. s.l. : IAP, Jane's Helicopter Markets and Systems. s.l. : Janes' Information Group. 8. Certification Specifications for Large Aeroplanes CS25: Annex to ED Decision 2010/005/R. s.l. : European Aviation Safety Agency, 5 August Certification Specifications for Large Rotorcraft CS29: Annex to ED Desicion 2008/010/R. s.l. : European Aviation Safety Agency, 17 November Walsh, Philip P. and Fletcher, Paul. Gas Turbine Performance. Oxford : Blackwell Science Ltd, Lawson, Dr Craig. Analisys of the Fuel Penalties of Airframe Systems AVD s.l. : Cranfield University, Martínez, Isidro. Aircraft Environmental Control. [Online] [Cited: 7 July 2011.] Aerospace Information Report: Aircraft Fuel Penalty Due to Air Conditioning. s.l. : SAE, A Method to Evaluate Aircraft Systems. Scholz, Dieter IATA. [Online] [Cited: ] ATR [Online] [Cited: ] html. 17. University, Cranfield. The Turbomatch Scheme
176 18. Kurzke, Joachim. GasTurb. [Online] [Cited: ] Wikipedia. Power-to-weight Ratio. Wikipedia. [Online] [Cited: ] Herzog, Jacques. Electrification of the Environmental Control System. s.l. : Liebherr Aerospace Lindenberg GmbH, Lawson, Dr Craig. Calculations of the Fuel Penalties of Airframe Systems AVD Kreith, Frank and Bohn, Mark S. Principles of Heat Transfer. Pacific Grove : Brooks Cole, Sonntag, Richard Edwin and Borgnakke, Claus. Fundamentals of Engineering Thermodynamics. Danvers : Wiley, Lombardo, David A. Aircraft Systems: Understanding Your Airplane. s.l. : Tab Books, Burke, Jason. The Benefits of Simulating Multiple Environmental Control Sub- Systems in a Single 1D System Model. s.l. : SAE, Ebeling, Alvin. Fundamentals of Aircraft Environmental Control. s.l. : Pitman, Ziegler, Shayne and Shapiro, Steven. Computer Simulation of an Aircraft Environmental Control System. s.l. : Flowmaster. 28. Dechow, M. Aircraft Environmental Control Systems. Berlin : Springer-Verlag, Hunt, Elwood H., et al. Commercial Airliner Environmental Control System: Engineering Aspects of Cabin Air Quality. 30. Integrative Thermodynamic Optimization of the Environmental Control System of an Aircraft. Vargas, Jose V.C. and Bejan, Adrian. 44, s.l. : International Journal of Heat and Mass Transfer, Thermodynamic Optimization of Finned Crossflow Heat Exchangers for Aircraft Environmental Control Systems. Vargas, Jose V.C. and Bejan, Adrian. 22, s.l. : International Journal of Heat Fluid Flow, Madana, Sarvademullu. Environmental Control System Modelling of a Basic Trainer Aircraft. s.l. : Thesis, Cranfield University, Couaaillac, Fabienne. Environmental Control Systems for the All-Electric Aircraft. s.l. : Thesis, Cranfield University,
177 34. Tang, Chuanjun. Environmental Control System for All Electric Aircraft Flying Crane. s.l. : Thesis, Cranfield University, Still, E.W. Into Thin Air. Yeovil, England : Normalair Ltd., Normalair. Toronto : Normalair Ltd., Aerospace Environmental Systems. San Diego, CA : SAE, Aerospace Recommended Practice: Aircraft Cabin Pressurization Criteria. s.l. : SAE, Thermofluid Mechanics and Energy: Power Station Cycles. Milton Keynes : The Open University Press, Air Conditioning Considerations for Turboprop Commuter and Business Aircraft. Semsroth, Howard R. and Kinsell, Robert C. 41. Minimum power requirement for environmental control of aircraft. Vargas, Jose V.C. and Bejan, Adrian. 28, s.l. : Elsevier, Bykov, L.T., Yegorov, M.S. and Tarasov, P.V. High Altitude Aircraft Equipment. London : Pergamon,
178


179 APPENDIX A PREVIOUS SIMULATION FRAMEWORK Figure 104: Scheme for the previous version of the analysis model Figure 105: Previous version, built on Simulink, of the ECS simulation model 155
180 SFC (lb/hr-lb) Take-Off Fuel Weight per lb/hr consumed (lb/lb-hr) SFC (lb/hr-lb) Take Off Weight per lb fixed Weight (lb/lb) APPENDIX B ALTERNATIVE METHOD TO CALCULATE THE FUEL PENALTY INPUTS SFCth Specific Fuel Consumption for Thrust 1.5 lb/hr-lb t Time 1.5 hrs L/D Lift/Drag Relation 10 - g Gravity ft/s^2 Ttb Turbine Inlet Temperature 2000 R wb Bleed Air Flow Rate 0 lb/hr wr Ram Air Flow Rate 3600 lb/hr V Aircraft Velocity 0 ft/s Vout Ram Air Velocity at Outlet 0 ft/s wv Expendable Materials (Water) 360 lb/hr wf Weight of System 1000 lb P Shaft horsepower usage 50 hp SFCp Shaft horsepower SFC 0.5 lb/hp-hr wfo lb/lb CHARTS 1. Fixed Weight Penalty TIME (hrs) L/D = Flight Time (hr) wv lb/lb-hr 2. Variable Weight (Expendable Material) Penalty TIME (hrs) L/D = Flight Time (hr) 156
181 SFC (lb/hr-lb) Take-Off Fuel Weight Penalty for Power Extraction (wfo/p(sfc)p) Ttb ( R) Increase in Fuel Flow Rate wf (lb/hr) SFC (lb/hr-lb) Take-Off Fuel Weight Penalty for Ram Air (Wfo/rwV) wv lb/lb-hr 3. Ram Air Penalty 0.9 TIME (hrs) L/D = Flight Time (hr) wv 0 lb/lb-hr Bleed Air Penalty Bleed Air Flow Bleed Air Flow wb (lb/hr X10^-3) wv lb/lb-hr 5. Shaft Horsepower Extraction Penalty TIME (hrs) L/D = Flight Time (hr) 157

182 APPENDIX C PREVIOUR FRAMEWORK PROCESS 158
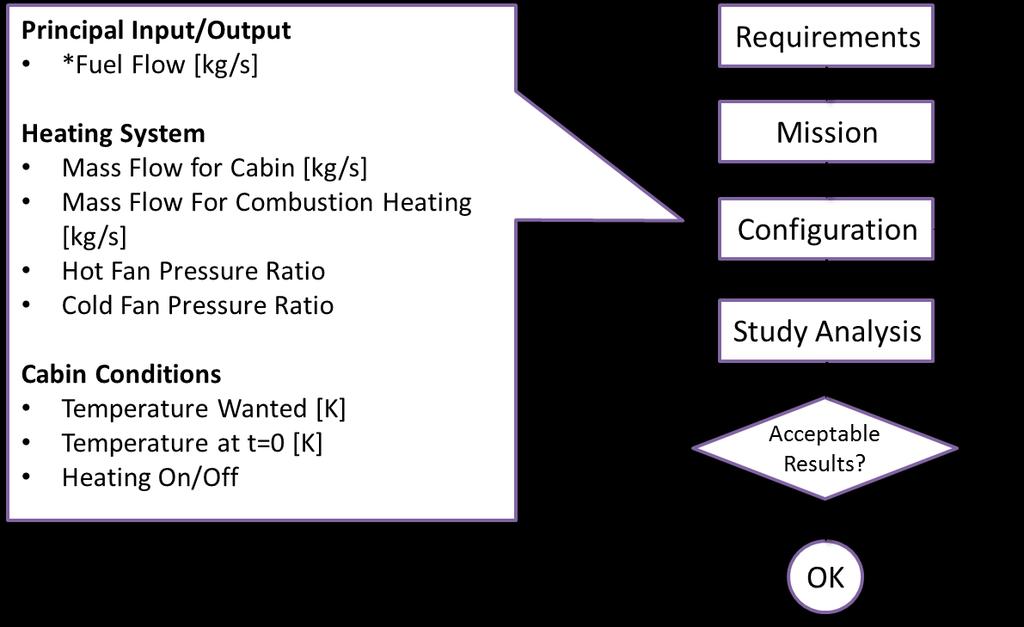
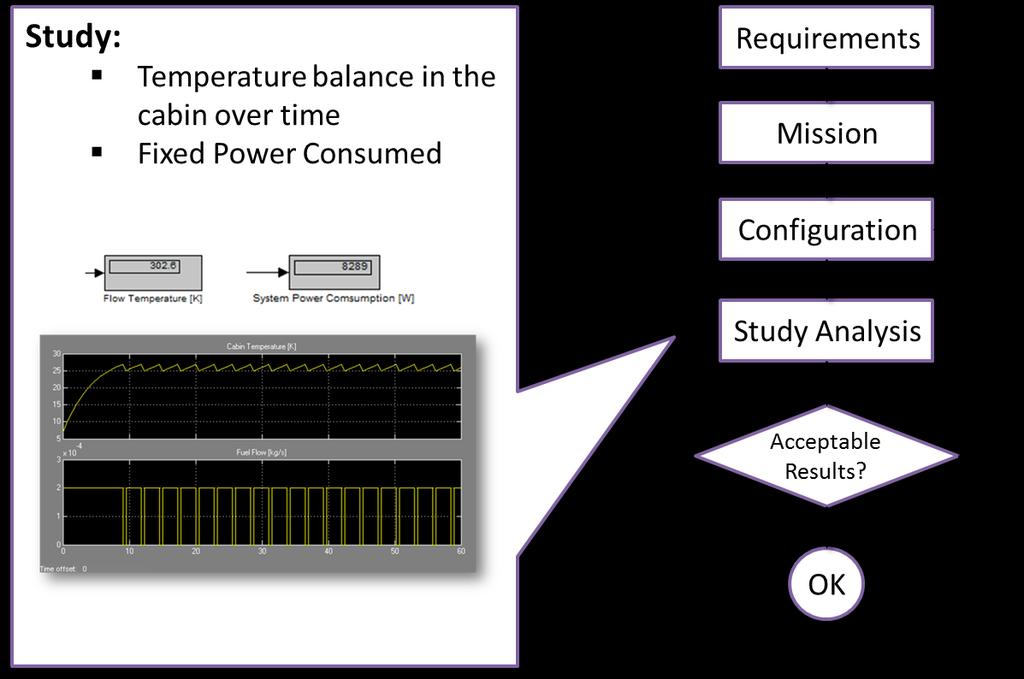
183 159
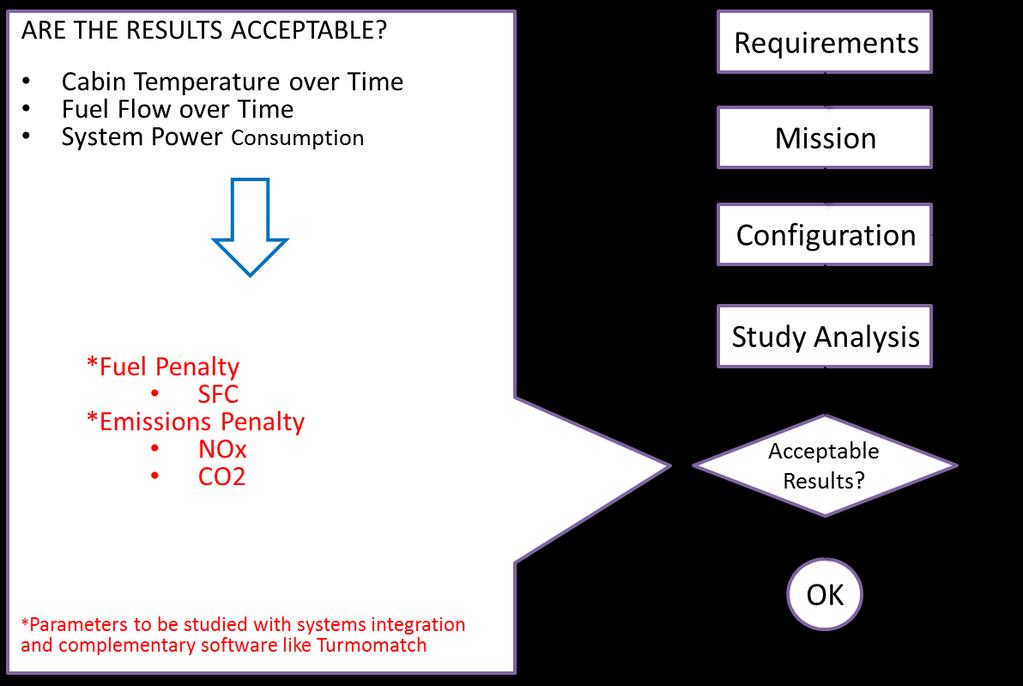
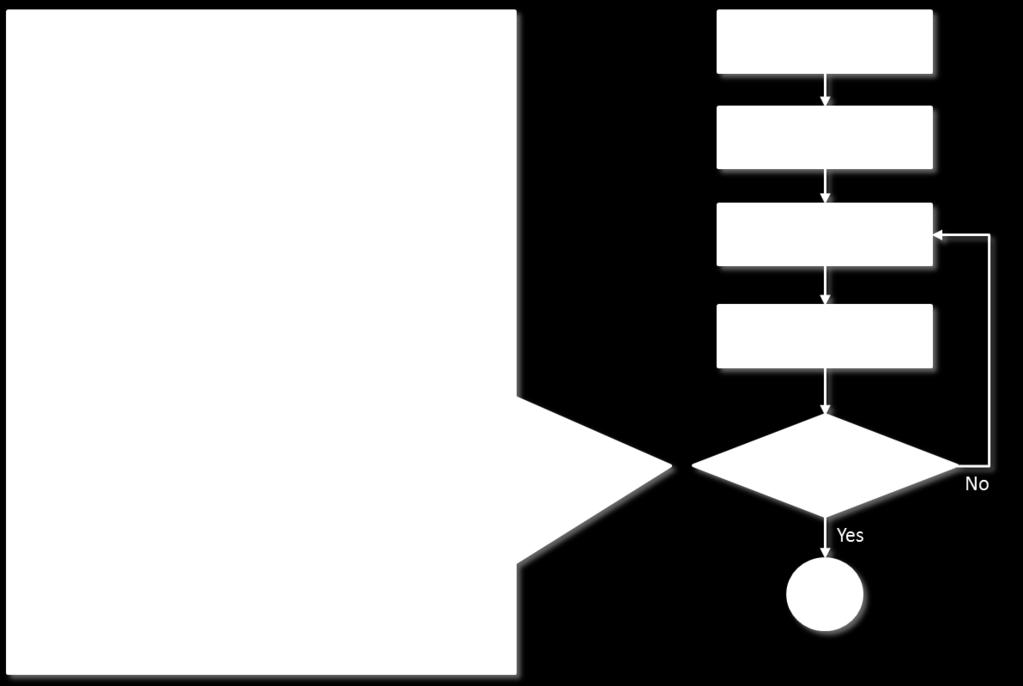
184 160


185 APPENDIX D - CONCEPTUAL ELECTRIC ECS DESIGN FOR A FLYING WING As part of a contribution for a Group Design Project, an Electric ECS was designed on conceptual stage. The following figures show the results achieved. As seen on the figure the localization of the condition packs, below the main fuselage, letting to locate the intakes for the air which is going to be conditioned. 161
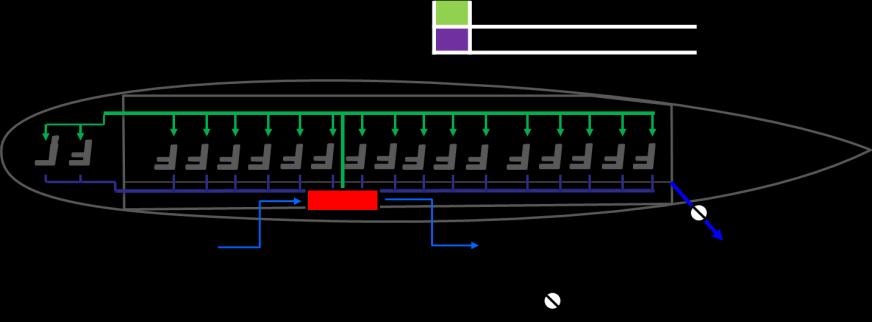

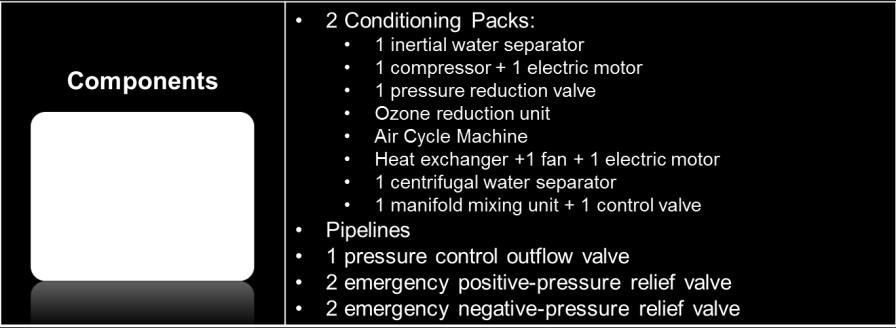
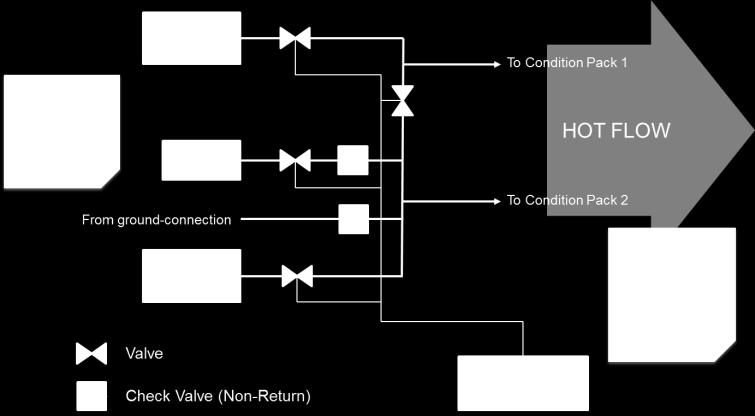
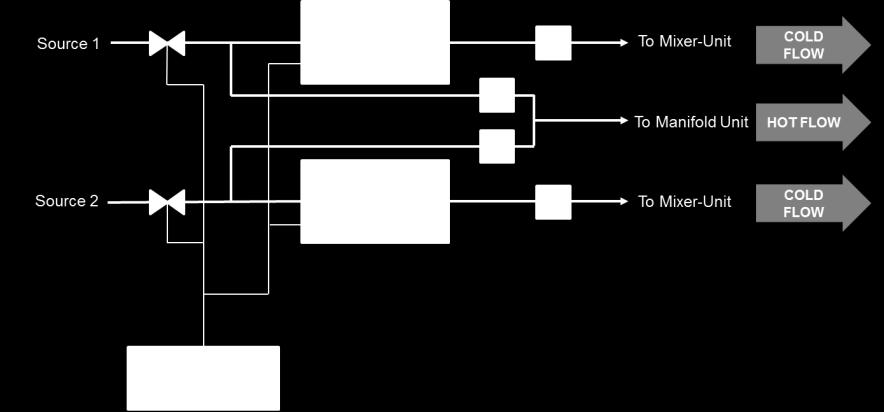
186 162
Preface. Acknowledgments. List of Tables. Nomenclature: organizations. Nomenclature: acronyms. Nomenclature: main symbols. Nomenclature: Greek symbols
 Contents Preface Acknowledgments List of Tables Nomenclature: organizations Nomenclature: acronyms Nomenclature: main symbols Nomenclature: Greek symbols Nomenclature: subscripts/superscripts Supplements
FUEL CONSUMPTION DUE TO SHAFT POWER OFF-TAKES FROM THE ENGINE
 FUEL CONSUMPTION DUE TO SHAFT POWER OFF-TAKES FROM THE ENGINE Dieter Scholz, Ravinkha Sereshine, Ingo Staack, Craig Lawson FluMeS Fluid and Mechatronic Systems Table of Contents Research Question Secondary
Chapter 4 Lecture 16. Engine characteristics 4. Topics. Chapter IV
 Chapter 4 Lecture 16 Engine characteristics 4 Topics 4.3.3 Characteristics of a typical turboprop engine 4.3.4 Characteristics of a typical turbofan engine 4.3.5 Characteristics of a typical turbojet engines
OPTIMAL MISSION ANALYSIS ACCOUNTING FOR ENGINE AGING AND EMISSIONS
 OPTIMAL MISSION ANALYSIS ACCOUNTING FOR ENGINE AGING AND EMISSIONS M. Kelaidis, N. Aretakis, A. Tsalavoutas, K. Mathioudakis Laboratory of Thermal Turbomachines National Technical University of Athens
Aircraft Design in a Nutshell
 Dieter Scholz Aircraft Design in a Nutshell Based on the Aircraft Design Lecture Notes 1 Introduction The task of aircraft design in the practical sense is to supply the "geometrical description of a new
Chapter 4 Estimation of wing loading and thrust loading - 10 Lecture 18 Topics
 Chapter 4 Estimation of wing loading and thrust loading - 10 Lecture 18 Topics 4.15.3 Characteristics of a typical turboprop engine 4.15.4 Characteristics of a typical turbofan engine 4.15.5 Characteristics
Flying Low and Slow. (and the Tools for its Calculation) Dieter Scholz. Hamburg University of Applied Sciences
 Dieter Scholz. Hamburg University of Applied Sciences") AIRCRAFT DESIGN AND SYSTEMS GROUP (AERO) (and the Tools for its Calculation) Hamburg University of Applied Sciences 12th European Workshop on Aircraft Design Education (EWADE) 2015 (and the Tools for its
AIRCRAFT DESIGN AND SYSTEMS GROUP (AERO) (and the Tools for its Calculation) Hamburg University of Applied Sciences 12th European Workshop on Aircraft Design Education (EWADE) 2015 (and the Tools for its
State Legislation, Regulation or Document Reference. Civil Aviation Rule (CAR) ; Civil Aviation Rules (CAR) Part 21. Appendix C.
 ; Civil Aviation Rules (CAR) Part 21. Appendix C.") Annex or Recommended Practice Definition INTERNATIONAL STANDARDS AND RECOMMENDED PRACTICES PART I. DEFINITIONS AND SYMBOLS Civil Aviation Rule (CAR) 91.807; Civil Aviation Rules (CAR) Part 21 The s of
Annex or Recommended Practice Definition INTERNATIONAL STANDARDS AND RECOMMENDED PRACTICES PART I. DEFINITIONS AND SYMBOLS Civil Aviation Rule (CAR) 91.807; Civil Aviation Rules (CAR) Part 21 The s of
Environmentally Focused Aircraft: Regional Aircraft Study
 Environmentally Focused Aircraft: Regional Aircraft Study Sid Banerjee Advanced Design Product Development Engineering, Aerospace Bombardier International Workshop on Aviation and Climate Change May 18-20,
COMPUTATIONAL ANALYSIS OF TWO DIMENSIONAL FLOWS ON A CONVERTIBLE CAR ROOF ABDULLAH B. MUHAMAD NAWI
 COMPUTATIONAL ANALYSIS OF TWO DIMENSIONAL FLOWS ON A CONVERTIBLE CAR ROOF ABDULLAH B. MUHAMAD NAWI Report submitted in partial of the requirements for the award of the degree of Bachelor of Mechanical
Investigation of Radiators Size, Orientation of Sub Cooled Section and Fan Position on Twin Fan Cooling Packby 1D Simulation
 Investigation of Radiators Size, Orientation of Sub Cooled Section and Fan Position on Twin Fan Cooling Packby 1D Simulation Neelakandan K¹, Goutham Sagar M², Ajay Virmalwar³ Abstract: A study plan to
AE 452 Aeronautical Engineering Design II Installed Engine Performance. Prof. Dr. Serkan Özgen Dept. Aerospace Engineering March 2016
 AE 452 Aeronautical Engineering Design II Installed Engine Performance Prof. Dr. Serkan Özgen Dept. Aerospace Engineering March 2016 Propulsion 2 Propulsion F = ma = m V = ρv o S V V o ; thrust, P t =
1 CEAS 2015 Paper number: 44
 CLEAN SKY TECHNOLOGY EVALUATOR AIR TRANSPORT SYSTEM ASSESSMENTS Alf Junior German Aerospace Centre, DLR Institute for air transport and airport research Linder Höhe, 51147, Cologne, Germany Alf.junior@dlr.de
AERONAUTICAL ENGINEERING
 AERONAUTICAL ENGINEERING SHIBIN MOHAMED Asst. Professor Dept. of Mechanical Engineering Al Ameen Engineering College Al- Ameen Engg. College 1 Aerodynamics-Basics These fundamental basics first must be
TYPE-CERTIFICATE DATA SHEET
 TYPE-CERTIFICATE DATA SHEET EASA.E.042 for RB211 Trent 700 series engines Type Certificate Holder 62 Buckingham Gate Westminster London SW1E 6AT United Kingdom For Models: RB211 Trent 768-60 RB211 Trent
CONCEPTUAL DESIGN OF UTM 4-SEATER HELICOPTER. Mohd Shariff Ammoo 1 Mohd Idham Mohd Nayan 1 Mohd Nasir Hussain 2
 CONCEPTUAL DESIGN OF UTM 4-SEATER HELICOPTER Mohd Shariff Ammoo 1 Mohd Idham Mohd Nayan 1 Mohd Nasir Hussain 2 1 Department of Aeronautics Faculty of Mechanical Engineering Universiti Teknologi Malaysia
Welcome to Aerospace Engineering
 Welcome to Aerospace Engineering DESIGN-CENTERED INTRODUCTION TO AEROSPACE ENGINEERING Notes 5 Topics 1. Course Organization 2. Today's Dreams in Various Speed Ranges 3. Designing a Flight Vehicle: Route
Jay Gundlach AIAA EDUCATION SERIES. Manassas, Virginia. Joseph A. Schetz, Editor-in-Chief. Blacksburg, Virginia. Aurora Flight Sciences
 Jay Gundlach Aurora Flight Sciences Manassas, Virginia AIAA EDUCATION SERIES Joseph A. Schetz, Editor-in-Chief Virginia Polytechnic Institute and State University Blacksburg, Virginia Published by the
TYPE-CERTIFICATE DATA SHEET
 TYPE-CERTIFICATE DATA SHEET No. EASA E.047 for RB211 Trent 800 series engines Type Certificate Holder 62 Buckingham Gate Westminster London SW1E 6AT United Kingdom For Models: RB211 Trent 895-17 RB211
Research on Optimization of Bleed Air Environment Control System of Aircraft Xin-ge WANG, Han BAO* and Kun-wu YE
 2017 International Conference on Electronic, Control, Automation and Mechanical Engineering (ECAME 2017) ISBN: 978-1-60595-523-0 Research on Optimization of Bleed Air Environment Control System of Aircraft
Electric Flight Potential and Limitations
 Electric Flight Potential and Limitations Energy Efficient Aircraft Configurations, Technologies and Concepts of Operation, Sao José dos Campos, 19 21 November 2013 Dr. Martin Hepperle DLR Institute of
POTENTIALITY OF INTRODUCING ABSORPTION CHILLER SYSTEMS TO IMPROVE THE DIESEL POWER PLANT PERFORMANCE IN SRI LANKA A
 POTENTIALITY OF INTRODUCING ABSORPTION CHILLER SYSTEMS TO IMPROVE THE DIESEL POWER PLANT PERFORMANCE IN SRI LANKA MTN Albert Master of Engineering 118351A Department of Mechanical Engineering University
Introduction to the ICAO Engine Emissions Databank
 Introduction to the ICAO Engine Emissions Databank Background Standards limiting the emissions of smoke, unburnt hydrocarbons (HC), carbon monoxide (CO) and oxides of nitrogen (NOx) from turbojet and turbofan
TABLE OF CONTENTS. Table of contents. Page ABSTRACT ACKNOWLEDGEMENTS TABLE OF TABLES TABLE OF FIGURES
 Table of contents TABLE OF CONTENTS Page ABSTRACT ACKNOWLEDGEMENTS TABLE OF CONTENTS TABLE OF TABLES TABLE OF FIGURES INTRODUCTION I.1. Motivations I.2. Objectives I.3. Contents and structure I.4. Contributions
Prof. João Melo de Sousa Instituto Superior Técnico Aerospace & Applied Mechanics. Part B Acoustic Emissions 4 Airplane Noise Sources
 Prof. João Melo de Sousa Instituto Superior Técnico Aerospace & Applied Mechanics Part B Acoustic Emissions 4 Airplane Noise Sources The primary source of noise from an airplane is its propulsion system.
Part II. HISTORICAL AND ENGINEERING ANALYSIS OF AIRSHIP PLAN-AND- DESIGN AND SERVICE DECISIONS
 CONTENTS MONOGRAPHER S FOREWORD DEFENITIONS, SYMBOLS, ABBREVIATIONS, AND INDICES Part I. LAWS AND RULES OF AEROSTATIC FLIGHT PRINCIPLE Chapter 1. AIRCRAFT FLIGHT PRINCIPLE 1.1 Flight Principle Classification
European Aviation Safety Agency
 European Aviation Safety Agency DECISION N o 2011/006/R OF THE EXECUTIVE DIRECTOR OF THE EUROPEAN AVIATION SAFETY AGENCY OF 19 AUGUST 2011 Amending Decision No. 2003/1/RM of the Executive Director of the
European Aviation Safety Agency
 European Aviation Safety Agency EASA TYPE-CERTIFICATE DATA SHEET Number : E.036 Issue : 04 Date : 10 September 2013 Type : Rolls-Royce plc Trent 1000 series engines Models Trent 1000-A Trent 1000-A2 Trent
EWADE th European Workshop on Aircraft Design Education - Naples 2011
 EWADE 2011 10th European Workshop on Aircraft Design Education - Naples 2011 Regional turboprop conversion for purposes supposing auxiliary engine installation. Technical and economical analysis Prof.
Master of Engineering
 STUDIES OF FAULT CURRENT LIMITERS FOR POWER SYSTEMS PROTECTION A Project Report Submitted in partial fulfilment of the requirements for the Degree of Master of Engineering In INFORMATION AND TELECOMMUNICATION
TURBOPROP ENGINE App. K AIAA AIRCRAFT ENGINE DESIGN
 CORSO DI LAUREA SPECIALISTICA IN Ingegneria Aerospaziale PROPULSIONE AEROSPAZIALE I TURBOPROP ENGINE App. K AIAA AIRCRAFT ENGINE DESIGN www.amazon.com LA DISPENSA E E DISPONIBILE SU http://www.ingindustriale.unisalento.it/didattica/
TYPE-CERTIFICATE DATA SHEET
 TYPE-CERTIFICATE DATA SHEET EASA.E.060 for RB211 Trent 500 Series Engines Type Certificate Holder 62 Buckingham Gate Westminster London SW1E 6AT United Kingdom For Models: RB211 Trent 553-61 RB211 Trent
TRAFFIC SIMULATION IN REGIONAL MODELING: APPLICATION TO THE INTERSTATEE INFRASTRUCTURE NEAR THE TOLEDO SEA PORT
 MICHIGAN OHIO UNIVERSITY TRANSPORTATION CENTER Alternate energy and system mobility to stimulate economic development. Report No: MIOH UTC TS41p1-2 2012-Final TRAFFIC SIMULATION IN REGIONAL MODELING: APPLICATION
Developments in Modern Aero-Engines to minimize the Impact of Bleed Air
 Developments in Modern Aero-Engines to minimize the Impact of Bleed Air Dr. Dieter Peitsch Rolls-Royce Deutschland Ltd. & Co. KG Dahlewitz, Germany Contact: dieter.peitsch@rolls-royce.com Outline Why is
INTRODUCTION. Research & Reviews: Journal of Engineering and Technology. Research Article
 Aircraft Fuel Manifold Design Substantiation and Additive Manufacturing Technique Assessment Using Finite Element Analysis Prasanna ND, Balasubramanya HS, Jyothilakshmi R*, J Sharana Basavaraja and Sachin
1. Aero-Science B.Sc. Aero Science-I Total Mark: 100 Appendix A (Outlines of Tests) Aero-Engines : 100 Marks
 Aero-Engines : 100 Marks") 1. Aero-Science B.Sc. Aero Science-I Total Mark: 100 Appendix A (Outlines of Tests) Aero-Engines : 100 Marks Note:- The questions will be set in each paper. Candidates are to attempt any five except in
1. Aero-Science B.Sc. Aero Science-I Total Mark: 100 Appendix A (Outlines of Tests) Aero-Engines : 100 Marks Note:- The questions will be set in each paper. Candidates are to attempt any five except in
Airship Technology. G. A. Khoury. J. D. Gillett Formerly of Brunei University and The Airship Association CAMBRIDGE UNIVERSITY PRESS
 - uirf Airship Technology G. A. Khoury Imperial College, London, and The Airship Association J. D. Gillett Formerly of Brunei University and The Airship Association CAMBRIDGE UNIVERSITY PRESS Contents
Part 1 Aerodynamic Theory COPYRIGHTED MATERIAL
 Part 1 Aerodynamic Theory COPYRIGHTED MATERIAL 5 6 1 Preliminaries Before studying the chapters dealing with the aerodynamics of each phase of flight, it is essential to understand various definitions
AIRCRAFT DESIGN SUBSONIC JET TRANSPORT
 AIRCRAFT DESIGN SUBSONIC JET TRANSPORT Analyzed by: Jin Mok Professor: Dr. R.H. Liebeck Date: June 6, 2014 1 Abstract The purpose of this report is to design the results of a given specification and to
Introduction to Gas Turbine Engines
 Introduction to Gas Turbine Engines Introduction Gas Turbine Engine - Configurations Gas Turbine Engine Gas Generator Compressor is driven by the turbine through an interconnecting shaft Turbine is driven
Chapter 4 Engine characteristics (Lectures 13 to 16)
") Chapter 4 Engine characteristics (Lectures 13 to 16) Keywords: Engines for airplane applications; piston engine; propeller characteristics; turbo-prop, turbofan and turbojet engines; choice of engine for
Chapter 4 Engine characteristics (Lectures 13 to 16) Keywords: Engines for airplane applications; piston engine; propeller characteristics; turbo-prop, turbofan and turbojet engines; choice of engine for
TYPE CERTIFICATE DATA SHEET
 TYPE CERTIFICATE DATA SHEET For Models: No. IM.E.102 for Engine GEnx Series Engines Type Certificate Holder GE Aviation One Neumann Way Cincinnati Ohio 45215 United States of America GEnx 1B GEnx 2B GEnx
SOFC Development for Aircraft Application
 SOFC Development for Aircraft Application G. Schiller German Aerospace Center (DLR) Institute of Technical Thermodynamics Pfaffenwaldring 38-40, D-70569 Stuttgart, Germany 1 st International Workshop on
The Aircraft Engine Design Project Fundamentals of Engine Cycles
 GE Aviation The Aircraft Engine Design Project Fundamentals of Engine Cycles 1 Spring 2008 Peter Rock Earl Will DeShazer Ken Gould GE Aviation Technical History I-A - First U.S. jet engine (Developed in
CONTENTS Duct Jet Propulsion / Rocket Propulsion / Applications of Rocket Propulsion / 15 References / 25
 CONTENTS PREFACE xi 1 Classification 1.1. Duct Jet Propulsion / 2 1.2. Rocket Propulsion / 4 1.3. Applications of Rocket Propulsion / 15 References / 25 2 Definitions and Fundamentals 2.1. Definition /
TYPE-CERTIFICATE DATA SHEET
 SF340A, 340B TYPE-CERTIFICATE DATA SHEET No. EASA.A.068 for SF340A, 340B Type Certificate Holder: Saab AB 581 88 Linköping SWEDEN For Models: SF340A, 340B TE.CERT.00051-001 European Aviation Safety Agency,
IAC-15-C4.3.1 JET INDUCER FOR A TURBO PUMP OF A LIQUID ROCKET ENGINE
 IAC-15-C4.3.1 JET INDUCER FOR A TURBO PUMP OF A LIQUID ROCKET ENGINE Martin Böhle Technical University Kaiserslautern, Germany, martin.boehle@mv.uni-kl.de Wolfgang Kitsche German Aerospace Center (DLR),
Introduction to Aerospace Engineering
 Introduction to Aerospace Engineering Lecture slides Challenge the future 1 18-9-2011 Introduction to Aerospace Engineering AE1101ab - Propulsion Delft University of Technology Prof.dr.ir. Challenge JaccotheHoekstra
10th Australian International Aerospace Congress
 AUSTRALIAN INTERNATIONAL AEROSPACE CONGRESS Paper presented at the 10th Australian International Aerospace Congress incorporating the 14th National Space Engineering Symposium 2003 29 July 1 August 2003
Application Note Original Instructions Development of Gas Fuel Control Systems for Dry Low NOx (DLN) Aero-Derivative Gas Turbines
 Aero-Derivative Gas Turbines") Application Note 83404 Original Instructions Development of Gas Fuel Control Systems for Dry Low NOx (DLN) Aero-Derivative Gas Turbines Woodward reserves the right to update any portion of this publication
Application Note 83404 Original Instructions Development of Gas Fuel Control Systems for Dry Low NOx (DLN) Aero-Derivative Gas Turbines Woodward reserves the right to update any portion of this publication
Advanced turboprop, propfan and turbojet bypass engines for GA and light airplanes S. DMYTRIYEV
 Advanced turboprop, propfan and turbojet bypass engines for GA and light airplanes S. DMYTRIYEV 23.11.09 HISTORY ZAPOROZHYE MACHINE-BUILDING DESIGN BUREAU PROGRESS STATE ENTERPRISE NAMED AFTER ACADEMICIAN
Approche novatrice pour la conception et l exploitation d avions écologiques, sous incertitudes.
 Sylvain Prigent Approche novatrice pour la conception et l exploitation d avions écologiques, sous incertitudes. Challenges Air traffic will double in the next 20 years! *Revenue passenger kilometers (number
Semi-Active Suspension for an Automobile
 Semi-Active Suspension for an Automobile Pavan Kumar.G 1 Mechanical Engineering PESIT Bangalore, India M. Sambasiva Rao 2 Mechanical Engineering PESIT Bangalore, India Abstract Handling characteristics
European Aviation Safety Agency
 European Aviation Safety Agency EASA TYPE CERTIFICATE DATA SHEET Number: IM.E.021 Issue: 05 Date: 03 January 2013 Type: General Electric Company CF34-10E Series Engines Variants CF34-10E2A1 CF34-10E5 CF34-10E5A1
UNCLASSIFIED FY 2017 OCO. FY 2017 Base
 Exhibit R-2, RDT&E Budget Item Justification: PB 2017 Air Force Date: February 2016 3600: Research, Development, Test & Evaluation, Air Force / BA 2: Applied Research COST ($ in Millions) Prior Years FY
European Aviation Safety Agency
 European Aviation Safety Agency EASA TYPE-CERTIFICATE DATA SHEET Number : E.006 Issue : 06 Date : 15.10.2012 Type : TURBOMECA MAKILA 2 series engines Models MAKILA 2A MAKILA 2A1 List of effective Pages:
INVESTIGATION OF ICING EFFECTS ON AERODYNAMIC CHARACTERISTICS OF AIRCRAFT AT TSAGI
 INVESTIGATION OF ICING EFFECTS ON AERODYNAMIC CHARACTERISTICS OF AIRCRAFT AT TSAGI Andreev G.T., Bogatyrev V.V. Central AeroHydrodynamic Institute (TsAGI) Abstract Investigation of icing effects on aerodynamic
CIVIL AVIATION REQUIREMENTS
 CIVIL AVIATION REQUIREMENTS SECTION 6 DESIGN STANDARDS AND TYPE CERTIFICATION SERIES C PART II AIRCRAFT ENGINE EMISSIONS CERTIFICATION STANDARDS AND PROCEDURES ISSUE II (Revision 0) August 2017 Director
CFD Investigation of Influence of Tube Bundle Cross-Section over Pressure Drop and Heat Transfer Rate
 CFD Investigation of Influence of Tube Bundle Cross-Section over Pressure Drop and Heat Transfer Rate Sandeep M, U Sathishkumar Abstract In this paper, a study of different cross section bundle arrangements
Development and Implementation of Interactive/Visual Software for Simple Aircraft Gas Turbine Design
 Development and Implementation of Interactive/Visual Software for Simple Aircraft Gas Turbine Design Afshin J. Ghajar, Ronald D. Delahoussaye, Vandan V. Nayak School of Mechanical and Aerospace Engineering,
TYPE-CERTIFICATE DATA SHEET
 TYPE-CERTIFICATE DATA SHEET For Models: No. IM.E.102 for Engine GEnx Series Engines Type Certificate Holder GE Aviation One Neumann Way Cincinnati - Ohio 45215 United States of America GEnx-1B GEnx-2B
Propeller blade shapes
 31 1 Propeller blade shapes and Propeller Tutorials 2 Typical Propeller Blade Shape 3 M Flight M. No. Transonic Propeller Airfoil 4 Modern 8-bladed propeller with transonic airfoils near the tip and swept
Use of Flow Network Modeling for the Design of an Intricate Cooling Manifold
 Use of Flow Network Modeling for the Design of an Intricate Cooling Manifold Neeta Verma Teradyne, Inc. 880 Fox Lane San Jose, CA 94086 neeta.verma@teradyne.com ABSTRACT The automatic test equipment designed
Light Helicopter Demonstrator with HCE (High Compression Engine) Alexandre Gierczynski London, October 20 th, 2015
 Alexandre Gierczynski London, October 20 th, 2015") Light Helicopter Demonstrator with HCE (High Compression Engine) Alexandre Gierczynski London, October 20 th, 2015 Agenda Project Overview Advantages and drawback Engine key characteristics Achievements
Light Helicopter Demonstrator with HCE (High Compression Engine) Alexandre Gierczynski London, October 20 th, 2015 Agenda Project Overview Advantages and drawback Engine key characteristics Achievements
Fuel Efficiency The Industry, IATA and You
 Fuel Efficiency The Industry, IATA and You Captain Pat Jordan Airline Cost Conference The Industry Airline Cost Conference Still high fuel price Industry Challenges Fuel represents 32% of airline budget
European Aviation Safety Agency
 European Aviation Safety Agency EASA TYPE-CERTIFICATE DATA SHEET Number: IM.E.011 Issue: 07 Date: 08 October 2013 Type: Honeywell International Inc. TFE731-20, -40, -50, -60 series engines Models: TFE731-20
Whole Engine Integration
 Sub Project 1 Whole Engine Integration Andrew Rolt, Rolls-Royce plc. European Engine Technology Workshop Warsaw, SP1 Whole Engine Integration Introduction and Objectives Development of the four advanced
Systems Group (Summer 2012) 4 th Year (B.Eng) Aerospace Engineering Candidate Carleton University, Ottawa,Canada Mail:
 4 th Year (B.Eng) Aerospace Engineering Candidate Carleton University, Ottawa,Canada Mail:") Memo Airport2030_M_Family_Concepts_of_Box_Wing_12-08-10.pdf Date: 12-08-10 From: Sameer Ahmed Intern at Aero Aircraft Design and Systems Group (Summer 2012) 4 th Year (B.Eng) Aerospace Engineering Candidate
Memo Airport2030_M_Family_Concepts_of_Box_Wing_12-08-10.pdf Date: 12-08-10 From: Sameer Ahmed Intern at Aero Aircraft Design and Systems Group (Summer 2012) 4 th Year (B.Eng) Aerospace Engineering Candidate
Fuel Cell Application in a New Configured Aircraft PUBLISHABLE REPORT
 Fuel Cell Application in a New Configured Aircraft PUBLISHABLE REPORT Document Reference CELINA Publishable Report Contract Nr. AST4-CT-2005-516126 Version/Date Version 1.3 January 2009 Issued by Airbus
A Game of Two: Airbus vs Boeing. The Big Guys. by Valerio Viti. Valerio Viti, AOE4984, Project #1, March 22nd, 2001
 A Game of Two: Airbus vs Boeing The Big Guys by Valerio Viti 1 Why do we Need More Airliners in the Next 20 Years? Both Boeing and Airbus agree that civil air transport will keep increasing at a steady
TCDS NUMBER E00078NE U.S. DEPARTMENT OF TRANSPORTATION REVISION: 3 DATE: April 12, 2011
 TCDS NUMBER E00078NE U.S. DEPARTMENT OF TRANSPORTATION REVISION: 3 DATE: April 12, 2011 FEDERAL AVIATION ADMINISTRATION GENERAL ELECTRIC COMPANY MODELS: TYPE CERTIFICATE DATA SHEET E00078NE GEnx-1B54 GEnx-1B58
COUNCIL OF THE EUROPEAN UNION. Brussels, 11 December /3/06 REV 3 ADD 1. Interinstitutional File: 2003/ 0153(COD) ENT 84 CODEC 561
 ENT 84 CODEC 561") COUNCIL OF THE EUROPEAN UNION Brussels, 11 December 2006 Interinstitutional File: 2003/ 0153(COD) 9911/3/06 REV 3 ADD 1 T 84 CODEC 561 STATEMT OF THE COUNCIL'S REASONS Subject : Common Position adopted
COUNCIL OF THE EUROPEAN UNION Brussels, 11 December 2006 Interinstitutional File: 2003/ 0153(COD) 9911/3/06 REV 3 ADD 1 T 84 CODEC 561 STATEMT OF THE COUNCIL'S REASONS Subject : Common Position adopted
Lead Acid Batteries Modeling and Performance Analysis of BESS in Distributed Generation
 Murdoch University Faculty of Science & Engineering Lead Acid Batteries Modeling and Performance Analysis of BESS in Distributed Generation Heng Teng Cheng (30471774) Supervisor: Dr. Gregory Crebbin 11/19/2012
Icing Wind Tunnel tests in the framework of a Wing Ice Protection system certification process
 Icing Wind Tunnel tests in the framework of a Wing Ice Protection system certification process AirTN-NextGen Workshop on Virtual testing, towards virtual certification Amsterdam (NL), May 25, 2016 Use
A Primer: Aircraft Emissions & Environmental Impact
 A Primer: Aircraft Emissions & Environmental Impact Alan Epstein Vice President Technology & Environment Aviation and the Environment Washington, DC, March 2008 Impact of Aviation on The Environment ~40,000
AUTOMATED SELECTION OF THE MATERIAL A FAN BLADE PS-90A
 AUTOMATED SELECTION OF THE MATERIAL A FAN BLADE PS-90A D. A. Akhmedzyanov, A. E. Kishalov, K. V. Markina USATU Ufa State Aviation Technical University, Russia Keywords: GTE, fan blade, composite material,
Clean Sky Programme. JTI Workshop, Vienna 3 rd of February, Helmut Schwarze, Project Officer CSJU Andrzej Podsadowski, Project Officer CSJU
 Clean Sky Programme Helmut Schwarze, Project Officer CSJU Andrzej Podsadowski, Project Officer CSJU JTI Workshop, Vienna 3 rd of February, 2011 1 1 Clean Sky Programme Overview 2 2 Clean Sky Integrated
Jet Aircraft Propulsion Prof. Bhaskar Roy Prof. A.M. Pradeep Department of Aerospace Engineering Indian Institute of Technology, Bombay
 Jet Aircraft Propulsion Prof. Bhaskar Roy Prof. A.M. Pradeep Department of Aerospace Engineering Indian Institute of Technology, Bombay Lecture No. # 04 Turbojet, Reheat Turbojet and Multi-Spool Engines
DIRECT TORQUE CONTROL OF A THREE PHASE INDUCTION MOTOR USING HYBRID CONTROLLER. RAJESHWARI JADI (Reg.No: M070105EE)
") DIRECT TORQUE CONTROL OF A THREE PHASE INDUCTION MOTOR USING HYBRID CONTROLLER A THESIS Submitted by RAJESHWARI JADI (Reg.No: M070105EE) In partial fulfillment for the award of the Degree of MASTER OF
DIRECT TORQUE CONTROL OF A THREE PHASE INDUCTION MOTOR USING HYBRID CONTROLLER A THESIS Submitted by RAJESHWARI JADI (Reg.No: M070105EE) In partial fulfillment for the award of the Degree of MASTER OF
THE ANALYSIS OF WING PERFORMANCE FOR RECONNAISSANCE UAV ZULKIFLI BIN YUSOF UNIVERSITI MALAYSIA PAHANG
 THE ANALYSIS OF WING PERFORMANCE FOR RECONNAISSANCE UAV ZULKIFLI BIN YUSOF UNIVERSITI MALAYSIA PAHANG The Analysis of Wing Performance for Reconnaissance UAV ZULKIFLI BIN YUSOF Report submitted in partial
Research Report ZETJET-Aircraft Engines
 Research Report ZETJET-Aircraft Engines aviation can reduce cost of transport by up to 70% UAV 1 click picture for video test rig click picture for video UAV 2- click picture for video ZETJET AG Bahnhofplatz
TYPE-CERTIFICATE DATA SHEET
 TYPE-CERTIFICATE DATA SHEET EASA.E.036 For Models: for Trent 1000 series engines Certificate Holder Rolls-Royce plc 62 Buckingham Gate London SW1E 6AT United Kingdom Trent 1000-A Trent 1000-A2 Trent 1000-AE3
ANALYSIS OF OVERCURRENT PROTECTION RELAY SETTINGS OF A COMMERCIAL BUILDING NURUL SYAQIRAH BINTI MOHD SUFI UNIVERSITI MALAYSIA PAHANG
 ANALYSIS OF OVERCURRENT PROTECTION RELAY SETTINGS OF A COMMERCIAL BUILDING NURUL SYAQIRAH BINTI MOHD SUFI UNIVERSITI MALAYSIA PAHANG ANALYSIS OF OVERCURRENT PROTECTION RELAY SETTINGS OF A COMMERCIAL BUILDING
PART XV Metering Systems SECTION 2 GUIDE TO GAS METERING SYSTEMS
 THE INSTITUTE OF PETROLEUM PETROLEUM MEASUREMENT MANUAL PART XV Metering Systems SECTION 2 GUIDE TO GAS METERING SYSTEMS THE INSTITUTE OF PETROLEUM PETROLEUM MEASUREMENT MANUAL PART XV Metering Systems
O sistema EASA As novas regras OPS NPA Workshop EASA/INAC Lisboa, Fevereiro 2009
 O sistema EASA As novas regras OPS NPA 2009-02 Workshop EASA/INAC Lisboa, 19-20 Fevereiro 2009 AGENDA I. The institutional and regulatory framework II. The EASA Rulemaking procedure III. Differences with
Design Considerations for Stability: Civil Aircraft
 Design Considerations for Stability: Civil Aircraft From the discussion on aircraft behavior in a small disturbance, it is clear that both aircraft geometry and mass distribution are important in the design
STUDY OF EFFECTS OF FUEL INJECTION PRESSURE ON PERFORMANCE FOR DIESEL ENGINE AHMAD MUIZZ BIN ISHAK
 STUDY OF EFFECTS OF FUEL INJECTION PRESSURE ON PERFORMANCE FOR DIESEL ENGINE AHMAD MUIZZ BIN ISHAK Thesis submitted in fulfilment of the requirements for the award of the Bachelor of Mechanical Engineering
Evolution of Rotary Wing Technology, Enhanced Capabilities for Humanitarian Operations
 Evolution of Rotary Wing Technology, Enhanced Capabilities for Humanitarian Operations Global Humanitarian Aviation Conference Lisbon, 11 th October 2017 Clive Scott, Director of Tiltrotor and Unmanned
Mathematical Model of Electric Vehicle Power Consumption for Traveling and Air-Conditioning
 Journal of Energy and Power Engineering 9 (215) 269-275 doi: 1.17265/1934-8975/215.3.6 D DAVID PUBLISHING Mathematical Model of Electric Vehicle Power Consumption for Traveling and Air-Conditioning Seishiro
INTRODUCTION. I.1 - Historical review.
 INTRODUCTION. I.1 - Historical review. The history of electrical motors goes back as far as 1820, when Hans Christian Oersted discovered the magnetic effect of an electric current. One year later, Michael
FLEXIBLE, FAST AND HIGH FIDELITY APPROACH TO GTU PART-LOAD AND OFF-DESIGN PERFORMANCE PREDICTIONS
 TETS 2018, Dayton Convention Center, Dayton, Ohio, Sept. 10-13, 2018 FLEXIBLE, FAST AND HIGH FIDELITY APPROACH TO GTU PART-LOAD AND OFF-DESIGN PERFORMANCE PREDICTIONS Presenter: Co-Authors: Company: Dr.
FINAL PROJECT RESEARCH PAPER
 FINAL PROJECT COMPARISON ANALYSIS OF ENGINE PERFOMANCE BETWEEN CONVENTIONAL ENGINE (CARBURETOR) SYSTEM AND ELECTRONIC FUEL INJECTION (EFI) ENGINE SYSTEM OF TOYOTA KIJANG SERIES 7K-E RESEARCH PAPER Submitted
Flugzeugentwurf / Aircraft Design SS Part 35 points, 70 minutes, closed books. Prof. Dr.-Ing. Dieter Scholz, MSME. Date:
 DEPARTMENT FAHRZEUGTECHNIK UND FLUGZEUGBAU Flugzeugentwurf / Aircraft Design SS 2015 Duration of examination: 180 minutes Last Name: Matrikelnummer: First Name: Prof. Dr.-Ing. Dieter Scholz, MSME Date:
Bild : Bernhard Mühr German Aerospace Center Flight Operations
 German Aerospace Center Flight Operations Bild : Bernhard Mühr www.wolkenatlas.de Introduction DLR is Germany s aerospace research center and space agency with about 4700 employees in 31 research institutes
Turbo-Rocket. A brand new class of hybrid rocket. Rene Nardi and Eduardo Mautone
 Turbo-Rocket R A brand new class of hybrid rocket Rene Nardi and Eduardo Mautone 53 rd AIAA/SAE/ASEE Joint Propulsion Conference July 10 12, 2017 - Atlanta, Georgia Rumo ao Espaço R - UFC Team 2 Background
Flugzeugentwurf / Aircraft Design WS 10/ Klausurteil 30 Punkte, 60 Minuten, ohne Unterlagen. Prof. Dr.-Ing. Dieter Scholz, MSME
 DEPARTMENT FAHRZEUGTECHNIK UND FLUGZEUGBAU Prof. Dr.-Ing. Dieter Scholz, MSME Flugzeugentwurf / Aircraft Design WS 10/11 Bearbeitungszeit: 180 Minuten Name: Matrikelnummer.: Vorname: Punkte: von 68 Note:
Chapter 10 Miscellaneous topics - 2 Lecture 39 Topics
 Chapter 10 Miscellaneous topics - 2 Lecture 39 Topics 10.3 Presentation of results 10.3.1 Presentation of results of a student project 10.3.2 A typical brochure 10.3 Presentation of results At the end
Environmental Impact Assessment, on the Operation of Conventional and More Electric Large Commercial Aircraft
 Environmental Impact Assessment, on the Operation of Conventional and More Electric Large Commercial Aircraft R. Seresinhe, C. P. Lawson and R. Sabatini, School of Engineering, Cranfield University, UK
European Aviation Safety Agency
 Page 1/8 European Aviation Safety Agency EASA TYPE CERTIFICATE DATA SHEET Cirrus Design SF50 Type Certificate Holder: Cirrus Design Corporation 4515 Taylor Circle Duluth, Minnesota 55811 United States
DESIGN AND DEVELOPMENT OF A MICRO AIR VEHICLE (µav) CONCEPT: PROJECT BIDULE
 CONCEPT: PROJECT BIDULE") DESIGN AND DEVELOPMENT OF A MICRO AIR VEHIE (µav) CONCEPT: PROJECT BIDULE Mr T. Spoerry, Dr K.C. Wong School of Aerospace, Mechanical and Mechatronic Engineering University of Sydney NSW 6 Abstract This
DESIGN AND DEVELOPMENT OF A MICRO AIR VEHIE (µav) CONCEPT: PROJECT BIDULE Mr T. Spoerry, Dr K.C. Wong School of Aerospace, Mechanical and Mechatronic Engineering University of Sydney NSW 6 Abstract This