Economic Impact Study for a Canola-Based Biodiesel Industry in Canada
|
|
|
- Gavin Jordan
- 6 years ago
- Views:
Transcription


1 Economic Impact Study for a Canola-Based Biodiesel Industry in Canada Prepared for: Canola Council of Canada Lombard Avenue Winnipeg, MB R3B 0T6 BBI Biofuels Canada 81 Bruce Street, Unit C Kitchener, ON N2B 1Y July, 2006 Prepared By: BBI Biofuels Canada Bradley A. Saville Principal Contact: Sigrid Villeneuve
2 BIODIESEL PRODUCTION FEASIBILITY STUDY FOR CANOLA COUNCIL OF CANADA NOTICE This report was prepared as an account of work sponsored by the Canola Council of Canada. Neither BBI Biofuels Canada, nor any of their employees, makes any warranty, expressed or implied, or assumes any legal liability or responsibility for the accuracy, completeness, or usefulness of any information, apparatus, produce, or process disclosed, or represents that its use would not infringe privately owned rights. Reference herein to any specific commercial product, process, or service by trade name, trademark, manufacturer, or otherwise does not constitute or imply its endorsement, recommendation, or favoring by BBI Biofuels Canada. BBI BIOFUELS CANADA i 7/10/2006
3 BIODIESEL PRODUCTION FEASIBILITY STUDY FOR CANOLA COUNCIL OF CANADA TABLE OF CONTENTS I. EXECUTIVE SUMMARY Summary Discussion Results of Site Assessment Results of Feedstock Assessment Product and Byproduct Markets Individual Plant Economics and Sensitivity Analyses Need for Incentives Comparison to U.S. Oilseed-based Biodiesel Facilities Economic Impacts II. PROJECT OVERVIEW Introduction Scope of Work Report Outline III. SITE ASSESSMENT Site Evaluation Criteria Candidate Sites IV. FEEDSTOCK AVAILABILITY AND PRICE Feedstock Requirements World Oilseed Industry Overview Summary of Oilseed Production in Canada Canola Supply Analysis National Production National Disappearance National Carry Over Regional Production Local Production Local Disappearance Cost of Canola Conclusions for Feedstock V. REVIEW OF BIODIESEL MARKETS National Biodiesel Market Overview Biodiesel Production Capacity National Biodiesel Use National Biodiesel Market Potential Regional Biodiesel Market Potential Regional Competition Local Biodiesel Market Potential Biodiesel Price Conclusions Regarding Biodiesel Markets VI. CO-PRODUCT MARKETS Co-Products: Volume of Production Glycerol Markets: Volume and Price Glycerol Price Canola Meal Section Summary BBI BIOFUELS CANADA ii 7/10/2006
4 BIODIESEL PRODUCTION FEASIBILITY STUDY FOR CANOLA COUNCIL OF CANADA VII. FACILITY DESIGN BASIS AND PROJECT STATISTICS Process Description Biox Process Summary of Production Statistics Personnel Requirements VIII. ESTIMATED CAPITAL & OPERATING COSTS Assumptions Made in the Financial Analysis Capital Construction Cost Estimates IX. FINANCIAL ANALYSIS Economic Modeling Results for Biodiesel Production Breakeven Analysis Sensitivity Analysis Section Summary and Analysis Comments on Profitability and Economic Forecasts X. INDUSTRY-WIDE FINANCIAL ANALYSIS AND IMPACT OF A RFS Industry-Wide ProForma - 2% RFS Industry-Wide ProForma - 5% RFS Industry-Wide ProForma - 10% RFS Value of Spin-Off Economic Activity Comments on Economic Activity Summary of Economic Impacts XI. COMPARISON TO A U.S. OILSEED-BASED BIODIESEL INDUSTRY North Dakota Canola Production and Disappearance Canola Prices Canola Freight Rates Delivered Price of Canola Biodiesel Prices Financial projections for Canola-Based Plants Comparison to Soybean-based Biodiesel Facilities Section Summary XII. OWNERSHIP STRUCTURES Corporations Cooperative Corporations New Generation Cooperatives Joint venture XIII. STRUCTURAL AND OPERATIONAL CHALLENGES Feedstock Supply - Competition and Pricing Biodiesel Marketing XIV. CONCLUSIONS Candidate Sites and Implementation Scenarios Feedstock Supply and Pricing Product and Byproduct Markets Individual Plant Economics and Sensitivity Analyses Need for Incentives Economic Impact Comparison to U.S. Biodiesel BBI BIOFUELS CANADA iii 7/10/2006
5 BIODIESEL PRODUCTION FEASIBILITY STUDY FOR CANOLA COUNCIL OF CANADA APPENDIX 1 Railway Maps APPENDIX 2 Economic Analysis of Mixed Feedstocks, Fats, Oils and Greases BBI BIOFUELS CANADA iv 7/10/2006
6 BIODIESEL PRODUCTION FEASIBILITY STUDY FOR CANOLA COUNCIL OF CANADA LIST OF TABLES Table 4-1 Yield of Major Oilseed Crops in Canada, Table 4-2 Typical Oilseed Yields in Canada 4-1 Table 4-3 Biodiesel Production Requirements from Various Feedstocks 4-2 Table 4-4 Feedstock Requirements for Biodiesel Production (Solvent Extraction) 4-2 Table 4-5 Feedstock Requirements for Biodiesel Production (Mechanical Extraction) 4-2 Table 4-6 Major Oilseed Producing Nations in Table 4-7 Canadian Canola supply and distribution 4-5 Table 4-8 Canola Production in Western Canada 4-6 Table 4-9 Historical Canola Prices 4-11 Table 5-1 World Petrodiesel Consumption, Table 5-2 Canadian and Regional Diesel Fuel Consumption: Transportation Uses 5-6 Table 5-3 Fuel Taxes for Gasoline and Diesel Fuel Across Canada 5-10 Table 5-4 Retail and Wholesale Prices of Diesel Fuel Across Canada 5-10 Table 5-5 Biofuels Tax Exemptions Across Canada 5-11 Table 5-6 Estimated Selling Price of Biodiesel, including Provincial Road Tax Exemptions 5-12 Table 6-1 Biodiesel Production Parameters 6-1 Table 6-2 Canola Meal Supply and Demand 6-8 Table 6-3 Historical Canola Meal Pricing 6-9 Table 7-1 Project Statistics for Biodiesel Production Plant 7-5 Table 7-2 Personnel Requirements for Integrated Crush-Biodiesel Facilities t 7-6 Table 7-3 Salary and Income Tax Summary for Various Plant Scales 7-7 Table 7-4 Salary Statistics and Total Tax Revenues for Each Production Scenario, by 7-7 Jurisdiction Table 8-1 Project Assumptions for Biodiesel Production Plants 8-2 Table 8-2 Biodiesel Production Plant Capital Costs 8-4 Table 9-1 Modeling Results for Biodiesel Production: Biodiesel at 58.5 cents/l 9-2 Table 9-2 Modeling Results for Biodiesel Production:Biodiesel at 66 cents/l 9-2 Table 9-3 Effect of Biodiesel and Canola Prices on ROI 9-3 Table 9-4 Year 2 Income Statement for 151, 227 and 303 MMLY Biodiesel Plants 9-5 Table 9-5 Breakeven Analysis for a 151 MMLY Biodiesel Plant 9-8 Table 9-6 Breakeven Analysis for a 227 MMLY Biodiesel Plant 9-9 Table 9-7 Breakeven Analysis for a 303 MMLY Biodiesel Plant 9-10 Table 10-1 Proforma Income Statement Canola-Based Biodiesel Industry 2% RFS 10-3 Table 10-2 Capital Investment and Tax Revenue Summary 2% RFS 10-4 Table 10-3 Total Direct Employment in a Biodiesel Industry 2% RFS 10-4 Table 10-4 New Economic Activity Directly Arising from Biodiesel Production 2% RFS 10-5 Table 10-5 Direct Impact on Farm Producer Income 2% RFS 10-5 Table 10-6 Economic Activity to Support Farms Producing Canola for a 2% RFS 10-5 Table 10-7 Proforma Income Statement Entire Canola-Based Biodiesel Industry 5% RFS 10-7 Table 10-8 Capital Investment and Tax Revenue Summary 5% RFS 10-8 Table 10-9 Total Direct Employment in a Biodiesel Industry 5% RFS 10-8 Table New Economic Activity Directly Arising from Biodiesel Production 5% RFS 10-9 Table Direct Impact on Farm Producer Income 5% RFS 10-9 Table Economic Activity to Support Farms Producing Canola for a 5% RFS 10-9 Table Proforma Income Statement Entire Canola-Based Biodiesel Industry 10% RFS Table Capital Investment and Tax Revenue Summary 10% RFS Table Total Direct Employment in a Biodiesel Industry 10% RFS Table New Economic Activity Directly Arising from Biodiesel Production 10% RFS Table Direct Impact on Farm Producer Income 10% RFS BBI BIOFUELS CANADA v 7/10/2006
7 BIODIESEL PRODUCTION FEASIBILITY STUDY FOR CANOLA COUNCIL OF CANADA Table Economic Activity to Support Farms Producing Canola for a 10% RFS Table Value of Goods and Services Purchased by the Primary Agriculture Sector Table Operating Expenses in the Primary Agriculture Industry, Table Operating Expenses in Grain and Oilseed Farming Operations, Table 11-1 Financial Projections for a Canola-Based Biodiesel Plant in North Dakota 11-3 Table 11-2 Financial Projections for a Canola-Based Biodiesel Plant in North Dakota 11-3 BBI BIOFUELS CANADA vi 7/10/2006
8 BIODIESEL PRODUCTION FEASIBILITY STUDY FOR CANOLA COUNCIL OF CANADA LIST OF FIGURES Figure 1-1 Summary of Economic Impacts of Biodiesel Production from Canola 1-2 Figure 1-2 Effect of a Renewable Fuels Standard on Employment 1-7 Figure 3-1 Small Scale Production Scenario 3-5 Figure 3-2 Large Scale Production Scenario 3-6 Figure 4-1 Worldwide Production of Vegetable Oils 4-3 Figure 4-2 Canola Production by Census Division in Alberta 4-7 Figure 4-3 Canola Production by Census Division in Saskatchewan 4-8 Figure 4-4 Canola Production by Census Division in Manitoba 4-9 Figure 4-5 Small Scale Biodiesel Production Scenario Historical Canola Production Levels 4-13 Figure 4-6 Small Scale Biodiesel Production Scenario Future Growth in Canola Production 4-14 Figure 4-7 Large Scale Biodiesel Production Scenario Historical Canola Production Levels 4-15 Figure 4-8 Large Scale Biodiesel Production Scenario Future Growth in Canola Production 4-16 Figure 5-1 Historical Use of Biodiesel in Canada, by Province 5-5 Figure 5-2 Forecast of Canadian Diesel Fuel Demand 5-5 Figure 5-3 Regional Markets for Biodiesel Plants in Western Canada 5-6 Figure 5-4 Regional Market of ADM s Biodiesel Plant in North Dakota 5-7 Figure 5-5 Local Markets of Biodiesel Plants in Western Canada 5-8 Figure 5-6 Historical Diesel Fuel Prices for Selected Canadian Municipalities 5-9 Figure 5-7 Statistics Canada s Consumer Price Index for Energy 5-11 Figure 6-1 US Glycerol Production 6-2 Figure 6-2 US Production and Demand of Refined Glycerine 6-3 Figure 6-3 US Refined Glycerine Prices 6-4 Figure 6-4 Historical Prices of Refined Glycerine in the U.S. and Europe 6-5 Figure 6-5 Near-Term Price Trends for Vegetable-Oil based Glycerol 6-5 Figure 6-6 Board Crush Margins for Oilseeds in Canada 6-7 Figure 7-1 Conventional Biodiesel Production Process 7-2 Figure 9-1 Projected Annual ROI for a 151 MMLY Biodiesel Plant 9-6 Figure 9-2 Projected Annual ROI for a 227 MMLY Biodiesel Plant 9-6 Figure 9-3 Projected Annual ROI for a 303 MMLY Biodiesel Plant 9-7 Figure 9-4(a) Sensitivity to the Price of Canola Large Plants 9-12 Figure 9-4(b) Sensitivity to the Price of Canola Small Plants 9-12 Figure 9-5(a) Project Sensitivity to the Selling Price of Biodiesel Large Plants 9-13 Figure 9-5(b) Project Sensitivity to the Selling Price of Biodiesel Small Plants 9-13 Figure 9-6(a) Project Sensitivity to the Selling Price of Glycerol Large Plants 9-14 Figure 9-6(b) Project Sensitivity to the Selling Price of Glycerol Small Plants 9-14 Figure 9-7(a) Project Sensitivity to the Capital Cost Estimate Large Plants 9-15 Figure 9-7(b) Project Sensitivity to the Capital Cost Estimate Small Plants 9-15 Figure 9-8(a) Project Sensitivity to the Protein Meal Price Large Plants 9-16 Figure 9-8(b) Project Sensitivity to the Protein Meal Price Small Plants 9-16 Figure 9-9(a) Sensitivity to the Price of Natural Gas Large Plants 9-17 Figure 9-9(b) Sensitivity to the Price of Natural Gas Small Plants 9-17 Figure 9-10(a) Sensitivity to the Price of Electricity Large Plants 9-18 Figure 9-10(b) Sensitivity to the Price of Electricity Small Plants 9-18 Figure 10-1 Summary of Economic Impacts of Biodiesel Production from Canola Figure 10-2 Annual Impact of a Renewable Fuels Standard on Farm Payments Figure 10-3 Impact of a Renewable Fuels Standard on Direct Tax Revenues Figure 10-4 Effect of a Renewable Fuels Standard on Employment Figure 11-1 Profitability of Soy-Based Biodiesel Operations 11-4 BBI BIOFUELS CANADA vii 7/10/2006
9 I. EXECUTIVE SUMMARY Summary Discussion The Canola Council of Canada has retained BBI BIOFUELS CANADA (BBI) to conduct an economic impact analysis assessing the feasibility of establishing a canola-based biodiesel industry in Canada (the Project ). Based on extensive research and financial analysis, BBI has concluded that a canolabased biodiesel industry could be viable based on historical feedstock prices, provided that the price of biodiesel exceeds cents per litre. Under such a scenario, the average return on investment across the plants comprising the industry would be 26 to 28% annually. The aforementioned biodiesel prices exceed the 3-year historical wholesale price for biodiesel by 8 to 12 cents per litre, and thus, a biodiesel price of 72 to 75 cents per litre would be contingent on sustained high prices of petroleum diesel, or government incentives, to ensure the continued economic viability of the industry. Based on a conservative analysis of the historical production of canola, a feedstock resource base exists to support 800 MMLY of biodiesel production; however, if the record high canola production in 2005 is maintained, and the additional production is dedicated to biodiesel, 2100 MMLY of biodiesel could be produced. This is sufficient to supply approximately 90% of the biodiesel required under a 10% renewable fuels standard (RFS). Current crushing operations in Canada are at capacity, and thus, additional crush capacity is required if a canola-based biodiesel industry is developed. Consequently, each of the biodiesel facilities discussed below is based on an integrated crush-biodiesel operation. each plant would source oil from local producers and/or elevators; the crude oil would be directly to biodiesel production, while the plant would also market the canola meal generated from the crushing operation. Figure 1-1 summarizes the financial impact of a RFS, at a 2%, 5%, and 10% level, considering capital investment, annual plant income and expenses, and payments to canola producers and companies that sell seed, fertilizer and herbicides. Also shown are the additional RIMS II economic impacts, both during the construction phase as a multiplier on capital investment, and during operation, as a multiplier on plant expenditures. As shown in Figure 1-1, under the various RFS scenarios, projected annual payments to canola producers will range from $366 MM for a 2% RFS to $1.7 billion for a 10% RFS. The resulting basis increase of $15/tonne will lead to an incremental increase in farm income compared to historical canola prices; this incremental increase will range from $15 MM under a 2% RFS, to $68MM under a 10% RFS. Furthermore, compared to 2005, when prices averaged $288/tonne, a canola price of $368/tonne would increase farm income by $80MM based on canola production under a 2% RFS, by $229 MM under the 5% RFS scenario, and by $300 MM under a 10% RFS scenario BBI Biofuels Canada 1-1 7/10/2006
10 Figure 1-1: Summary of Economic Impacts of Biodiesel Production from Canola Economic Impact of Biodiesel Production from Canola % RFS MMLY 5% RFS MMLY 10% RFS MMLY 1700 Millions of Dollars Capital Investment Capital Investment RIMS II Multiplier Annual Plant Income Annual Plant Expenses Payments to Canola Producers Payments to Seed Suppliers Payments to Fertilizer Suppliers Payments to herbicide suppliers Additional RIMS II economic impact Results of Site Assessment BBI evaluated three site scenarios for canola-based biodiesel production. The first, based on a typical 80 km radius feedstock draw zone, would require 22 plants ranging in scale from 19 to 114 MMLY. This scenario could supply 100% of a 5%RFS. However, these plants are too small to capture the economies of scale necessary for a financially-viable industry, and thus, this option is not recommended. The second scenario was based on historical canola production, and expanding the feedstock collection zone to a 150 km radius around each plant. In this scenario, nine plants would be constructed, including two at 78 MMLY, one at 114 MMLY, three at 151 MMLY, two at 190 MMLY, and one at 227 MMLY. Of this total, 3 plants (380 MMLY) would be in Alberta, 1 plant (152 MMLY) would be in Manitoba, and 5 plants (800 MMLY) would be in Saskatchewan. This scenario could supply >100% of a 5% RFS. BBI Biofuels Canada 1-2 7/10/2006
11 An interim scenario involves the adoption of a 2% RFS, as a stepping stone towards a 5% or 10% RFS. The interim 2% RFS could be satisfied by construction of a single 151 MMLY plant in each of the Prairie Provinces, using the plant scales and 150 km feedstock draw zones identified for the 5% RFS case described above. The final scenario is an extension of the second, but is based on the 2005 canola production levels. This results in the same number of plants as Scenario #2, but each is of larger scale, ranging from 114 to 303 MMLY. This last scenario can satisfy 90% of a 10% RFS. Results of Feedstock Assessment The feedstock supply assessment indicates there is sufficient feedstock to support a number of canola-based biodiesel production facilities in western Canada. Using only 35% of the historical average annual production would produce about 800 million litres of biodiesel. However, if production is sustained at (or expand beyond) the record 2005 levels, sufficient canola would be available to produce ~2.1 billion litres of biodiesel per year. Improvements in canola yield due to hybrid technology, increased oil yields due to improved oil content and additional acreage for the crop due to rotational opportunities are expected to increase canola production to 13 to 14 million tonnes by 2015, and thus, there would unquestionably be sufficient canola to support a renewable fuels standard. If canola-based biodiesel facilities are constructed to their full potential capacity of ~ 2.1 billion L/y, their biodiesel production would be about four times greater than the regional market capacity for a B5 blend, and is, in fact, almost double the total Canadian market for a B5 blend. Thus, development of a canola-based biodiesel industry is likely to be incremental, increasing in tandem with increased market demand and/or mandates. Alternatively, facilities can be constructed with a view on U.S. markets, although large biofuels facilities in North Dakota and Washington will also provide significant competition for regional markets. Over 85% of the biodiesel produced in Manitoba and Saskatchewan would be exported outside the province if market penetration was limited to a B5 blend; similarly, Alberta production would be ~ 75% of the total B5 market in Alberta and BC, and thus, production in Saskatchewan will likely be destined for these markets. Thus, interprovincial and international trade will be a critical aspect of a canolabased biodiesel industry. Historical canola prices have ranged from $290 to $440/tonne (WCE data), with a fiveyear average of $353/tonne ($8.02/bu), and a ten-year average of $372/tonne ($8.45/bu). The financial analyses were based on canola price of $368/tonne ($8.37/bu), which includes a basis adjustment of $15/tonne beyond the 5-yr average price. Product and By-product Markets Biodiesel selling prices are based on the wholesale price for diesel, plus the value of federal and provincial tax exemptions. On this basis, and in the absence of any provincial tax exemptions, the sales price for biodiesel over the past three years would have BBI Biofuels Canada 1-3 7/10/2006
12 averaged 58 cents per litre. If Alberta and Saskatchewan join Manitoba in granting road tax exemptions to biodiesel, the biodiesel selling price would increase to greater than 66 cents per litre, based on the 3-year historical average. As noted above, this is still insufficient for an economically viable biodiesel industry. If 2005 prices for petroleum diesel are sustained, biodiesel could be sold for 72 to 75 cents/l, after including excise and road tax exemptions. A biodiesel industry is economically viable at this price level. There is currently a glut of glycerine on the market, a situation that will only get worse as new biodiesel facilities come on line, resulting in significant downward pressure on glycerol pricing. Based on current market prices for glycerol, BBI recommends that biodiesel producers do not include glycerol refining in their process design, and focus solely on the sale of crude glycerol. By mid-2005, food grade tallow-derived refined glycerol was valued at C$910-$1150/tonne and food grade vegetable-derived refined glycerol was valued at C$1050-$1350/tonne. Historically, the price of crude glycerol has been ~45% less than that of refined glycerol. The economics analysis is based on a price of $495/tonne for the crude glycerol. Significant quantities of canola meal will be produced by the proposed integrated crushbiodiesel facilities. For each 100 MMLY of biodiesel production, 150,000 tonnes of canola meal will be produced, and will have to be sold into an increasingly competitive market for protein meals. Although the historical 10-year average price for canola meal is $198/tonne, the financial analysis has used an average price of $181/tonne, to account for increased transport costs to sell canola meal in export markets, and downward price pressure from increased production of protein meals in general. Individual Plant Economics and Sensitivity Analyses The financial analysis has demonstrated that a canola-based biodiesel industry can be viable, IF canola prices remain at or near historical levels ($368/tonne), and IF the selling price of biodiesel is at least 72 cents/l, preferably greater than 75 cents/l. Based on current wholesale prices for biodiesel, this price can only be achieved if Alberta and Saskatchewan extend their road tax exemption to all biofuels (currently, the exemption only applies to ethanol). Sensitivity analyses have shown that the viability of a canola-based biodiesel industry depends most upon the price of biodiesel and canola, but other factors are important, including the price of the glycerine and canola-meal byproducts, and plant capital cost. A 114 MMLY plant could tolerate a sustained 12% drop in canola meal prices (i.e., to ~$160/tonne) before its ROI would be negative, while a 151 MMLY plant could tolerate a canola meal price reduction to ~$145/tonne before posting negative returns. A 227 MMLY plant is more resilient, and would only produce negative returns if the canola meal price dropped 30% (below $128/tonne), while an 303 MMLY plant is able to tolerate a 34% crop in price, to $121/tonne. BBI Biofuels Canada 1-4 7/10/2006
13 A 60% reduction in the price of glycerol (to ~$220/tonne) would reduce the ROI, but plants would still have a positive return on investment, ranging from 7 to 14% for 151 to 303 MMLY plants. However, at this price, a 78 MMLY (20 MMGPY) plant would post negative returns. Nonetheless, while the price of glycerol is important, facilities would have some resiliency against further depression in glycerol prices, because glycerol becomes a viable alternative to various petroleum-based products at these low prices. Plant capital cost is an important parameter, and influences ROI through its impact on debt servicing costs. However, it is not the over-riding factor that influences the viability of a plant. Government assistance in the form of a capital co-payment alone is not sufficient to ensure the viability of a canola-based biodiesel industry if biodiesel prices remain at 66 cents per litre, which is the level projected based on 2005 wholesale prices plus the Federal excise tax exemption. Biodiesel prices must increase beyond their 2005 prices, and/or some form of Provincial road tax exemption must be in place in order for a capital co-payment scheme to have a meaningful impact. Need for Incentives There are two key drivers that justify the need for incentives. In the first, the goal is to ensure the economic viability or profitability of the plants. In the second, the goal is to provide a competitive environment for investment, and attract business that might otherwise locate in another jurisdiction. The financial analysis has demonstrated that a 4 cent/l federal excise tax exemption alone is not sufficient to sustain a canola-based biodiesel industry if the biodiesel selling price is 66 cents/l, and if the price of canola is $368/tonne. However, extension of the provincial road tax exemption to include biodiesel as well as ethanol would lead to biodiesel selling prices of 72 to 75 cents per litre, which would lead to an overall return on investment of 26 to 28%, sufficient to sustain the industry. However, this alone may not be sufficient to attract significant investment. The current U.S. incentive of US$1/USG (29 cents/l) for biodiesel produced from virgin oils implies annual financial returns approaching 80 to 100%; it is clear that, in the absence of Canadian incentives, corporate partners in a biodiesel industry would invest in a U.S. based plant. Consequently, additional incentives approaching 25 cents/l may be necessary to level the playing field for investment, accounting for the U.S. Federal incentive program. Even Greater incentives may be required to counteract additional incentives at the state level. Comparison to U.S. Oilseed-based Biodiesel Facilities U.S. based canola facilities will face significant competition for locally-grown canola, and will need to rely on imported canola, which will drive up the local basis and lead to higher transportation costs. In the absence of any subsidies, the resulting higher plantgate feedstock costs should render such facilities less competitive than biodiesel plants located within prime canola-producing regions of Canada. At current diesel prices, with the $1/USG subsidy in place, a large scale (> 80 MMGPY) biodiesel facility in the U.S. BBI Biofuels Canada 1-5 7/10/2006
14 would have an 11 year average ROI ranging from ~80 to 100%, depending upon feedstock costs. For comparison, an equivalent subsidy provided to a plant based in Canada would lead to an ROI of 107% based on historical wholesale diesel prices, or 129% based on 2005 diesel prices. Clearly, the competitive advantage of a U.S.-based plant is derived entirely from the subsidy provided by the U.S. Government. Economic Impacts Economic impact data are based on a canola purchase price of $368/tonne, and a biodiesel purchase price of 75 cents/l for a 2% or 5% RFS, and 72.6 cents/l for a 10% RFS. Based on these prices, the industry-wide ROI would be 30% for a 2% RFS, 28% for a 5% RFS (due to some smaller scale plants), and 26% for a 10% RFS (this increases to 32% for a biodiesel price of 75 cents/l). The scenario for a 2% RFS is based on three 151 MMLY plants. The 5% RFS scenario is based on 9 plants, these plants would supply >100% of a 5% RFS. The 10% RFS scenario is also based on 9 (larger scale) plants, with canola-derived biodiesel accounting for 90% of a 10% RFS. Each plant would operate as an integrated crush-biodiesel facility. Capital Investment The capital investment for the three plants to satisfy a 2% RFS would be $209 MM, increasing to $620 MM for plants under a 5% RFS, and $840 MM for the larger scale plants under a 10% RFS. RIMS II Multipliers on capital investment indicate a further $440 MM in economic activity under a 2% RFS, impacting ~6,300 jobs during the construction phase. These values increase to $$1.3 billion and 18,000 jobs under a 5% RFS, and $1.7 billion in additional economic activity and 25,000 jobs impacted under a 10% RFS. Plant Revenues and Expenditures Plant revenues would range from $446 MM for plants under a 2% RFS, to $1.36 billion under a 5% RFS, to $2.1 billion under a 10% RFS. Approximately 70% of these revenues are derived from biodiesel. Approximately 90% of the plants expenditures are for feedstock i.e., payments to canola producers. Total expenditures range from $402 MM under a 2% RFS, to $1.12 billion under the 5% RFS scenario, to $1.8 billion under a 10% RFS. Impact on Farm Income Based on a canola price of $368/tonne, farmers would receive $366 MM to supply canola for a 2% RFS, increasing to $1.1 billion under a 5% RFS and $1.7 billion under a 10% RFS. Compared to historical average prices for canola ($353/tonne), this represents an incremental increase in farm income of $15 MM to $68 MM. Compared to canola prices in 2005 ($288/tonne), a 2% RFS would increase farmer income by $80 MM under a 2% RFS, $229 MM under the 5% RFS scenario, and $300 MM under a 10% RFS. BBI Biofuels Canada 1-6 7/10/2006
15 Employment The total direct employment in biodiesel facilities supporting a 2% RFS is 69 people (Figure 1-2), including administrative/managerial staff, production labour, and maintenance staff, with an average annual salary near $47,000. The federal government would receive $6.5 MM in direct tax revenues (corporate and employment), and an additional $5.8 MM in provincial and municipal taxes would be generated. These values do not include taxes from indirect employment. Under a 5% RFS, direct employment during operation would total 170 people. Direct federal tax revenues (corporate and employment) would total $18.6 MM, and an additional $16.5 MM in provincial and municipal taxes would be generated. Under a 10% RFS, direct employment during operation would total 268 people. Direct federal tax revenues (corporate and employment) would total $23.8 MM, and an additional $21.3 MM in provincial and municipal taxes would be generated annually. Figure 1-2: Effect of a Renewable Fuels Standard on Employment Effect of RFS on Direct and Indirect Employment Number of Jobs % RFS MMLY 5% RFS MMLY 10% RFS MMLY Direct Employment Indirect Employment Spin-off Activity Significant spin-off activity will be generated by biodiesel facilities under a renewable fuels standard. Payments to seed, fertilizer and herbicide suppliers can be directly attributed to canola grown to supply biodiesel facilities; these values range from $150 MM under a 2% RFS, to BBI Biofuels Canada 1-7 7/10/2006
16 $680 MM under a 10% RFS. Revenues earned by transportation, grain handling and product marketing organizations would be $17 MM for the three plants under a 2% RFS, increasing to $60 MM under a 5% RFS, and $80 MM under a 10% RFS. RIMS II multipliers indicate that during plant operation, a further 96 cents of overall economic activity will be created for each dollar of operating expenditures, and approximately 10 jobs would be indirectly impacted for each $1 MM in operating expenditures in the biofuels industry. For the three plants under a 2% RFS, this corresponds to an additional $380 MM of economic activity over and above the $400 MM in direct operating expenditures, indirectly impacting 4,000 jobs (Figure 1-2). The biodiesel plants serving a 5% RFS would generate an additional $1.1 billion in economic activity, indirectly impacting 12,000 jobs. Under a 10% RFS, $1.7 billion in economic activity would be generated in addition to the $1.8 billion in annual plant expenditures, impacting another 18,000 jobs outside the biofuels plants. BBI Biofuels Canada 1-8 7/10/2006
17 II. PROJECT OVERVIEW Introduction The biodiesel industry in North America is at a crossroads, and the next decade will determine if the biodiesel industry will embark on a major expansion that will allow it to make significant contributions to rural economic development, improvements in urban air quality, and the energy security of our country. Public support for renewable fuels has never been stronger. Political support for renewable biofuels is also growing. The Canola Council of Canada retained BBI Biofuels Canada (BBI) to conduct a study assessing the Economic Impact of establishing a network biodiesel production facilities Canada, using canola as a feedstock (the Project ). The Economic Impact Study includes an assessment of candidate sites, feedstock assessments, biodiesel and co-product market analyses, preliminary cost estimates, and financial analysis, both at the plant level, and at a macroscopic level, to demonstrate the economic impact of a canolabased biodiesel industry. The goal of the study is to establish the viability and economic impact of canola-based biodiesel facilities at various scales, documenting the underlying assumptions with historical data, cost estimates, projections and market analyses. As required, the need for and impact of various initiatives to support a canola-based biodiesel industry will be explored. Scope of Work This study will be a detailed analysis designed to assess the viability and economic impact of a canola-based biodiesel industry in Canada; the final report can be utilized as a presentation tool and documentation for government officials, industry participants, and potential investors in the project. Various regions will be evaluated as potential biodiesel production facility sites. The potential production capacity will be determined based on the available feedstock and modeled accordingly. The Study will address the following tasks and the final report will follow the attached outline. 1. A project kickoff conference call will be held to provide an overview of the Economic Impact study, scope of work and review any special or unusual aspects of the proposed project. 2. A review and assessment of typical sites for a biodiesel plant. General considerations regarding the availability and cost of transportation, utilities, water, land, labour and wastewater treatment for the various regions will be discussed. The advantages and cost impacts of locating the plant near commodity production versus locating the plant near markets will be determined. 3. An analysis of the availability and cost of local oilseeds and purchased/transported oil feedstocks for biodiesel production. The analysis will include historical pricing and production as available. BBI Biofuels Canada 2-1 7/10/2006
18 4. A review of biodiesel markets, existing and potential, and export opportunities that can be competitively served from the Project site. The review will include historic national and provincial level petroleum-diesel prices for the past 10 years. The review will include a review of federal, provincial, and local incentive policies for biodiesel production; these will be compared to incentives in adjoining jurisdictions. To the extent possible, biodiesel prices in the project area and region will be documented. 5. A review of the coproducts of biodiesel production, their markets and the general feasibility of servicing those markets. Coproducts may include oilseed meal and refined and crude glycerin. 6. A review of biodiesel production technology, the companies that provide plant designs and a breakdown of capital costs for the biodiesel plant production scenarios. The capital cost estimates will be based on quotes from equipment manufacturers and biodiesel engineering design companies. The capital cost estimates will have an accuracy of +/- 30%. Working capital will be estimated based on required inventories and cash reserves required by lenders to maintain adequate debt coverage ratios. Fixed and variables costs will be determined for feedstock costs, chemicals, natural gas, electricity, water, production labor, maintenance and administrative and overhead costs. Plant inputs, outputs and labor requirements will be determined. Capital and fixed and variable costs will be adjusted for relevant Project scenarios; comments on ownership structures, partnerships and necessary external support will be included. 7. Contractor will use its proprietary financial model to evaluate the proposed biodiesel initiative. A 10-year proforma balance sheet, income statement and cash flow statement will be produced for each Project scenario. Return on Investment (ROI) and Internal Rate of Return (IRR) will be used to assess the Project. The operating forecast will be accompanied by a summary of the significant assumptions as to the operation of the plant and the costs associated with that operation. 8. A sensitivity study will be performed for all major project variables and cash flow breakeven prices for oilseeds, vegetable oil and biodiesel will be determined. The sensitivity study will determine the financial impact of the following project variables: Biodiesel price Feedstock price Glycerine price Natural gas price Electricity price Capital cost of the biodiesel plant Applicable biofuels or agricultural tax credit/producer incentive In particular, a breakeven analysis and product pricing or external support required to sustain a financially viable industry will be documented. A comparison to U.S. incentives will be included, along with discussion regarding possible forms for incentive packages. This section will also include a baseline analysis to document the viability, without BBI Biofuels Canada 2-2 7/10/2006
19 incentives, of a canola-based biodiesel industry in Canada to a canola-based biodiesel industry in the Northern U.S. and a soy-based biodiesel industry in the U.S. 9. Impact of biodiesel facilities on economic activity in sectors directly and indirectly serving the industry will be evaluated, including growers, crushers, transportation services, and R&D. 10. Capacity requirements, number of plants and economic activity stemming from a proposed RFS; value creation arising from a biodiesel initiative, including employment, enhanced agricultural activity and income, and projected returns to the government through tax revenues 11. Provide a comprehensive report that documents all Project findings, data and assumptions. Summary and Recommendations will be provided including the identification of key issues and risks. 12. Meet with the client upon submission of the draft Economic Impact Study report. BBI will present the results, answer questions and subsequent to the meeting, revise the draft report to address Client s comments. Report Outline This Economic Impact study is organized according to the following outline: Executive Summary Project Overview and Scope of Work Site Assessment o Candidate Sites and Site Characteristics o Potential Environmental Impacts, Community Concerns o Production Scenarios and Relevant Sites Appraisal of Feedstock Availability and Price o Feedstock requirements for biodiesel production o Review of Candidate Oilseed Feedstocks Historical Worldwide Production Historical Canadian Production Canola supply, usage and distribution Regional Production Local Production and Disappearance Relation to production scenarios and sites Biodiesel Production Potential Feedstock Pricing o Overall Summary of Feedstock Assessment Review of Biodiesel Markets o National Market overview Current production and use Market potential BBI Biofuels Canada 2-3 7/10/2006
20 Historical use and projected growth Competition Diesel and biodiesel pricing Historical retail pricing for diesel Tax exemptions Projected biodiesel pricing o Summary of biodiesel markets Review of Co-Products o Quantities produced o Glycerol markets volume and price o Canola meal markets and price Overview of Biodiesel Production Technologies o Process description Conventional process BIOX process o Production inputs and outputs o Personnel requirements o Salaries and income taxes Capital and Operating Costs o Data and assumptions used in the financial analysis o Capital construction costs Financial Analysis individual plants o Effect of scale on ROI o Income statements o Breakeven analysis o Sensitivity Analysis o Section summary and analysis Economic Impact of a 2%, 5% and 10% RFS o Total plant revenues, employment, salaries and direct economic activity o Impact on farm prices and income o Municipal, Provincial and Federal tax revenues from a canola-based biodiesel industry o Spin-off Economic Activity o Impact on industries serving the biofuels industry and farming operations Comparison to U.S. oilseed-based Biodiesel industries (without subsidies) o ROI for canola facilities in Northern U.S. o ROI for soybean facilities Potential Ownership Structures Structural and Operational Chhallenges Summary and Recommendations Appendices BBI Biofuels Canada 2-4 7/10/2006
21 III. SITE CHARACTERISTICS Site Evaluation Criteria The criteria for a good biofuels plant site encompass many factors including proximity of feedstocks, good road and rail access, and access to required utilities. Other considerations include a qualified and/or trainable labor force, access to an airport, and the presence of essential community services like medical facilities. Weighted scores can be assigned based on desirable site attributes, including: Feedstock availability Road and rail transportation infrastructure at the site Utilities including electricity, natural gas, water supply and wastewater treatment Biodiesel and co-product market proximity Labor availability Community services such as welding, electrical shop, plumbing, schools, fire protection, hospital and airport Zoning and proximity to communities Some of these key features are discussed below, in contemplation of future construction of biofuels facilities that use canola. Feedstock Proximity The proximity of feedstock is a crucial component of the site evaluation and feasibility for a biodiesel plant. In general, a smaller feedstock collection radius is beneficial, because it implies greater access to feedstock and reduced transportation costs. Proximity to Communities Biofuels plants bring numerous benefits to communities, including job creation, adding value to local crops with diversified products, increased local tax revenues and significant economic development across the community. There are, however, potential negative impacts associated with such facilities as well, such as increased traffic volume, visual impacts, noise, and, in some cases, odors. While noise and odors from modern processing facilities are routinely dealt with using engineering controls and operating procedures, issues such as traffic and visual impacts on the community must be considered during site selection. Sites located in close proximity to a community or residential area will be less desirable than a site located in a more isolated area or with a buffer of undeveloped land between it and its neighbors. Transportation Access to Class A roads is a primary requirement for a biodiesel plant because feedstock is often delivered by truck and the product or co-products may be shipped to market by truck. Access to rail provides a second mode of transportation for receiving feedstock and shipping product to more distant markets. Access to rail is a distinct advantage over plant sites without rail access just as a site on a mainline rail line is better than a location on a short line rail line. Access to BBI Biofuels Canada 3-1 7/10/2006
22 two mainlines is a great advantage when it comes to negotiating transportation rates. Appendix A includes railway maps for the various jurisdictions and markets that may be served by canolabased biodiesel facilities. Electrical Service An integrated crush-biodiesel facility will require an average electrical energy input of 125,000 kwh per million litres of biodiesel production. Access to sufficient line voltage is required; an existing substation located close to the site is an advantage over a long interconnect or the need to build a new substation. Natural Gas Biodiesel production operations use natural gas to generate process steam and to power the evaporation and distillation operations for refining the value-added products. Natural gas use is typically about ~1,600 BTUs of thermal energy for each litre of biofuel produced. A site with an existing gas supply or an adjacent distribution main has an advantage over a greenfield site located far from an existing gas main. The availability of natural gas and the distance to the closest point to tie-in are important considerations. Water There are three basic sources of water used for biofuels plants: well water, municipal water and surface or river water. Most plants use well water because of their rural location. Over the long term, well water is often less expensive. Cost of drilling, water quality and long-term supply are important considerations when considering a new well. The second option as a water source is city water, which is considered a more reliable option for consistent supply and quality. With municipal or city water supply, special water conditioning systems are usually not required, reducing capital cost. Water requirements for a biodiesel plant include process water, steam makeup and cooling water. Wastewater Modern biofuels plants can be designed to be zero or near-zero wastewater effluent facilities. The availability of low-cost water discharge and treatment options must be considered in the plant design to optimize water usage within the plant and overall wastewater treatment costs for the project. By incorporating recycling and reuse, a biodiesel plant should produce no more than ~ 2 litres of process wastewater per litre of biodiesel product, although this number can vary considerably between plant designs. Almost all of the water to be discharged from a biodiesel plant is utility water from evaporative losses and blowdown operations. The blowdown water is typically very similar to the makeup water, but with an increase in the hardness. Cooling tower and boiler blowdown is typically discharged to a local sewer, to surface water with appropriate permits, or to an evaporation pond. For discharge to surface water or an evaporation pond, a permit for cooling tower and boiler blowdown discharge would be required. BBI Biofuels Canada 3-2 7/10/2006
23 Proximity to Product and Co-Product Markets A large local biodiesel market can provide a distinct advantage for a biofuels plant through lower transportation costs. The primary biodiesel markets for the project are discussed in detail later in this report. For purposes of the site evaluation, the biodiesel market proximity is reviewed briefly here. The target markets for biodiesel would be fleet (including buses), railroad, and marine operations throughout the region. Access to local blending/refining facilities is also considered. Approximately 20% of the incoming oil tonnage is converted into glycerol and soapstock. Furthermore, approximately 600 kg of protein meal will be generated per tonne of canola processed. Therefore, proximity to co-product markets is important. Labor Availability A combined crush-biodiesel operation will require approximately 15 to 40 employees, depending upon the scale of the operation. The exact number of employees can vary depending upon the plant design and operating plan. The area within 50 km of the site should easily be able to supply the labor for the biodiesel plant operations. Specialty positions such as the plant manager or lab supervisor may have to be recruited from greater distances. Community Services Community services within 15 km of the processing plant site are important to provide quick response to the needs of the plant and to attract and retain top employees. Desirable community services include electrical maintenance, machine shop, welding, plumbing, hospital, airport, good schools and fire protection. Candidate Sites Various sites in western Canada can satisfy the aforementioned requirements for biodiesel operations. Based on historical feedstock availability, likely product markets and transportation access, two different biodiesel production scenarios were examined: 1) The first scenario is based on a typical 80km radius feedstock draw zone, which leads to 22 plants across the prairie provinces (Figure 3-1). Three of these are 5 MMGPY (19 MMLY) plants, seven are at the 10 MMGPY (38 MMLY) scale, eleven are 20 MMGPY (78 MMLY), and one 30 MMGPY (114 MMLY) plant is located in north-central Saskatchewan. Overall, four plants with 55 MMGPY (208 MMLY) of production would be located in Manitoba, eleven plants with 175 MMGPY (660 MMLY) of production would be located in Saskatchewan, and seven plants with 105 MMGPY (400 MMLY) of production would be located in Alberta. 2) The second scenario is aimed at a smaller number of large-scale plants, accomplished by expanding the feedstock collection zone to a 150 km radius around each plant (Figure 3-2). In this scenario, nine plants would be constructed, including two at 20 MMGPY BBI Biofuels Canada 3-3 7/10/2006
24 (78 MMLY), one at 30 MMGPY (114 MMLY), three at 40 MMGPY (152 MMLY), two at 50 MMGPY (190 MMLY), and one at 60 MMGPY (228 MMLY). Of this total, 100 MMGPY (380 MMLY) would be in Alberta (3 plants), 40 MMGPY (152 MMLY) would be in Manitoba (1 plant), and 210 MMGPY (800 MMLY) would be in Saskatchewan (5 plants). Two of the plants in Saskatchewan would draw on feedstock grown in western Manitoba. Further details regarding available feedstock and the justification for the scale of each plant illustrated in Figures 3-1 and 3-2 are provided in Section IV Feedstock Analysis. The plant scales shown in Figures 3-1 and 3-2 could be significantly expanded based in 2005 production levels and future plans to expand canola production. Further discussion on this issue is included in Section IV. BBI Biofuels Canada 3-4 7/10/2006
25 Figure 3-1: Small Scale Production Scenario Red circles = 5 MMGPY plants; Green circles = 10 MMGPY plants; Blue circles = 20 MMGPY plants; Black circles = 30 MMGPY plants Each plant is based on an ~80km feedstock radius (except the plant in SW Saskatchewan, which is 120km, and the Melville plant, which is 60 km) Existing crush facilities are indicated with red squares, circles or triangles (depending on company) BBI Biofuels Canada 3-5 7/10/2006
26 Figure 3-2: Large Scale Production Scenario Green Circles = 20 MMGPY Plants; Red Circles = 30 MMGPY Plants; Black circles = 40 MMGPY plants; Blue circles = 50 MMGPY plants; Purple circles = 60 MMGPY Plants (see numbers at centre) Each circle represents a 150 km radius (except the plant near Lanigan, SK, which is based on an 80km radius) Existing crush facilities are indicated with red squares, circles or triangles (depending on company) BBI Biofuels Canada 3-6 7/10/2006
27 IV. FEEDSTOCK AVAILABILITY AND PRICE This section summarizes the availability, cost, current production and potential future production of canola in Canada. For the purpose of this analysis, the feedstock production and yields will be analyzed in each of the Canada s Prairie Provinces, including, where available, data for individual census regions in each province. Such data serve as the basis for the biodiesel sites identified in section III of the report. Feedstock Requirements To evaluate the feedstock supply requirements for the proposed plant project, the production requirements must be established. There are two basic production units to consider: crushing and oil extraction, and crude oil refining into biodiesel. Oilseed crops generate a yield of oilseeds per acre, usually reported as pounds, tons or bushels/acre. Average yields of the major oilseeds in Canada over the last 5 years are shown in Table 4-1. Table 4-1 Yield of Major Oilseed Crops in Canada, Oilseed Crop harvested area 000 ha t/ha Canola Seed Flax Seed Soybeans Total Oilseeds (Source: Agriculture and Agri-Food Canada) Table 4-2 presents typical yields of oil per hectare for Canadian oilseed crops. Table Typical Oilseed Yields in Canada Crop t/ha t oil/ha L/ha Canola Seed Flax Seed Soybeans Total Oilseeds (Source: Agriculture and Agri-Food Canada) As illustrated in Tables 4-1 and 4-2, canola is the dominant oilseed produced in Canada, and, owing to its higher oil content (~42% by wt), its oil yield per hectare is also much greater than other oilseed crops, in spite of the fact that its yield of seed on a tonnes per hectare basis is lower than that of soybeans. BBI Biofuels Canada 4-1 7/10/2006
28 In addition to the oilseed crop yield, there is a process yield for the refined value-added product. In the case of crude oil from oilseeds, the yield of biodiesel is about 90% of the crude feedstock oil depending on the process design. Table 4-3 shows the approximate requirements for biodiesel production from several different types of feedstock oil. Table 4-3 Biodiesel Production Requirements from Various Feedstocks Feedstock MM L/y Canola mechanical press tonnes (000s) Canola solvent extracted tonnes (000s) Crude oilseed oil Liters (millions) tonnes (000s) Recycled fats & greases tonnes (000s) Table 4-4 shows the production parameters for several scales of biodiesel production from canola and degummed canola oil obtained via solvent extraction, assuming an average oil content of 42%. Table 4-5 shows similar data for biodiesel production from canola seed and degummed canola oil obtained via mechanical extraction. Table 4-4 Feedstock Requirements for Biodiesel Production (Solvent Extraction) Biodiesel Capacity (MM L/yr) Canola Oil Required (MM L/yr) Canola Oil Required (000 tonnes/yr) Canola required (000 tonnes/yr) Canola required (MM bu/yr) Harvested Area Required (000 ha/yr) Table Feedstock Requirements for Biodiesel Production (Mechanical Extraction) Biodiesel Capacity MM LPY Canola Oil Required (MM L/yr) Canola Oil Required (000 tonnes/yr) Canola required (000 tonnes/yr) Canola required (MM bu/yr) Harvested Area Required (000 ha/yr) BBI Biofuels Canada 4-2 7/10/2006
, 2006), and rapeseed and canola")
29 World Oilseed Industry Overview World oilseed production in 2003 was 350 million metric tons. Forecast production for is 380 million tonnes, with soybeans contributing 217 million tonnes to the total (Agriculture and Agri-Food Canada, vol 19(1), 2006), and rapeseed and canola contributing 27 million tonnes. In recent years, soybeans have represented over 57% of total world oilseed production, followed by cottonseed, peanuts, sunflowerseed and rapeseed, each representing about 10% of the world total. (World rapeseed data includes canola.) Oilseed production is dominated by the US, China and Brazil. Other major producers include Argentina, the EU, the states of the former Soviet Union, and India. Minor producers are Canada, Eastern Europe, Paraguay, and South Africa. In Canada, canola is the dominant oilseed, representing 85% of Canadian oilseed production. Table 4-6 shows the distribution of major oilseed crop production around the world for 2003, and Figure 4-1 shows the historical worldwide production of vegetable oils, with projections up to Table 4-6 Major Oilseed Producing Nations in 2003 Crop China EU Brazil India FSU-12 Argentina Canada USA Rape & Canola Sunflower Soy Flax Cottonseeds Peanuts (Source: 2004 Soya & Oilseed Yearbook, Figure 4-1 Worldwide Production of Vegetable Oils BBI Biofuels Canada 4-3 7/10/2006
30 Summary of Oilseed Production in Canada. Canola is the primary oilseed crop in Canada, representing about 85% of the total oilseed production (mass basis). Soybeans and flax represent about 9% and 6% of the total Canadian oilseed production, respectively. Almost all of the canola production is located in western Canada, whereas almost all of the soybean production is in Eastern Canada, mainly in Ontario. Canola Supply Analysis Historic field crop production trends for the region were assessed based on data obtained from Agriculture and Agri-Food Canada. Local canola availability is determined by three factors, production, disappearance, and carry over. Production is the amount of canola produced each year. These data are readily available from Agriculture and Agri-Food Canada. Disappearance is an expression of canola use. For canola, there are three major categories for disappearance, crush (production of meal and oil), seed and residual, and export. The local canola that is not crushed or used on farm as seed and residual are known as exportable canola. Exportable canola is generally considered available for new uses in the local area. Carry over is the amount of canola from the previous year that remains at the start of the new crop year. Carry over stocks are determined by both on farm and off farm storage, and the demand for canola. Canadian canola supply and distribution is summarized in Table 4-7. National Production In 2005, a record 9,660,000 tonnes of canola was harvested in Canada, a 45% increase compared to the average production over the previous 6 years. Of this, million tonnes were produced in Saskatchewan, million tonnes were produced in Alberta, and million tonnes were produced in Manitoba. All of these values were above historical averages. This trend is expected to continue improvements in canola yield due to hybrid technology, increased oil yields due to improved oil content and additional acreage for the crop due to rotational opportunities are expected to increase canola production to 13 to 14 million tonnes by The record production in 2005 was due to a combination of factors the area seeded was 15% greater than the historical average, but more significantly, yields were 28 to 42% greater than historical averages in B.C., Alberta, and Saskatchewan, although 14% lower than average in Manitoba. As with all crops, it is best not to focus on one year s information because of the volatility in weather, pathogens, and pest. For example, while 2004 and 2005 had a BBI Biofuels Canada 4-4 7/10/2006
31 higher than average per hectare yield, in 2002, the lowest per acre yield since the 1990 growing season was observed. This variability is the reason why averages are used for crop production data. For this analysis, a multi-year average will be used for production information. The multi-year-year average removes some of the variability created by weather and encompasses a period of time with consistent federal agriculture policy. Table 4-7: Canadian Canola supply and distribution Crop year / / / / / /05 6-year average CANOLA SUPPLY Hectares harvested, 000s 13,750 12,007 9,353 8,965 11,587 12,202 11,311 Beginning stocks ,157 1,088 1, ,097 Production 8,798 7,205 5,017 4,520 6,771 7,728 6,673 Imports Total supply 9,555 9,586 6,331 5,960 7,908 8,445 7,964 CANOLA USAGE Crush ,823 Exports ,471 Seed Other Total usage 7,395 8,483 5,124 5,061 7,295 6,810 6,695 Carry-out stocks 2,157 1,088 1, ,635 1, Crop year is September through August 2. Stock and supply data are in thousands of tonnes 3. Includes food, waste, and dockage Source: Statistics Canada and Agriculture and Agrifoods Canada On a national level, the annual areas planted and harvested are fairly stable. Variability in annual production is primarily a result of variability in per hectare yield. This variability is generally weather or disease related. Nonetheless, the annual production of canola is more than adequate to meet Canadian needs for high protein animal feed and vegetable oils, evidenced by the fact that exports outpaced imports by a 17:1 margin. National Disappearance Over the six crop years prior to 2005, approximately 52% of the canola produced in Canada was exported, while 42% was crushed to produce high protein animal feed and oil, representing an average crush of 2.8 million tonnes. On farm use as seed and residual is the smallest contributor to disappearance at 34 thousand tonnes, or 0.5% of production. BBI Biofuels Canada 4-5 7/10/2006
32 National Carry Over The remaining annual canola production is classified as carried over to the next year. The national 6-year average for canola carry over has been 1.26 million tonnes, about 19% of production, or 16% of total supply. Carry over for is expected to be higher than the historical average due to the record harvest. The relatively high carry over observed for canola indicates that domestic and international markets are insufficient to satisfy current production. Storage or carry over of canola is the only recourse for producers when prices are low and demand is soft. Regional Production Historically, Saskatchewan has been the primary producer of canola in Canada, followed by Alberta and Manitoba. Saskatchewan accounts for about 42% of the canola produced in Canada, while Alberta and Manitoba contribute 33% and 23%, respectively. The 10- year production average in Saskatchewan is 2.8 million tonnes with a high of 4.6 million tonnes produced last year (Table 4-8). In Alberta, the 10-yr average is 2.2 million tonnes, with a high of 3.7 million tonnes in 2005, while in Manitoba, the 10-yr average is 1.5 million tonnes, with a high of 1.8 million tonnes in Year Yield (tonnes/acre) Table 4-8: Canola Production in Western Canada Saskatchewan Alberta Manitoba Production (MM tonnes) Yield (tonnes/acre) Production (MM tonnes) Yield (tonnes/acre) Production (MM tonnes) yr average yr average Production statistics for canola for each census region within each province are available from Statistics Canada, and from the 2001 Census of Agriculture. These data provide a picture of the regional distribution of canola production within each province, key for selecting potential sites for a biofuels plant. The 10-yr average canola production in each provincial census region is shown in Figures 4-2, 4-3, and 4-4. Canola production in Manitoba is primarily located in the southwest regions of the province. In Saskatchewan, there is significant production throughout the province, but with noticeably lower levels in regions south and west of Regina. Production in Alberta is primarily in the regions east of Highway 2, between Edmonton and Calgary, and in the Peace region. BBI Biofuels Canada 4-6 7/10/2006
33 Figure 4-2: Canola Production by Census Division in Alberta Crop production is shown in tonnes, highlighted in yellow BBI Biofuels Canada 4-7 7/10/2006
34 Figure 4-3: Canola Production by Census Division in Saskatchewan Crop production is shown in tonnes, highlighted in yellow BBI Biofuels Canada 4-8 7/10/2006
35 Figure 4-4: Canola Production by Census Division in Manitoba Crop production is shown in tonnes, highlighted in yellow BBI Biofuels Canada 4-9 7/10/2006
36 Local Production The local area is typically defined as an 80 km radius around each site, although occasionally, this is expanded to capture economies of scale, although this may increase feedstock costs due to greater shipping distances. In each case, the crop production data in Figures 4-2, 4-3, and 4-4 can be used as a guide regarding canola available in each local feedstock area, and thus, an appropriate scale for each plant. As discussed in Section III, two production scenarios are envisaged: 1) Plants constructed based on grain available within an 80 km radius. Twenty two plants are conceivable under this scenario, ranging in size from 5 to 30 MMGPY (19 to 114 MMLY), depending upon local crop harvest. Biodiesel plants based on this 80km radius are shown in Figure 4-5. If the availability of canola doubled, due to increased acres seeded, increased yields, and/or reduced exports, plant scales could range from 10 to 50 MMGPY (38 to 189 MMLY; Figure 4-6) 2) Plants constructed based on grain available within a 150 km radius. Under this scenario, nine plants may be constructed, ranging in size from 20 to 60 MMGPY (76 to 227 MMLY). Biodiesel plants based on this expanded feedstock collection zone are shown in Figure 4-7. If the availability of canola doubled, due to increased acres seeded, increased yields, and/or reduced exports, plant scales could range from 30 to 80 MMGPY (114 to 303 MMLY; Figure 4-8). Local Disappearance There are several crush facilities in Western Canada. Archer Daniels Midland has a facility in Lloydminster (represented by a red triangle on Figures 4-5 and 4-6). Bunge Canada has plants in Altona, MB, Harrowby, MB, Nipawin, SK, and Ft. Saskatchewan, AB (represented by red squares on Figure 4-5 and 4-6). Cargill has a crush facility in Clavet, SK (red circle), and Canbra has a plant in Lethbridge, AB (red flag). Associated Proteins also has a crush facility in Ste. Agathe, MB. These crush facilities are operating at ~ 90% of capacity, and thus, existing crush facilities cannot be relied upon to produce the additional oil required to produce biodiesel. Each canola-based biodiesel facility would therefore have to build a crush facility to process canola. The crush facility would not be as comprehensive as a typical crush facility, which includes refining and packaging operations to sell refined oils; these operations are not needed to produce the crude oils needed for biodiesel production. Two options for crushing are available mechanical extraction, or solvent-based extraction. The former is suitable at small scales, but mechanical oil extraction is much less efficient, thus necessitating the greater feedstock requirements outlined in Table 4-3. Plants based on solvent extraction have higher oil yields, and are generally more economically viable. Consequently, all economics calculations and utilization data are based on an integrated crush-biodiesel facility, whereby the crushing operations are based on solvent extraction. A significant implication of this arrangement is that each plant would also market canola BBI Biofuels Canada /10/2006
37 meal as a byproduct. Further discussion of canola meal pricing and markets is provided in section VI. About 70% of the canola produced is either exported or subject to carry over, a significant amount relative to the local production in each census region. This is the anticipated available oilseed feedstock base for a biodiesel facility. Many lending institutions feel that 50% or less of the exportable and carried over grain is available for new uses. Conservatively, we have assumed that only 35% of the historical local production is available for a biodiesel facility, i.e., the carryover stock plus approximately 15% of the exported canola. This is the basis for the plant scales identified in Figures 4-5 and 4-7. It is also notable that, except in the drought years, crush levels have remained quite stable, consistent with crush facilities operating at or near capacity. Thus, unless crush capacity is expanded, future growth in canola production will require either new export markets, or new uses, such as biodiesel. For example, the record-level production in 2005 exceeded the prior historical average by 44%; it is likely that much of this additional production could be used for biodiesel production. This additional production alone, if sustained, would support ~1.2 billion litres of additional annual biodiesel production. This additional production, plus production based on historical production levels and markets, leads to the plant scales illustrated in Figure 4-6 and 4-8. Cost of Canola The five year average cost for a tonne of canola is $353, increasing to $372 for a ten-year average (Table 4-9). These prices correspond to $8.45/bu and $8.02/bu, respectively. The price ranges from a low of $290/tonne in 2001 to a high of $440/tonne in Table 4-9 Historical CanolaPrices Price, Year C$/tonne yr avg yr avg BBI Biofuels Canada /10/2006
38 (Source: Statistics Canada Field Crop Reporting Series) Using the 5-year historical average for canola, plus a basis increase of $15 per tonne, the projected cost of canola used in the financial analysis is C$368 per tonne, or $8.37/bu. A sensitivity analysis is provided later in the report that demonstrates the effect of higher and lower feedstock prices on project economic performance. BBI Biofuels Canada /10/2006
 Existing crush facilities are")
39 Figure 4-5: Small Scale Biodiesel Production Scenario Historical Canola Production Levels Red circles = 5 MMGPY plants; Green circles = 10 MMGPY plants; Blue circles = 20 MMGPY plants; Black circles = 30 MMGPY plants Each plant is based on an ~80km feedstock radius (except the plant in SW Saskatchewan, which is 120km, and the Melville plant, which is 60 km) Existing crush facilities are indicated with red squares (Bunge), circles (Cargill), triangles (ADM), or flags (Canbra) BBI Biofuels Canada /10/2006
 Existing crush facilities are")
40 Figure 4-6: Small Scale Biodiesel Production Scenario Future Growth in Canola Production Red circles = 10 MMGPY plants; Green circles = 20 MMGPY plants; Blue circles = 30 MMGPY plants; Black circles = 50 MMGPY plants Each plant is based on an ~80km feedstock radius (except the plant in SW Saskatchewan, which is 120km, and the Melville plant, which is 60 km) Existing crush facilities are indicated with red squares (Bunge), circles (Cargill), triangles (ADM), or flags (Canbra) BBI Biofuels Canada /10/2006
 Each circle represents a 150 km radius (except the plant near Lanigan, SK, which is based on an 80km radius) Existing crush")
41 Figure 4-7: Large Scale Biodiesel Production Scenario Historical Canola Production Levels Green Circles = 20 MMGPY Plants; Red Circles = 30 MMGPY Plants; Black circles = 40 MMGPY plants; Blue circles = 50 MMGPY plants; Purple circles = 60 MMGPY Plants (see numbers at centre) Each circle represents a 150 km radius (except the plant near Lanigan, SK, which is based on an 80km radius) Existing crush facilities are indicated with red squares (Bunge), circles (Cargill), triangles (ADM), or flags (Canbra) BBI Biofuels Canada /10/2006
 Existing crush facilities are indicated with red squares (Bunge), circles (Cargill), triangles")
42 Figure 4-8: Large Scale Biodiesel Production Scenario Future Growth in Canola Production Blue circles = 80 MMGPY plants; Black circles = 30, 40, 50 or 60 MMGPY plants (see numbers at centre) Each circle represents a 150 km radius (except the plant near Lanigan, SK, which is based on an 80km radius) Existing crush facilities are indicated with red squares (Bunge), circles (Cargill), triangles (ADM), or flags (Canbra) BBI Biofuels Canada /10/2006
43 Conclusions for Feedstock The feedstock supply assessment indicates there is sufficient feedstock to support several canola-based biodiesel production facilities in western Canada. There is sufficient carryover and exported grain to support a biodiesel industry; using only 35% of the historical average annual production would produce about 800 million litres of biodiesel, approximately 70% of the total Canadian requirements for biodiesel based on a B5 blend. However, if production levels are sustained at 2005 levels (9.66 million tonnes), sufficient canola would be available to produce ~2.1 billion litres of biodiesel per year, or approximately double the total Canadian requirements for biodiesel based on a B5 blend. Further growth in biodiesel production is also possible, based on the projected increase in canola production to 13 to 14 million tonnes by Historical canola prices have ranged from $290 to $440/tonne, with a five-year average of $353/tonne ($8.02/bu), and a ten-year average of $372/tonne ($8.45/bu). The baseline financial analyses will used a canola price of $368/tonne ($8.37/bu), based on the fiveyear average canola price, plus a basis adjustment of $15/tonne. BBI Biofuels Canada /10/2006
44 V. REVIEW OF BIODIESEL MARKETS This section of the Economic Impact analysis assesses the biodiesel markets for biodiesel production facilities based on canola produced in Canada s Prairie Provinces. National Biodiesel Market Overview The emergence of the biodiesel market in the North America is subject to three principal drivers: Economic & National Security Environmental & Regulatory Legislative Economically, the drivers pushing the growing interest in biodiesel are the rising cost of petroleum diesel, the desire to stimulate rural economic development through valueadded agricultural applications, and the desire to reduce our dependence on fossil fuels. Environmentally, the benefits of biodiesel for pollution reduction are significant and well-documented. A report by Ainslie, Dowlatabadi et al. (Auto 21 NCE and Canola Council of Canada, 2006) used life cycle analyses to establish that canola-derived biodiesel can reduce greenhouse gas emissions by % per unit of petroleum diesel displaced. Biodiesel combustion produces less particulate matter, while reducing carbon monoxide and hydrocarbon emissions (Ainslie et al.; Levine, Canadian Bioenergy Corporation, 2006). In addition, biodiesel is a value-added agriculture-based product that is appropriate and available to meet the low-sulfur diesel requirements established by the Canadian Government. The Federal Government s Alternative Fuels Act (1995) specifies aggressive legislative targets for the use of alternative fuel vehicles by all federal government departments and agencies. Under the Act, federal government, departments and Crown Corporations must purchase alternative fuel vehicles, where they are cost-effective and operationally feasible. Although not a mandate, it does provide a clear market for alternative fuels if there is a demonstrable supply at competitive prices. A further legislative initiative arising from the Federal Government Climate Change Action Plan includes a production target of 500 million liters of biodiesel by Although summer Federal Climate Change Initiatives are under review, there is still conceptual support for a renewable fuels standard, which would likely cover both ethanol and biodiesel. Furthermore, funds have been allocated to support research and biodiesel pilot tests/demonstrations, and the Federal Government has also provided capital funding to support construction of selected commercial biodiesel plants in Canada. Historically, diesel fuel in Canada has had a comparatively high sulfur content, which precludes the use of catalytic converters for control of emissions. The regulatory changes mandating the introduction of ultra-low sulfur petroleum diesel by 2006 will have several BBI Biofuels Canada 5-1 7/10/2006
45 effects on the Canadian diesel market. First, low-sulfur petroleum diesel will have to be treated to enhance lubricity, already an issue with a large fraction of Canadian diesel fuel. Second, the process steps needed to remove the sulfur will increase production costs. Owing to the fact that biodiesel has a naturally high lubricity, it can serve as the lubricity additive necessary to compensate for the loss of lubricity when the sulfur is removed. The lubricity benefits associated with canola-derived biodiesel were clearly demonstrated in the Saskatoon Biobus research report (Munshaw and Hertz, 2006). Furthermore, the inevitable increase in production costs for low-sulfur diesel will help to make biodiesel more cost-competitive with petroleum diesel. Ultimately, these drivers have succeeded in elevating the interest in biodiesel across the country, as demonstrated by the current Economic Impact study. Biodiesel Production Capacity There are currently two commercial scale biodiesel plants operating in Canada, and there are several small pilot scale facilities in operation. Commercial scale plants include Biox in Hamilton, ON (60 million L/y) and Rothsay in Montreal (35 million L/y). The pilot scale facilities include the Innovation Place Bioprocessing Centre in Saskatoon, SK (30,000 L/day on a batch basis), and Ocean Nutrition Canada in Mulgrave, NS (6 MM L/y). National Biodiesel Use Biodiesel use in Canada has been fairly limited. Historically, biodiesel use has been primarily based on production from the existing pilot scale facilities, along with B100 fuel imported by rail tank car from the U.S. Midwest and blended with conventional diesel (usually as B10 or B20). With commercial scale plants coming online at Rothsay and Biox over the past 6 months, some growth in biodiesel use is anticipated. Canadian biodiesel distributors include UPI (Guelph, ON), Canada Clean Fuels (Toronto, ON), West Coast Reduction (Vancouver, BC), Canadian Bioenergy Corporation (Vancouver, BC), and Bio-Diesel Canada Inc (Toronto, ON) As reviewed earlier, biodiesel use to date has been driven by legislation and environmental compliance. Until recent provincial budgets in Ontario, British Columbia, and Manitoba granted exemptions from road taxes (14.3 cents/l, 15 cents/l, and 11.5 cents/l, respectively) and the Canadian Government introduced an excise tax credit of 4 cents/l, there was a significant cost disadvantage to biodiesel relative to conventional petroleum diesel. National Biodiesel Market Potential In terms of market potential for biodiesel, the domestic market for biodiesel has barely begun to be tapped. As shown in Table 5-1, over 23 megatonnes of petroleum diesel fuel was consumed in Canada in 2003; of this, transportation uses represented 46% of the total diesel consumption. A breakdown of the historical consumption of diesel fuel BBI Biofuels Canada 5-2 7/10/2006
46 consumption by province is shown on a volumetric basis in Figure 5-1. In 2004, the last complete year for which data are available, total diesel consumption in Canada reached 25.1 billion litres, an increase of 6% over 2003, and a 13% increase since Current federal incentive programs for biodiesel are focused almost exclusively on use as a motor fuel but the potential markets available in the other sectors, the markets available to biodiesel over the long-term, such as residential and commercial heating oil, dieselpowered standby stationary engines, farm uses, and rail and maritime applications, are substantial. The Energy Statistics Handbook (Statistics Canada, November, 2005) indicates that 2004 sales of light and heavy fuel oils totaled 18.1 billion litres, but prices were generally 10 to 14 cents per litre cheaper than those for diesel fuel. Thus, the diesel fuel market is the likely near-term focus of the biodiesel industry, due to the opportunity to command better product pricing. The production scenarios illustrated in Figures 4-5 to 4-8 aim to satisfy an RFS based on total petroleum diesel consumption, but do not include potential markets that consume light and heavy fuel oil, which, as noted above, are substantial, but not as profitable. Country/Region Table 5-1 World Petrodiesel Consumption, 2003 Petroleum Diesel Consumption, MT/yr Diesel used for Transportation, MT/yr % used for Transportation World US EU Canada (Source: IEA) The commercial scale plants currently in Canada have the capacity to produce about 95 million L/y of biodiesel, bringing the total Canadian production to 100 million L/y. With the transportation sector currently consuming over 14 billion litres of conventional diesel, current/planned biodiesel production represents less than 1% of the total potential market in the on-highway motor fuel sector alone. Conservatively assuming a B2 blend across the transportation sector alone, the available national market would be ~300 million L/y; a 5% RFS (or a B5 blend) implies a national market of 700 million L/y in the transportation sector, or 1.3 billion L/y based on all diesel consumption in Canada (Table 5-2). With current and planned production estimated at 100 million L/y, more than 85 % of the potential national market for a B5 blend in the transportation sector remains untapped. Looking toward the future, North American use of distillate fuel for transportation is projected to increase by an average annual rate of 2.4% over the next 20 years, primarily driven by freight trucks and light duty vehicles (pickups). Although much of this is driven by U.S. demand, usage in Canada is expected to mirror this trend (Figure 5-2). BBI Biofuels Canada 5-3 7/10/2006
47 Regional Biodiesel Market Potential Typically, a regional market is one that is outside of the immediate local market, but usually, within the same province and possibly neighboring provinces or U.S. states. This market will likely be serviced by truck or rail, and is within a 700 km radius of the plant (see Figure 5-3). As shown in Figure 5-3, biodiesel produced in Alberta could serve markets in BC, Montana, Idaho, and Washington. Similarly, plants in Saskatchewan and Manitoba could serve markets in northwestern Ontario, in addition to markets in North and South Dakota, Minnesota, and Wisconsin. The total on-highway consumption of diesel fuel in these northern US markets has averaged 10 billion litres per year; a 5% biodiesel blend represents an annual market of 500 million litres. Of particular note is the possible opportunity to transport biodiesel by ship, using the Great Lakes and St. Lawrence Seaway system. Thunder Bay and Duluth are within reasonable shipping distance of plants in Manitoba and Eastern Saskatchewan, and thus, provide a gateway to more distant, but potentially lucrative markets. However, for the industry to be successful, it is critical that the product move freely between provinces, just as petroleum fuels move freely across the various jurisdictions. Generally, the regional market is good business to develop. The freight is reasonable, the competition, while aggressive, is not too severe, and the turn-around time on the rail cars is an advantage. In addition, it is often easier to obtain letters of intent to purchase product from regional buyers than from national buyers. These letters, while not generally binding, do tend to raise the comfort level of the financial lending institutions. Not surprisingly, in a regional market, letters of intent to purchase are taken quite seriously by the buyer. Occasionally there are opportunities to obtain backhaul rates from local trucking companies. These are rates that are reduced since the truck is loaded both ways. Normally the trucks drive to the refined fuels terminals empty and load gasoline product for delivery. A backhaul is the opportunity to load the truck with biodiesel to drive to the terminal. Assuming a B5 blend, the (near-term) market in Alberta, Saskatchewan and Manitoba would total ~360 million L/y. This calculation is based on total diesel fuel consumption for all of these provinces, but does not include potential nearby markets in adjacent provinces or in nearby U.S. states, such as Montana, Washington, Idaho, North and South Dakota, Minnesota, and Wisconsin, nor does it include heavy or light fuel oils or the anticipated 2.4% annual growth in diesel fuel consumption projected over the next 20 years. Adding the B.C. market to that available in the Prairie Provinces would increase the market to 525 million L/y. Based on the same assumptions, at a 10% blending rate (B10), the regional biodiesel market potential is over 700 million L/y, or about 1 billion L/y when the BC market is included. BBI Biofuels Canada 5-4 7/10/2006

48 Figure 5-1: Historical Use of Diesel Fuel in Canada, by Province 8000 Canadian Diesel Consumption from 1989 to Thousands of Cubic Meters Figure 5-2: Forecast of Canadian Diesel Fuel Demand Atlantic Provinces Québec Ontario Manitoba Saskatchewan Alberta British Columbia BBI Biofuels Canada 5-5 7/10/2006
 Atlantic Provinces 2,472 2,402 2,412 2,449 2,564 2,460 1.49 1.")
49 Figure 5-3 Regional Markets for Biodiesel Plants in Western Canada Table 5-2 Canadian and Regional Diesel Fuel Consumption (Values in millions of litres per year) (Source: Statistics Canada) Year yr avg Growth, 15 yrs Growth, 5 yrs 5% Biodiesel (from 5yr avg) Atlantic Provinces 2,472 2,402 2,412 2,449 2,564 2, Québec 3,806 3,492 3,546 3,851 4,100 3, Ontario 6,601 6,295 6,399 6,487 6,890 6, Manitoba Saskatchewan 1,559 1,365 1,418 1,533 1,605 1, Alberta 4,684 4,804 4,449 4,926 5,258 4, British Columbia 3,150 3,151 3,211 3,282 3,473 3, Yukon NWT Nunavut Canada 23,380 22,690 22,543 23,712 25,176 23, ,175 BBI Biofuels Canada 5-6 7/10/2006

50 Regional Competition With more than 10 billion liters of diesel being consumed annually in the regional market, and a potential market of over 500 million liters based on a B5 blend, it is apparent that the potential output of the canola-based biodiesel production facilities proposed for the prairie provinces is about 2.5 times greater than the regional market capacity for a B5 blend, and is, in fact, 20% greater than the Canadian market capacity for a B5 blend, based on historical canola production levels. Thus, although there is sufficient canola available to produce in excess of 2.1 billion litres of biodiesel (based on current production levels), development of a canola-based biodiesel industry is likely to be incremental, increasing in tandem with increased market demand and/or mandates. Alternatively, facilities can be constructed with a view on U.S. markets. However, as shown in Figure 5-4, below, the ADM biodiesel plant in Velva, North Dakota is located within, and seeks to address, some of the same regional markets as proposed plants in Manitoba and Saskatchewan. This facility is expected to produce ~ 300 million liters of biodiesel annually. Furthermore, large biodiesel facilities have been proposed for the Pacific Northwest (near Seattle and Bellingham) that could serve markets in those areas. Thus, biodiesel plants in southern Alberta, Manitoba and Saskatchewan have access to a sizeable regional market, but there will be significant nearby competition. For this reason, a biodiesel production facility would need to utilize a reputable biodiesel marketing firm that can access national, North American, and possibly international markets, thereby reducing the risk of product marketing. Figure 5-4 Regional Market of ADM s Biodiesel Plant in North Dakota BBI Biofuels Canada 5-7 7/10/2006

51 Local Biodiesel Market Potential The local biodiesel market would be limited primarily to those major markets within ~400 km from the biodiesel plant site (an 8-hr roundtrip by truck). For the proposed project, this would include Edmonton, Red Deer, Calgary, Lethbridge, Grande Prairie, Fort McMurray, Lloydminster, Regina, Saskatoon, Brandon, and Winnipeg, along with Grand Forks and Fargo, ND (Figure 5-5). Figure 5-5 Local Markets of Biodiesel Plants in Western Canada Biodiesel Price Historical data on the price of diesel fuel in Canada were obtained from the Energy Statistics Handbook published by Statistics Canada. Data on diesel fuel prices in Ontario were obtained from the Ontario Energy Ministry. Data on historical diesel prices are available for sales through retail outlets and include all taxes. Figure 5-6 shows the average annual price of diesel fuel in several major Canadian municipalities, over the period from 1989 through the 3 rd Quarter of The period from was relatively stable, but prices have risen dramatically since Normally, a three to five year running average is appropriate for estimating the market price of fuel. However, as shown in Figure 5-7, the Consumer Price Index for Energy has risen 28% since 2001, and is forecast to increase significantly into the foreseeable future. Based on the data in Figure 5-6, the average price of diesel to end-users through retail outlets (including taxes) across Canada over the past three years was 79.9 cents per litre. The average price in Alberta, Saskatchewan and Manitoba over the same period averaged BBI Biofuels Canada 5-8 7/10/2006
52 Retail Price Cents Per Litre 70.3, 76.5, and 74.2 cents per litre, respectively. These prices include 7% GST, the Federal excise tax (4 cents per liter) and provincial road and sales taxes on fuel. Local taxes imposed by municipalities are also included. A summary of fuel taxes is provided in Table 5-3). According to MJ Ervin Fuel Facts Price Monitor Vol 6(24) 2005, Canadian refining and retail marketing margins are 10.2 and 4.9 cents/l, respectively. Thus, the wholesale price of diesel in the regional market can be estimated, as shown in Table 5-4. Based on the 3-yr average price of diesel in the Prairie Provinces, the projected wholesale selling price of diesel would be 48 cents per litre. Alternatively, if one uses the 2005 diesel fuel price, the projected wholesale price of diesel would be 60 cents per litre. As shown in Figure 5-7, the consumer price index for energy has risen at an annual rate of 5% since If this pattern continues, the wholesale price for diesel fuel would reach ~ 70 cents per litre by As a comparison, independent calculations by MJ Ervin indicate that with oil at US$70 to US$75/bbl, the wholesale price of diesel fuel would be 64 to 70 cents per litre. A biodiesel producer can also capture the value of any tax exemptions provided by the various jurisdictions. Currently, in addition to the federal excise tax exemption of 4 cents/l, only Manitoba, Ontario and British Columbia provide tax exemptions for biodiesel (Table 5-5). Figure 5-6: Historical Diesel Fuel Prices for Selected Canadian Municipalities Canadian Diesel Gas Prices from 1989 to Q St. John's Halifax Québec Montréal Ottawa-Gatineau Toronto Winnipeg Regina Edmonton Vancouver BBI Biofuels Canada 5-9 7/10/2006
53 Table 5-3: Fuel Taxes for Gasoline and Diesel Fuel across Canada Source: January, 2006 Gasoline Diesel cents/l cents/l Federal Excise Tax 10 4 GST 7% 7% Provincial and Municipal Taxes Newfoundland and Labrador Prince Edward Island Nova Scotia New Brunswick Québec Québec Sales Tax 7.5% 7.5% Montréal 1.5 Ontario Manitoba Saskatchewan Alberta British Columbia Greater Vancouver Region Greater Victoria Yukon Northwest Territories Nunavut Table 5-4: Retail and Wholesale Prices of Diesel Fuel across Canada NFLD PEI NS NB QC ON MB SK AB BC 3 yr retail avg yr wholesale avg retail avg wholesale avg BBI Biofuels Canada /10/2006
54 Figure 5-7: Statistics Canada s Consumer Price Index for Energy 180 Consumer Price Index: Energy Energy Index (1997 = 100) (Source: Statistics Canada January 2006, and Energy Statistics Handbook, November, 2005) Table 5-5: Biofuels Tax Exemptions across Canada Source: January, 2006 Biofuels Tax exemptions, Jurisdiction Diesel, cents/l Ethanol, cents/l Federal Excise Tax 4 4 Provincial Newfoundland and Labrador 0 0 Prince Edward Island 0 0 Nova Scotia 0 0 New Brunswick 0 0 Québec 0 0 Ontario Manitoba Saskatchewan 0 15 Alberta 0 9 British Columbia Two of the key provinces that would house canola-based biodiesel facilities Alberta, and Saskatchewan, do not currently provide tax exemptions for biodiesel, although they do support biofuels with an ethanol tax exemption. Given their receptiveness to biofuels, it is reasonable to expect that these provinces would be willing to extend their support to BBI Biofuels Canada /10/2006
55 biodiesel, if a proper case is made. In November, 2005, Manitoba provided an exemption of 11.5 cents per litre, but it only applied to B100, and did not apply to blends of biodiesel and regular diesel. Manitoba s March, 2006 budget extended this exemption to biodiesel blends, until March 31, Based on these historical wholesale prices, biodiesel could be sold at a price of 52 to 64 cents per litre, after accounting for the value of the Federal excise tax exemptions. An ultra-conservative financial analysis would be based on the three year average - a wholesale biodiesel price of 52 cents per litre, while a price of 60 to 64 cents per litre is probably more realistic, and may also be conservative, given current wholesale diesel price projections. If provincial tax exemptions are extended to include biodiesel, the sales price for biodiesel would be further increased. Typically, the benefits of such an exemption are shared by the producer and by the refiner/blender that ultimately sells the product, to help offset infrastructure and marketing costs associated with biofuels blending, transport and sale. Table 5-6 illustrates the resulting biodiesel prices in Ontario and the Western Provinces of Canada, assuming that Alberta, Saskatchewan and Manitoba extend their fuel tax exemptions to biodiesel. Values in Table 5-6 assume that the producer receives 70% of the tax exemption. Table 5-6: Estimated Selling Price of Biodiesel, including Provincial Road Tax Exemptions ON MB SK AB BC Sales price (3 yr avg) Sales Price (2005) The values in Table 5-6 lead to an average biodiesel price of about 61 cents per litre (3 yr average), up to about 73 cents per litre based on 2005 prices. Note that these are projections, assuming that tax exemptions are extended in Alberta and Saskatchewan. However, without such tax exemptions, there would be a significant advantage for producers to sell into the BC, Manitoba, and Ontario markets, in spite of the potentially greater transportation costs. The financial analysis will thus consider two biodiesel price scenarios. The first scenario is based on the midpoint between the 3 yr average and 2005 wholesale prices, adjusted to include the 4 cent per litre Federal excise tax exemption. The resulting value is 58 cents per litre. The second scenario is based on the midpoint price between the 2005 and 3-yr average prices, after including the provincial road tax exemptions. The resulting price in this case is 66 cents per litre. In each case, a sensitivity analysis to the wholesale price of biodiesel will be performed. In particular, a scenario based on the 2005 price plus tax exemptions (72 cents/l) will be specifically evaluated. Conclusions Regarding Biodiesel Markets If canola-based biodiesel facilities are constructed to their full potential capacity of ~ 2.1 billion L/y, their biodiesel production would be about four times greater than the regional market capacity for a B5 blend, and is, in fact, almost double the total Canadian market BBI Biofuels Canada /10/2006
56 for a B5 blend, based on transportation uses. Thus, development of a canola-based biodiesel industry is likely to be incremental, increasing in tandem with increased market demand and/or mandates. Alternatively, facilities can be constructed with a view on U.S. markets, although large biofuels facilities in North Dakota and Washington will also provide significant competition for regional markets. Over 85% of the biodiesel produced in Manitoba and Saskatchewan would be exported outside the province if market penetration was limited to a B5 blend; similarly, Alberta production would be ~ 75% of the total B5 market in Alberta and BC, and thus, production in Saskatchewan will likely be destined for these markets. Thus, interprovincial and international trade will be a critical aspect of a canola-based biodiesel industry. The retail price for diesel fuel across Canada has averaged 80 cents per litre over the past three years, and has been increasing at an average annual rate of 5% since After removal of taxes and retail margins, the 3-year average wholesale price for diesel fuel is 48 cents per litre. Biodiesel selling prices are based on the wholesale price for diesel, plus the value of federal and provincial tax exemptions. Currently, only B.C., Manitoba, and Ontario grant tax exemptions to biodiesel, although other provinces grant exemptions to ethanol, which conceivably could be extended to biodiesel as well. In the absence of any provincial tax exemptions, the projected sales price for biodiesel would be 58 cents per litre, based on historical prices for diesel fuel. If each Prairie Province also granted road tax exemptions to biodiesel, the projected biodiesel selling price would be greater than 66 cents per litre, using historical prices for diesel fuel as the basis. However, if diesel fuel prices remain at or above 2005 levels, the projected selling price for diesel would be at least 72 cents per litre, consistent with oil prices remaining in the US$65 to US$75/bbl range. BBI Biofuels Canada /10/2006
57 VI: CO-PRODUCT MARKETS This section of the study provides an assessment of co-product markets for a canolabased biodiesel industry. Co-Products: Volume of Production The products generated by a biodiesel production facility will be fatty acid methyl ester (a.k.a. biodiesel or FAME), canola meal, and glycerol. The feedstock requirements and production outputs for several plant scales are shown in Table 6-1. Table 6-1 Biodiesel Production Parameters Biodiesel Production Plant Statistics 38 MMLY 76 MMLY 151 MMLY 227 MMLY 303 MMLY Production Inputs Canola (tonnes/yr) 81, , , , ,530 Chemicals & catalysts (tonnes/yr) 2,730 5,456 10,877 16,351 21,826 Production Outputs Crude Glycerol (tonnes/yr) 4,060 8,110 16,220 24,330 32,440 FAME (Biodiesel) (MM L/yr) Protein meal (tonnes/yr) 50, , , , ,667 Soap stock (tonnes/yr) 2,933 2,933 2,933 2,933 2,933 Glycerol Markets: Volume and Price This section deals with the market volume and potential value of glycerol. The information presented here was obtained from a variety of sources, including the Chemical Market Reporter, and the Quarterly Glycerine Market Report, volume 65, published by Oleoline. Glycerol Market Volume Glycerol is synonymous with glycerine and glycerin. Glycerol comes in various forms but the most common are kosher (99.7% pure) and non-kosher (99.5%) food grade glycerol, and USP glycerol at 99.5% or 99.7% pure. The major uses of glycerol are for personal care products, food and drugs. There are very few producers/processors of glycerine in Canada AkzoNobel in Saskatoon and Cognis in Mississauga are two recognized players in the Canadian market. Furthermore, Banner Pharmaceuticals has expressed interest in acquiring crude glycerine for their gel caps. BBI Biofuels Canada 6-1 7/10/2006
58 Much of the Canadian market is served by imports from the U.S. In 2002, the last year for which data are available, imports outpaced exports by a ratio in excess of 450:1. Although higher than usual, the average ratio for the 3 year period ending in 2002 was nearly 200:1. This outcome has two key implications: (1) there is clearly a Canadian demand that is not being met by existing producers, and (2) glycerol prices in the Canadian market will be dictated entirely by production and prices in the U.S. market. Therefore, much of the market discussion in this section will focus on the U.S. marketplace. Even though the import ratio into Canada is substantial, the actual quantity imported is rather small. For example, a 38 MM L/y biodiesel facility would produce approximately 4060 tonnes of glycerol, which represents more than half of the glycerol annually imported into Canada, and ~2% of the total average U.S. demand for refined glycerol. Given the fact that two other commercial scale biodiesel facilities have recently begun operation in Canada, it is apparent that the Canadian marketplace will be quickly saturated, and much of the glycerine produced by biodiesel facilities in Canada will be destined for export. As shown in Figure 6-1, total glycerol production in the US has been consistent, averaging over 350,000 tonnes per year from 1998 to This will, however, expand substantially as more biodiesel facilities come online in the U.S. The annual US domestic demand for refined glycerin has averaged over 210,000 tonnes since 2000, but has declined significantly from , while domestic production of refined glycerine remained relatively constant (Figure 6-2). Figure 6-1 US Glycerol Production tonnes Glycerol Production in the US yr avg refined crude (Source: US Census Bureau) BBI Biofuels Canada 6-2 7/10/2006
59 Figure 6-2 US Production and Demand of Refined Glycerine tonnes US Production and Demand of Refined Glycerine yr avg Production Demand Current glycerol production capacity in the US is dominated by 11 firms, who produce about 250,000 tonnes per year, nearly 80% of the total U.S. production. Dow Chemical and Procter and Gamble together each generate about 68,000 tonnes per year; these two firms alone generate over 40% of the total U.S. production. Dow Chemical is the only producer of synthetic glycerol, but they will close their plant in Freeport, TX due to a glut of glycerol from biodiesel production (Chemical and Engineering News, 84(6), 2006). In terms of uses for glycerol, food products account for approximately 24 percent. Personal care products, including skin and hair and soap products account for 23 percent; oral care products, toothpaste and mouthwash, 17 percent; tobacco, 11 percent; uses in manufacturing plastics, 11 percent; drugs, 7 percent; miscellaneous, including cellophane, explosives and miscellaneous plasticizer, humectants and lubricant uses, 7 percent. The market sector for personal care products is growing at 3.5 percent annually. Good solubility and taste give glycerol an edge on sorbitol in toothpastes and mouth washes, and the oral care sector is growing at approximately 1.5 percent annually. The best performing sector, however, is in food products. The food products sector uses glycerol directly or as one of its derivatives, such as glycerol mono-stearate (GMS). Glycerol in the food sector is growing at better than 4 percent annually as a result of the continuing trend towards lowering the fat content in foods, particularly baked goods. These three sectors together represent 64 percent of glycerol s applications. Glycerol Price The glycerol market experienced major swings in market conditions from the mid-1990s to the present time, based primarily on oilseed crop yields and biodiesel production. It is not so much a declining demand but more of an increase in supply caused by the increase in biodiesel production. Due to concerns over bovine spongiform encephalitis, a BBI Biofuels Canada 6-3 7/10/2006
60 distinction is now being made between vegetable oil-based glycerine and tallow-derived glycerine. Historical prices for refined glycerol for the period are shown in Figure 6-3. Figure 6-3 US Refined Glycerine Prices Historical Prices of Refined Glycerine: US Market $2,500 $2,000 USD/tonne $1,500 $1,000 $500 $ yr avg (Source: Oleoline: Glycerine Market Report, Volume 65) 5 yr avg For the 10-year period from , the average price of USP glycerol in the US was US$1440/tonne, and the 5-yr average price from was US$1330/tonne. The price of crude glycerol (at 84% pure) averages approximately 50-60% of the USP price. However, in Europe, where many more biodiesel facilities are operating, the price of crude glycerol is only about 40% of the refined glycerine price. This may be an indicator of a future North American trend as biodiesel production ramps up here. Over the past 12 to 18 months, European producers have exported an ever increasing quantity of their product to the U.S., to capitalize on higher prices in the North American market. This has led to downward pressure on North American glycerol prices, although they have not decreased to levels seen in Europe. Nonetheless, U.S. and European prices have correlated well over the past 10 years, as shown in Figure 6-4. According to information available from glycerol contract prices in January, 2005 were between US$970 and $1124 per tonne and $1080 and $1235 per tonne for tallow and vegetable grades respectively. Prices had declined further by August 2005: US$794 - $US992 for tallow-derived glycerol, and US$926 US$1168 for vegetable oil based glycerol. HB International and Oleoline list Q US contract prices of US$1079/tonne and $858/tonne for Kosher- and tallow-grade glycerol, respectively, based on bulk shipment in tank cars. A Canadian glycerol processor, who BBI Biofuels Canada 6-4 7/10/2006

61 wishes to remain anonymous, has cited a current price of US$440 to $660/tonne for crude glycerol, depending upon impurities. Recent-term price trends for vegetable-oil grade glycerol are shown in Figure 6-5. Figure 6-4: Historical Prices of Refined Glycerine in the U.S. and Europe. Source: HBI/Oleoline Figure 6-5: Near-Term Price Trends for Vegetable-Oil based Glycerol Source: Chemical Marketing Reporter, 268(3) BBI Biofuels Canada 6-5 7/10/2006
62 The large drop in glycerol prices since 2000 indicates an over-supply situation. Pricing in the glycerol market is not driven by demand, as existing markets are fairly mature, but rather by supply, which is driven up by the global surge in biodiesel production. Prices have also declined as outlets for tallow-derived glycerol have shrunk due to concerns over BSE. Demand is generally described as acceptable, but growing at a slow pace. Inventories are deemed on the high side with over 45,000 tonnes of inventory in the U.S. at the end of Sellers believe that the market may have now bottomed out and most do not expect any further erosion in price. However, HBI/Oleoline projects a further 20% reduction in price by 2008, primarily due to increased supply from biodiesel facilities. On the other side of the equation is a reduction in synthetic glycerol production as its precursor, epichlorohydrin, is more profitably converted into epoxy resins. Furthermore, due to the increased cost of conventional petrochemicals, glycerol is finding new markets as a lower cost alternative to propylene glycol and ethylene glycol, which are currently about 30 to 80% more expensive than glycerol (Chemical Market Reporter, 268(3), 29, 2005). Solvay plans to open an epichlorohydrin plant in France in 2007 that will use glycerol, rather than propylene, as its raw material. Archer Daniels Midland has announced plans to make propylene glycol from glycerol rather than propylene oxide, using new advanced catalysts (Chemical and Engineering News, 84(6), 2006). It is widely reported that large contract buyers are keen to agree to more long-term agreements because glycerol prices are close to a minimum level. Producers confirm that customers are hoping to secure annual contracts next year; however, they say that they would prefer to settle business on a quarterly to six-month contract basis. For canola-based biodiesel producers, the over-riding question relating to glycerol production is the ability to market the proposed plant s crude glycerol. Based on information from a glycerol refining company (who wishes to remain anonymous), in order to sell crude glycerol from biodiesel production to a glycerol refiner, even the crude material must meet rigorous specifications to be acceptable as feedstock for the postproduction refining operation. Canola-derived glycerine will be better able to meet these requirements than biodiesel producers that use waste fats, oils and greases. Nonetheless, due to the erosion in price, producers must seriously consider the adverse cost and market implications of incorporating glycerol refining into the proposed plant. Based on published market data, the current price for refined glycerine is from US$794 to US$992/tonne for tallow-derived products. Personal communication with a glycerol refining company indicates prices for crude glycerine of $US440 - $660/tonne. There are conflicting predictions for the future, whether the current market price is bottoming out, or will continue to decline. Based on the current market assessment, a price of C$900/tonne for the refined glycerol and a price of C$495/tonne for crude glycerol will be used in the financial analysis. The price for refined glycerine is a conservative price that accounts for a forecast 25% drop in future glycerine prices. The price for crude glycerine is set at 55% of the refined glycerine price, based on historical norms, but this price also is at the low end of the price range cited by a Canadian glycerol processor. BBI Biofuels Canada 6-6 7/10/2006
63 Canola Meal These low prices also account for likely transportation costs as the glycerine is exported to foreign markets. Based on current market prices and future market trends for glycerol, BBI recommends that biodiesel producers do not include glycerol refining in the proposed facilities, and focus solely on the sale of crude glycerol. This eliminates capital and operating costs associated with glycerol refining. Agriculture and Agri-Food Canada s 2004 Profile of the Canadian Oilseed Sector estimates that the average crush capacity for canola is 4 Mt, which would produce ~2.4 Mt of canola meal at full capacity. As shown in Table 6-2, canola meal production has averaged 1.8 Mt, or ~75% of capacity. However, over the past three years, crush facilities have operated at ~85% of capacity. As shown in Figure 6-6, historical crush margins for canola have been quite variable, but generally positive, particularly since Figure 6-6: Board Crush Margins for Oilseeds in Canada Source: Agriculture and Agri-Food Canada Profile of the Canadian Oilseed Sector The primary market for canola meal is as a protein source for animal feed. In this regard, it would compete with soy meal and dried distillers grains and solubles (DDGSs), a byproduct of the grain-ethanol industry. Canola meal marketing channels are similar to those for canola seed, but the pricing is dictated by soy meal contracts on the CBOT futures market. The protein content of canola meal is about 70% of that for soy meal, and consequently, the price of canola meal is about 70% of that for soy meal. Table 6-3 shows historical pricing for canola meal; the 10-year average price is $198/tonne. BBI Biofuels Canada 6-7 7/10/2006
64 Canada is a large net exporter of canola meal and a large net importer of soy meal, largely into western Canada. In 2003, canola meal exports were valued at $226 million, and represented 92% of the total protein meal exports in Over 90% of the canola meal exports are destined for the U.S., 4% for Ireland, and 2% to Taiwan. In 2003, Canada accounted for 46% of the total worldwide canola meal exports. Total protein meal production has typically ranged from 3 to 3.5 Mt annually, and domestic consumption is typically in the range of 3 Mt, with ~0.5 Mt of canola meal consumption and ~2.4 Mt of soy meal consumption. For a canola-based biodiesel industry to be successful, domestic and export markets for canola meal will have to expand. For each 100 MMLY of biodiesel production from canola oil, and additional 150,000 tonnes of canola meal will be produced. At a full-rollout of 2.1 billion L/y of biodiesel, markets for 3.1 Mt of canola meal will have to be found. Conceivably, some of the imported soy meal could be displaced by canola meal, albeit with significant price competition, as more soy meal will be produced in the U.S. due to biodiesel production there. Due to these factors, the economics analysis will use a price of $181/tonne for canola meal, $17 less than the 10-year average price to compensate for additional transportation costs to reach export markets, and increased overall supply of protein meal from canola, soybeans and DDGSs. Table 6-2: Canola Meal Supply and Demand Crop Year - August 1st to July 31 st Source: Statistics Canada - Cereals and Oilseeds Review & COPA Newsletter Canadian Canola Meal Supply and Demand (000 Tonnes) Stocks Production Imports Total Supply Exports Domestic Utilization Total Demand Ending Stocks , ,687 1, , ,068 1, , ,985 1, , ,902 1, , ,903 1, , , , , , ,148 1, , ,929 1, forecast 18 2, ,080 1, yr Avg BBI Biofuels Canada 6-8 7/10/2006
65 Table Historical Canola Meal Pricing Source: Statistics Canada Price, Year C$/tonne yr avg yr avg Section Summary Information in this section has established the potential production volume and pricing of the co-products generated by the proposed biodiesel production facilities. A 38 MM L/y biodiesel plant would generate over 4,000 tonnes of pure glycerin, representing more than 50% of the Canadian market for glycerol, and about 2% of the historical market for refined glycerine in the US. Based on the small domestic market for glycerin, and existing commercial biodiesel operations, Western Canadian producers must be aware of the risk involved in glycerol production and marketing, which will undoubtedly require export. The large drop in glycerol prices since 2000 indicates an over-supply situation. By mid-2005, food grade tallow-derived refined glycerol was valued at C$910-$1150/tonne and food grade vegetable-derived glycerol was valued at C$1050-$1350/tonne. Based on the current market assessment, a price of $495/tonne for the crude glycerol is used in the financial analysis. Based on current market prices for glycerol, BBI recommends that biodiesel producers do not include glycerol refining in their process design, and focus solely on the sale of crude glycerol. Significant quantities of canola meal will be produced by the proposed integrated crushbiodiesel facilities. For each 100 MMLY of biodiesel production, 150,000 tonnes of canola meal will be produced, and will have to be sold into an increasingly competitive BBI Biofuels Canada 6-9 7/10/2006
66 market for protein meals. Although the historical 10-year average price for canola meal is $198/tonne, the financial analysis has used an average price of $181/tonne, to account for increased transport costs to sell canola meal in export markets, and downward price pressure from increased production of protein meals in general. BBI Biofuels Canada /10/2006
67 VII. FACILITY DESIGN BASIS AND PROJECT STATISTICS This section provides the design basis and project statistics for the financial analysis. The process scenario is for biodiesel production from degummed canola oil. Several plant scales/scenarios (listed below) were evaluated individually; data can be aggregated based on the plant scenarios shown in Figures 4-5 to 4-8 to develop overall statistics for a canola-based biodiesel industry. (a) a 38 million L/y plant (b) a 76 million L/y plant (c) a 114 million L/y plant (d) a 152 million L/y plant (e) a 190 million L/y plant (f) a 228 million L/y plant (g) a 302 million L/y plant Process Description A description of the biodiesel production process is provided here. A simplified block flow diagram for a conventional process, such as that adopted by Lurgi/PSI, is shown below in Figure 7-1. In addition to the basic biodiesel process unit operations, there are two additional process alternatives that can be incorporated into the biodiesel process. One is glycerol refining and the other is colloquially known as the Flexible Front-End. These two process adders are shown using dashed lines in Figure 7-1. The Flexible Front-End is not required for any scenario based on canola oil only, but would have to be added for a plant to use mixed feedstocks. The production unit operations are summarized below. Transesterification The degummed, crude oil feedstock generated by the extraction facility, or purchased canola oil, is sent to the transesterification unit. Transesterification is a base-catalyzed chemical reaction in which triglycerides (oil or fat) react with an alcohol (methanol), in the presence of an alkaline catalyst, (lye) to form the methyl ester and liberate glycerol from the triglycerides. Depending on the process conditions and equipment, the transesterification reaction can take anywhere from 10 minutes to 8 hours to achieve >99% conversion. Phase Separation The products of the transesterification reaction form two distinct phases: a lighter, hydrophobic or solvent phase containing the methyl esters and a heavier, hydrophilic or water-based phase. These separated via conventional processes, either by centrifugation or by coalescing and decanting. BBI Biofuels Canada 7-1 1/31/2007


68 Methyl Ester Washing Following phase separation, the ester-rich phase still contains a small amount of methanol, traces of glycerol, and traces of soaps, catalyst, and high boiling components. In order to remove the water-soluble substances, the ester phase is washed. To avoid the formation of emulsions, any soaps that may be present are split before washing by adding a small amount of acid. Figure 7-1 Conventional Biodiesel Production Process Methyl Ester Drying and Methanol Recovery The washed ester is still considered wet, with trace amounts of moisture remaining. The washed ester is dried via vacuum in a dryer circuit to adjust the allowable water content. The dried methyl ester is continuously delivered by pump to the methyl ester storage tank in the tank farm. The glycerol phase is collected in a pump tank together with the methyl ester wash water. In this process, the catalyst decomposes into caustic soda solution and methanol in the BBI Biofuels Canada 7-2 1/31/2007
69 presence of water. The methanol-bearing aqueous phase is fed to a rectification column. The overhead product has a methanol content of > 99.9% and is condensed and recycled to the transesterification process via the methanol pump tank. Glycerol Water Pretreatment and Evaporation Esterification The glycerol-water mixture proceeding from the methanol recovery stage is dried in a 2-stage evaporation system (optional 3-stages) up to a minimum glycerol concentration of 80%. The evaporator system has two recirculating evaporation circuits (stages) maintained under vacuum; each recirculating evaporation circuit is composed of a heat exchanger and evaporator section. The vapors from the last evaporator stage are precipitated in a condenser. The concentrated glycerol solution is transferred to a storage tank for storage and sale. Certain biodiesel production processes incorporate a flexible front-end that allows for the use of additional feedstocks such as animal fats, recycled fats and oils, and tropical vegetable oils such as palm oil. Many fat and oil feedstocks, especially those derived from animals and oxidized materials like recycled cooking oils, have elevated levels of free fatty acids (from 2% to 20%). In the biodiesel production process, any free fatty acids that aren t removed or pre-processed will generate soaps in the presence of the alkaline catalyst, reducing the yield of biodiesel while generating an undesirable byproduct. The free fatty acids present in animal and recycled oil feedstocks are eliminated by converting them to biodiesel before introducing the oil into the primary transesterification step. This is done by incorporating an acid-catalyzed esterification reaction upstream of the transesterification reaction. The high-free-fatty acid feedstock is mixed with alcohol and acid in a separate reactor, converting all free fatty acids into methyl esters; the intact triglycerides (fat and oil) remain un-reacted, so no glycerol is produced. When the esterification reaction is complete, the free fatty acids are all converted into methyl ester; the methyl ester and triglyceride mixture is then sent to the transesterification reactor, where the alkaline-catalyst is added and the bulk of the oil feedstock is converted to biodiesel and glycerol. Glycerol Refining The glycerol refining operation increases the concentration, or purity, of the crude glycerol from 80% to pharmaceutical or kosher quality, generally 97.5% pure or higher. This operation is only required if the project is intent on capturing this additional value at the expense of significantly higher capital and operating costs. Once distilled the purified glycerol is further refined by filtering and bleaching to remove any color contaminants. BBI Biofuels Canada 7-3 1/31/2007
70 BIOX Process The BIOX process is a proprietary, truly continuous, single-pass production system that generates no waste products, and produces ASTM-spec biodiesel and refined glycerol. The BIOX process increases the efficiency of both the esterification and transesterification reactions used in biodiesel production, reducing the esterification reaction time sufficiently to allow it to be matched up with the 5 minute reaction time for transesterification, making true continuous production possible. The BIOX process also minimizes soap production and generates no wastewater. The BIOX process has been specifically designed for high free fatty acid (FFA) feedstocks to capitalize on their lower cost compared to low FFA vegetable oil feedstocks. Conventional biodiesel production processes require additional capital and operating costs to process high FFA feedstocks, and their capital and economic projections reflect the higher feedstock cost of degummed vegetable oils or the additional capital equipment associated with cheaper animal fats and recycled fats and oils. Overall, the BIOX process should be more economical than a conventional biodiesel production process, having reduced unit operations and operating costs when compared to conventional biodiesel production processes, particularly if feedstocks with a high FFA content are used. Summary of Production Statistics As discussed previously, several biodiesel production scales/configurations were evaluated for feasibility. These include: (a) a 38 million L/y plant (b) a 76 million L/y plant (c) a 114 million L/y plant (d) a 152 million L/y plant (e) a 190 million L/y plant (f) a 228 million L/y plant (g) a 302 million L/y plant The production statistics for various plant scales evaluated under (a) (g) are provided in Table 7-1. The table shows the production input requirements and outputs, the annual transportation requirements, and the staffing requirements for the facilities. Table 7-1 is based on a conventional biodiesel design, for two reasons: (1) There is limited information on the equivalent BIOX process at the various scales anticipated for the canola-based biodiesel facilities (2) The key advantages of the BIOX process are realized if the plant uses high FFA feedstocks such as recycled fats, oils and greases; these advantages diminish when a clean oilseed-derived feedstock is used. BBI Biofuels Canada 7-4 1/31/2007
71 Table 7-1 Project Statistics for Biodiesel Production Plants Biodiesel Production Plant Statistics 38 MMLY 76 MMLY 114 MMLY 151 MMLY 227 MMLY 303 MMLY Production Inputs Canola (tonnes/yr) 81, , , , , ,530 Water (cubic meters/yr) 368, ,804 1,104,192 1,467,720 2,206,440 2,945,160 Electricity (kwh/yr) 4,805,833 9,598,986 14,404,819 19,147,250 28,784,276 38,421,303 Natural Gas (MMCF/yr) Chemicals & catalysts (tonnes/yr) 2,730 5,456 8,183 10,877 16,351 21,826 Production Outputs Crude Glycerol (tonnes/yr) 4,060 8,110 12,170 16,220 24,330 32,440 FAME (Biodiesel) (MM L/yr) Protein meal (tonnes/yr) 50, , , , , ,189 Soap stock (tonnes/yr) 2,933 2,933 2,933 2,933 2,933 2,933 Wastewater (MM L/yr) Incoming Transportation Oilseed (trucks/yr) 2,253 4,501 6,754 9,002 13,503 18,004 Chemicals & catalysts (Trucks/yr) Total Trucks Inbound per Day Total Trucks Inbound per Year 2,329 4,651 6,980 9,302 13,953 18,605 Outgoing Transportation Biodiesel (trucks/yr) 2, ,011 7,989 12,011 16,032 Protein meal (trucks/yr) 1, ,188 5,581 8,372 11,162 Glycerine (trucks/yr) ,340 1,786 Soap stock (trucks/yr) Total Trucks Outbound per Day Total Trucks Outbound per Year 3, ,030 14,625 21,884 29,142 Total Transportation Total Trucks per Day Total Trucks per Year 6, ,010 23,927 35,837 47,747 Rail transport is a likely option for incoming feedstocks, outbound glycerine, outbound protein meal and some of the outbound biodiesel. Each rail tanker used for biodiesel would replace approximately 5.5 tanker trucks, and could therefore substantially reduce truck traffic around the plant site, provided the costs are competitive. Each railcar used for grain or protein meal would replace 3 trucks. BBI Biofuels Canada 7-5 7/10/2006
72 Personnel Requirements Table 7-2 indicates staffing requirements for the various plant scales, based on an integrated crush-biodiesel facility. It is apparent that larger scale facilities achieve some economies of scale with respect to staffing. Beyond the 38 MMLY level, each additional 38 MMLY of production requires (approximately) another three employees, generally in the production and maintenance area. Table 7-2 Personnel Requirements for Integrated Crush-Biodiesel Facilities Biodiesel Production Plant Staffing Requirements 38 MMLY 76 MMLY 114 MMLY 151 MMLY 189 MMLY 227 MMLY 303 MMLY Employees Administration/Management General Manager Plant Manager Quality Control Manager Controller Commodity Manager Administrative Assistant Production Labor Microbiologist Lab Technician Shift Team Leader Shift Operator Yard/Commodities Labor Maintenance Maintenance Manager Boiler Operator Maintenance Worker Welder Electrician Instrument Technician Total Number of Employees Table 7-3 shows the estimated total payroll, federal income tax, and provincial income tax for each of the plant scales. Table 7-4 estimates the personal income taxes collected by the federal and provincial governments for each production scenario. The estimated total personal income tax revenues from the small-scale plant scenario (22 plants with an 80 km radius for feedstock collection) is $3.3 MM per year; this decreases to $2.2 MM per year for the large scale production scenario, due to the aforementioned economies of scale with respect to employment. BBI Biofuels Canada 7-6 7/10/2006
73 Further discussion of tax revenues, including tax revenues from plant operations and property taxes, will be presented in Section X. Table 7-3: Salary and Income Tax Summary for Various Plant Scales Basis: 2006 Federal and Provincial Tax Rates and Basic Personal Exemptions Biodiesel Production Plant Salary and Employee Income Tax Statistics 38 MMLY 76 MMLY 114 MMLY 151 MMLY 227 MMLY 303 MMLY Total Salaries $654,500 $770,000 $933,900 $1,087,900 $1,362,900 $1,669,800 Federal Income Tax $86,784 $104,390 $130,038 $152,212 $189,537 $230,439 Alberta Income Tax $43,252 $51,842 $63,792 $74,752 $93,373 $113,704 Saskatchewan Income Tax $60,419 $72,225 $88,692 $103,806 $129,201 $157,996 Manitoba Income Tax $65,385 $77,703 $96,845 $113,557 $141,907 $171,986 Table 7-4: Salary Statistics and Total Tax Revenues for Each Production Scenario, by Jurisdiction Scenario 1 = 22 small plants; 80 km feedstock collection zone Scenario 2 = 9 large plants; 150 km feedstock collection zone Total Taxes for each scenario Scenario 1, total Scenario 2, total Scenario 1, $/MMLY production Scenario 2, $/MMLY production Total Salaries $14,967,150 $9,699,800 $11,757 $7,122 Average Salary Per Employee $44,745 $46,859 Federal Income Tax $2,015,988 $1,348,765 $1,584 $990 Alberta Income Tax $315,496 $198,926 $248 $146 Saskatchewan Income Tax $721,701 $541,369 $567 $397 Manitoba Income Tax $253,483 $113,557 $199 $83 Total Federal and Prov taxes $3,306,667 $2,202,618 $2,598 $1,617 BBI Biofuels Canada 7-7 7/10/2006
74 VIII. ESTIMATED CAPITAL & OPERATING COSTS This section provides the key parameter assumptions and capital and operating cost estimates used in the financial analysis. Assumptions Made in the Financial Analysis The key project assumptions used in the financial projections for the production scenarios are reviewed here. These assumptions factor into the operating costs for the different production scenarios. Canola Feedstock Cost: The cost of canola used in the financial analysis is based on the 5-year historical average ($353/tonne, or $8.37/bu), based on the five-year average canola price, plus a basis adjustment of $15/tonne. Thus, the cost of canola used in the financial analysis is $368/tonne. Biodiesel Price: The price of biodiesel used in the baseline financial analysis will be $0.585/litre, based on the 3-yr wholesale price of diesel plus the 4 cents per litre Federal excise tax. A subsequent scenario will be evaluated using a biodiesel price of 66 cents per litre, which adds the average provincial road tax exemption to the base price of 58.5 cents per litre. Glycerine Price: Based on the current market assessment, a price of $495/ton for the crude glycerine is used in the financial analysis. BBI recommends that biodiesel facilities not include glycerine refining in their operations. Natural Gas Price: Historical natural gas prices vary by jurisdiction, depending to a certain extent upon whether or not the utilities market is regulated or unregulated. Natural gas prices for High Volume customers in Manitoba have averaged $0.29/m 3, or $8.16/MMBTU, including transportation, distribution, and services. In Saskatchewan, commercial rates are $0.31/m 3, or $8.72/MMBTU, while in Alberta, rates have averaged $0.28/m 3 ($7.86/MMBTU) since 2002, including delivery and other fixed charges. A weighted average price for natural gas was thus calculated, based on regional prices and the proportion of biodiesel to be produced in each province. The resulting price of natural gas used in the financial analysis was $8.12/MM BTU (or $0.29/m 3 ). Electricity Price: Alberta s electricity market is de-regulated, and has thus experienced significant price fluctuations. In contrast, prices in Saskatchewan and Manitoba have been more stable, either due to regulation or an abundance of provincial electricity generation. In Alberta, the price of electricity has averaged 6.03 cents/kwh since 2002, while rates to large customers in Saskatchewan and Manitoba are 4.61 and 3.06 cents/kwh, respectively. Again, a weighted average price was generated, based on the price and anticipated production in each province. Based on these data, a net price of 4.8 /kwh has been used in the analysis. BBI Biofuels Canada 8-1 7/10/2006
75 The key assumptions incorporated into the financial analysis are summarized in Table 8-1. The base cost for land purchase was assumed to be $10 thousand per acre, a typical price at rural sites. Table 8-1 Project Assumptions for Biodiesel Production Plants Biodiesel Production Plant Project Assumptions Model Input Parameter value Biodiesel Yield (litre/tonne of oilseed) Biodiesel Selling Price ($/litre) 0.58 Biodiesel Transport. Cost ($/litre) Biodiesel Oil sales comm. 1.00% RF&O Feedstock price ($/kg) 0.47 Purchased Oil Feedstock Price ($/kg) 0.70 Oilseed meal yield (lb/bu) 31 Oilseed meal price ($/tonne) Oilseed meal sales commission 2.00% Glycerol yield (kg/litre) Glycerol price ($/tonne) 545 Electricity use (kwh/litre) Electricity price ($/kwh) Natural gas use (BTU/litre) 1,585 Natural gas price ($/MMBTU) 8.12 Makeup water use (litre/litre) 9.72 Makeup water price ($/1000 litre) 0.80 Wastewater effluent (litre/litre) 2.09 Wastewater effluent cost ($/1000 litre) 0.80 Chemicals & catalysts ($/litre) 0.05 Number of employees 15 Maintenance materials 1.50% Property tax and insurance 1.50% Debt/equity ratio 0.6/0.4 Loan terms 0.08 for 10 years Land ($/acre) 10,000 BBI Biofuels Canada 8-2 7/10/2006
76 Capital Construction Cost Estimates The capital costs incurred for construction of a biodiesel plant are dependent upon the feedstock and intended byproducts. Use of recycled oils (FOG) adds to the capital costs, to cover costs for bleaching, filtration, pretreatment and initial esterification of the recycled oils. These process units (a so-called flexible front end ) may account for about 25% of the total capital cost of a biodiesel facility. Since canola oil is a clean feedstock, these process units have not been included in the capital cost estimates for the plant. Similarly, a decision to sell refined glycerine adds capital costs for distillation and refining, along with ongoing operating costs, primarily utilities, to purify the crude glycerine. Based on current prices for crude and refined glycerine, the additional capital and operating costs for a glycerine refining operation cannot be justified. Therefore, the energy inputs and capital costs have been based on production of crude glycerine only. The financial models considered for this study have therefore excluded costs for glycerine refining, because BBI s current recommendation is to proceed with the sale of crude glycerine only. Capital costs for crushing facilities have been based on the use of solvent extraction to remove oil from the grain. A typical crush facility aims to produce food grade (refined) oil and protein meal; however, refined oil is not required for a biodiesel facility. Thus, capital costs for the crush facility do not include refining operations. Solvent-based crushing operations are capital intensive at small scales (up to ~ 40 MMLY), but significant economies of scale are realized in the range from 40 to 100 MMLY, after which there are smaller economic benefits associated with further scale-up. The capital construction cost estimates used in the financial analysis are shown in the Table 8-2. The costs reflect actual capital equipment estimates obtained from leading vendors of biodiesel and oil extraction equipment. The capital costs used in the financial analysis are based on an integrated crushbiodiesel facility, where the crush facility is based on solvent extraction, and the biodiesel facility is dedicated to clean (low FFA) feedstocks. The rail improvement costs are based on a typical site, which would require a mainline switch, two yard switches, and about 250m of track on the plant site. BBI Biofuels Canada 8-3 7/10/2006
77 Table 8-2 Biodiesel Production Plant Capital Costs Canola Council of Canada Biodiesel Economic Impact Analysis: Capital Cost Estimates 38 MMLY 76 MMLY 114 MMLY 151 MMLY 227 MMLY 303 MMLY Biodiesel Production (gal/year) 10,000,000 20,000,000 30,000,000 40,000,000 60,000,000 80,000,000 Project Engineering & Construction Costs Biodiesel Plant Capital Cost $12,497,000 $16,394,000 $19,493,000 $22,341,000 $26,792,000 $22,341,000 Oilseed crush and Degumming Capital Cost $21,617,357 $29,778,075 $37,766,707 $47,171,869 $69,517,513 $90,082,206 Physical Refining to Edible Grade Oil $0 $0 $0 $0 $0 $0 USP Glycerine Distillation Capital Cost $0 $0 $0 $0 $0 $0 Total Engineering and Construction Cost $34,114,000 $46,172,000 $57,260,000 $69,513,000 $96,310,000 $112,423,000 Development Costs Inventory - Oilseeds $789,000 $1,577,000 $2,366,000 $3,154,000 $4,731,000 $6,308,000 Inventory - Chemicals & Catalysts $101,000 $201,000 $302,000 $402,000 $603,000 $805,000 Inventory - Biodiesel, Glycerin $765,000 $1,530,000 $2,295,000 $3,059,000 $4,589,000 $6,119,000 Inventory - Spare Parts $682,278 $923,451 $1,145,204 $1,390,251 $1,926,195 $2,248,458 Startup Costs $324,974 $397,418 $451,674 $497,215 $574,098 $640,001 Land $120,000 $220,000 $300,000 $400,000 $450,000 $500,000 Administration Building & Furnishing $450,000 $450,000 $450,000 $450,000 $450,000 $450,000 Rail Improvements $490,000 $490,000 $490,000 $490,000 $490,000 $490,000 Well & Process Water Treatment $0 $0 $0 $0 $0 $0 Site Development Costs $231,334 $258,441 $281,436 $302,461 $341,301 $377,658 Rolling Stock and Shop Equipment $107,060 $113,973 $118,823 $122,683 $128,793 $133,657 Organizational Costs $515,306 $649,230 $738,485 $811,734 $936,317 $1,019,942 Capitalized Fees and Interest $614,051 $831,105 $1,030,683 $1,251,226 $1,733,576 $2,023,612 Contingency $2,220,000 $3,000,000 $3,720,000 $4,520,000 $6,260,000 $7,310,000 Total Development Costs $7,410,003 $10,641,618 $13,689,305 $16,850,570 $23,213,280 $28,425,327 Total Estimated Project Cost $41,524,003 $56,813,618 $70,949,305 $86,363,570 $119,523,280 $140,848,327 BBI Biofuels Canada 8-4 7/10/2006
78 IX. FINANCIAL ANALYSIS This section presents the results of the economic evaluation of the proposed biodiesel production project. Several production scales are considered, based on the range of plant sizes contemplated in Figure 4-5 and 4-6. The primary analysis is based on a biodiesel price of 58.5 cents per litre, i.e., the 3 year average whole price plus the 4 cents/l Federal excise tax exemption. A subsequent analysis will be based on a biodiesel price of 66 cents per litre, which is based on the assumption that the current provincial road tax exemptions granted to ethanol are extended to biodiesel as well. Economic Modeling Results for Biodiesel Production Several plant scales/scenarios were evaluated, using BBI s proprietary financial model. Data from these individual plant scales will then be used to develop projections based on the number of plants identified in section IV, i.e., the 22 smaller scale plants based on feedstock collected within an 80km radius of the plant, and the 9 large scale plants that could be constructed if the feedstock collection zone was extended to a 150 km radius. The financial analysis established that three major parameters influence the projected return on investment: feedstock cost, biodiesel selling price, and plant scale. The following specific cases were examined: (a) a 38 million L/y plant (b) a 76 million L/y plant (c) a 114 million L/y plant (d) a 151 million L/y plant (e) a 189 million L/y plant (f) a 227 million L/y plant (g) a 303 million L/y plant Although a 303 MMLY plant is not specifically contemplated in either of the production scenarios based on historical production of canola, it has been included because it may be an option if canola production expands (or is sustained at 2005 levels). Furthermore, it provides a basis for comparison against the 85 MMGPY (320 MMLY) plant under construction in Velva, ND. This U.S.-based plant will be discussed in detail in Section XI of the report. The financial impact of using mixed feedstocks canola + recycled fats, oils, and greases is discussed in Appendix B. Pre-tax Return on Investment (ROI) was used to measure the profitability of the proposed project. The results are summarized in Tables 9-1 and 9-2. Additional details are shown on the following pages and in the complete 10-year economic forecasts for the projects that are included in the appendix. The ROI used here is the average annual pre-tax return on equity invested in the project over an 11-year period. The 11-year period includes 13 months of plant construction and BBI Biofuels Canada 9-1 7/10/2006
79 startup-up followed by about 10 years of commercial operation. The equity investment is assumed to be 40% of the total project cost. Table 9-1 summarizes the economic model results for each of the plant scales contemplated in (a) - (g) based on a biodiesel price of 58.5 cents per litre. The corresponding data determined from a biodiesel price of 66 cents per litre are shown in Table 9-2. Table 9-1 Modeling Results for Biodiesel Production: Biodiesel at 58.5 cents/l Summary of Biodiesel Production Plant Financial Projections Performance Metric 38 MMLY 76 MMLY 151 MMLY 227 MMLY 303 MMLY 11-Year Average ROI -54.7% -57.2% -60.9% -61.5% -64.0% Average Annual Net Earnings (9,082,000) (13,010,000) (21,043,000) (29,408,000) (36,109,000) Installed Capital Cost per Gallon of Capacity Plant Capital Cost $34,114,000 $46,172,000 $69,513,000 $96,310,000 $112,423,000 Owner's Costs $7,410,003 $10,641,618 $16,850,570 $23,213,280 $28,425,327 Total Project Investment $41,524,003 $56,813,618 $86,363,570 $119,523,280 $140,848,327 40% Equity $16,609,601 $22,725,447 $34,545,428 $47,809,312 $56,339,331 Table 9-2 Modeling Results for Biodiesel Production: Biodiesel at 66 cents/l Summary of Biodiesel Production Plant Financial Projections Performance Metric 38 MMLY 76 MMLY 151 MMLY 227 MMLY 303 MMLY 11-Year Average ROI -29.1% -19.9% -14.7% -8.3% -3.9% Average Annual Net Earnings (4,844,000) (4,535,000) (4,184,000) (3,983,000) (2,209,000) Installed Capital Cost per Gallon of Capacity Plant Capital Cost $34,114,000 $46,172,000 $57,260,000 $96,310,000 $112,423,000 Owner's Costs $7,476,003 $10,773,618 $13,887,305 $23,611,280 $28,955,327 Total Project Investment $41,590,003 $56,945,618 $71,147,305 $119,921,280 $141,378,327 40% Equity $16,636,001 $22,778,247 $28,458,922 $47,968,512 $56,551,331 As shown in Table 9-1, at a selling price of 58.5 cents/l for biodiesel, canola-based biodiesel facilities are wholly unfeasible at any scale. In fact, the price of the feedstock exceeds the value of the products and co-products by a sufficient margin that larger scale plants lose even more money than smaller scale plants, contrary to the typical efficiencies gained from an economy of scale. The primary conclusion from this analysis is that, with canola seed at $8.37/bu ($368/tonne), and a biodiesel selling price of 58.5 cents/l, construction cannot be justified. BBI Biofuels Canada 9-2 7/10/2006
80 As shown in Table 9-2, a biodiesel selling price of 66 cents per litre still provides negative ROIs, but economies of scale are apparent, because the ROI improves as the scale increases. Nonetheless, with canola prices at $368/tonne, and a biodiesel price of 66 cents per litre, biodiesel facilities would remain infeasible, regardless of scale. Capital cost has an impact on ROI, primarily due to debt servicing costs, but it is not the major driver that separates a profitable plant from a non-viable plant. For example, assuming a 60:40 debt:equity ratio, reducing the capital cost by 25% (e.g., by virtue of a Government co-payment program) only improves the ROI for an 80 MMGPY (303 MMLY) plant from -3.9% to 5.0%. Similarly, a 25% co-payment on capital cost for a 60 MMGPY (227 MMLY) plant would increase its ROI from -8.3% to nearly break-even. These results indicate that although such a financial incentive may be useful, on its own, it cannot sustain a biodiesel industry if canola and biodiesel prices remain at these levels. The most significant factors influencing the profitability of a biodiesel facility are the selling price of biodiesel and the purchase price of feedstock. Table 9-3 shows the 11-year average ROI for biodiesel prices from 66 to 75 cents per litre, and canola prices from $331/tonne to $368/tonne. Canola, $/tonne Table 9-3: Effect of Biodiesel and Canola Prices on ROI Biodiesel, cents/l MMLY MMLY MMLY MMLY MMLY 303 MMLY % -19.9% -14.7% -11.8% -8.3% -3.9% % 8.8% 16.4% 20.7% 25.2% 32.0% % 16.1% 25.2% 30.3% 35.6% 43.8% % 13.5% 22.1% 27.0% 32.1% 39.8% % 33.9% 46.6% 53.8% 61.1% 72.6% % 41.3% 55.4% 63.4% 71.6% 84.4% With canola at $368/tonne, a biodiesel price of 72.6 cents per litre would lead to an ROI of 21 to 32% for plants between 151 and 303 MMLY, but a 38 MMLY plant would still have a negative ROI, and a 76 MMLY plant would only have an ROI of 8.8%. A further increase in biodiesel price, to 75 cents/l, leads to a near-breakeven for a 38 MMLY plant, while larger plants would have ROIs ranging from 16 to 44%. Based on BBI s experience, a 25% ROI is the threshold level to warrant investment; 7 of the 9 plants in the large scale production scenario (Figure 4-7) exceed this threshold with canola at $368/tonne and biodiesel at 75 cents/l. This result also reinforces the value of the economies of scale for the second (large scale) production scenario The ROIs of the larger plants are consistently higher, and would merit investment at a lower biodiesel sales price than smaller plants. For example, with canola at $368/tonne and biodiesel at 72.6 cents/l, none of the 22 plants contemplated under the small-scale production scenario (Figure 4-5) would have an ROI that would be worthy of investment, and only 1 out of 22 plants meets this threshold if the biodiesel BBI Biofuels Canada 9-3 7/10/2006
81 price is 75 cents per litre. Clearly, it is much better to build a smaller number of large scale plants than a large number of small scale plants. The results in Table 9-3 also demonstrate the dramatic impact of canola prices. A 10% decrease in the price of canola, from $368/tonne to $331/tonne, dramatically improves the ROI for all the biodiesel facilities. For example, with biodiesel at 66 cents/l, 151 to 303 MMLY plants would have ROIs between 27 and 40%, while 38 to 114 MMLY plants would have ROIs from -2 to 22%. Again, 7 of 9 plants in the large scale scenario would be viable, while only the single 30 MMGPY plant in the small-scale scenario would be a viable investment. The proforma income statements for year two of the 40, 60 and 80 MMGPY operations are given in Table 9-4. These income statements are based on a canola price of $368/tonne and a biodiesel price of 72.6 cents/l. The total revenues and expenses for the two production scenarios can thus be developed based on the data in Table 9-4 and in similar tables developed for smaller plants. This will be part of the macroeconomics analysis developed in Section X. It is important to note that the results in Table 9-4 are based on a biodiesel price that is well above 52 cents/l, the 3-year average whole price for biodiesel, plus the Federal excise tax exemption, and is also well above 64 cents/l, the average wholesale price for diesel in 2005, plus the Federal excise tax exemption. However, this price is equivalent to the 2005 wholesale price for diesel, if both a Federal excise tax and Provincial Road tax exemption are provided to the biodiesel facilities. The results imply that if diesel fuel and canola prices remain at current levels, plants would be economically viable if the host provinces provided an exemption on the road tax normally applied to diesel fuel. Figure 9-1 to 9-3 show the return on investment (ROI) for the 151, 227, and 303 MMLY plants, assuming biodiesel can be sold at 72.6 cents per litre, and canola is purchase at $368/tonne. Values are shown for each year of the project, beginning with construction of the plant in year 0 through the 10 th year of commercial operation. The ROI is the net earnings each year divided by the equity investment. The average annual pre-tax ROI for the 11 years shown in the charts are shown in Table 9-4. BBI Biofuels Canada 9-4 7/10/2006
82 Table 9-4 Year 2 Income Statement for 151, 227 and 303 MMLY Biodiesel Plants Proforma Income Statement for Year 2 Biodiesel Production (liter/yr) 151,000, ,000, ,000,000 Net Revenue $/Year $/liter $/Year $/liter $/Year $/liter Biodiesel $107,957,249 $0.713 $161,935,873 $0.713 $215,914,498 $0.713 Oilseed Meal $34,789,806 $0.230 $52,184,709 $0.230 $69,579,612 $0.230 Oilseed Hulls $0 $0.000 $0 $0.000 $0 $0.000 Glycerin $8,829,839 $0.058 $13,244,758 $0.058 $17,659,678 $0.058 Provincial Producer Payment $0 $0.000 $0 $0.000 $0 $0.000 Federal Biodiesel Incentive $0 $0.000 $0 $0.000 $0 $0.000 Total Revenue $151,576,893 $1.001 $227,365,340 $1.001 $303,153,787 $1.001 Production & Operating Expenses Feedstocks $121,928,058 $0.805 $182,892,086 $0.805 $243,856,115 $0.805 Chemicals & Catalysts $7,109,649 $0.047 $10,664,473 $0.047 $14,219,297 $0.047 Natural Gas $1,987,560 $0.013 $2,981,339 $0.013 $3,975,119 $0.013 Electricity $939,933 $0.006 $1,409,899 $0.006 $1,879,865 $0.006 Makeup Water $1,188,930 $0.008 $1,783,395 $0.008 $2,377,860 $0.008 Effluent Treatment & Disposal $255,987 $0.002 $383,980 $0.002 $511,974 $0.002 Direct Labor & Benefits $556,083 $0.004 $756,327 $0.003 $975,513 $0.003 Total Production Costs $133,966,198 $0.885 $200,871,500 $0.884 $267,795,743 $0.884 Gross Profit $17,610,695 $0.116 $26,493,840 $0.117 $35,358,043 $0.117 Administrative & Operating Expenses Land Lease (Annual) $0 $0.000 $0 $0.000 $0 $0.000 Maintenance Materials & Services $1,058,335 $0.007 $1,466,320 $0.006 $1,711,640 $0.006 Repairs & Maintenance, Wages & Benefits $451,902 $0.003 $501,963 $0.002 $553,377 $0.002 Property Taxes & Insurance $1,089,387 $0.007 $1,500,657 $0.007 $1,748,487 $0.006 Admin. Salaries, Wages & Benefits $330,132 $0.002 $418,077 $0.002 $524,964 $0.002 Office/Lab Supplies & Miscellaneous $171,370 $0.001 $171,370 $0.001 $171,370 $0.001 Total Administrative & Operating Expenses $3,101,126 $0.020 $4,058,387 $0.018 $4,709,838 $0.016 EBITDA $14,509,569 $0.096 $22,435,453 $0.099 $30,648,205 $0.101 Less: Interest - Operating Line of Credit $0 $0.000 $0 $0.000 $0 $0.000 Interest - Senior Debt $3,772,073 $0.025 $5,222,825 $0.023 $6,159,618 $0.020 Interest - Subordinated Debt $0 $0.000 $0 $0.000 $0 $0.000 Depreciation & Amortization $4,319,327 $0.029 $5,935,495 $0.026 $6,908,315 $0.023 Current Income Taxes $0 $0.000 $0 $0.000 $0 $0.000 $0 $0.000 $0 $0.000 $0 $0.000 Year 2 Annual Net Earnings Before Income Taxes $6,418,169 $0.042 $11,277,134 $0.050 $17,580,273 $ Year Average Annual Pre-Tax Income $7,170,000 $0.047 $12,119,000 $0.053 $18,125,000 $ Year Average Annual Pre-Tax ROI 20.7% 25.2% 32.0% BBI Biofuels Canada 9-5 7/10/2006
83 Figure 9-1 Projected Annual ROI for a 151 MMLY Biodiesel Plant Biodiesel Price = 72.6 cents/l; Canola price = $368/tonne Pre-Tax ROI (%) 40% 35% 30% 25% 20% 15% 10% 5% 0% -5% -10% Projected Annual Return on Investment Year Avg. Figure 9-2 Projected Annual ROI for a 227 MMLY Biodiesel Plant Biodiesel Price = 72.6 cents/l; Canola price = $368/tonne 50% Projected Annual Return on Investment 40% Pre-Tax ROI (%) 30% 20% 10% 0% -10% Year Avg. BBI Biofuels Canada 9-6 7/10/2006
84 Figure 9-3 Projected Annual ROI for a 303 MMLY Biodiesel Plant Biodiesel Price = 72.6 cents/l; Canola price = $368/tonne Pre-Tax ROI (%) 60% 50% 40% 30% 20% 10% -10% Projected Annual Return on Investment 0% Year Avg. Breakeven Analysis The variables that have the greatest impact on the project s profitability are related to the cost of the feedstock, the capital cost for the plant, and the selling price of the biodiesel and glycerol products. A series of breakeven analyses were run to determine the breakeven prices for feedstock and products, for 151, 227 and 303 MMLY plants. Pre-tax income varies from year-to-year in the financial projections due to depreciation and assumptions regarding inflation. The breakeven analysis results presented here are based on the average annual pre-tax income for the project in the ten years following construction and startup of the facility. The breakeven analysis for the 151 MMLY biodiesel production plant is shown in Table 9-5, using a canola price of $368/tonne and a biodiesel price of 72.6 cents per litre as the basis. The breakeven analysis for the 227 MMLY biodiesel production plant is shown in Table 9-6, while the breakeven analysis for the 303 MMLY biodiesel production plant shown in Table 9-7. BBI Biofuels Canada 9-7 7/10/2006
85 Table 9-5 Breakeven Analysis for a 151 MMLY Biodiesel Plant 150 MMLPY Plant 40 MMGPY Oilseed Price and Biodiesel Price Sensitivity 10-Year Average Annual Pre-Tax Income Canola Council of Canada Biodiesel Feasibility Analysis Biodiesel ($/gallon) May 27/2006 Oilseed ($/bu) ,500,753 15,599,442 19,698,106 23,796,795 27,895,458 31,994,103 36,092,655 40,191,233 44,289,812 48,388,364 52,486, ,503,684 12,602,374 16,701,037 20,799,726 24,898,390 28,997,079 33,095,696 37,194,274 41,292,853 45,391,405 49,489, ,506,642 9,605,331 13,703,995 17,802,684 21,901,347 26,000,037 30,098,700 34,197,341 38,295,920 42,394,472 46,493, ,503,825 6,608,289 10,706,952 14,805,642 18,904,305 23,002,995 27,101,658 31,200,347 35,298,987 39,397,539 43,496, (1,563,142) 3,611,221 7,709,884 11,808,573 15,907,236 20,005,926 24,104,589 28,203,278 32,301,968 36,400,580 40,499, (6,282,917) 147,075 4,712,841 8,811,531 12,910,194 17,008,884 21,107,547 25,206,236 29,304,926 33,403,589 37,502, (11,002,692) (4,572,700) 1,680,636 5,814,489 9,913,152 14,011,841 18,110,504 22,209,194 26,307,883 30,406,547 34,505, (15,722,406) (9,292,414) (2,862,360) 2,808,310 6,916,083 11,014,773 15,113,436 19,212,125 23,310,815 27,409,478 31,508, (20,442,181) (14,012,189) (7,582,135) (1,152,143) 3,917,658 8,017,730 12,116,393 16,215,083 20,313,772 24,412,436 28,511, (25,161,895) (18,731,903) (12,301,849) (5,871,857) 558,196 5,020,662 9,119,325 13,218,014 17,316,704 21,415,367 25,514, (29,881,670) (23,451,678) (17,021,624) (10,591,632) (4,161,579) 1,987,255 6,122,282 10,220,972 14,319,661 18,418,325 22,517, (34,601,445) (28,171,453) (21,741,400) (15,311,407) (8,881,354) (2,451,362) 3,112,794 7,223,930 11,322,619 15,421,282 19,519, (39,321,159) (32,891,167) (26,461,113) (20,031,121) (13,601,068) (7,171,076) (741,022) 4,222,143 8,325,551 12,424,214 16,522, (44,040,934) (37,610,942) (31,180,889) (24,750,896) (18,320,843) (11,890,851) (5,460,797) 969,195 5,328,508 9,427,171 13,525, (48,760,709) (42,330,717) (35,900,664) (29,470,672) (23,040,618) (16,610,626) (10,180,573) (3,750,580) 2,293,872 6,430,129 10,528, (53,480,423) (47,050,431) (40,620,378) (34,190,386) (27,760,332) (21,330,340) (14,900,286) (8,470,294) (2,040,302) 3,417,279 7,531, (58,200,198) (51,770,206) (45,340,153) (38,910,161) (32,480,107) (26,050,115) (19,620,062) (13,190,069) (6,760,077) (330,024) 4,526, Biodiesel ($/liter) Oilseed ($/tonne) BBI Biofuels Canada 9-8 7/10/2006
86 Table 9-6 Breakeven Analysis for a 227 MMLY Biodiesel Plant 230 MMLPY Plant 60 MMGPY Oilseed Price and Biodiesel Price Sensitivity 10-Year Average Annual Pre-Tax Income Canola Council of Canada Biodiesel Feasibility Analysis Biodiesel ($/gallon) May 27/2006 Oilseed ($/bu) ,700,477 24,848,498 30,996,519 37,144,540 43,292,535 49,440,473 55,588,328 61,736,183 67,884,037 74,031,892 80,179, ,204,900 20,352,921 26,500,942 32,648,963 38,796,958 44,944,979 51,092,915 57,240,770 63,388,625 69,536,480 75,684, ,709,324 15,857,345 22,005,366 28,153,387 34,301,382 40,449,403 46,597,424 52,745,357 58,893,212 65,041,067 71,188, ,213,747 11,361,768 17,509,789 23,657,810 29,805,805 35,953,826 42,101,847 48,249,868 54,397,800 60,545,654 66,693, (23,114) 6,866,191 13,014,213 19,162,234 25,310,228 31,458,249 37,606,270 43,754,292 49,902,313 56,050,242 62,198, (7,102,747) 2,311,034 8,518,636 14,666,657 20,814,652 26,962,673 33,110,694 39,258,715 45,406,736 51,554,757 57,702, (14,182,379) (4,537,360) 4,008,042 10,171,080 16,319,075 22,467,096 28,615,117 34,763,138 40,911,159 47,059,180 53,207, (21,262,011) (11,616,992) (1,971,973) 5,672,073 11,823,498 17,971,519 24,119,541 30,267,562 36,415,583 42,563,604 48,711, (28,341,643) (18,696,624) (9,051,605) 593,414 7,327,922 13,475,943 19,623,964 25,771,985 31,920,006 38,068,027 44,216, (35,421,275) (25,776,256) (16,131,237) (6,486,218) 2,772,333 8,980,366 15,128,387 21,276,408 27,424,430 33,572,451 39,720, (42,500,907) (32,855,888) (23,210,869) (13,565,850) (3,920,770) 4,464,769 10,632,811 16,780,832 22,928,853 29,076,874 35,224, (49,580,539) (39,935,520) (30,290,501) (20,645,483) (11,000,402) (1,355,383) 6,128,800 12,285,255 18,433,276 24,581,297 30,729, (56,660,171) (47,015,152) (37,370,134) (27,725,115) (18,080,034) (8,435,016) 1,210,003 7,789,679 13,937,700 20,085,721 26,233, (63,739,742) (54,094,723) (44,449,704) (34,804,685) (25,159,605) (15,514,586) (5,869,567) 3,232,262 9,442,097 15,590,118 21,738, (70,819,374) (61,174,355) (51,529,336) (41,884,318) (32,239,237) (22,594,218) (12,949,200) (3,304,181) 4,921,495 11,094,541 17,242, (77,899,006) (68,253,987) (58,608,969) (48,963,950) (39,318,869) (29,673,851) (20,028,832) (10,383,813) (738,794) 6,585,526 12,746, (84,978,639) (75,333,620) (65,688,601) (56,043,582) (46,398,502) (36,753,483) (27,108,464) (17,463,445) (7,818,426) 1,817,969 8,249, Biodiesel ($/liter) Oilseed ($/tonne) BBI Biofuels Canada 9-9 7/10/2006
87 Table 9-7 Breakeven Analysis for a 303 MMLY Biodiesel Plant 300 MMLPY Plant 80 MMGPY Oilseed Price and Biodiesel Price Sensitivity 10-Year Average Annual Pre-Tax Income Canola Council of Canada Biodiesel Feasibility Analysis Biodiesel ($/gallon) May 27/2006 Oilseed ($/bu) ,062,456 35,259,809 43,457,161 51,654,514 59,851,893 68,049,121 76,246,252 84,443,383 92,640, ,837, ,034, ,068,345 29,265,698 37,463,050 45,660,403 53,857,782 62,055,135 70,252,360 78,449,491 86,646,622 94,843, ,040, ,074,234 23,271,587 31,468,939 39,666,292 47,863,671 56,061,024 64,258,376 72,455,599 80,652,729 88,849,860 97,046, ,080,123 17,277,476 25,474,828 33,672,181 41,869,560 50,066,913 58,264,265 66,461,618 74,658,837 82,855,968 91,053, ,002,954 11,283,391 19,480,744 27,678,097 35,875,476 44,072,828 52,270,181 60,467,534 68,664,886 76,862,102 85,059, (6,092,741) 5,265,565 13,486,633 21,683,986 29,881,365 38,078,717 46,276,070 54,473,423 62,670,775 70,868,128 79,065, (15,532,230) (2,672,184) 7,484,261 15,689,875 23,887,254 32,084,606 40,281,959 48,479,312 56,676,664 64,874,017 73,071, (24,971,719) (12,111,673) 748,372 9,695,764 17,893,143 26,090,495 34,287,848 42,485,201 50,682,553 58,879,906 67,077, (34,411,269) (21,551,224) (8,691,178) 3,616,192 11,899,058 20,096,411 28,293,763 36,491,116 44,688,469 52,885,821 61,083, (43,850,758) (30,990,713) (18,130,667) (5,270,621) 5,874,550 14,102,300 22,299,652 30,497,005 38,694,358 46,891,710 55,089, (53,290,247) (40,430,202) (27,570,156) (14,710,110) (1,850,126) 8,093,247 16,305,541 24,502,894 32,700,247 40,897,599 49,094, (62,729,736) (49,869,691) (37,009,645) (24,149,600) (11,289,615) 1,570,430 10,311,430 18,508,783 26,706,136 34,903,488 43,100, (72,169,287) (59,309,241) (46,449,196) (33,589,150) (20,729,166) (7,869,120) 4,229,428 12,514,699 20,712,051 28,909,404 37,106, (81,608,776) (68,748,730) (55,888,685) (43,028,639) (30,168,655) (17,308,609) (4,448,563) 6,483,519 14,717,940 22,915,293 31,112, (91,048,265) (78,188,219) (65,328,174) (52,468,128) (39,608,144) (26,748,098) (13,888,052) (1,028,007) 8,702,216 16,921,182 25,118, (100,487,815) (87,627,770) (74,767,724) (61,907,678) (49,047,694) (36,187,648) (23,327,603) (10,467,557) 2,370,110 10,920,930 19,124, (109,927,304) (97,067,259) (84,207,213) (71,347,167) (58,487,183) (45,627,137) (32,767,092) (19,907,046) (7,047,001) 4,842,288 13,130, Biodiesel ($/liter) Oilseed ($/tonne) BBI Biofuels Canada /10/2006
88 For a 151 MMLY plant (Table 9-5), the breakeven price for biodiesel is 68 cents/litre with canola at $368/tonne. With biodiesel selling for 72.6 cents/litre, the crude corn-oil only plant will continue to be cash flow positive for a feedstock cost up to $390/tonne. For a 227 MMLY plant (Table 9-6), the breakeven price for biodiesel is 67.2 cents/litre with canola at $368/tonne. With biodiesel selling for 72.6 cents/litre, the crude corn-oil only plant will continue to be cash flow positive for a feedstock cost up to $393/tonne. For a 303 MMLY plant (Table 9-7), the breakeven price for biodiesel is 66.6 cents/litre with canola at $368/tonne. With biodiesel selling for 72.6 cents/litre, the crude corn-oil only plant will continue to be cash flow positive for a feedstock cost up to $396/tonne. A comparison of the results of the breakeven analyses shows that as the scale of the facility is increased, so too is the plant s resiliency to feedstock price increases and biodiesel price decreases. A 151 MMLY plant can tolerate 6.3% drop in biodiesel price, or a 6.0% increase in canola prices and remain cash flow positive. A 227 MMLY plant will remain cash flow positive even if the biodiesel price drops by 7.4%, or the canola price increases by 6.8%. At 303 MMLY, the plant remains cash flow positive even if the canola price increases by 7.6%, or the biodiesel price drops by 8.6%. Sensitivity Analysis Additional sensitivity analyses demonstrating the effect of key production parameters on the average annual pre-tax ROI were performed for each of the biodiesel production scales. As shown in the following figures, the project is most sensitive to the cost of canola (Figure 9-4) and the selling prices of biodiesel and the glycerol/protein meal co-products (Figures 9-5, 9-6, and 9-8, respectively). The impact of the price of protein meal is important, because there will be a significant increase in the quantity of canola meal produced, and significant price competition with other sources of protein meal. Thus, it is conceivable that the price of canola meal could drop below the historical price of $181/tonne. Similarly, there is currently an oversupply situation in the glycerine market, which could drive prices down further. It is apparent from Figure 9-6 that biodiesel plants could survive a 50% reduction in glycerine price, and remain profitable. The impact of capital cost on projected ROI is shown in Figure 9-7. As discussed previously, capital cost is an important factor a variation by +/- 25% changes the ROI by +/- 10%. The cost of electricity has a relatively small impact the ROI varies by about 6 percentage points for an electricity price ranging from 0.04 up to 0.14 cents/kwh. Similarly, the cost of natural gas is not a significant factor the ROI changes by about 7 to 8 percentage points when the natural gas price increases from $6.00 up to $14.00 per MM BTU. However, if refined glycerine were produced, a much greater sensitivity to natural gas prices would be observed. The cost of chemicals has a slightly greater impact doubling the chemical cost would reduce the ROI by about 18 to 20 percentage points. BBI Biofuels Canada /10/2006
89 Figure 9-4(a) Sensitivity to the Price of Canola Large Plants Baseline Canola Price = $368/tonne; Baseline Biodiesel Price = 72.6 cents/l Oilseed Price Sensitivity Pre-tax ROI 120.0% 100.0% 80.0% 60.0% 40.0% 20.0% 0.0% -20.0% -40.0% -60.0% $7.00 $7.50 $8.00 $8.50 $9.00 $9.50 Average Oilseed Price ($/bu) 80 MMGPY 60 MMGPY 40 MMGPY Figure 9-4(b) Sensitivity to the Price of Canola Small Plants Baseline Canola Price = $368/tonne; Baseline Biodiesel Price = 72.6 cents/l Oilseed Price Sensitivity Pre-tax ROI 120.0% 100.0% 80.0% 60.0% 40.0% 20.0% 0.0% -20.0% $6.00 $6.50 $7.00 $7.50 $8.00 $8.50 Average Oilseed Price ($/bu) 30 MMGPY 20 MMGPY 10 MMGPY BBI Biofuels Canada /10/2006
90 Figure 9-5(a) Project Sensitivity to the Selling Price of Biodiesel Large Plants Baseline Canola Price = $368/tonne; Baseline Biodiesel Price = 72.6 cents/l Pre-tax ROI 100.0% 80.0% 60.0% 40.0% 20.0% 0.0% -20.0% -40.0% -60.0% -80.0% Biodiesel Price Sensitivity $0.50 $0.60 $0.70 $0.80 $0.90 Biodiesel Price ($/litre) 80 MMGPY 60 MMGPY 40 MMGPY Figure 9-5(b) Project Sensitivity to the Selling Price of Biodiesel Small Plants Baseline Canola Price = $368/tonne; Baseline Biodiesel Price = 72.6 cents/l Pre-tax ROI 80.0% 60.0% 40.0% 20.0% 0.0% -20.0% -40.0% -60.0% -80.0% Biodiesel Price Sensitivity $0.50 $0.60 $0.70 $0.80 $0.90 Biodiesel Price ($/litre) 30 MMGPY 20 MMGPY 10 MMGPY BBI Biofuels Canada /10/2006
91 Figure 9-6(a) Project Sensitivity to the Selling Price of Glycerol Large Plants Baseline Canola Price = $368/tonne; Baseline Biodiesel Price = 72.6 cents/l Glycerol Price Sensitivity Pre-tax ROI 80.0% 70.0% 60.0% 50.0% 40.0% 30.0% 20.0% 10.0% 0.0% $0 $200 $400 $600 $800 $1,000 $1,200 $1,400 Glycerol Price ($/tonne) 80 MMGPY 60 MMGPY 40 MMGPY Figure 9-6(b) Project Sensitivity to the Selling Price of Glycerol Small Plants Baseline Canola Price = $368/tonne; Baseline Biodiesel Price = 72.6 cents/l Glycerol Price Sensitivity Pre-tax ROI 60.0% 50.0% 40.0% 30.0% 20.0% 10.0% 0.0% -10.0% -20.0% -30.0% $0 $200 $400 $600 $800 $1,000 $1,200 $1,400 Glycerol Price ($/tonne) 30 MMGPY 20 MMGPY 10 MMGPY BBI Biofuels Canada /10/2006
92 Figure 9-7(a) - Project Sensitivity to the Capital Cost Estimate Large Plants Baseline Canola Price = $368/tonne; Baseline Biodiesel Price = 72.6 cents/l Sensitivity to Capital Cost Estimate Pre-tax ROI 80.0% 70.0% 60.0% 50.0% 40.0% 30.0% 20.0% 10.0% 0.0% 50% 75% 100% 125% 150% 175% Capital Cost Estimate Factor 80 MMGPY 60 MMGPY 40 MMGPY Figure 9-7(b) - Project Sensitivity to the Capital Cost Estimate Small Plants Baseline Canola Price = $368/tonne; Baseline Biodiesel Price = 72.6 cents/l Sensitivity to Capital Cost Estimate Pre-tax ROI 25.0% 20.0% 15.0% 10.0% 5.0% 0.0% -5.0% -10.0% -15.0% -20.0% 75% 100% 125% 150% 175% 200% Capital Cost Estimate Factor 30 MMGPY 20 MMGPY 10 MMGPY BBI Biofuels Canada /10/2006
93 Figure 9-8(a) - Project Sensitivity to the Protein Meal Price Large Plants Baseline Canola Price = $368/tonne; Baseline Biodiesel Price = 72.6 cents/l Protein Meal Price Sensitivity 200.0% Pre-tax ROI 150.0% 100.0% 50.0% 0.0% -50.0% Protein Meal Price ($/tonne) 80 MMGPY 60 MMGPY 40 MMGPY Figure 9-8(b) - Project Sensitivity to the Protein Meal Price Small Plants Baseline Canola Price = $368/tonne; Baseline Biodiesel Price = 72.6 cents/l Protein Meal Price Sensitivity 150.0% Pre-tax ROI 100.0% 50.0% 0.0% -50.0% Oilseed Meal Price ($/tonne) 30 MMGPY 20 MMGPY 10 MMGPY BBI Biofuels Canada /10/2006
94 Figure 9-9(a) Sensitivity to the Price of Natural Gas Large Plants Baseline Canola Price = $368/tonne; Baseline Biodiesel Price = 72.6 cents/l Natural Gas Price Sensitivity Pre-tax ROI 40.0% 20.0% 0.0% -20.0% -40.0% -60.0% -80.0% % Natural Gas Price ($/MMBTU) 80 MMGPY 60 MMGPY 40 MMGPY Figure 9-9(b) Sensitivity to the Price of Natural Gas Small Plants Baseline Canola Price = $368/tonne; Baseline Biodiesel Price = 72.6 cents/l Natural Gas Price Sensitivity Pre-tax ROI 40.0% 20.0% 0.0% -20.0% -40.0% -60.0% -80.0% % Natural Gas Price ($/MMBTU) 30 MMGPY 20 MMGPY 10 MMGPY BBI Biofuels Canada /10/2006
95 Figure 9-10(a) Sensitivity to the Price of Electricity Large Plants Baseline Canola Price = $368/tonne; Baseline Biodiesel Price = 72.6 cents/l Electricity Price Sensitivity Pre-tax ROI 40.0% 20.0% 0.0% -20.0% -40.0% -60.0% -80.0% % Electricity Price ($/kwh) 80 MMGPY 60 MMGPY 40 MMGPY Figure 9-10(b) Sensitivity to the Price of Electricity Small Plants Baseline Canola Price = $368/tonne; Baseline Biodiesel Price = 72.6 cents/l Electricity Price Sensitivity Pre-tax ROI 40.0% 20.0% 0.0% -20.0% -40.0% -60.0% -80.0% % Electricity Price ($/kwh) 30 MMGPY 20 MMGPY 10 MMGPY BBI Biofuels Canada /10/2006
96 Section Summary and Analysis The financial analysis has demonstrated that a canola-based biodiesel industry can be viable, IF canola prices remain at or near historical levels ($368/tonne), and IF the selling price of biodiesel is at least 72 cents/l, preferably greater than 75 cents/l. Based on current wholesale prices for biodiesel, this price can only be achieved if Alberta and Saskatchewan extend their road tax exemption to all biofuels (currently, the exemption only applies to ethanol). Based on the feedstock and biodiesel pricing levels outlined above, only the large scale plant scenario would be a reasonable investment; 38 MMLY plants would still have a negative ROI, and 76 MMLY plants would only show a slightly positive ROI, with little resilience against changes in market prices. Consequently, the macroeconomics assessment in Section X will be based on the large scale scenario, which includes: (1) Alberta: a 76 MMLY plant in the Peace Region, a 114 MMLY plant near Calgary, and a 189 MMLY plant east of Edmonton, near Vegreville (2) Saskatchewan: a 76 MMLY plant in the southwest, a 151 MMLY plant near Lanigan, a 189 MMLY plant in the southeast, an 227 MMLY plant in the region northwest of Saskatoon, and another 151 MMLY plant in the east-central region of the province, near Prairie River (3) Manitoba: a 151 MMLY plant near the branch point of the Yellowhead and TransCanada highways, near Portage La Prairie. Under such a large-scale scenario, plants could tolerate a 3 to 5 cent (short-term) drop in biodiesel prices, and remain cash-flow positive; similarly, with biodiesel at 72.6 cents per litre, plants could tolerate a 4 to 7% (short-term) increase in canola prices (i.e., $15 to $25/tonne) and remain cash flow positive. Canola prices reached (or exceeded) these levels in 2003, and from 1995 to The sensitivity analyses have identified several other significant factors that may influence the viability of a canola-based biodiesel industry, including the price of the glycerine and canola-meal byproducts, and plant capital cost. A 114 MMLY plant could tolerate a sustained 12% drop in canola meal prices (i.e., to ~160/tonne) before its ROI would be negative, while a 151 MMLY plant could tolerate a canola meal price reduction to ~145/tonne before posting negative returns. A 227 MMLY plant is more resilient, and would only produce negative returns if the canola price dropped 30% (below $128/tonne), while an 303 MMLY plant is able to tolerate a 34% crop in price, to $121/tonne. The glycerine byproduct is also currently experiencing a market glut, and prices are depressed. The additional glycerine arising from biodiesel production may further depress prices, although there are new uses being developed, and glycerine is becoming a cost-effective substitute for petroleum-based products at current low price levels, suggesting that there is likely a floor in glycerine prices. In the context of the current BBI Biofuels Canada /10/2006
97 biodiesel scenarios, a 60% reduction in the price of glycerol (to ~$220/tonne) would reduce the ROI, but plants would still have a positive return on investment, ranging from 7 to 14% for 151 to 303 MMLY plants. However, at this price, a 78 MMLY (20 MMGPY) plant would post negative returns. Nonetheless, while the price of glycerol is important, facilities would have some resiliency against further depression in glycerol prices. Plant capital cost is an important parameter, and influences ROI through its impact on debt servicing costs. However, it is not the over-riding factor that influences the viability of a plant. Government assistance with capital financing will definitely be helpful, and improve the ROI, but it cannot overcome the adverse effects of very low biodiesel prices or very high canola prices. For example, with biodiesel at 66 cents/l and canola at $368/tonne, a 25% co-payment of capital cost would improve the ROI by about 8 to 9%, but the ROIs for 151 MMLY and 227 MMLY plants would still be negative. Thus, Government assistance in the form of a capital co-payment alone is not sufficient to ensure the viability of a canola-based biodiesel industry if biodiesel prices remain at 66 cents per litre, which is the level projected based on 2005 wholesale prices plus the Federal excise tax exemption. However, with biodiesel prices at 72.6 cents per litre, the sensitivity analyses show that a 25% reduction in capital cost would improve the ROI by 12 to 15%. This demonstrates that the impact of a 25% capital co-payment increases as the price of the biodiesel product increases (or feedstock prices decrease), but biodiesel prices must increase beyond their 2005 prices, and/or some form of Provincial road tax exemption must be in place in order for a capital co-payment scheme to have a meaningful impact. Comments on Profitability and Economic Forecasts The word profitability is a general term for the measure of the amount of profit that can be obtained from a given situation. Total profit alone cannot be used as the deciding factor in determining if an investment should be made, however. Many factors must be considered when deciding if a return is acceptable, and it is not possible to give one figure that will apply for all investment situations. There are many methods for measuring or estimating profitability: return on investment, internal rate of return, net present value and payback period are just a few. In this report we have used return on investment, ROI, as the primary measure of the estimated project profitability. Return on investment does not take into account the time value of money. The time value of money is the concept that a dollar today is worth more than a dollar a year from now due to inflation. When dealing with common industrial operations, profits cannot be predicted with absolute accuracy. Risk factors must be given careful consideration and the degree of uncertainty in estimated returns on investments plays an important role in determining what returns are acceptable (higher risk should equal higher returns). Because of the inherent risk, a 15% return before income taxes is usually the minimum acceptable return for any type of business proposition, even if the economics appear to be completely sound and reliable. Some companies require a 30% pretax return before they BBI Biofuels Canada /10/2006
98 will consider investing capital in a project. A 25% rate of return is considered the minimal acceptable return for a biofuels project by many investors. The economic forecasts and projected profitability presented in this report are estimates only. When dealing with commodities such as grains and transportation fuels (the two main drivers in the project s profitability), one can only make an educated guess as to what the future may hold. Additional project risk factors are discussed in the Summary and Recommendations section of this report. That said, BBI has used its experience and expertise to provide our best estimate as to the project s future profitability. The sensitivity studies provided in this report show the possible wide swings in the project s profitability when the economic forecast model input assumptions change. The impact of changes in feedstock costs, product revenues, energy costs and other project variables should be well understood by the client and by potential developers of biofuels facilities. BBI Biofuels Canada /10/2006
99 X: INDUSTRY WIDE FINANCIAL ANALYSIS AND IMPACT OF A RENEWABLE FUELS STANDARD The implementation of a 5% renewable fuels standard (RFS) would require 1.2 billion litres of biodiesel annually, while a 10% RFS would require 2.4 billion litres of annual biodiesel production. A 2% RFS, which may be an interim step towards a 5% or 10% RFS, would require 470 MMLY of biodiesel. As demonstrated in Section IX, the small-scale (or local) production scenario requires significantly higher biodiesel prices (or lower canola prices) to ensure viability, while the large scale production scenario, with 9 plants ranging in size from 78 to 227 MMLY, would be viable with biodiesel prices approaching 72 to 75 cents per litre, and canola prices at $368/tonne, $15/tonne greater than the most recent 5-year average. Based on historical canola production, the total biodiesel production capacity obtained under this scenario is ~1.3 billion litres per year, about 10% more than the total required for a 5% RFS. If 2005 canola production levels were sustained (and the excess over the historical average were directed entirely to biodiesel), biodiesel production could reach ~2.2 billion litres per year, about 10% less than the total required for a 10% RFS. Under this scenario, 9 plants could be constructed, ranging in size from 114 to 303 MMLY. However, it is likely that a biodiesel industry will not be based on canola alone, given the development of the Rothsay and Biox plants in Eastern Canada that use FOG (fats, oils and greases), and possible competition with other imported oils, such as palm oil. This may imply a smaller number of plants constructed, or, if the full suite of plants is built, attention will need to be directed to development of export markets for biodiesel. The goal of this section is to outline the total, direct economic impact of the 9 aforementioned canola-based biodiesel facilities, including capital investment, government income from taxes, employment, impact on farm income, and direct economic activity due to the operations of chemical producers, grain handling and transportation companies, and marketing agencies needed to support a biodiesel industry. These results will be presented in three parts. Initially, a scenario will be developed based on three 40 MMGPY (152 MMLY) plants one each in Alberta, Saskatchewan, and Manitoba essentially equivalent to a 2% RFS that may be considered as an interim step on the path towards a 5% or 10% RFS. In the second case, the large scale production scenario based on historical canola production will be evaluated. This scenario is based on 9 plants, from 78 to 227 MMLY in scale, and is essentially equivalent to that required for a 5% RFS. In the final part, the large scale scenario based on 2005 production levels will be evaluated. This scenario is also based on 9 plants, from 114 to 303 MMLY in scale, and is essentially equivalent to that for a 10% RFS. These scenarios have different biodiesel price points at which the industry is viable 75 cents/l for the 2% and 5% RFS, and 72.6 cents/l for the 10% RFS. The scenarios listed below are based on these respective biodiesel price points, because it is unlikely that investments would be made, or lender support obtained, below these price points, at least for the smaller scale plants. Industry-Wide Proforma 2% RFS This scenario is an incremental step leading to the adoption of a 5% RFS, discussed in the next section. It is based on the construction of three plants, each 152 MMLY in scale, with one plant in each of the Prairie Provinces. Plants are likely to be located in the regions with the largest feedstock base identified in Figure 4-7; expansion to a 5% RFS could then be achieved by constructing the remaining six plants shown in Figure 4-7. BBI Biofuels Canada /10/2006
100 With biodiesel prices >75 cents/l and canola at $368/tonne, each of these 152 MMLY plants constructed to satisfy a 2% RFS would have a pre-tax ROI of 30%. The collective revenues and expenses for the 3 plants are shown in Table 10-1, along with the revenues and expenses that would be generated in each province. Collectively, the three plants would earn approximately $466 million dollars in annual revenues, with ~70% of those revenues derived from biodiesel. Collectively, the plants would incur $402 million in production costs, with over 90% of those costs associated with the purchase of canola from local/regional producers. As shown in Table 10-2, construction of canola-based biodiesel plants to satisfy a 2% RFS would require a capital investment of $209 MM, equally split across the three Prairie Provinces. These plants would generate $6.5 million in direct Federal tax revenues, mainly from corporate taxes, and provinces and municipalities would receive a further $5.8 MM in tax revenues, either through manufacturing and capital taxes, property taxes, or employee income taxes. The total direct employment in biodiesel facilities supporting a 2% RFS is 69 people, including administrative/managerial staff, production labour, and maintenance staff (Table 10-3). There is significant spin-off economic activity arising directly from the operations of the biodiesel facilities. The transportation will benefit, as plants bring in feedstock by truck and rail, and ship biodiesel, glycerine and canola meal by truck or rail. The plant locations are intended to facilitate feedstock movement primarily by truck (usually within 150 km of the plant), whereas products are generally shipped over much larger distances, into regional, national and international markets. Shipments by rail and intermodal shipments by rail/boat thus dominate the delivery of products. As shown in Table 10-4, the transportation sector would receive $11MM in annual revenues from biodiesel plants under a 2% RFS scenario. Other direct spin-off activity includes grain handling companies that receive a fee for storage and handling of feedstock, marketing organizations that receive commissions for sale of biodiesel, protein meal and glycerine, and chemical companies that supply methanol and other process chemicals to the biodiesel plants. Total revenues associated with these spin-off activities (including transportation) is $38 MM annually (Table 10-4). Based on historical operating margins in these sectors, a further $5 to $8MM in taxable income would therefore be generated. The farming community is a significant benefactor of a canola-based biodiesel industry. With a 2% RFS, and canola prices at $368/tonne, payments by the plants to producers would total $366 million annually, representing 6% of historical crop revenues to grain and oilseed farmers in Alberta, Saskatchewan and Manitoba (Table 10-5). Furthermore, owing to the $15/tonne basis increase, this represents an incremental increase in income of $15 MM annually compared to historical average prices. Given that the average canola seed price in 2005 was $288/tonne, a purchase price of $368/tonne would represent an additional $80 MM in farm income based on 2005 pricing and production levels. Canola production to support a 2% RFS would require about 1.8 million acres (7 hundred thousand Ha) of land. Suppliers of seed, fertilizer, and herbicides and chemicals would receive ~$150 MM in annual revenues, directly in support of canola production dedicated to biodiesel production (Table 10-6). With a 15 to 30% gross margin, this represents $21 to $30 MM in taxable revenues tied to the production of biodiesel under a 2% RFS. BBI Biofuels Canada /10/2006
101 Table 10-1: Proforma Income Statement Canola-Based Biodiesel Industry 2% RFS Proforma Income Statement for Year 2 (in Millions of Dollars) Industry Location Total Alberta Saskatchewan Manitoba Net Revenue Biodiesel $334.7 $111.6 $111.6 $111.6 Oilseed Meal $104.4 $34.8 $34.8 $34.8 Oilseed Hulls $0.0 $0.0 $0.0 $0.0 Glycerin $26.5 $8.8 $8.8 $8.8 Provincial Producer Payment $0.0 $0.0 $0.0 $0.0 Federal Biodiesel Incentive $0.0 $0.0 $0.0 $0.0 Total Revenue $465.5 $155.2 $155.2 $155.2 Production & Operating Expenses Feedstocks $365.8 $121.9 $121.9 $121.9 Chemicals & Catalysts $21.3 $7.1 $7.1 $7.1 Natural Gas $6.0 $2.0 $2.0 $2.0 Electricity $2.8 $0.9 $0.9 $0.9 Denaturants $0.0 $0.0 $0.0 $0.0 Makeup Water $3.6 $1.2 $1.2 $1.2 Effluent Treatment & Disposal $0.8 $0.3 $0.3 $0.3 Direct Labor & Benefits $1.7 $0.6 $0.6 $0.6 Total Production Costs $401.9 $134.0 $134.0 $134.0 Gross Profit $63.6 $21.2 $21.2 $21.2 Administrative & Operating Expenses Land Lease (Annual) $0.0 $0.0 $0.0 $0.0 Maintenance Materials & Services $3.2 $1.1 $1.1 $1.1 Repairs & Maintenance, Wages & Benefits $1.4 $0.5 $0.5 $0.5 Property Taxes & Insurance $3.3 $1.1 $1.1 $1.1 Admin. Salaries, Wages & Benefits $1.0 $0.3 $0.3 $0.3 Office/Lab Supplies & Miscellaneous $0.5 $0.2 $0.2 $0.2 Total Administrative & Operating Expenses $9.3 $3.1 $3.1 $3.1 EBITDA $54.3 $18.1 $18.1 $18.1 Less: Interest - Operating Line of Credit $0.0 $0.0 $0.0 $0.0 Interest - Senior Debt $11.3 $3.8 $3.8 $3.8 Interest Subordinated Debt $0.0 $0.0 $0.0 $0.0 Depreciation & Amortization $13.0 $4.3 $4.3 $4.3 Current Income Taxes $0.0 $0.0 $0.0 $0.0 $0.0 $0.0 $0.0 $0.0 Year 2 Annual Net Earnings Before Income Taxes $30.0 $10.0 $10.0 $ Year Average Annual Pre-Tax Income $31.6 $10.5 $10.5 $ Year Average Annual Pre-Tax ROI 30.3% BBI Biofuels Canada /10/2006
102 Table 10-2: Capital Investment and Tax Revenue Summary 2% RFS Basis: 2006/07 Tax Rates Location Industry Total Alberta Saskatchewan Manitoba Total Capital Investment, millions $208.5 $69.5 $69.5 $69.5 Federal Corporate Tax at 19.01%, millions $6.0 $2.0 $2.0 $2.0 Provincial Manufacturing Tax, millions $1.2 $1.1 $1.5 Provincial Capital Tax, millions $0.00 $0.42 $0.35 Property Tax, millions $1.1 $0.36 $0.36 $0.36 Federal Income Tax Reveues, millions $0.46 Provincial IncomeTax revenues, millions $0.07 $0.10 $0.11 Total Tax revenues, millions $6.5 $1.6 $1.9 $2.3 Table 10-3: Total Direct Employment in a Biodiesel Industry 2% RFS Biodiesel Production Plant Staffing Requirements Industry Total Employees Administration/Management General Manager 3 Plant Manager 3 Quality Control Manager 3 Controller 0 Commodity Manager 0 Administrative Assistant 3 Production Labor Microbiologist 0 Lab Technician 3 Shift Team Leader 9 Shift Operator 18 Yard/Commodities Labor 3 Maintenance Maintenance Manager 3 Boiler Operator 3 Maintenance Worker 9 Welder 3 Electrician 3 Instrument Technician 3 Total Number of Employees 69 BBI Biofuels Canada /10/2006
103 Table 10-4: New Economic Activity Directly Arising from Biodiesel Production 2% RFS Direct Economic Activity Associated with Biodiesel Plants Sector Revenues, MM$ Transportation - Truck and Rail 11.1 Grain Handling 0.9 Marketing Organizations 5.4 Chemicals 21.1 Total 38 Table 10-5: Direct Impact on Farm Producer Income 2% RFS Direct Impact on Farm Producer Income Farm Producer Revenues millions of $ % of total crop revenues Total 366 6% Incremental, based on 15$/tonne basis increase % Incremental, based on 30$/tonne basis increase % Table 10-6: Economic Activity to Support Farms Producing Canola for a 2% RFS Land and Farm Inputs to Support Biodiesel Production Land, Thousands of Acres 1,754 Land, Thousands of Hectares 710 Seed, MM $ 38 Fertilizer, MM $ 64 Herbicides and Chemicals, MM $ 48 Industry-Wide ProForma 5%RFS. As noted in Section IX, with biodiesel prices >75 cents/l and canola at $368/tonne, each of the plants in the large scale production scenario would be viable, with ROIs ranging from 16 to 36%. The lowest ROIs correspond to the 78 and 114 MMLY plants, because they have not yet captured the full economies of scale of the larger facilities. Nonetheless, the weighted average ROI for the large scale production scenario is 28%. The collective revenues and expenses for the 9 plants are shown in Table 10-7, along with the revenues and expenses that would be generated in each province. In this scenario, most of the production activity is centred in Saskatchewan, and thus, most of the economic activity will also be generated in that province. However, it should be noted that about 15% of the feedstock expenses associated with the Saskatchewan plants are likely to flow to canola producers in BBI Biofuels Canada /10/2006
104 Manitoba, due to the proximity of some of these plants to the provincial border. Collectively, the nine plants would earn approximately $1.36 billion dollars in annual revenues, with ~70% of those revenues derived from biodiesel. Collectively, the plants would incur $1.12 billion in production costs, with over 90% of those costs arising from the purchase of canola. As shown in Table 10-8, construction of canola-based biodiesel plants to satisfy a 5% RFS would involve a total capital investment of $620 MM. Of this total, 30% of the investment would be in Alberta, 59% would be in Saskatchewan, and 11% would be in Manitoba. These plants would generate $18.6 million in direct Federal tax revenues, mainly from corporate taxes, and provinces and municipalities would receive a further $16.5 MM in tax revenues, either through manufacturing and capital taxes, property taxes, or employee income taxes. The total direct employment in biodiesel facilities supporting a 5% RFS is 170 people (Table 10-9). The average salary per employee is ~$47,000 annually, with a range from $26,500 per year for general labour, to $94,000 per year for senior management staff. Under a 5% RFS, spin-off economic activity arising directly from the operations of the biodiesel facilities would include $32 MM to the transportation sector, and a further $80 MM to grain handling companies, marketing organizations that receive commissions for sale of biodiesel, protein meal and glycerine, and chemical companies that supply methanol and other process chemicals to the biodiesel plants (Table 10-10). Based on historical operating margins in these sectors, a further $15 to $25MM in taxable income would therefore be generated. With a 5% RFS, and canola prices at $368/tonne, payments to canola producers would total $1.1 billion annually, representing 17% of historical crop revenues to grain and oilseed farmers in Alberta, Saskatchewan and Manitoba (Table 10-11). Furthermore, owing to the $15/tonne basis increase, this represents an incremental increase in income of $43 MM annually compared to historical average prices. Given that the average canola seed price in 2005 was $288/tonne, a purchase price of $368/tonne would represent an additional $229 MM in farm income based on 2005 pricing and production levels. Canola production to support a 5% RFS would require about 5 million acres (2 million Ha) of land. Suppliers of seed, fertilizer, and herbicides and chemicals would receive ~$430 MM in annual revenues, directly in support of canola produced for biodiesel production (Table 10-12). With a 15 to 30% gross margin, this represents a further $60 to $90 MM in taxable revenues tied to the production of biodiesel under a 5% RFS. BBI Biofuels Canada /10/2006
105 Table 10-7: Proforma Income Statement Canola-Based Biodiesel Industry 5% RFS Proforma Income Statement for Year 2 (in Millions of Dollars) Industry Location Total Alberta Saskatchewan Manitoba Net Revenue Biodiesel $976.1 $278.9 $585.7 $111.6 Oilseed Meal $304.4 $87.0 $182.6 $34.8 Oilseed Hulls $0.0 $0.0 $0.0 $0.0 Glycerin $77.3 $22.1 $46.4 $8.8 Provincial Producer Payment $0.0 $0.0 $0.0 $0.0 Federal Biodiesel Incentive $0.0 $0.0 $0.0 $0.0 Total Revenue $1,357.8 $387.9 $814.7 $155.2 Production & Operating Expenses Feedstocks $1,066.9 $304.8 $640.1 $121.9 Chemicals & Catalysts $62.2 $17.8 $37.3 $7.1 Natural Gas $17.4 $5.0 $10.4 $2.0 Electricity $8.2 $2.3 $4.9 $0.9 Denaturants $0.0 $0.0 $0.0 $0.0 Makeup Water $10.4 $3.0 $6.2 $1.2 Effluent Treatment & Disposal $2.2 $0.6 $1.3 $0.3 Direct Labor & Benefits $5.5 $1.8 $3.1 $0.6 Total Production Costs $1,172.8 $335.3 $703.5 $134.0 Gross Profit $185.0 $52.6 $111.2 $21.2 Administrative & Operating Expenses Land Lease (Annual) $0.0 $0.0 $0.0 $0.0 Maintenance Materials & Services $9.4 $2.8 $5.6 $1.1 Repairs & Maintenance, Wages & Benefits $3.7 $1.1 $2.2 $0.5 Property Taxes & Insurance $9.7 $2.9 $5.7 $1.1 Admin. Salaries, Wages & Benefits $2.6 $0.7 $1.5 $0.3 Office/Lab Supplies & Miscellaneous $1.4 $0.4 $0.8 $0.2 Total Administrative & Operating Expenses $26.8 $8.0 $15.7 $3.1 EBITDA $158.2 $44.6 $95.4 $18.1 Less: Interest - Operating Line of Credit $0.0 $0.0 $0.0 $0.0 Interest - Senior Debt $33.6 $10.1 $19.8 $3.8 Interest - Subordinated Debt $0.0 $0.0 $0.0 $0.0 Depreciation & Amortization $38.6 $11.6 $22.6 $4.3 Current Income Taxes $0.0 $0.0 $0.0 $0.0 $0.0 $0.0 $0.0 $0.0 Year 2 Annual Net Earnings Before Income Taxes $86.0 $22.9 $53.0 $ Year Average Annual Pre-Tax Income $91.0 $24.7 $55.8 $ Year Average Annual Pre-Tax ROI 27.9% BBI Biofuels Canada /10/2006
106 Table 10-8: Capital Investment and Tax Revenue Summary 5% RFS Basis: 2006/07 Tax Rates Location Industry Total Alberta Saskatchewan Manitoba Total Capital Investment, millions $620.7 $186.6 $364.6 $69.5 Federal Corporate Tax at 19.01%, millions $17.3 $4.7 $10.6 $2.0 Provincial Manufacturing Tax, millions $2.8 $5.6 $1.5 Provincial Capital Tax, millions $0.00 $2.19 $0.35 Property Tax, millions $3.2 $0.98 $1.90 $0.36 Federal Income Tax Revenes, millions $1.3 Provincial IncomeTax revenues, millions $0.20 $0.54 $0.11 Total Tax revenues, millions $18.6 $4.0 $10.2 $2.3 Table 10-9: Total Direct Employment in a Biodiesel Industry 5% RFS Biodiesel Production Plant Staffing Requirements Industry Total Employees Administration/Management General Manager 7 Plant Manager 7 Quality Control Manager 6 Controller 1 Commodity Manager 0 Administrative Assistant 7 Production Labor Microbiologist 0 Lab Technician 8 Shift Team Leader 24 Shift Operator 48 Yard/Commodities Labor 7 Maintenance Maintenance Manager 7 Boiler Operator 7 Maintenance Worker 22 Welder 6 Electrician 7 Instrument Technician 6 Total Number of Employees 170 BBI Biofuels Canada /10/2006
107 Table 10-10: New Economic Activity Directly Arising from Biodiesel Production 5% RFS Direct Economic Activity Associated with Biodiesel Plants Sector Revenues, MM$ Transportation - Truck and Rail 32.4 Grain Handling 2.5 Marketing Organizations 15.8 Chemicals 61.5 Total 112 Table 10-11: Direct Impact on Farm Producer Income 5% RFS Direct Impact on Farm Producer Income Farm Producer Revenues millions of $ % of total crop revenues Total 1,067 17% Incremental, based on 15$/tonne basis increase % Incremental, based on 30$/tonne basis increase % Table 10-12: Economic Activity to Support Farms Producing Canola for a 5% RFS Land and Farm Inputs to Support Biodiesel Production Land, Thousands of Acres 5,035 Land, Thousands of Hectares 2,038 Seed, MM $ 110 Fertilizer, MM $ 183 Herbicides and Chemicals, MM $ 139 Industry-Wide ProForma 10%RFS As noted in Section IX, with biodiesel prices >72 cents/l and canola at $368/tonne, each of the plants in the large scale production scenario would be viable, with ROIs ranging from 16 to 32%. The weighted average ROI for all of the plants in this large scale production scenario is 26%. The collective revenues and expenses for the 9 plants are shown in Table 10-13, along with the revenues and expenses that would be generated in each province. Most of the economic activity will continue to be generated in Saskatchewan, although ~15 to 20% of the feedstock expenses for the Saskatchewan plants will likely be directly to canola producer in Manitoba, due to the proximity of some of these plants to the provincial border. Collectively, the nine plants would earn approximately $2.1 billion dollars in annual revenues, with ~70% of those revenues derived from biodiesel. Collectively, the plants would incur $1.8 billion in production costs, with over 90% of those costs associated with the purchase of canola. Note that these numbers are based on a biodiesel price of 72.6 cents/l, rather than the 75 cents/l used for the 2% and 5% RFS cases, and therefore, the average ROI is lower, in spite of the economies of scale, and the earnings for individual plants will also be lower, which accounts for the lower pre-tax income for the single plant in Manitoba. BBI Biofuels Canada /10/2006
108 As shown in Table 10-14, construction of canola-based biodiesel plants to satisfy a 10% RFS would involve a total capital investment of $840 MM. Of this total, 30% of the investment would be in Alberta, 60% would be in Saskatchewan, and 10% would be in Manitoba. These plants would generate $23.8 million in direct Federal tax revenues, mainly from corporate taxes, and provinces and municipalities would receive a further $21.3 MM in tax revenues, either through manufacturing and capital taxes, property taxes, or employee income taxes. The total direct employment in biodiesel facilities supporting a 10% RFS is 268 people (Table 10-15). The average salary per employee is ~$47,000 annually, with a range from $26,500 per year for general labour, to $94,000 per year for senior management staff. Under a 10% RFS, spin-off economic activity arising directly from the operations of the biodiesel facilities would include $51MM directed annually to the transportation sector, and a further $125 MM in revenues would be received annually by grain handling companies, marketing organizations, and chemical companies (Table 10-16). Based on historical operating margins in these sectors, this implies a further $22 to $35MM in taxable income for governments. The impact of a 10% RFS on farm income is significant. Under a 10% RFS, and with canola prices at $368/tonne, payments to producers would total $1.7 billion annually, representing 27% of historical crop revenues to grain and oilseed farmers in Alberta, Saskatchewan and Manitoba (Table 10-17). Furthermore, owing to the $15/tonne basis increase, a $68 MM annual increase in farm income is obtained, compared to historical average prices. Given that the average canola seed price in 2005 was $288/tonne, a purchase price of $368/tonne would represent an additional $360 MM in farm income based on 2005 pricing and production levels. Canola production to support a 10% RFS would require about 7.9 million acres (3.2 million Ha) of land. Suppliers of seed, fertilizer, and herbicides and chemicals would receive ~$680 MM in annual revenues, directly in support of canola production dedicated to biodiesel production (Table 10-18). With a 15 to 30% gross margin, this represents a further $90 to $140 MM in taxable revenues tied to the production of biodiesel under a 10% RFS. BBI Biofuels Canada /10/2006
109 Table 10-13: Proforma Income Statement Canola-Based Biodiesel Industry 10% RFS Proforma Income Statement for Year 2 (in Millions of Dollars) Industry Location Total Alberta Saskatchewan Manitoba Net Revenue Biodiesel $1,484.4 $431.8 $917.6 $134.9 Oilseed Meal $478.4 $139.2 $295.7 $43.5 Oilseed Hulls $0.0 $0.0 $0.0 $0.0 Glycerin $121.4 $35.3 $75.1 $11.0 Provincial Producer Payment $0.0 $0.0 $0.0 $0.0 Federal Biodiesel Incentive $0.0 $0.0 $0.0 $0.0 Total Revenue $2,084.2 $606.3 $1,288.4 $189.5 Production & Operating Expenses Feedstocks $1,676.5 $487.7 $1,036.4 $152.4 Chemicals & Catalysts $97.8 $28.4 $60.4 $8.9 Natural Gas $27.3 $8.0 $16.9 $2.5 Electricity $12.9 $3.8 $8.0 $1.2 Denaturants $0.0 $0.0 $0.0 $0.0 Makeup Water $16.3 $4.8 $10.1 $1.5 Effluent Treatment & Disposal $3.5 $1.0 $2.2 $0.3 Direct Labor & Benefits $7.2 $2.2 $4.2 $0.7 Total Production Costs $1,841.6 $535.9 $1,138.2 $167.5 Gross Profit $242.6 $70.4 $150.2 $22.0 Administrative & Operating Expenses Land Lease (Annual) $0.0 $0.0 $0.0 $0.0 Maintenance Materials & Services $12.8 $3.8 $7.7 $1.3 Repairs & Maintenance, Wages & Benefits $4.4 $1.3 $2.6 $0.5 Property Taxes & Insurance $13.1 $3.9 $7.8 $1.3 Admin. Salaries, Wages & Benefits $3.8 $1.1 $2.3 $0.3 Office/Lab Supplies & Miscellaneous $1.4 $0.4 $0.9 $0.1 Total Administrative & Operating Expenses $35.5 $10.7 $21.3 $3.5 EBITDA $207.1 $59.7 $128.9 $18.5 Less: Interest - Operating Line of Credit $0.0 $0.0 $0.0 $0.0 Interest - Senior Debt $45.7 $13.8 $27.5 $4.5 Interest - Subordinated Debt $0.0 $0.0 $0.0 $0.0 Depreciation & Amortization $51.7 $15.6 $31.0 $5.1 Current Income Taxes $0.0 $0.0 $0.0 $0.0 $0.0 $0.0 $0.0 $0.0 Year 2 Annual Net Earnings Before Income Taxes $109.6 $30.3 $70.4 $ Year Average Annual Pre-Tax Income $115.8 $32.5 $73.7 $ Year Average Annual Pre-Tax ROI 26.3% BBI Biofuels Canada /10/2006
110 Table 10-14: Capital Investment and Tax Revenue Summary 10% RFS Basis: 2006/07 Tax Rates Location Industry Total Alberta Saskatchewan Manitoba Total Capital Investment, millions $838.9 $252.8 $503.0 $83.1 Federal Corporate Tax at 19.01%, millions $22.0 $6.2 $14.0 $1.8 Provincial Manufacturing Tax, millions $3.7 $7.4 $1.4 Provincial Capital Tax, millions $0.00 $3.02 $0.42 Property Tax, millions $4.4 $1.32 $2.61 $0.43 Federal Income Tax reveues, millions $1.7 Provincial IncomeTax revenues, millions $0.26 $0.71 $0.13 Total Tax revenues, millions $23.8 $5.3 $13.7 $2.3 Table 10-15: Total Direct Employment in a Biodiesel Industry 10% RFS Biodiesel Production Plant Staffing Requirements Industry Total Employees Administration/Management General Manager 9 Plant Manager 9 Quality Control Manager 8 Controller 5 Commodity Manager 4 Administrative Assistant 13 Production Labor Microbiologist 0 Lab Technician 14 Shift Team Leader 42 Shift Operator 76 Yard/Commodities Labor 9 Maintenance Maintenance Manager 9 Boiler Operator 9 Maintenance Worker 32 Welder 8 Electrician 13 Instrument Technician 8 Total Number of Employees 268 BBI Biofuels Canada /10/2006
111 Table 10-16: New Economic Activity Directly Arising from Biodiesel Production 10% RFS Direct Economic Activity Derived from Biodiesel Production Sector Revenues, MM $ Transportation - Truck and Rail 51.0 Grain Handling 3.9 Marketing Organizations 24.4 Chemicals 96.8 Total 176 Table 10-17: Direct Impact on Farm Producer Income 10% RFS Direct Impact on Farm Producer Income Farm Producer Revenues MM $ % of total crop revenues Total % Incremental, based on 15$/tonne basis increase % Incremental, based on 30$/tonne basis increase % Table 10-18: Economic Activity to Support Farms Producing Canola for a 10% RFS Land and Farm Inputs to Support Biodiesel Production Land, Thousands of Acres 7,860 Land, Thousands of Hectares 3,181 Seed, MM $ 172 Fertilizer, MM $ 286 Herbicides and Chemicals, MM $ 216 Value of Spin-off Economic Activity The economic value of a biodiesel industry goes beyond the plants, the canola producers, and the industries that directly supply goods or services to the biodiesel facilities. Income received by employees, both in the plants and in the sectors supplying the plants, is used to purchase a wide range of goods and services. Furthermore, companies that supply goods and services to the farming community are also impacted, because of the impact of a biodiesel industry on canola prices and the income received by canola producers. Agriculture and Agri-Food Canada s Overview of the Canadian Agriculture and Agri-Food System (May 2005) quantified purchases of other goods and services by the primary agriculture sector. The value of these services (in 2004) is shown in Table Overall, purchases by the primary agriculture sector totaled $3.77 billion in 2004, representing 4.8% of the total revenues in these sectors. BBI Biofuels Canada /10/2006
112 Table Value of Goods and Services Purchased by the Primary Agriculture Sector Source: Overview of the Canadian Agriculture and Agri-Food System, Agriculture and Agri-Food Canada Value of Goods and Services Purchased by the Primary Agriculture Sector, 2004 $Millions % of total sector activity Diesel Fuel Gasoline Electricity Repair and Construction Automotive Repair and Maintenance Lubricating Oils and Greases Non-Life Insurance Accounting and Legal Services Total As noted above, seed, fertilizer and pesticide purchases are an integral part of a canola farming operation, and the value of these operations that can be directly attributed to biodiesel production is shown in Tables 10-6 (for a 2% RFS), (for a 5% RFS) and (for a 10% RFS). However, producers incur many other expenses in operating a farm; these are summarized in Table 10-20, which shows 2004 operating expenses for all forms of agriculture producers. Similar data for producers in grain and oilseed farming operations are shown in Table The data in Tables and are reasonably consistent, including the anticipated reduction in commercial feed, veterinary, and livestock purchase expenses in farming operations that focus on grain and oilseed production. Table Operating Expenses in the Primary Agriculture Industry, 2004 Source: Agriculture and Agri-Food Canada Agriculture Producers Operating Expenses, 2004 Value, $ Billions % of Total Veterinary % Livestock purchase % Utilities % Pesticides % Machinery Fuel % Property taxes and Rent % Seed and Other Crop % Machinery repair % Interest % Fertilizer and Lime % Miscellaneous % Hired Labor % Depreciation % Commercial Feed % Total % BBI Biofuels Canada /10/2006
113 Table 10-21: Operating Expenses in Grain and Oilseed Farming Operations, 2001 Source: Whole Farm Database, Agriculture and Agri-Food Canada, Statistics Division Grain and Oilseed Producers Operating Expenses, 2001 Value, $ Billions % of Total Veterinary % Livestock purchase % Utilities % Pesticides % Machinery Fuel % Property taxes and Rent % Seed and Other Crop % Machinery repair % Interest % Fertilizer and Lime % Miscellaneous % Hired Labor % Depreciation % Commercial Feed % Total % Based on the data in Tables and 10-21, a multiplier can be developed to estimate expenditures on items other than seed, fertilizer and pesticides (already accounted for in Tables 10-6, 10-12, and 10-18). The data indicate that seed, fertilizer and pesticide expenses would represent 18% of total operating expenses on all farms (Table 10-20), and 30% of expenditures on farms that declare grain and oilseed farming as their primary activity (Table 10-21). Conservatively, we can estimate that for every three dollars spent on seed, fertilizer and pesticides, producers spend another $7 on other expenses, including labor, depreciation (essentially equivalent to an annualized equipment purchase), utilities, fuel, maintenance and repairs, and property taxes and rent. Canola produced to support a 2% RFS would require annual expenditures of $150 MM for seed, fertilizer and pesticides (Table 10-6); based on the multiplier outlined above, a further $350MM would be spent on other equipment, supplies and services. Under a 5% RFS, $430 MM would be spent annually on seed, fertilizer and pesticides (Table 10-12), corresponding to a further $1.0 billion in expenditures on other equipment, supplies and services to support farm operations. Under a 10% RFS, the $680 MM in annual expenditures on seed, fertilizer and pesticides would lead to a further $1.6 billion in expenditures on other farming operations. Consequently, the income paid to farmers for canola used to produce biodiesel would lead to significant expenditures to directly support farming operations, ranging from $500 MM under a 2% RFS, to $1.4 billion under a 5% RFS, to $2.3 billion under a 10% RFS. Various analyses have been conducted to establish the value of the economic multiplier for biodiesel and for agriculture. According to Agriculture and Agri-Food Canada s Profile of the Canadian Oilseeds Sector (2004), the multiplier in the Agriculture and Agri-Food industries is 2:1. An analysis for the biofuels sector (Minnesota IMPLAN Group, 1999) suggests 97 cents in additional economic activity for each $1 in direct plant output (revenues based on products and BBI Biofuels Canada /10/2006
114 co-products). A more detailed analysis in the biofuels sector used two-digit industry RIMS II demand multipliers estimated by the Bureau of Economic Analysis, U.S. Department of Commerce for the oilseed processing and construction sectors. Although these multipliers are typically tailored to a specific region (in the U.S.), they are often comparable from one rural region to another, and thus, should be reasonably indicative of the impact on rural regions of Canada as well. Using the RIMS II multipliers implies that, during the construction phase, an additional $2.10 in economic activity occurs for every $1 spent on the project capital cost, and approximately 30 jobs are created for every $1 MM in capital investment. For A 2% RFS, the total capital investment is estimated at $209 MM, which implies an additional $440 MM in economic activity during the construction phase, impacting ~6,300 jobs. For a 5% RFS, with a total capital investment of $620 MM, approximately 18,000 jobs would be impacted, and an additional $1.3 billion in economic activity would be created. Under a 10% RFS, with a total capital investment of $840 MM, approximately 25,000 jobs would be impacted, and $1.7 billion in additional economic activity would be created. During the operations phase, the RIMS II multipliers predict another 96 cents of economic activity per $1 of operating expenditures, and approximately 10 indirect jobs impacted for every $1 MM in operating expenditures in the biofuels facilities. Under a 2% RFS, annual operating expenses would total $400 MM, which would lead to an additional $380 MM in economic activity while indirectly impacting 4,000 jobs. For a 5% RFS, with operating expenses of $1.2 billion annually, an additional $1.1 billion in economic activity would be created. For a 10% RFS, with operating expenses of $1.8 billion annually, an additional $1.7 billion in economic activity would be generated. Furthermore, the RIMS II multipliers suggest a 5% RFS would impact an additional 12,000 indirect jobs, and a 10% RFS would impact an additional 18,000 indirect jobs. Comments on Economic Activity The economic impacts discussed above reflect a mix of new and perhaps re-directed market activity. The biodiesel plants themselves, and the spin-off activities required to sustain their operation (transportation, chemicals, marketing) unquestionably represent new economic activity. The canola production to sustain a biodiesel industry may represent entirely new activity, under the premise that canola production may be increased beyond historical averages in order to satisfy this new market. At the very least, it represents a transition whereby canola production that originally satisfied low-value export markets is now dedicated to a higher-value fuel market. The canola production in 2005 (9.66 million tonnes) exceeded the six-year average historical production by 44% (or ~ 3 million tonnes); furthermore, the record production in 2005 led to a record carryover of 2.5 million tonnes, and drove seed prices to multi-year lows. Based on the 2005 carryover and prices, it is reasonable to conclude that without new markets, such as biodiesel, farmers would reduce their production of canola until supply meets demand and carryover is reduced to the traditional norm for oilseeds. The 2005 carryover stocks alone could produce ~1 billion litres of biodiesel, sufficient to satisfy a 4% RFS based on total petroleum diesel consumption. Thus, it is reasonable to state, at a minimum, any growth in canola production beyond the historical average reflects new economic activity to support new markets. BBI Biofuels Canada /10/2006
115 Sustained production at 2005 levels that occurs in parallel with maintenance of or a reduction in carryover can also justifiably be identified as new economic activity, because the additional canola would not be grown without new/emerging markets for the seed. The only scenario wherein the canola production does not reflect new activity occurs if canola historically grown for export is instead directed to biodiesel production. In such a case, there is no additional spin-off activity (e.g., for seed, fertilizer, and herbicides) associated with the redirected grain, but there is likely a significant increase in value of the seed, and an incremental increase in value to the canola producer. The economic impacts discussed in this report therefore represent a mix of new and re-directed activity. Under all RFS scenarios, the economic impacts of biodiesel plant operations represent new economic activity, including the value of spin-off activities determined from RIMS-II multipliers. Based on the arguments outlined above, under a 2 and 5% % RFS, the impact on farm income, and seed, herbicide and fertilizer producers should be considered new activity, because it will create a sustainable market for canola in an environment where producers would otherwise look to reduce canola production and decrease the large carryover stocks currently observed. Under a 10% RFS, at least 1/2 of the economic impact on canola producers and their suppliers would represent new activity. The balance may represent incremental activity in a transition from a lower value export market to a higher value biofuels market, but if canola production increases to satisfy the new demand created by biodiesel production, the balance of the 10% RFS can also be fully justified as new economic activity. Summary of Economic Impacts Economic impact data are based on a canola purchase price of $368/tonne, and a biodiesel purchase price of 75 cents/l for a 5% RFS, and 72.6 cents/l for a 10% RFS. Based on these prices, the industry-wide ROI would be 28% for a 5% RFS, and 26% for a 10% RFS (this increases to 32% for a biodiesel price of 75 cents/l). The scenario for a 5% RFS is based on 9 plants, ranging in scale from 78 to 227 MMLY of biodiesel production, while the 10% RFS scenario is also based on 9 plants, ranging in size from 114 to 303 MMLY. 100% of a 5% RFS can be satisfied with canola under this scenario, while canola would comprise 90% of a 10% RFS. It is assumed that if biodiesel is produced from other feedstocks, or from mixed feedstocks, the canola-based plants would still be built, but attention would be given to developing export markets or local markets seeking to exceed the RFS threshold. Figure 10-1 summarizes the financial impact of a RFS, at a 2%, 5%, and 10% level, considering capital investment, annual plant income and expenses, and payments to canola producers and companies that sell seed, fertilizer and herbicides. Also shown are the additional RIMS II economic impacts, both during the construction phase as a multiplier on capital investment, and during operation, as a multiplier on plant expenditures. BBI Biofuels Canada /10/2006
116 Figure 10-1: Summary of Economic Impacts of Biodiesel Production from Canola Economic Impact of Biodiesel Production from Canola % RFS MMLY 5% RFS MMLY 10% RFS MMLY Capital Investment Capital Investment RIMS II Multiplier Annual Plant Income Annual Plant Expenses Payments to Canola Producers Payments to Seed Suppliers Payments to Fertilizer Suppliers Payments to herbicide suppliers Additional RIMS II economic impact Millions of Dollars As shown in Figure 10-1, under the various RFS scenarios, projected annual payments to canola producers will range from $366 MM for a 2% RFS to $1.7 billion for a 10% RFS. The resulting basis increase of $15/tonne will lead to an incremental increase in farm income compared to historical canola prices; this incremental increase will range from $15 MM under a 2% RFS, to $68MM under a 10% RFS (Figure 10-2). Furthermore, compared to 2005, when prices averaged $288/tonne, a canola price of $368/tonne would increase farm income by $80MM based on canola production under a 2% RFS, by $229 MM under the 5% RFS scenario, and by $300 MM under a 10% RFS scenario (Figure 10-2). Figure 10-3 shows the annual tax revenues arising directly from plant operations (without taxes from spin-off activities). Federal revenues from personal income tax and corporate taxes would increase from $6.5MM under a 2% RFS to $24 MM under a 10% RFS. Provincial and municipal tax revenues (including income, property and capital taxes) would range from $5.8 MM under a 2% RFS to $21.3 MM under a 10% RFS. BBI Biofuels Canada /10/2006
117 Figure 10-2: Annual Impact of a Renewable Fuels Standard on Farm Payments Annual Impact of RFS on Farm Payments Millions of Dollars % RFS MMLY 5% RFS MMLY 10% RFS MMLY 50 0 Impact of $15/tonne basis increase Impact of projected price compared to 2005 Figure 10-3: Impact of a Renewable Fuels Standard on Direct Tax Revenues Impact of RFS on DIRECT Tax revenues % RFS MMLY 5% RFS MMLY 10% RFS MMLY Millions of Dollars Federal Tax revenues Provincial Tax revenues BBI Biofuels Canada /10/2006
118 The impact of a renewable fuels standard on direct and indirect employment is shown in Figure 10-4 (note the log scale). Direct employment (in-plant) would total 69 employees under a 2% RFS, 170 employees under a 5% RFS, and 268 employees under a 10% RFS. During operations, the biodiesel facilities would have a significant indirect effect on a large number of jobs, with approximately 4,000 jobs indirectly impacted under a 2% RFS, 12,000 jobs impacted under a 5% RFS, and 18,000 jobs impacted by a 10% RFS. These job impact values are in addition to the one-time-only job impacts during the construction phase, which range from 6,300 for a 2% RFS to 25,000 for a 10% RFS. Figure 10-4: Effect of a Renewable Fuels Standard on Employment Effect of RFS on Direct and Indirect Employment Number of Jobs % RFS MMLY 5% RFS MMLY 10% RFS MMLY Direct Employment Indirect Employment BBI Biofuels Canada /10/2006
119 XI: COMPARISON TO A U.S. OILSEED-BASED BIODIESEL INDUSTRY In this section, a financial analysis is performed on oilseed-derived biodiesel facilities based in the U.S. As a primary comparison, Archer Daniels Midland is constructing an 85 MMGPY biodiesel facility in Velva, ND, that will be based on canola. The originally announced plant capacity was 50 MMGPY, but the favorable incentives introduced by the U.S. Government contributed to a decision to increase capacity. Previously, ADM s Velva plant had been crushing canola and transporting the oil to its refining operations in Enderlin, ND. The proposed biodiesel plant implies both an expansion in crush capacity at Velva, and possibly, some diversion of oil from its refining operations to its new biodiesel plant. North Dakota Canola Production and Disappearance According to the Northern Canola Grower s Association, Currently, 95% of the canola production in North Dakota is shipped to either the Velva plant or to Bunge s plant in Altona, MB. Furthermore, about 15 to 25% of the current Velva feedstock is imported from Canada. According to the USDA-ERS, an average of 1.56 billion pounds (~700,000 tonnes) of canola was grown in the U.S. from ; about 90% of this production was in North Dakota. Over the same period, total disappearance by crush averaged 1.58 million pounds. Thus, the U.S. demand already matches U.S. supply (excluding imports), and a further increase in crush to support biodiesel production will therefore depend either on increased imports from Canada, or a significant increase in U.S. production. The 85 MMGPY plant under development in Velva will require about 770,000 tonnes of canola, or about 10% more canola than has historically been produced throughout the entire U.S. or about 20 to 25% more canola than has historically been produced in North Dakota. Consequently, it is reasonable to assume that a plant in Velva will rely heavily on imports, and/or that the price for canola in the vicinity of the plant will increase substantially. Canola Prices Historical U.S. data on canola prices are tied either to Canadian prices, or tied to the value of the canola oil relative to the price of soy oil. These two methods for canola pricing lead to slightly different historical averages. USDA ERS data indicate a historical average price of $10.44/cwt (US$230/tonne of $6.96/bu), while Agriculture Canada data on U.S. prices for canola indicate historical pricing of US$240/tonne, or $7.28/bu. Furthermore, the Agriculture Research Division at North Dakota State University projects an average canola price of $11.15/cwt (US$245/tonne or $7.43/bu) from 2007 through ( Financial calculations will be based on both of the historical price scenarios, i.e., $6.96/bu and $7.28/bu, with a typical basis adjustment, equal to $0.30/bu. These two values are thus about $0.15/bu on either side of the average projected by North Dakota State University. BBI Biofuels Canada /10/2006
120 Canola Freight Rates Current freight rates range from about 25 cents/bu from farms within 100 miles of the plant, to 53 cents/bu for farms 250 to 300 miles away (for reference, Altona, MB is 277 miles from Velva). Assuming that 25% of the canola can be drawn from within 100 miles, another 25% from farms between 100 and 150 miles away, another 25% from farms between 150 and 180 miles away, and the balance comes from farms more than 200 miles away, an average shipping cost of 40 cents per bushel is obtained. Delivered Price of Canola, FOB Velva The projected delivered price of canola FOB Velva is thus the sum of the historical price, plus the basis adjustment, plus the transportation cost. For the two price datasets outlined above, the resulting delivered prices are US$7.67/bu and $7.99/bu. Biodiesel Prices Three benchmarks for biodiesel pricing will be used in this analysis: 1) Three-year historical diesel prices in PADD 2 (U.S. Midwest) 2) 2005 diesel prices in North Dakota municipalities (Grand Forks, Fargo, Bismarck) 3) Prices in (1) and (2), plus the Federal incentive of $1/USG The price in (3) assumes that the producer receives 100% of the benefit from this incentive; in reality, this is a blender s credit, and is likely to be shared by the blender and producer. Consequently, the calculations using the prices in (3) likely present an upper bound on the profitability of these canola-based entities in the U.S. Other site-specific data, including the price of electricity and the price of natural gas, were obtained from the Alternative Fuels Index. The corresponding values for North Dakota are 5.89 cents/kwh and $10.75/MMBTU. Financial Projections for Canola-Based Plants Table 11-1 shows the 11-year average ROI for an 85 MMGPY plant, without including subsidies, based on the canola-seed and biodiesel prices outlined above. The best scenario, with biodiesel at $2.36/USG (from the 2005 average) and canola at $7.67/Bu (the lowest historical average), still leads to a negative ROI, -2.9%. Basing the biodiesel price on the three-year average, and/or basing the canola price on the upper end of the historical benchmark dramatically reduces the ROI, to as low as -140% with canola at $7.99/Bu and biodiesel at $1.87/USG. Table 11-2 shows the corresponding ROIs when the U.S. Government s $1/USG incentive is added to the biodiesel price. The incentive has rendered all of the scenarios profitable, with ROIs ranging from +58% to 139%. Even if the producer received only 70% of the incentive ($0.70/USG), the ROI would still be +14% under the worst feedstock pricing scenario, with the price of biodiesel based on the 3-year historical average. BBI Biofuels Canada /10/2006
121 Table 11-1: Financial Projections for a Canola-Based Biodiesel Plant in North Dakota Subsidies not included Financial Projections for an 85 MMGPY Biodiesel Plant in North Dakota without Subsidies Performance Metric 85 MMGPY 85 MMGPY 85 MMGPY 85 MMGPY Biodiesel Price, US$/gal Canola Price, US$/bu Year Average ROI % % -2.9% -30.2% Average Annual Net Earnings (62,820,000) (77,409,000) (1,577,000) (16,165,000) Installed Capital Cost per Gallon of Capacity Table 11-2: Financial Projections for a Canola-Based Biodiesel Plant in North Dakota Federal Subsidy of $1/USG Included Financial Projections for an 85 MMGPY Biodiesel Plant in North Dakota With a Federal $1/USG Subsidy Performance Metric 85 MMGPY 85 MMGPY 85 MMGPY 85 MMGPY Biodiesel Price, US$/gal Canola Price, US$/bu Year Average ROI 71.0% 57.6% 138.8% 128.7% Average Annual Net Earnings 39,989,000 30,967,000 78,782,000 69,761,000 Installed Capital Cost per Gallon of Capacity Comparison to Soybean-based Biodiesel Facilities A biodiesel analysis was recently conducted by informa economics to evaluate opportunities for soy-derived biodiesel in the U.S. They noted that the profitability of a 30 MMGPY plant was entirely contingent on the $1/USG federal incentive; otherwise, feedstock and processing costs exceeded revenues from biodiesel and co-products by about 40 cents per gallon (Figure 11-1). With the $1/USG credit in place, a biodiesel plant based on soybeans would earn about 60 cents per USG (assuming all of the incentive landed with the producer). A comparative analysis to other feedstocks indicated that, under similar circumstances, a canola-based plant would have an operating profit of 30 cents per gallon, and a plant based on palm oil would have an operating profit near 80 cents per gallon. However, in the absence of a Federal incentive, ALL of the plants based on agricultural feedstocks would have an operating loss, while plants based on waste fats and greases would be profitable, but would have a narrow profit margin. It is critical to note that the values cited in the informa economics report are specific to the 30 MMGPY scale; at larger scales, the impact of the oil content of oilseed becomes more pronounced, and the impact on protein meal prices will also be much more severe. At higher production capacities, the financial outcome is thus highly dependent upon the choice of mechanical versus solvent extraction, and should also favour oilseeds with a higher oil content, which would increase the oil available to the plant, and would lessen the impact of protein meal pricing and transport on financial viability. Feasibility studies conducted by BBI for various groups in the U.S. are generally consistent with the findings reached by informa economics. For example, a 45 MMGPY plant based on 100% soy oil would have an ROI ~ 40% with the $1/USG incentive, but a negative return (-400%) without the incentive. Similarly, a 60 MMGPY plant based on 100% soy oil would have an ROI BBI Biofuels Canada /10/2006
122 greater than 90% with the incentive, but a negative return, exceeding -300%, without the incentive. BBI s analysis of a mixed feedstock facility indicates a projected return in excess of 100% with the incentives in place, but a negative return without the incentives. Figure 11-1: Profitability of Soy-Based Biodiesel Operations Basis: 30 MMGPY plant; Diesel price based on #2 diesel, February, 2006 Source: informa economics Economics of Biodiesel 3.0 $ Per Gallon Tax Incentive Glycerin Credit Diesel (1.7) Profit Processing Costs Feedstock 0.0 Revenues Cost & Profit Section Summary A detailed analysis of oilseed-based biodiesel facilities in the U.S. indicates that their viability is entirely contingent on the Federal $1/USG blender s incentive, until such time that diesel prices are sustained at levels exceeding ~ $2.50/USG. Furthermore, U.S. based canola facilities will face significant competition for locally-grown canola, and will need to rely on imported canola, which will drive up the local basis and lead to greater transportation costs. In the absence of any subsidies, the resulting higher plant-gate feedstock costs should render such facilities less competitive than biodiesel plants located within prime canola-producing regions of Canada. At current diesel prices, with the $1/USG subsidy in place, a large scale (> 80 MMGPY) biodiesel facility in the U.S. would have an 11 year average ROI ranging from ~80 to 100%, depending upon feedstock costs. For comparison, an equivalent subsidy provided to a plant based in Canada would lead to an ROI of 107% based on historical wholesale diesel prices, or $129% based on 2005 diesel prices. Clearly, the competitive advantage of a U.S.-based plant is derived entirely from the subsidy from the U.S. Government. BBI Biofuels Canada /10/2006
123 DRAFT XII. POTENTIAL OWNERSHIP STRUCTURES FOR BIOFUELS FACILITIES Several organizational or business structures may be considered for biofuels facilities, including corporations, partnerships, cooperatives and joint ventures. The type of business structure selected by the owners will define their rights and obligations, liability risks, and taxation. The following general description provides some guidance regarding different business structures, but is not a substitute for more comprehensive advice obtained from qualified legal and financial advisors. Some of the business structures may be influenced by the percentage of debt financing used to fund the facility; typically, a 60:40 debt:equity ratio is used. Corporations A corporation exists as an independent legal entity from its shareholders. It maintains its own set of financial statements, and is taxed according to its income (or losses).after-tax income may be allocated to investors in the form of dividends, but losses cannot be allocated, and are held within the corporation and carried forward (or back) to be applied to future (or prior) income. Several share classes may be created, to provide special/distinct voting rights or the opportunity to allocate dividends selectively to the different shareholder classes. Shareholders are generally not liable for obligations beyond the value of their original share capital, unlike a partnership, where each partner has full liability for any liabilities incurred by other partners in the operation of the business. Corporations may be public, or private, as a Canadian-Controlled Private Corporation (CCPC). The shares of a public corporation are traded on a stock exchange, while the shares of a CCPC are privately held, and are not owned (either directly or indirectly) by a publicly traded company. Furthermore, a CCPC cannot be controlled, either directly or indirectly, by a person or entity that is not a resident of Canada. An advantage of a CCPC is that each entity (person or company) that holds shares in a CCPC is entitled to a $500,000 capital gains exemption, provided certain conditions regarding its business activities are met. Cooperative Corporations A Cooperative corporation is a corporation created to (a) market natural products on behalf of its members, (b) deliver services to its members, or (c) to purchase supplies or equipment for its members. Function (a) marketing of natural products, includes products derived from processing of natural products, and would therefore apply to facilities that produce biodiesel from agricultural feedstocks. It is not clear, however, if this structure would be available to a plant that processed mixed feedstocks, such as a mixture of canola and FOG. To qualify as a cooperative, at least 90% of the members must be actively involved in the business of farming. Qualified members include individuals, corporations, or other cooperative corporations; such qualified members must hold at least 90% of any shares issued by the cooperative corporation. Each member is entitled to a single vote on corporate matters. Income BBI Biofuels Canada /10/2006
124 DRAFT earned by the cooperative can be distributed to members in the form of a patronage allocation, which is deductible from the income of the cooperative. However, as in a conventional corporation, losses cannot be allocated, but continue to accrue within the cooperative. Members liability is typically limited to the amount invested in the cooperative. New Generation Cooperatives A New Generation Cooperative is similar to a cooperative, except that membership also provides a right and/or obligation to the member to supply feedstock to the commercial enterprise. Generally, each member is contracted to supply a specified quantity of feedstock, and the cooperative is obligated to acquire the feedstock. Such an arrangement can help to guarantee a secure supply of at least a portion of the necessary feedstock for the facility, while also providing a guaranteed market for grain producers. A New Generation Cooperative provides individuals in primary agriculture with the opportunity to participate in value-added ventures; this is the primary goal of legislation and other initiatives that aim to support primary agriculture. Joint Venture A Joint Venture (JV) is an agreement between two or more parties to provide assets in support of a commercial enterprise. However, a joint venture is not a distinct legal entity, and therefore, is not taxed directly. Revenues flow back to the co-venturers on some agreed-upon proportion, and the co-venturers then deduct their individual expenses incurred for operation of the JV. Each participant in a JV retains ownership of their original assets and property used to create the JV, and on termination of the JV, these assets are returned to their respective contributing organizations or persons. Owing to the fact that the JV is not a separate legal entity, and it does not pay its own taxes, losses can be transferred to the co-venturers, and used as a deduction against their other business income (if any). Legal dealings with a JV require separate contractual agreements with each co-venturer, because individual co-venturers cannot bind other co-venturers in the JV. Similarly, co-venturers are not jointly liable for the debt of the undertaking; rather, their obligations are limited to their individual contractual obligations, and/or their respective share of the liabilities of the JV business operation. BBI Biofuels Canada /10/2006
125 XIII. STRUCTURAL AND OPERATIONAL CHALLENGES FOR A BIODIESEL INDUSTRY The development of a broadly-based biodiesel industry in Canada will require collaboration and interaction between various parties that have a stake in feedstock supply and processes that add value to feedstock. Conventionally, the food processing industry has been the primary player in adding value to oilseeds, while the rendering industry has typically sought to extract value from rendered fats by turning them into animal feed and other products. Biodiesel represents another option for addition of value to these feedstocks; investment in a biodiesel industry is therefore based on investors ability to obtain a satisfactory return on investment in biodiesel production compared to an investment in other value-added processes, such as the production of food-grade oils. The perceived risk associated with each value-adding industry will also impact investment, and will also influence each industry s ability to secure loans or raise equity on capital markets. The two key risks associated with a biodiesel industry involve security of feedstock supply, and the ongoing ability to market products, primarily biodiesel. This section will briefly address these two challenges. Feedstock Supply competition and pricing Some integration along the supply chain is helpful to ensure a secure supply of feedstock. Plants based on recycled fats, oils and greases (FOG) depend upon supply from rendering plants or from companies that collect waste greases, e.g., from restaurants. Although there are a large number of rendering plants, the total production of rendered fats from cattle, hogs and sheep has averaged only ~ 300,000 tonnes per year (based on Statistics Canada slaughter data). This is sufficient to produce ~ 300 MMLY of biodiesel, assuming that ALL of the rendered fats are used for biodiesel production. Biodiesel plants developed and operated by rendering companies have a built-in, secure feedstock supply, while others will have to compete for a limited feedstock resource. Plants based on oilseeds will face competition with companies that require feedstock for production of food-grade oils. Such competition may occur at two levels either at the oilseed producer level, or at the crush level. If the biodiesel industry is developed from integrated crush-biodiesel facilities, as recommended in this document, the competition will focus on the oilseed producers, thus leading to an increase in farm-gate prices as the producers encounter more options for marketing their grain. Such competition will inevitably lead to an increase in basis, which has been accounted for in this document by setting the sales price for canola at $368/tonne, $15/tonne higher than the average price for canola from 2001 to Under such a scenario, a biodiesel facility could establish a secure feedstock supply by entering into long-term supply agreements with canola producers or with elevators; the former is especially attractive if the producers also have an ownership stake in the plant. If the biodiesel industry is instead constructed using a hub-and-spoke method, with a very large centralized crush facility at the centre, which distributes oil to surrounding biodiesel facilities, it is likely that the centralized crush facility would be designed to produce either crude BBI Biofuels Canada /10/2006
126 or refined oils. In such a scenario, the availability and price of oil for biodiesel production will be strongly influenced by the value of food-grade oils. Such a centralized crush facility is likely to be constructed and owned by one of the existing large oilseed processing organizations. Alternatively, a consortium of biodiesel plants could build and construct the centralized crush facility, but they would clearly be operating in competition with large and established companies such as ADM, Cargill and Bunge. Prices for the oils/oilseeds used to produce biodiesel will be influenced by global supply and demand for oils, and the quality of the oil for its intended application. For example, palm oil is currently a low-cost oil, and has been identified as a primary feedstock for biodiesel plants in Europe and for the biodiesel plant proposed in Washington State. The low price of palm oil will ultimately restrict the extent to which oilseed prices could rise; otherwise, importing palm oil becomes a more attractive option for biodiesel plants. Similarly, increased demand for a particular oilseed would place upward pressure on prices of grain, oil and protein meal, but would also lead some food processors and end-users to switch to lower cost oilseeds and oils. Consequently, significant upward movement in pricing will be at least partially counterbalanced by opportunities to use lower cost oils and oilseeds. Biodiesel Marketing Marketing and sales of biodiesel will ultimately require acceptance by the consumer, and will also require the cooperation of refining/blending organizations that would ultimately blend the biodiesel with petrodiesel, and sell it through retail service stations. The overall market penetration for biodiesel can be addressed, in part, through government mandates that set a floor for biodiesel use as a fraction of total diesel use, and incentives that allow biodiesel to be priced competitively with petro-diesel. Such incentives and mandates allow the development of a market, and consumers gain experience with the product that can ultimately overcome their fear of change. For a variety of reasons, the receptiveness of refining/blending organizations to biofuels will be decidedly different. It could be very challenging for individual biofuels facilities to break through some of these barriers and gain the necessary cooperation of blenders/refiners that ultimately leads to sale of the product. However, the use of biofuels marketing organizations will simplify this process, because these marketing organizations have established links into the refining, blending and retail industry, and are able to readily deal with the local challenges that would otherwise impede utilization of biofuels. The plant-specific feasibility study and business plan are other key avenues towards development of a biodiesel market. During the economic feasibility study stage, refiners or blenders may provide a Letter of Interest that expresses some willingness to purchase biofuels produced by a specific facility. If the project moves ahead into a project development phase, negotiations are initiated with the companies that provided a Letter of Interest such negotiations can lead to a binding Letter of Intent or contract to supply product, which ultimately secures market access for the biofuel, at least for the early stages of plant operation. BBI Biofuels Canada /10/2006
127 XIV. CONCLUSIONS Candidate Sites and Implementation Scenarios Various sites in western Canada can satisfy the requirements for biodiesel operations. Based on historical feedstock availability, likely product markets and transportation access, different biodiesel production scenarios were examined to satisfy requirements for a renewable fuels standard. The first scenario is based on a typical 80 km radius feedstock draw zone, which leads to 22 plants across the Prairie Provinces. Three of these are 5 MMGPY (19 MMLY) plants, seven are at the 10 MMGPY (38 MMLY) scale, eleven are 20 MMGPY (78 MMLY), and one 30 MMGPY (114 MMLY) plant is located in north-central Saskatchewan. Overall, four plants with 208 MMLY of production would be located in Manitoba, eleven plants (660 MMLY) would be located in Saskatchewan, and seven plants (400 MMLY) would be located in Alberta. This scenario could supply 100% of a 5%RFS. The second scenario is aimed at a smaller number of large-scale plants, accomplished by expanding the feedstock collection zone to a 150 km radius around each plant. In this scenario, nine plants would be constructed, including two at 78 MMLY, one at 114 MMLY, three at 152 MMLY, two at 190 MMLY, and one at 227 MMLY. Of this total, 3 plants (380 MMLY) would be in Alberta, 1 plant (151 MMLY) would be in Manitoba, and 5 plants (800 MMLY) would be in Saskatchewan. Two of the plants in Saskatchewan would draw on feedstock grown in western Manitoba. This scenario could supply >100% of a 5%RFS. Another scenario is aimed a satisfying a 2% RFS based on three larger scale (151 MMLY) plants, one in each of the Prairie Provinces. The final scenario is an extension of the second, with the same number of plants, but each is of larger scale, ranging from 114 to 303 MMLY, accounting for the increased canola supply in 2005, which is anticipated to be sustained into the future. This last scenario could satisfy ~90% of a 10% RFS. Feedstock Supply and Pricing The feedstock supply assessment indicates there is sufficient feedstock to support a number of canola-based biodiesel production facilities in western Canada. Using only 35% of the historical average annual production would produce about 800 million litres of biodiesel. However, if production levels are sustained at (or expand beyond) the 2005 levels, sufficient canola would be available to produce ~2.1 billion litres of biodiesel per year. If canola-based biodiesel facilities are constructed to their full potential capacity of ~ 2.1 billion L/y, their biodiesel production would be about four times greater than the regional market capacity for a B5 blend, and is, in fact, almost double the total Canadian market for a B5 blend, based on transportation uses. Thus, development of a canola-based biodiesel industry is likely to be incremental, increasing in tandem with increased market demand and/or mandates. BBI Biofuels Canada /10/2006
128 Alternatively, facilities can be constructed with a view on U.S. markets, although large biofuels facilities in North Dakota and Washington will also provide significant competition for regional markets. Over 85% of the biodiesel produced in Manitoba and Saskatchewan would be exported outside the province if market penetration was limited to a B5 blend; similarly, Alberta production would be ~ 75% of the total B5 market in Alberta and BC, and thus, production in Saskatchewan will likely be destined for these markets. Thus, interprovincial and international trade will be a critical aspect of a canola-based biodiesel industry. Historical canola prices have ranged from $290 to $440/tonne, with a five-year average of $353/tonne ($8.02/bu), and a ten-year average of $372/tonne ($8.45/bu). The financial analyses were based on canola price of $368/tonne ($8.37/bu), which includes a basis adjustment of $15/tonne beyond the 5-yr average price. Product and Byproduct Markets The retail price for diesel fuel across Canada has averaged 80 cents per litre over the past three years, and has been increasing at an average annual rate of 5% since After removal of taxes and retail margins, the 3-year average wholesale price for diesel fuel is 48 cents per litre. Biodiesel selling prices are based on the wholesale price for diesel, plus the value of federal and provincial tax exemptions. In the absence of any provincial tax exemptions, the projected sales price for biodiesel would be 58 cents per litre. If Alberta and Saskatchewan join Manitoba in granting road tax exemptions to biodiesel, the projected biodiesel selling price would be greater than 66 cents per litre, based on a 3-year historical average. There is currently a glut of glycerine on the market, a situation that will only get worse as new biodiesel facilities come on line. Until such time that new uses for glycerine are found, or it begins to displace other petroleum-derived products, there will be significant downward pressure on glycerine pricing, continuing trends seen since early Based on current market prices for glycerol, BBI recommends that biodiesel producers do not include glycerol refining in their process design, and focus solely on the sale of crude glycerol. By mid-2005, food grade tallowderived refined glycerol was valued at C$910-$1150/tonne and food grade vegetable-derived refined glycerol was valued at C$1050-$1350/tonne. Historically, the price of crude glycerol has been ~45% less than that of refined glycerol. The economics analysis has used a price of $495/tonne for the crude glycerol. Significant quantities of canola meal will be produced by the proposed integrated crush-biodiesel facilities. For each 100 MMLY of biodiesel production, 150,000 tonnes of canola meal will be produced, and will have to be sold into an increasingly competitive market for protein meals. Although the historical 10-year average price for canola meal is $198/tonne, the financial analysis has used an average price of $181/tonne, to account for increased transport costs to sell canola meal in export markets, and downward price pressure from increased production of protein meals in general. BBI Biofuels Canada /10/2006
129 Individual Plant Economics and Sensitivity Analyses Capital costs for crushing facilities have been based on the use of solvent extraction to remove oil from the grain, but do not include refining operations to produce a refined oil. The financial analysis has demonstrated that a canola-based biodiesel industry can be viable, IF canola prices remain at or near historical levels ($368/tonne), and IF the selling price of biodiesel is at least 72 cents/l, preferably greater than 75 cents/l. Based on current wholesale prices for biodiesel, this price can only be achieved if Alberta and Saskatchewan extend their road tax exemption to all biofuels (currently, the exemption only applies to ethanol). Based on the feedstock and biodiesel pricing levels outlined above, only the large scale plant scenario would be a reasonable investment; Under such a large-scale scenario, plants could tolerate a 3 to 5 cent (short-term) drop in biodiesel prices, and remain cash-flow positive; similarly, with biodiesel at 72.6 cents per litre, plants could tolerate a 4 to 7% (short-term) increase in canola prices (i.e., $15 to $25/tonne) and remain cash flow positive. Sensitivity analyses have shown that the viability of a canola-based biodiesel industry depends most upon the price of biodiesel and canola, but other factors are important, including the price of the glycerine and canola-meal byproducts, and plant capital cost. A 114 MMLY plant could tolerate a sustained 12% drop in canola meal prices (i.e., to ~$160/tonne) before its ROI would be negative, while a 151 MMLY plant could tolerate a canola meal price reduction to ~145/tonne before posting negative returns. A 227 MMLY plant is more resilient, and would only produce negative returns if the canola meal price dropped 30% (below $128/tonne), while an 303 MMLY plant is able to tolerate a 34% crop in price, to $121/tonne. A 60% reduction in the price of glycerol (to ~$220/tonne) would reduce the ROI, but plants would still have a positive return on investment, ranging from 7 to 14% for 151 to 303 MMLY plants. However, at this price, a 78 MMLY (20 MMGPY) plant would post negative returns. Nonetheless, while the price of glycerol is important, facilities would have some resiliency against further depression in glycerol prices. Plant capital cost is an important parameter, and influences ROI through its impact on debt servicing costs. However, it is not the over-riding factor that influences the viability of a plant. Government assistance in the form of a capital co-payment alone is not sufficient to ensure the viability of a canola-based biodiesel industry if biodiesel prices remain at 66 cents per litre, which is the level projected based on 2005 wholesale prices plus the Federal excise tax exemption. Biodiesel prices must increase beyond their 2005 prices, and/or some form of Provincial road tax exemption must be in place in order for a capital co-payment scheme to have a meaningful impact. Need for Incentives There are two key drivers that justify the need for incentives. In the first, the goal is to ensure the economic viability or profitability of the plants. In the second, the goal is to provide a BBI Biofuels Canada /10/2006
130 competitive environment for investment, and attract business that might otherwise locate in another jurisdiction. As demonstrated in the financial analysis, a 4 cent/l federal excise tax exemption alone is not sufficient to sustain a canola-based biodiesel industry if the biodiesel selling price is 66 cents/l (the current wholesale diesel fuel price + 4 cents/l), and if the price of canola is $368/tonne. However, extension of the provincial road tax exemption to include biodiesel as well as ethanol would lead to biodiesel selling prices of 72 to 75 cents per litre, which would produce an overall return on investment of 26 to 28% sufficient to sustain the industry. However, this alone may not be sufficient to attract investment. The current U.S. incentive of US$1/USG (29 cents/l) for biodiesel produced from virgin oils implies annual financial returns approaching 80 to 100%; it is clear that corporate partners in a biodiesel industry would therefore invest in a U.S. based plant. Consequently, incentives approaching 25 cents/l may be necessary to level the playing field for investment. Economic Impact Economic impact data are based on a canola purchase price of $368/tonne ($15/tonne above the historical 5-year average), and a biodiesel purchase price of 75 cents/l for a 2% and 5% RFS, and 72.6 cents/l for a 10% RFS. Based on these prices, the industry-wide ROI would be 30% for a 2% RFS, 28% for a 5% RFS, and 26% for a 10% RFS (this increases to 32% for a biodiesel price of 75 cents/l). The scenario for a 2% RFS is based on 3 plants, each 151 MMLY. The 5% RFS scenario is based on 9 plants, ranging in scale from 78 to 227 MMLY of biodiesel production, while the 10% RFS scenario is also based on 9 plants, ranging in size from 114 to 303 MMLY. 100% of a 5% RFS can be satisfied with canola under this scenario, while canola would comprise 90% of a 10% RFS. Capital Investment The capital investment for the three plants to satisfy a 2% RFS would be $209 MM, increasing to $620 MM for plants under a 5% RFS, and $840 MM for the larger scale plants under a 10% RFS. RIMS II Multipliers indicate a further $440 MM in economic activity under a 2% RFS, impacting ~6,300 jobs during the construction phase. These values increase to $$1.3 billion and 18,000 jobs under a 5% RFS, and $1.7 billion in additional economic activity and 25,000 jobs impacted under a 10% RFS. Plant Revenues and Expenditures Plant revenues would range from $446 MM for plants under a 2% RFS, to $1.36 billion under a 5% RFS, to $2.1 billion under a 10% RFS. Approximately 70% of these revenues are derived from biodiesel. Approximately 90% of the plants expenditures are for feedstock i.e., payments to canola producers. Total expenditures range from $402 MM under a 2% RFS, to $1.12 billion under the 5% RFS scenario, to $1.8 billion under a 10% RFS. Impact on Farm Income Based on a canola price of $368/tonne, farmers would receive $366 MM to supply canola for a 2% RFS, increasing to $1.1 billion under a 5% RFS and $1.7 billion under a 10% RFS. Compared to historical average prices for canola ($353/tonne), this represents an incremental BBI Biofuels Canada /10/2006
131 increase in farm income of $15 MM to $68 MM. Compared to canola prices in 2005 ($288/tonne), a 2% RFS would increase farmer income by $80 MM under a 2% RFS, $229 MM under the 5% RFS scenario, and $300 MM under a 10% RFS. Employment The total direct employment in biodiesel facilities supporting a 2% RFS is 69 people, including administrative/managerial staff, production labour, and maintenance staff, with an average annual salary near $47,000. The federal government would receive $6.5 MM in direct tax revenues (corporate and employment), and an additional $5.8 MM in provincial and municipal taxes would be generated. These values do not include taxes from indirect employment. Under a 5% RFS, direct employment during operation would total 170 people. Direct federal tax revenues (corporate and employment) would total $18.6 MM, and an additional $16.5 MM in provincial and municipal taxes would be generated. Under a 10% RFS, direct employment during operation would total 268 people. Direct federal tax revenues (corporate and employment) would total $23.8 MM, and an additional $21.3 MM in provincial and municipal taxes would be generated annually. Spin-off Activity Significant spin-off activity will be generated by biodiesel facilities under a renewable fuels standard. Payments to seed, fertilizer and herbicide suppliers can be directly attributed to canola grown to supply biodiesel facilities; these values range from $150 MM under a 2% RFS, to $680 MM under a 10% RFS. Revenues earned by transportation, grain handling and product marketing organizations would be $17 MM for the three plants under a 2% RFS, increasing to $60 MM under a 5% RFS, and $80 MM under a 10% RFS. RIMS II multipliers indicate that during plant operation, a further 96 cents of overall economic activity will be created for each dollar of operating expenditures, and approximately 10 jobs would be indirectly impacted for each $1 MM in operating expenditures in the biofuels industry. For the three plants under a 2% RFS, this corresponds to an additional $380 MM of economic activity over and above the $400 MM in direct operating expenditures, indirectly impacting 4,000 jobs. The biodiesel plants serving a 5% RFS would generate an additional $1.1 billion in economic activity, indirectly impacting 12,000 jobs. Under a 10% RFS, $1.7 billion in economic activity would be generated in addition to the $1.8 billion in annual plant expenditures, impacting another 18,000 jobs outside the biofuels plants. Comparison to U.S. Biodiesel A detailed analysis of oilseed-based biodiesel facilities in the U.S. indicates that their viability is entirely contingent on the Federal $1/USG blender s incentive, until such time that diesel prices are sustained at levels exceeding ~ $2.50/USG. Furthermore, U.S. based canola facilities will face significant competition for locally-grown canola, and will need to rely on imported canola, which will drive up the local basis and lead to greater transportation costs. In the absence of any BBI Biofuels Canada /10/2006
132 subsidies, the resulting higher plant-gate feedstock costs should render such facilities less competitive than biodiesel plants located within prime canola-producing regions of Canada. At current diesel prices, with the $1/USG subsidy in place, a large scale (> 80 MMGPY) biodiesel facility in the U.S. would have an 11 year average ROI ranging from ~80 to 100%, depending upon feedstock costs. For comparison, an equivalent subsidy provided to a plant based in Canada would lead to an ROI of 107% based on historical wholesale diesel prices, or 129% based on 2005 diesel prices. Clearly, the competitive advantage of a U.S.-based plant is derived entirely from the subsidy from the U.S. Government. BBI Biofuels Canada /10/2006
133 Appendix A: Railway Transportation Across Canada and the U.S.

134 Figure A-1: Canadian Rail Networks

135 Figure A-2: U.S. Railways
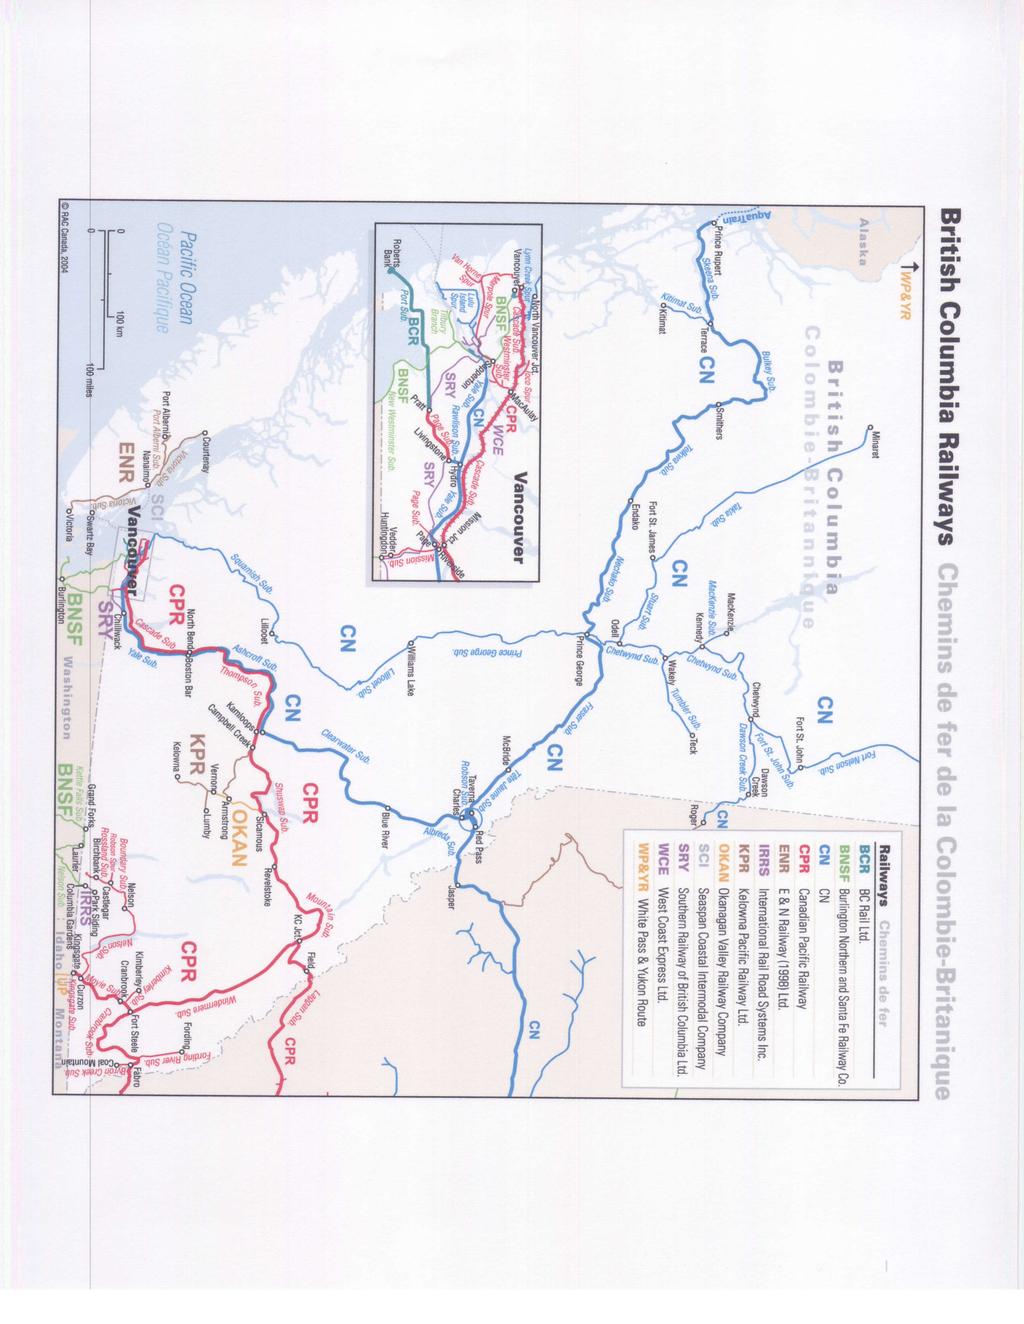
136
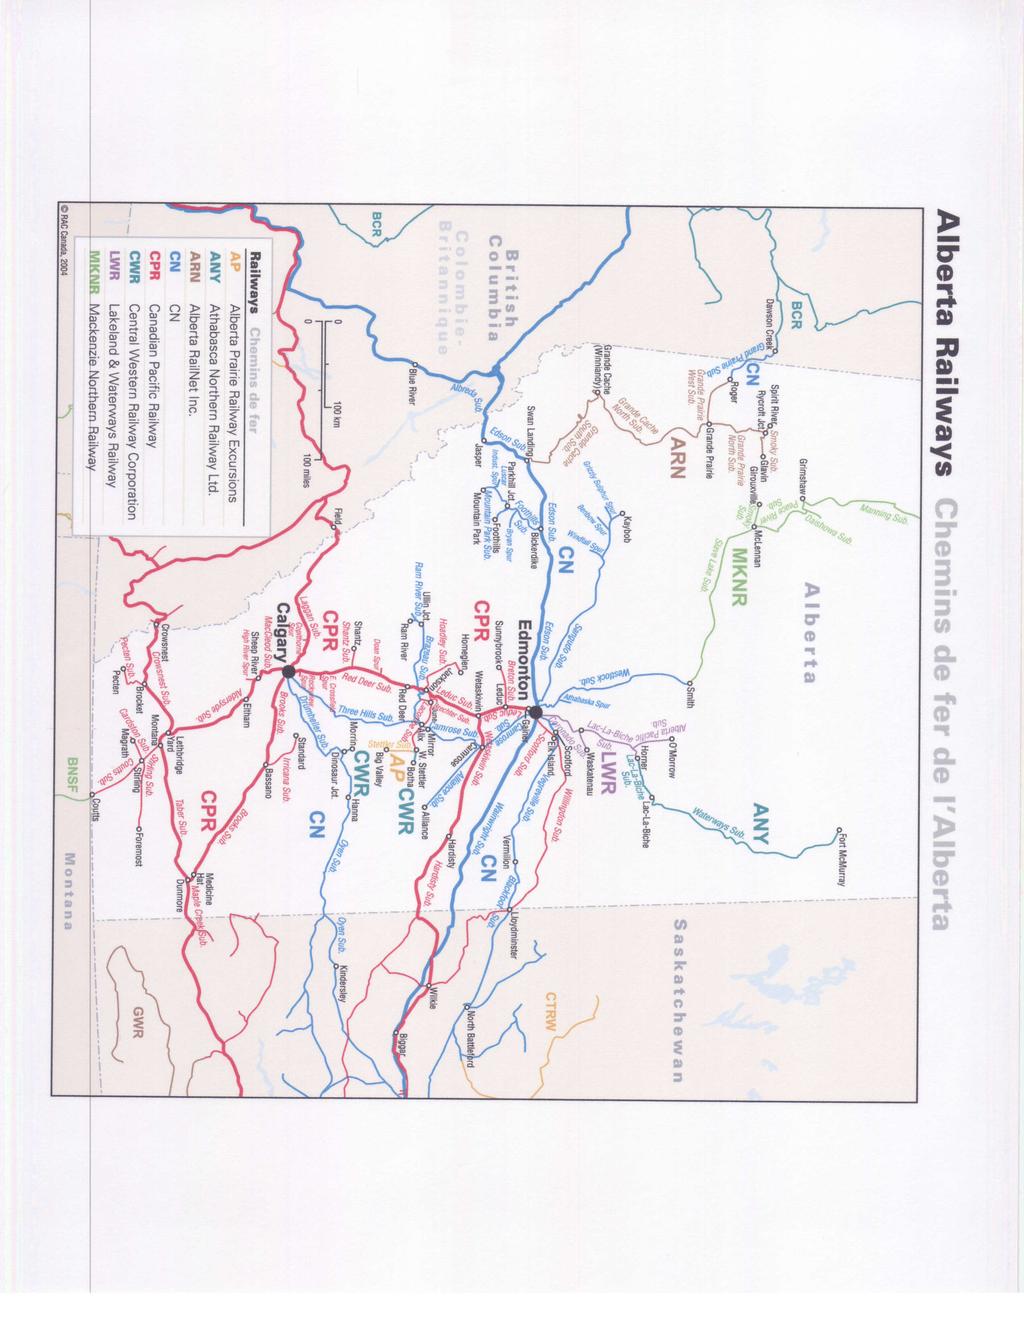
137
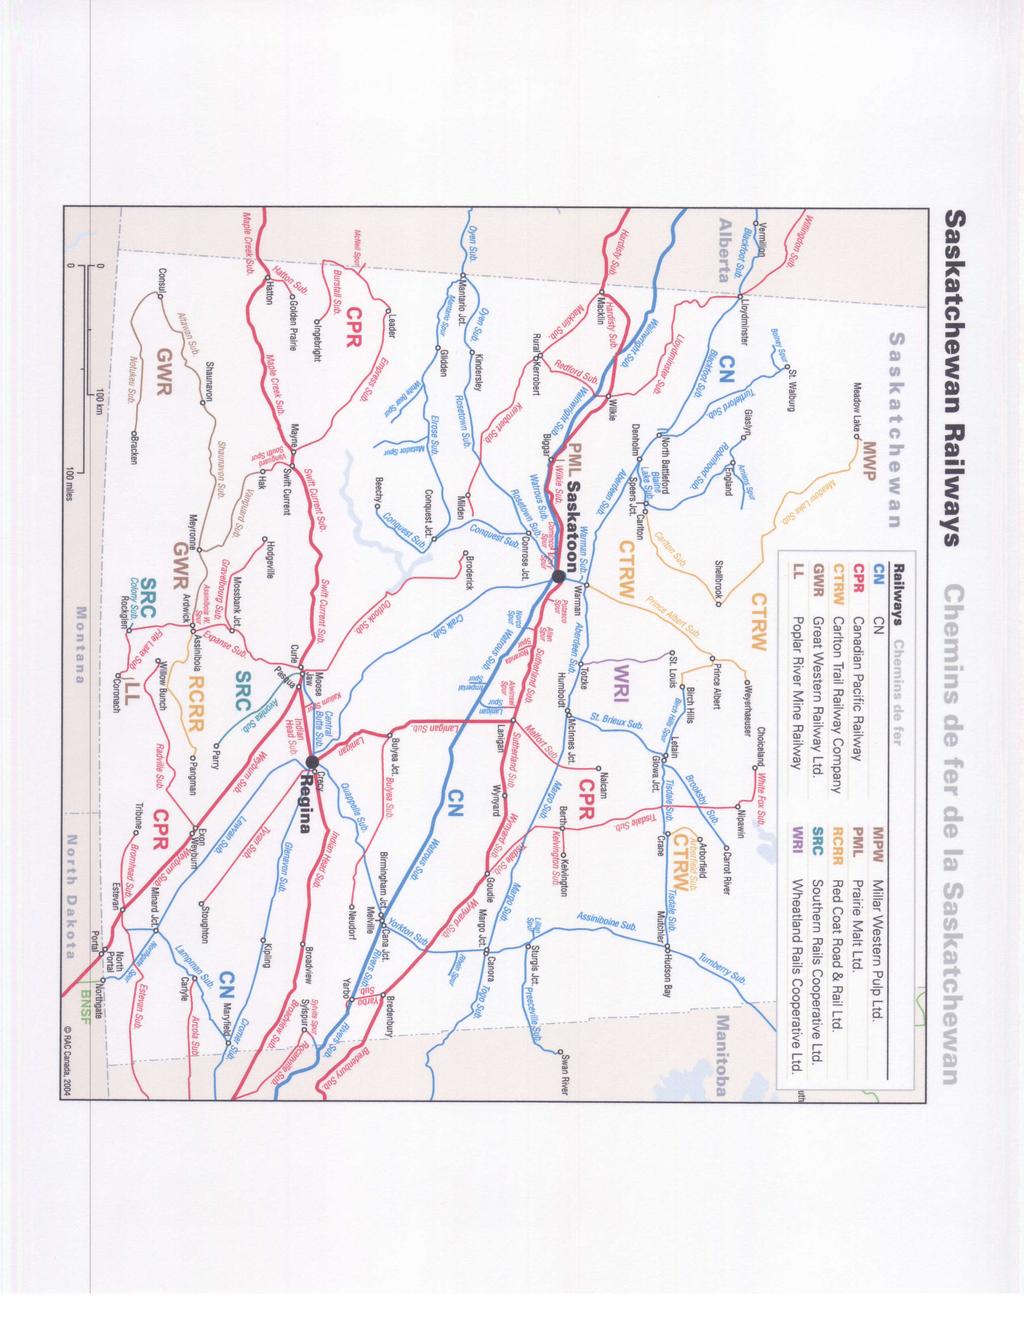
138
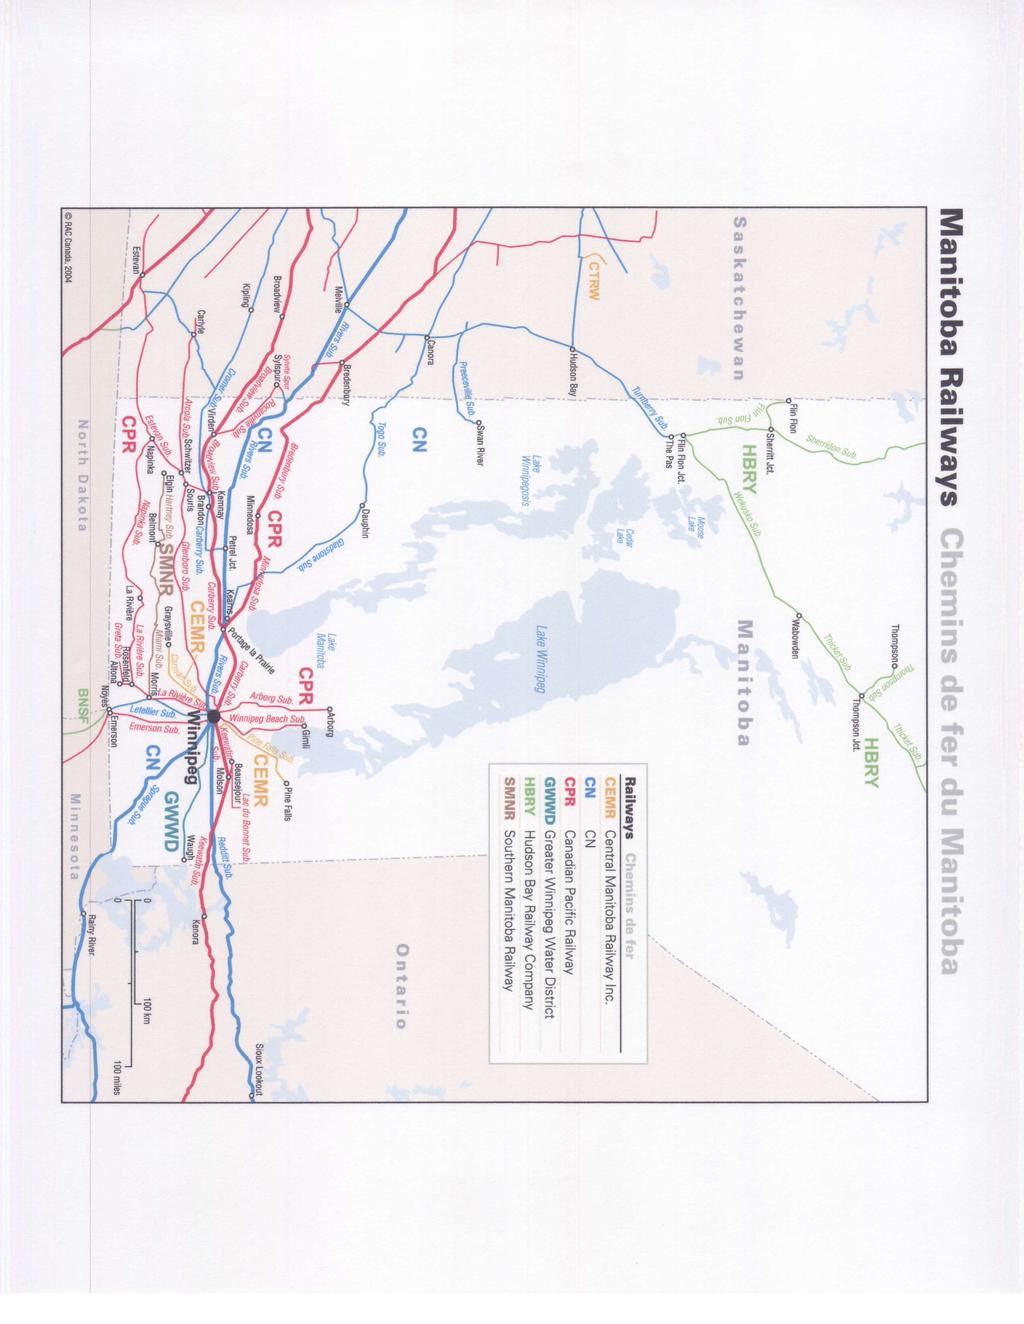
139
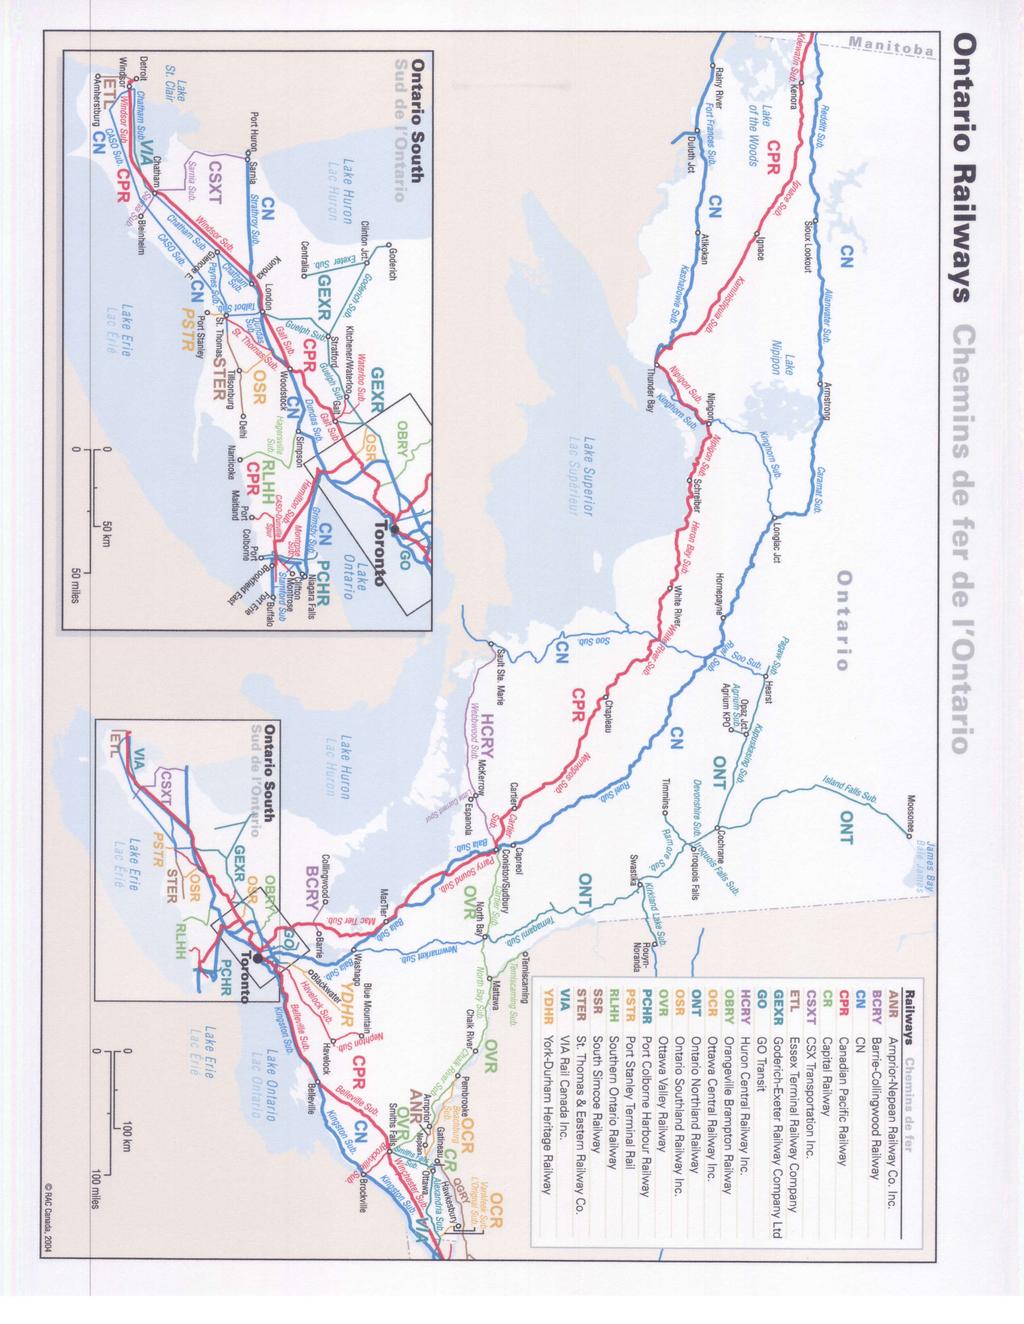
140
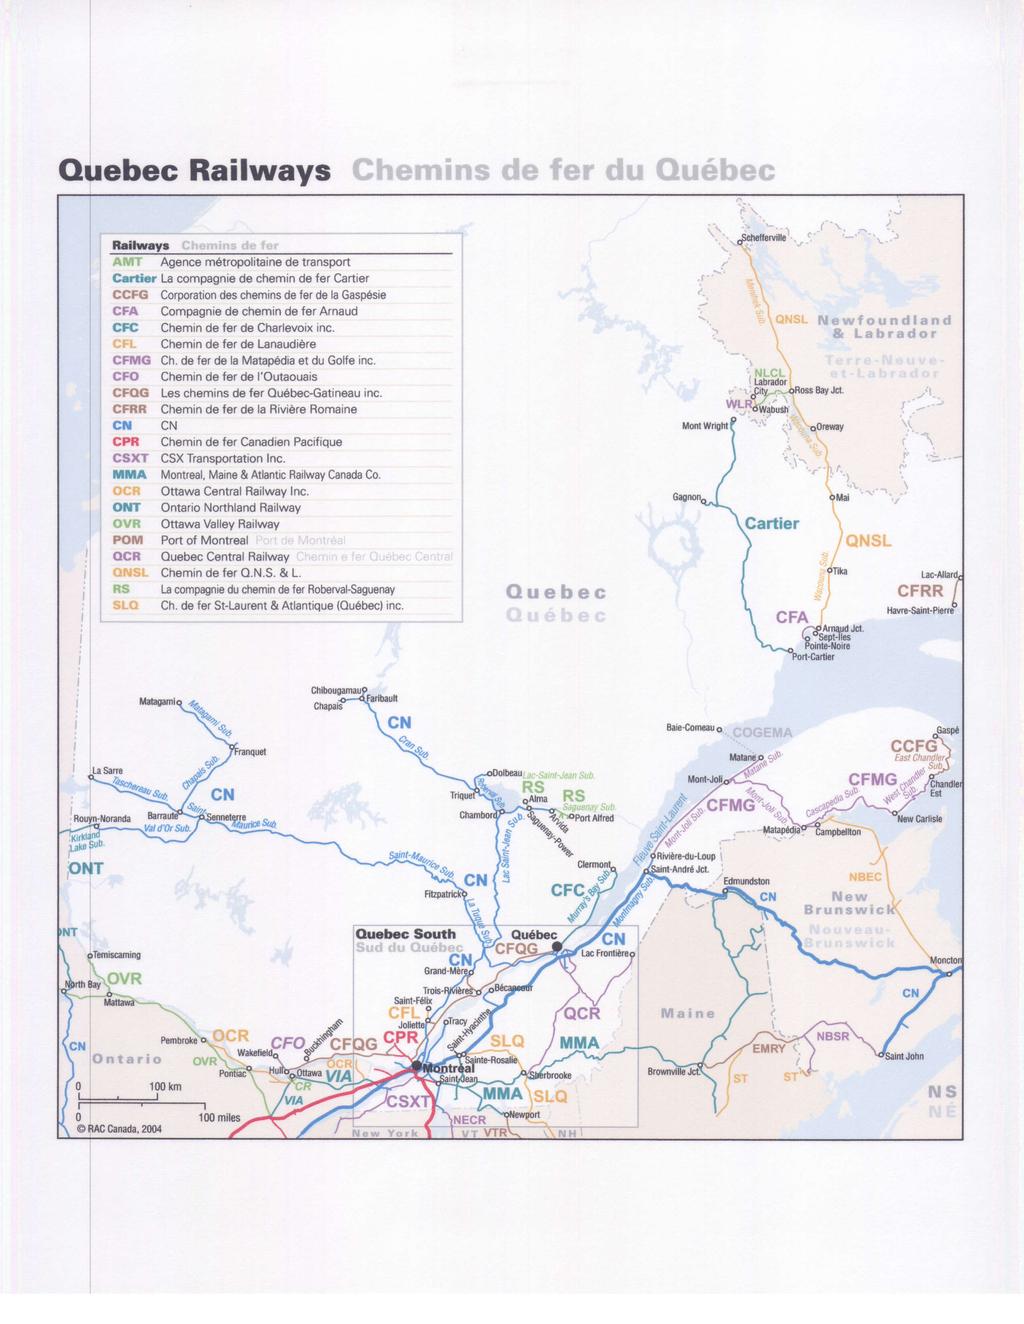
141
Canadian Canola Growers Association. Ernie Doerksen, General Manager phone: (204)
") Canadian Canola Growers Association Ernie Doerksen, General Manager email: ernied@ccga.ca phone: (204)745-1902 Manitoba Biodiesel Advisory Council Assess industry awareness, develop consensus on actions
Canadian Canola Growers Association Ernie Doerksen, General Manager email: ernied@ccga.ca phone: (204)745-1902 Manitoba Biodiesel Advisory Council Assess industry awareness, develop consensus on actions
CONTRIBUTION OF THE BIODIESEL INDUSTRY TO THE ECONOMY OF THE UNITED STATES
 CONTRIBUTION OF THE BIODIESEL INDUSTRY TO THE ECONOMY OF THE UNITED STATES Prepared for the National Biodiesel Board With Funding Support from the United Soybean Board 1 John M. Urbanchuk Director LECG,
Re: Comments on the Proposed Regulations Amending the Renewable Fuels Regulations
 July 17, 2013 Leif Stephanson, Chief, Fuels Section Oil, Gas and Alternative Energy Division Environment Canada 351 Saint-Joseph Boulevard, 9th Floor Gatineau, Quebec K1A 0H3 Re: Comments on the Proposed
Biodiesel Industry A Statewide Assessment
 University of Nebraska - Lincoln DigitalCommons@University of Nebraska - Lincoln Industrial Agricultural Products Center -- Publications & Information Industrial Agricultural Products Center 8-31-2006
Department of Legislative Services
 Department of Legislative Services Maryland General Assembly 2005 Session SB 740 Senate Bill 740 Budget and Taxation FISCAL AND POLICY NOTE Revised (Senator Middleton, et al.) Environmental Matters Renewable
Hybrid Biorefinery Biodiesel and Biogas Production Synergies
 Hybrid Biorefinery and Biogas Production Synergies Joe Tesar, Quantalux, LLC Dana Kirk, MSU Department of Biosystems and Agricultural Engineering Dennis Pennington, Michigan State Extension Charles Gould,
Abstract Process Economics Program Report 251 BIODIESEL PRODUCTION (November 2004)
") Abstract Process Economics Program Report 251 BIODIESEL PRODUCTION (November 2004) Biodiesel is an ester of fatty acids produced from renewable resources such as virgin vegetable oil, animal fats and used
Abstract Process Economics Program Report 251 BIODIESEL PRODUCTION (November 2004) Biodiesel is an ester of fatty acids produced from renewable resources such as virgin vegetable oil, animal fats and used
The Biodiesel Leader. Renewable Energy Group, Inc. (888) REG /13_00k
 REG /13_00k") The Biodiesel Leader Renewable Energy Group, Inc. (888) REG-8686 www.regi.com Renewable Energy Group and REG are registered trademarks of Renewable Energy Group, Inc. BIOHEAT is a registered trademark
The Biodiesel Leader Renewable Energy Group, Inc. (888) REG-8686 www.regi.com Renewable Energy Group and REG are registered trademarks of Renewable Energy Group, Inc. BIOHEAT is a registered trademark
USDA Projections of Bioenergy-Related Corn and Soyoil Use for
 USDA Projections of Bioenergy-Related Corn and Soyoil Use for 2010-2019 Daniel M. O Brien, Extension Agricultural Economist K-State Research and Extension The United States Department of Agriculture released
The Regional Municipality of York. Purchase of Six Battery Electric Buses
 1. Recommendations The Regional Municipality of York Committee of the Whole Transportation Services January 10, 2019 Report of the Commissioner of Transportation Services Purchase of Six Battery Electric
Biofuels Production to Reach B10 in 2012 and E10 in 2011
 THIS REPORT CONTAINS ASSESSMENTS OF COMMODITY AND TRADE ISSUES MADE BY USDA STAFF AND NOT NECESSARILY STATEMENTS OF OFFICIAL U.S. GOVERNMENT POLICY Required Report - public distribution Date: GAIN Report
National Economic Estimating Conference Held July 12, 2018 FINAL Long-Run Tables
 TABLE OF CONTENTS SECTION PAGE Executive Summary 2 Real Expenditures 4 Components of Income 6 Employment and Output 7 Financial Markets 9 Prices 10 Nominal Expenditures 12 The National Economic Estimating
Feasibility Study for a Biodiesel Refining Facility in the Regional Municipality of Durham
 Feasibility Study for a Biodiesel Refining Facility in the Regional Municipality of Durham Prepared for: Regional Municipality of Durham 605 Rossland Road East Whitby, ON L1N 6A3 Final Report March, 2006
BIODIESEL CHAINS. Biofuels in Poland
 BIODIESEL CHAINS Bucharest, 28th June 2007 Biofuels in Poland Oskar Mikucki KAPE 2007-08-29 The Polish National Energy Conservation Agency 1 History 1990s at the Radom Engineering University oilseed rape
Federal And New York Tax Incentives For Alternative Fuels
 Federal And New York Tax Incentives For Alternative Fuels NE Sun Grant Regional Feedstock Summit November 13, 2007 Statler Hotel at Cornell University Ithaca, New York 14853 Presented by: Gerald F. Stack
Tennessee Soybean Producers Views on Biodiesel Marketing
 Tennessee Soybean Producers Views on Biodiesel Marketing By Kim Jensen, Burton English, and Jamey Menard* April 2003 *Professors and Research Associate, respectively, Department of Agricultural Economics,
DOWNSTREAM PETROLEUM 2017 DOWNSTREAM PETROLEUM
 DOWNSTREAM PETROLEUM Economic Contribution of the Industry KEY MESSAGES Australian refineries have been very long standing participants in the local market as the major transport fuel suppliers, with all
Internal Revenue Service
 Internal Revenue Service Number: 201411004 Release Date: 3/14/2014 Index Number: 7704.00-00, 7704.03-00 ------------------------------------------------ --------------------------------------- --------------------------------------
Building a Regional Bioeconomy Seminar. Sustainable Biojet / Green Diesel Solutions. Mike Cey (P.Ag. EMBA) Ag-West Bio Inc. Saskatoon, SK.
 Ag-West Bio Inc. Saskatoon, SK.") Building a Regional Bioeconomy Seminar Sustainable Biojet / Green Diesel Solutions Mike Cey (P.Ag. EMBA) Ag-West Bio Inc. Saskatoon, SK. Agrisoma: Building a Sustainable Biomass Value Chain Agrisoma is
Building a Regional Bioeconomy Seminar Sustainable Biojet / Green Diesel Solutions Mike Cey (P.Ag. EMBA) Ag-West Bio Inc. Saskatoon, SK. Agrisoma: Building a Sustainable Biomass Value Chain Agrisoma is
Engineering Entrepreneurship. Ron Lasser, Ph.D. EN 0062 Class #
 Engineering Entrepreneurship Ron Lasser, Ph.D. EN 0062 Class #4 9-29-06 1 Biodiesel Incorporated The Case: It is about one group s efforts to identify a business opportunity Look at the Entrepreneurial
Natural and Economic Resources Appropriations Subcommittee 20 February W. Steven Burke President and CEO Biofuels Center of North Carolina
 Natural and Economic Resources Appropriations Subcommittee 20 February 2013 W. Steven Burke President and CEO Biofuels Center of North Carolina Three definitions: Biofuels Liquid transportation fuels.
March 18, Samira Monshi Seungwon Noh Wilfredo Rodezno Brian Skelly
 March 18, 2013 Samira Monshi Seungwon Noh Wilfredo Rodezno Brian Skelly Overview Project Objective Stakeholder Feedback Review of Alternative Jet Fuel Supply Chain Options Under Consideration 2 Project
Manitoba Economic Highlights
 Economic Overview Real Gross Domestic Product The Manitoba Bureau of Statistics estimates that Manitoba s real GDP grew 1.9% in 2016, above the national average of 1.4%. Manitoba s real GDP is expected
Canola is Going Green. JoAnne Buth ABIC 2007
 Canola is Going Green JoAnne Buth ABIC 2007 Canola Industry Overview Canola Biodiesel Environmental Impact Herbicide tolerant canola Growing Great 2015 Acres and Production 16000 14000 12000 10000 8000
Yukon s Independent Power Production Policy
 Yukon s Independent Power Production Policy Updated October 2018 BACKGROUND The Government of Yukon (YG) released the Energy Strategy for Yukon in January 2009. The strategy sets out YG s energy priorities,
Opportunities in Biodiesel, 2006 to 2010
 Published by: PETROLEUM TRENDS INTERNATIONAL, INC. 312 AMBOY AVENUE METUCHEN, NJ 08840 732-494-0405 Opportunities in Biodiesel, 2006 to 2010 A syndicated report designed to provide subscribers with high-valued
CITY OF MINNEAPOLIS GREEN FLEET POLICY
 CITY OF MINNEAPOLIS GREEN FLEET POLICY TABLE OF CONTENTS I. Introduction Purpose & Objectives Oversight: The Green Fleet Team II. Establishing a Baseline for Inventory III. Implementation Strategies Optimize
Particularities of Investment Projects in the Romanian Biodiesel Industry
 Particularities of Investment Projects in the Romanian Biodiesel Industry Alin Paul OLTEANU 1 Abstract The European biodiesel industry is currently facing major challenges with governments reducing their
Policy Note. Vanpools in the Puget Sound Region The case for expanding vanpool programs to move the most people for the least cost.
 Policy Note Vanpools in the Puget Sound Region The case for expanding vanpool programs to move the most people for the least cost Recommendations 1. Saturate vanpool market before expanding other intercity
Future Funding The sustainability of current transport revenue tools model and report November 2014
 Future Funding The sustainability of current transport revenue tools model and report November 214 Ensuring our transport system helps New Zealand thrive Future Funding: The sustainability of current transport
Senate Standing Committees on Economics 27 June 2014 PO Box 6100 Parliament House CANBERRA ACT 2600 By
 Senate Standing Committees on Economics 27 June 2014 PO Box 6100 Parliament House CANBERRA ACT 2600 By email: economics.sen@aph.gov.au Submission: Inquiry into Fuel Indexation (Road Funding) Bill 2014
STRATEGIC PRIORITIES AND POLICY COMMITTEE MAY 5, 2016
 STRATEGIC PRIORITIES AND POLICY COMMITTEE MAY 5, 2016 Shift Rapid Transit Initiative Largest infrastructure project in the city s history. Rapid Transit initiative will transform London s public transit
Biofuels, Energy Security, and Future Policy Alternatives. Wally Tyner
 Biofuels, Energy Security, and Future Policy Alternatives Wally Tyner Purdue University Ethanol Economics Ethanol has value as energy and as an additive to gasoline The energy content is about 68% of gasoline
Yukon Resource Gateway Project
 Yukon Resource Gateway Project Summary Application for National Infrastructure Component Funding January 2016 Introduction The Government of Yukon is seeking endorsement of the Yukon Resource Gateway
The Impact on Québec s Budget Balance
 ISSN 1715-2682 Volume 1, no. 2 August 17, 2005 Higher Fuel Prices The Impact on Québec s Budget Balance Summary 1. The increase in the price of gasoline at the pump since 1999 is due primarily to the soaring
Oilseeds and Products
 Oilseeds and Products Oilseeds compete with major grains for area. As a result, weather impacts soybeans, rapeseed, and sunflowerseed similarly to the grain and other crops grown in the same regions. The
Gold Saskatchewan Provincial Economic Accounts. January 2018 Edition. Saskatchewan Bureau of Statistics Ministry of Finance
 Gold Saskatchewan Provincial Economic Accounts January 2018 Edition Saskatchewan Bureau of Statistics Ministry of Finance Contents Introduction and Overview... 1 Introduction... 1 Revisions in the January
Feasibility of Establishing an E85 Fuelling Station in Oshawa
 (Oshawa Report To: From: Subject: Strategic Initiatives Committee Bob Duignan City Manager Item: SIC-09-54 File: B-1100-0082 Feasibility of Establishing an E85 Fuelling Station in Oshawa PUBLIC REPORT
19th ANNUAL WORLD FORUM AND SYMPOSIUM GLOBAL CHALLENGES, LOCAL SOLUTIONS
 19th ANNUAL WORLD FORUM AND SYMPOSIUM GLOBAL CHALLENGES, LOCAL SOLUTIONS The decision-making process of the agents belonging to the biodiesel production chain in Southern Brazil Régis Rathmann - PPE/COPPE/UFRJ
The Case for. Business. investment. in Public Transportation
 The Case for Business investment in Public Transportation Introduction Public transportation is an enterprise with expenditure of $55 billion in the United States. There has been a steady growth trend
For personal use only
 AER ISSUES NETWORK REVENUES DRAFT DECISIONS FOR ACT AND NSW ENERGY CUSTOMERS The Australian Energy Regulator (AER) has issued draft decisions on the revenue proposals submitted by ACT and NSW distribution
February 18, Samira Monshi Seungwon Noh Wilfredo Rodezno Brian Skelly
 February 18, 2013 Samira Monshi Seungwon Noh Wilfredo Rodezno Brian Skelly Overview Why Alternative Jet fuel? Background Problem Statement Technical Approach Work Breakdown Structure Schedule Literature
Australia s Experience in Alternative Transport Fuels. An Overview
 Australia s Experience in Alternative Transport Fuels An Overview Main alternative transport fuels in use in Australia Automotive LPG (Autogas) 6% of transport need requirements by volume 5% by energy
IMPORTANCE OF THE RENEWABLE FUELS INDUSTRY TO THE ECONOMY OF IOWA
 IMPORTANCE OF THE RENEWABLE FUELS INDUSTRY TO THE ECONOMY OF IOWA Prepared for the Iowa Renewable Fuels Association John M. Urbanchuk Technical Director - Environmental Economics January 20, 2012 Cardno
Methodology. Supply. Demand
 Methodology Supply Demand Tipping the Scale 1 Overview Latin America and the Caribbean, a major petroleum product importing region, provides an important counterbalance to surpluses in refined product
Growing Your Own Fuel
 Growing Your Own Fuel Feasibility of Mobile Processing Chris Callahan Callahan Engineering, PLLC www.vsjf.org www.callahan.eng.pro Funded by The High Meadows Fund and The Vermont Sustainable Agriculture
A green economy of biofuels in whose benefit?
 A green economy of biofuels in whose benefit? An alternative liquid energy at hand The rationale for developing countries: biofuel production to meet social goals But what determines the outcomes? 2 Case
Transit Vehicle (Trolley) Technology Review
 Technology Review") Transit Vehicle (Trolley) Technology Review Recommendation: 1. That the trolley system be phased out in 2009 and 2010. 2. That the purchase of 47 new hybrid buses to be received in 2010 be approved with
Transit Vehicle (Trolley) Technology Review Recommendation: 1. That the trolley system be phased out in 2009 and 2010. 2. That the purchase of 47 new hybrid buses to be received in 2010 be approved with
ABLC! Advancing Renewable Chemicals! November 10, 2014! Copyright 2014 Renewable Energy Group, Inc.
 ABLC! Advancing Renewable Chemicals! November 10, 2014! Safe Harbor Statement! This presentation contains certain forward-looking statements within the meaning of the Private Securities Litigation Reform
CITY OF LONDON STRATEGIC MULTI-YEAR BUDGET ADDITIONAL INVESTMENTS BUSINESS CASE # 6
 2016 2019 CITY OF LONDON STRATEGIC MULTI-YEAR BUDGET ADDITIONAL INVESTMENTS BUSINESS CASE # 6 STRATEGIC AREA OF FOCUS: SUB-PRIORITY: STRATEGY: INITIATIVE: INITIATIVE LEAD(S): BUILDING A SUSTAINABLE CITY
FOOD, FUEL AND FORESTS BIOFUEL TRENDS IN LATIN AMERICA
 FOOD, FUEL AND FORESTS IPC - ALARN SEMINAR ON CLIMATE CHANGE, AGRICULTURE AND TRADE BIOFUEL TRENDS IN LATIN AMERICA Regúnaga ; Nogueira - Moreira; Foster - Valdéz BOGOR, May 2008 STRATEGIES: MAIN DRIVERS
COMPANY OF THE YEAR. Sustainable Energy Founded in Agriculture
 COMPANY OF THE YEAR Sustainable Energy Founded in Agriculture Agrisoma: We are a crop company that develops and sells seeds of Brassica carinata a new drop-in oilseed for agriculture We have commercialized
Biodiesel. Emissions. Biodiesel Emissions Compared to Diesel Fuel
 Biodiesel Biodiesel is a mono-alkyl ester based oxygenated fuel made from vegetable or animals fats. It is commonly produced from oilseed plants such as soybean or canola, or from recycled vegetable oils.
STATISTICAL TABLES RELATING TO INCOME, EMPLOYMENT, AND PRODUCTION
 A P P E N D I X B STATISTICAL TABLES RELATING TO INCOME, EMPLOYMENT, AND PRODUCTION C O N T E N T S NATIONAL INCOME OR EXPENDITURE Page B 1. Gross domestic product, 1960 2009... 328 B 2. Real gross domestic
Biofuels Incentives: A Summary of Federal Programs
 Order Code RL33572 Biofuels Incentives: A Summary of Federal Programs Updated March 18, 2008 Brent D. Yacobucci Specialist in Energy and Environmental Policy Resources, Science, and Industry Division Biofuels
Brassica carinata Development Committee Markets and Utilization Value Chain
 Brassica carinata Development Committee Markets and Utilization Value Chain Brassica carinata: an Industrial Oilseed Agrisoma is commercializing Brassica carinata under the brand name Resonance to meet
Alternative Fuel Policy A Changing landscape. Gavin Hughes CEO Biofuels Association of Australia
 Alternative Fuel Policy A Changing landscape Gavin Hughes CEO Biofuels Association of Australia Add name of presentation here on Slide Master Who are the BAA and what do we do? The Biofuels Association
BIODIESEL 2020: Global Market Survey, Case Studies and Forecasts. Multi-Client Study pages - Published October, 2006 by Emerging Markets Online
 Global Market Survey, Case Studies and Forecasts Multi-Client Study - 405 pages - Published October, 2006 by Emerging Markets Online Global Market Survey, Case Studies and Forecasts Introduction and Executive
RICanada Comments on the British Columbia Greenhouse Gas Reduction (Renewable and Low Carbon Fuel Requirements) Act and the Renewable and Low Carbon
 Act and the Renewable and Low Carbon") RICanada Comments on the British Columbia Greenhouse Gas Reduction (Renewable and Low Carbon Fuel Requirements) Act and the Renewable and Low Carbon Fuel Requirements Regulation 2018-01-05 ATTN: Michael
RICanada Comments on the British Columbia Greenhouse Gas Reduction (Renewable and Low Carbon Fuel Requirements) Act and the Renewable and Low Carbon Fuel Requirements Regulation 2018-01-05 ATTN: Michael
Biofuels Incentives: A Summary of Federal Programs
 University of Nebraska - Lincoln DigitalCommons@University of Nebraska - Lincoln Congressional Research Service Reports Congressional Research Service 2010 Biofuels Incentives: A Summary of Federal Programs
CNG as a Transport Fuel - Economic Benefits 17 th November 2011
 CNG as a Transport Fuel - Economic Benefits 17 th November 2011 6 Grand Canal Wharf, South Dock Road, Ringsend, Dublin 4, Ireland. Tel: +353 1 6670372 Fax: +353 1 6144499 Web: www.dkm.ie Our scope of work
A Global Solution for Sustainable Biofuels
 A Global Solution for Sustainable Biofuels 1 Agrisoma Develops and Sells Carinata Seeds and More Expanding sales of Carinata seeds a non-food, sustainable crop for biofuels and high protein feed Commercial
Energy Independence. tcbiomass 2013 The Path to Commercialization of Drop-in Cellulosic Transportation Fuels. Rural America Revitalization
 Energy Independence The Path to Commercialization of Drop-in Cellulosic Transportation Fuels Rural America Revitalization Forward Looking Statements These slides and the accompanying oral presentation
Valvoline Fourth-Quarter Fiscal 2016 Earnings Conference Call. November 9, 2016
 Valvoline Fourth-Quarter Fiscal 2016 Earnings Conference Call November 9, 2016 Forward-Looking Statements This presentation contains forward-looking statements within the meaning of Section 27A of the
The oil fields in the NCS are located in the North Sea, Norwegian Sea, and Barents Sea.
 A.2 Norway Volumes of Associated Gas Flared on Norwegian Continental Shelf Norway is a major oil producer, and its oil fields are located offshore in the Norwegian Continental Shelf (NCS). 81 In 2002,
Appendix B STATISTICAL TABLES RELATING TO INCOME, EMPLOYMENT, AND PRODUCTION
 Appendix B STATISTICAL TABLES RELATING TO INCOME, EMPLOYMENT, AND PRODUCTION C O N T E N T S Page NATIONAL INCOME OR EXPENDITURE: B. Gross domestic product, 959 005... 80 B. Real gross domestic product,
Oil Seeds to Jet Fuels: The Community Connection Cornelia Butler Flora Joe Jakubek Edward Green
 Oil Seeds to Jet Fuels: The Community Connection Cornelia Butler Flora Joe Jakubek Edward Green BUT the pressure is for drop-in technology. Anything too innovative, such as hydrogen, would require way
Forecasting of Russian economy. Energy sector model
 Forecasting of Russian economy Energy sector model Alexandria September, 2014 Energy Sector in Russian Economy Energy sector of Russian economy Produces 14,2% of GDP Forms 66,5% of Russian exports (33%
BIODIESEL CHAINS. Biofuels in Poland
 BIODIESEL CHAINS Nicosia, 18th January 2007 Biofuels in Poland Oskar Mikucki KAPE 2007-08-29 The Polish National Energy Conservation Agency 1 Development of biofuels market Development of biofuels in Poland
Guide to interviews with producers and agriculture cooperatives
 Guide to interviews with producers and agriculture cooperatives General data/characterization Person interviewed in this questionnaire: Title (job description): Total area: Total cultivated area: Cultivated
Moçambique Biofuels Seminar
 Moçambique Biofuels Seminar Feedstock in Moçambique and Factors Influencing Choice 11 June 2007 Feedstock cost drives the feasibility of the biodiesel value chain Oilseed Oil Extraction Oil Refining Distribution
Green Power Feasibility Study Econet Lesotho
 Green Power This document has been written to provide information to mobile operators who are considering or planning to deploy green renewable power resources for base station and transmission sites.
An Economic Analysis of Legislation for a Renewable Fuels Requirement for Highway Motor Fuels
 An Economic Analysis of Legislation for a Renewable Fuels Requirement for Highway Motor Fuels John M. Urbanchuk Executive Vice President AUS Consultants November 2001 EXECUTIVE SUMMARY Congress is considering
Ethanol Supply Chain and Industry Overview: More Harm Than Good?
 Ethanol Supply Chain and Industry Overview: More Harm Than Good? Authors: Sarah L Bruce Advisor: Alexis Hickman Bateman, Edgar Blanco Sponsor: Yossi Sheffi MIT SCM ResearchFest May 23-24, 2012 Ethanol
Abstract Process Economics Program Report 222 PETROLEUM INDUSTRY OUTLOOK (July 1999)
") Abstract Process Economics Program Report 222 PETROLEUM INDUSTRY OUTLOOK (July 1999) Global energy demand is rising, with fossil fuels oil, natural gas, and coal continuing to provide more than 90% of
Abstract Process Economics Program Report 222 PETROLEUM INDUSTRY OUTLOOK (July 1999) Global energy demand is rising, with fossil fuels oil, natural gas, and coal continuing to provide more than 90% of
ENERGY STRATEGY FOR YUKON. Independent Power Production Policy
 ENERGY STRATEGY FOR YUKON Independent Power Production Policy May 20, 2014 Page 2 of 11 BACKGROUND The Government of Yukon released the Energy Strategy for Yukon in January 2009. The strategy sets out
Evaluating opportunities for soot-free, low-carbon bus fleets in Brazil: São Paulo case study
 Evaluating opportunities for soot-free, low-carbon bus fleets in Brazil: São Paulo case study Tim Dallmann International seminar Electric mobility in public bus transport: Challenges, benefits, and opportunities
Canada s Refining Industry Sector Performance Report
 Canada s Refining Industry 217 Sector Performance Report The Canadian Fuels Association represents the industry that produces, distributes and markets petroleum products in Canada including 95 percent
Expeller Technology and Plant Design Critical to Sustainability of Vegetable Oil Production Facilities
 Expeller Technology and Plant Design Critical to Sustainability of Vegetable Oil Production Facilities Nebraska Screw Press has been a strong believer in the opportunity to successfully develop community
Sunflower Oil Imports Increase for Ration Card Program
 THIS REPORT CONTAINS ASSESSMENTS OF COMMODITY AND TRADE ISSUES MADE BY USDA STAFF AND NOT NECESSARILY STATEMENTS OF OFFICIAL U.S. GOVERNMENT POLICY Required Report - public distribution Date: GAIN Report
Biofuel Potential for Transport Sector in Sudan
 UNCTAD 17th Africa OILGASMINE, Khartoum, 23-26 November 2015 Extractive Industries and Sustainable Job Creation Biofuel Potential for Transport Sector in Sudan By Abdel Azim Wida a General Directorate
Wallace E. Tyner, Professor In collaboration with Farzad Taheripour Purdue University Michael Wang Argonne National Lab
 Global Land Use Changes due to US Cellulosic Biofuel Program: A Preliminary Analysis And Updated Corn Ethanol, Biodiesel, and Sugarcane Ethanol Estimates Wallace E. Tyner, Professor In collaboration with
Investor Presentation June, 2014
 Investor Presentation June, 2014 Bob Espey (CEO) and Mike Lambert (CFO) Investor Relations tom.mcmillan@parkland.ca 800-662-7177 ext. 2533 Forward Looking Statements Certain information included herein
The feasibility of biodiesel production at different scales. Kerr Walker and Elaine Booth, SAC
 The feasibility of biodiesel production at different scales Kerr Walker and Elaine Booth, SAC 1 Content Drivers for liquid biofuel development in the UK Key issues affecting the economics of biofuels Feasibility
WNC s Biofuels Market & Supply Chain
 WNC s Biofuels Market & Supply Chain Regional Biofuels Educational Workshop Western Piedmont Council of GovernmentsHickory, NC August 22, 2014 Jeremy C Ferrell Appalachian State University Ferrelljc@appstate.edu
Welcome and Introduction June 2007
 OVERVIEW Welcome and Introduction June 2007 Dear Subscriber, APAC Biofuels Consultants - a joint venture of EnergyQuest and Ecco Consulting - are pleased to present Australian Biofuel Projects 2007. This
Process Economics Program
 IHS Chemical Process Economics Program Report 290 Bio-Butadiene By Dipti Dave and Susan Bell December 2014 ihs.com/chemical IHS Chemical agrees to assign professionally qualified personnel to the preparation
BASELINE STUDY ON VEHICLE INVENTORY AND FUEL ECONOMY FOR MALAWI (KEY FINDINGS)
") BASELINE STUDY ON VEHICLE INVENTORY AND FUEL ECONOMY FOR MALAWI (KEY FINDINGS) TASK TEAM- LEAD INSTITUTION Ministry of Natural Resources, Energy and Mining Mount Soche Hotel, Blantyre. 11 th December 2017
BASELINE STUDY ON VEHICLE INVENTORY AND FUEL ECONOMY FOR MALAWI (KEY FINDINGS) TASK TEAM- LEAD INSTITUTION Ministry of Natural Resources, Energy and Mining Mount Soche Hotel, Blantyre. 11 th December 2017
RNG Production for Vehicle Fuel. April 4, 2018
 RNG Production for Vehicle Fuel April 4, 2018 Forward-Looking Statements This presentation contains forward-looking statements within the meaning of Section 27A of the Securities Act of 1933 and Section
MEDIA RELEASE. June 16, 2008 For Immediate Release
 MEDIA RELEASE June 16, 2008 For Immediate Release Recommendations to Keep Trolleys Released Alternative Proposal for Trolleys Ensures City s Sustainability The Edmonton Trolley Coalition, a non-profit
THIS REPORT CONTAINS ASSESSMENTS OF COMMODITY AND TRADE ISSUES MADE BY USDA STAFF AND NOT NECESSARILY STATEMENTS OF OFFICIAL U.S.
 THIS REPORT CONTAINS ASSESSMENTS OF COMMODITY AND TRADE ISSUES MADE BY USDA STAFF AND NOT NECESSARILY STATEMENTS OF OFFICIAL U.S. GOVERNMENT POLICY Required Report - public distribution Date: GAIN Report
Global Biofuels Market & Policy Developments
 Global Biofuels Market & Policy Developments Liisa Kiuru Executive Director, International Fuel Quality Center lkiuru@ifqc.org Presented to Missao Tecnica Internacional de Logistica: Petroleo Presentation
Biomass-based Diesel Policy Options: Larger RFS Requirements and Tax Credit Extension
 February 2014 Biomass-based Diesel Policy Options: Larger RFS Requirements and Tax Credit Extension FAPRI-MU Report #01-14 Providing objective analysis for more than 25 years www.fapri.missouri.edu Published
An Asset Management Plan for Transit And Access Transit Fleet
 Header Title ATTACHMENT 1 Building Better Transit: An Asset Management Plan for Transit And Access Transit Fleet 2 June 2016 Transit & Access Transit Fleet INTRODUCTION The Saskatoon Transit fleet is currently
Department of Energy Analyses in Support of the EPA Evaluation of Waivers of the Renewable Fuel Standard November 2012
 Department of Energy Analyses in Support of the EPA Evaluation of Waivers of the Renewable Fuel Standard November 2012 Ethanol Demand Curve for 2012 and 2013 In support of EPA analyses of the 2012 RFS
Weight Allowance Reduction for Quad-Axle Trailers. CVSE Director Decision
 Weight Allowance Reduction for Quad-Axle Trailers CVSE Director Decision Brian Murray February 2014 Contents SYNOPSIS...2 INTRODUCTION...2 HISTORY...3 DISCUSSION...3 SAFETY...4 VEHICLE DYNAMICS...4 LEGISLATION...5
1. Introduction Regional Analysis...4
 Table of Contents i Table of Contents 1. Introduction...1 1.1 Opportunities for international manufacturers...1 1.2 Objectives and structure of this report...2 2. Regional Analysis...4 2.1 Description
Effect of Biodiesel Production on Life-Cycle Greenhouse Gas Emissions and Energy Use for Canada
 Effect of Biodiesel Production on Life-Cycle Greenhouse Gas Emissions and Energy Use for Canada Brian G. McConkey 1, Stephen Smith 2, James Dyer 3, Ravinderpal Gil 2, Suren Kulshreshtha 4, Cecil Nagy 4,
Biofuels Incentives: A Summary of Federal Programs
 Biofuels Incentives: A Summary of Federal Programs Brent D. Yacobucci Section Research Manager January 11, 2012 CRS Report for Congress Prepared for Members and Committees of Congress Congressional Research
Electric Vehicles and State Funds
 Electric s and State Funds Current Contributions in Massachusetts and Long-Term Solutions to Transportation Funding March 2018 Overview Electric vehicles are a practical, commercially available option