Karpuk Aircraft KR-1 Multi-Mission Amphibian
|
|
|
- Janel Greene
- 6 years ago
- Views:
Transcription


 Department")
1 Karpuk Aircraft KR-1 Multi-Mission Amphibian Response to 2016/2017 AIAA Foundation Graduate Individual Aircraft Design Competition Presented by Embry-Riddle Aeronautical University (Daytona Beach) Department of Aerospace Engineering


2 Karpuk Aircraft Stanislav Karpuk Design Engineer AIAA account number: Advisor: Dr Snorri Gudmundsson
3 Executive Summary Karpuk Aircraft would like to present a response to the request for proposal (RFP) provided by the American Institute of Aeronautics and Astronautics (AIAA) for year. Due to potential benefits of amphibious passenger and cargo aircraft for regional aviation with limited resources to create airports and lack of existent aircraft designed for the presented requirements, the Company was asked to design an aircraft capable of carrying between 20 and 49 passengers or 5000lb of payload at the cruise speed no less than 200 knots. The aircraft shall be able to complete both VFR and IFR flights and complete four different missions. According to the first mission, the aircraft must fly 259nmi with 20 passengers and be able to take-off within 1500ft over a 50ft obstacle to a runway with dry pavement at Sea Level (SL) and 5000ft altitude with air temperature of F at SL. The second mission is similar to the first, but the take-off is performed from water and the take-off distance shall not exceed 1900ft over a 50ft obstacle. The third mission requires the aircraft to complete a 1000ft flight with maximum amount of passengers, and the last one asks the aircraft to demonstrate a 500nmi flight with 5000lb cargo and be prepared for the next flight within 60 minutes. The aircraft shall be capable of taking off and landing from different quality of runways as well as fresh and salt water. In addition, the aircraft must demonstrate 20% reduction in fuel burn per passenger comparing to existing aircraft for a similar range. The aircraft will be certified with FAA 14 CFR Part 25, and the passenger model shall enter into the service in The KR-1 designed by Karpuk Aircraft is a conventional top-wing twin-turboprop aircraft featuring conventional tail for Short take-off and landing (STOL)
4
5
6 Table of Contents List of Figures... 7 Index of tables Introduction Mission Analysis Competition study Concept selection and Initial sizing Aircraft Concept Trade study Design Sizing and layout Aerodynamic Design and analysis Airfoil Selection Wing configuration Design Lift analysis Drag analysis High-Lift Devices Aerodynamic performance Propulsion Engine selection Propeller analysis and thrust estimation Engine Placement Weights Weight Estimations Center of Gravity Hull and floats design Hull shape Design Floats design Aircraft performance Take-off and Landing Ground take-off and landing Water take-off and landing Climb
7 7.3. Cruise Steady-state turn Descent Structures V-n Diagram Material selection Wing and tail structure Stability and Control Static stability and control analysis Aircraft systems and layout Landing gear Cabin pressurization and air conditioning Fuel system Fuselage layout Anti-icing system Cost analysis Fuel economy Research, Development, Testing, and Evaluation Operational Costs Compliance Matrix Conclusion References
8 List of Figures Figure 1.1.1: Mission profile for a 1000nm passenger mission...13 Figure 2.1.1: Concept 1 model.15 Figure 2.1.2: Concept 2 model...16 Figure Concept 3 model...16 Figure Concept 4 model Figure Weights for different strut configurations...18 Figure CD for different strut...18 Figure Fuel-to-Weight ratios for different strut configurations.19 Figure Constraint diagram..19 Figure NACA 65(2)-415 airfoil geometry..22 Figure Wing layout...22 Figure KR-1 VSP model.24 Figure Lift coefficient comparison.24 Figure Lift distribution at maximum AOA from OpenVSP 24 Figure NACA65(2)-415 O-grid..26 Figure Solution residuals 26 Figure Airfoil pressure 26 Figure Parasitic drag build-up at cruise speed 27 Figure Lift coefficient for different configurations 28 Figure Drag coefficient for different configurations...29 Figure Lift-to-drag ratio for different aircraft configurations..30 Figure Pratt & Whitney Canada PT6A-67B 31 Figure Thrust output at different altitudes..32 Figure Efficiency at different altitudes..32 Figure Engine layout and propeller dimensions...33 Figure Weight breakdown comparison using different methods 35 Figure Load and balance diagram for Take-off, Landing, and Cruise 36 Figure Hull nomenclature and common dimensions.37 Figure Front view and hull dimensions..38 7
9 Figure Side view and hull dimensions..39 Figure Hull load factor vs stall speeds at different deadrise angles for landing configuration..40 Figure Weight coefficient relation..41 Figure Afterbody deadrise angle relation 41 Figure Sternpost angle relation at step depths 41 Figure Aftbody-to-beam ratio based on step depth 42 Figure Float volume and water clearance vs float location 42 Figure Float layout and dimensions 43 Figure Take-off run for for the 250nmi STOL mission with 20 passenger at sea level.45 Figure Water hull resistance estimation.47 Figure Trim angle estimation.47 Figure Climb performance for a 1000nmi mission weight with full payload 50 Figure Flight Envelope...51 Figure Payload Range Curve..51 Figure Turn Performance Map 52 Figure Descent Performance Diagram 53 Figure V-n Diagram at cruise altitude 54 Figure Wing coordinate system used for structural analysis..55 Figure Internal forces and moments experienced by the wing. V=215KTAS, H=16500ft, n=3 56 Figure Internal forces and moments experienced by the H-tail. V=215KTAS, H=16500ft, n=3 56 Figure Internal forces and moments experienced by the H-tail. V=215KTAS, H=16500ft, n=3 57 Figure Wing Front and rear spar dimensions..58 Figure Horizontal tail Front and rear spar dimensions 59 Figure Vertical Front and rear spar dimensions.59 Figure Wing structural layout 59 Figure Empennage structural layout..59 Figure Shear and Moment diagrams of the fuselage...60 Figure Stringers layout.60 Figure Horizontal tail layout...61 Figure Horizontal tail vertical location diagram..61 Figure Engine-out case free-body diagram
10 Figure Vertical tail layout...62 Figure Wake blockage diagram..63 Figure Aileron layout..63 Figure Longitudinal motion poles and zeros..64 Figure Lateral motion poles and zeros 64 Figure Longitudinal landing gear location...66 Figure Lateral landing gear location.67 Figure Landing gear retraction.68 Figure Landing gear layout...69 Figure Fuel tank layout.70 Figure Cabin top view..70 Figure Cabin front view.71 Figure Seat pitch...71 Figure Doors dimensions..71 Figure KR-1 cargo configuration.71 Figure Baggage compartment side view..72 Figure Cockpit view.72 Figure Anti-icing cross-section.72 Figure Anti-icing system layout 72 Figure RTD&E Cost breakdown..74 Figure Production breakeven point (Eastlake Model)..75 Figure Operational cost breakdown..75 9
11 Index of tables Table Competitor aircraft parameters.14 Table Trade study...17 Table Airfoil characteristics of best selected airfoils at Re=9 million 21 Table Scoring analysis of the airfoils.21 Table Wing geometric parameters..23 Table Comparison of stall behavior 24 Table Critical boundary layer locations with respect to the chord.26 Table Parasitic drag build-up at cruise speed.27 Table Geometric layout and of flaps, slats, and spoilers..28 Table CLmax for various configurations 29 Table Pratt & Whitney Canada PT6A-PT6A-68C data..31 Table Maximum tip Mach number for main flight altitudes 32 Table General weight data..34 Table Empty-weight breakdown.35 Table CG comparison between Sdraey and KR Table Sea State 3 requirements and maximum wave height for KR-1 42 Table FAR Part 25 speed requirements and values 44 Table Ground take-off distance data for different mission cases at sea level 45 Table Ground take-off distance data for different mission cases at 5000ft. 46 Table Ground landing distance data for different mission cases at sea level 46 Table Ground landing distance data for different mission cases at 5000ft.47 Table Water take-off distance data for different mission cases at sea level and 5000ft 49 Table Water landing distance data for different mission cases at sea level..49 Table Water landing distance data for different mission cases at 5000ft..49 Table Payload, Range, and Range for critical points of the Payload Range Curve.52 Table Aluminum 2024-T4 material properties 54 Table Horizontal tail parameters.61 Table Vertical tail parameters.63 10
12 Table Rolla rate requirements comparison.63 Table Static stability coefficients 64 Table Dynamic stability analysis of KR Table Percent MTOW experienced by the nose landing gear at cg limits.66 Table Tires specs used for KR-1 landing gear..68 Table Fuel economy comparison.73 Table Rates for aircraft development
13 1. Introduction 1.1. Mission Analysis Current RFP provided by AIAA requires designing a Multi-Mission Amphibious (MMA) aircraft capable of carrying at least 20 and no more than 49 passengers. The aircraft shall be able to complete IFR and VFR mission, have a range of 1000nmi with maximum passenger density. Cruise speed of the aircraft must be greater than 200 knots with more than 250 knots desired. The aircraft must demonstrate at least 20% reduction in fuel burn per passenger comparing to existing aircraft for a similar mission range (200nmi). Minimum seat pitch of 28 in must be satisfied and minimum baggage volume for each passenger shall not be less than 4 cubic feet. The aircraft shall be able to demonstrate a variety of take-off capabilities. Take-off and landing can be performed from dirt, grass, metal mat, gravel, asphalt, etc. Water take-off and landing capability must include both fresh and salt water. In addition, STOL capabilities must be satisfied: the aircraft loaded with 20 passengers for the range of 250nmi shall take-off and land within 1500ft on a dry pavement and within 1900ft on water. Cargo mission requires the aircraft to carry 5000 lb of payload for a 500 nmi mission. The aircraft shall be able to be prepared for the next flight within 60 minutes (unload, refuel, and load cargo) and is desired to have an ability to carry odd shaped cargo or a standard container. Existing or coming to service by 2027 engines must be considered for the current aircraft design. The crew must consist of two pilots and one cabin crew member. Anti-icing system must be installed on the aircraft to prevent icing. The aircraft will be certified with FAA 14 CFR Part 25, and the passenger version should enter the service by The mission profile is common for all mission except for the flight range. Figure presents the longest IFR mission with maximum density of passengers. 12
14 Figure IFR Mission profile for a 1000nm passenger mission Several challenges can be observed from the mission requirements. The first one deals with short take-off and landing requirements that will put significant constraints on engine selection and configuration selection. High-lift devices study will play an important role in achieving the requirements as well. In addition, fuel consumption forces the configuration to demonstrate significant efficiency improvement to satisfy the requirements. Finally, short-time preparation for a cargo flight requires wise configuration and layout solution to satisfy the task Competition study A number of similar aircraft were studied to investigate common geometric and performance parameters. Amphibious aircraft with passenger capacity of more than 18 passengers were considered for the competition. Three aircraft were chosen: DHC-6 Twin Otter Series 400 [1], Grumman G-73 Mallard [1], and Beriev Be-112 [2] concept. Table shows aircraft properties of the competitors. Based on the comparison study, common aspect ratio of the aircraft ranges from eight to ten, service ceiling is close to 25000ft, and power-to-weight ratio lies between and However, other parameter such as gross weight and wing loading vary substantially. 13
 4280 5700 5182 Empty Weight (lb) 6881 8750 Wing Span (ft) 65 66.")
 1200 ROC SL (ft/min) 1600 1350 Service Ceiling (ft) 25000 24500 Cruise Speed")
 779 540 Power-to-Weight ratio (hp/lb) 0.12 0.086 0.12 Table 1.2.1. Competitor aircraft parameters 14")
15 Aircraft name DHC-6 Twin Grumman G-73 Beriev Be-112 Otter Series 400 Mallard Maximum TO Weight (lb) Payload Weight (lb) Empty Weight (lb) Wing Span (ft) Wing area (ft 2 ) AR W/S (lb/ft 2 ) TO field Length (ft) 1200 ROC SL (ft/min) Service Ceiling (ft) Cruise Speed max (KCAS) Cruise Speed (KCAS) 157 Stall speed clean (KCAS) 74 Stall speed flaps (KCAS) 58 Range max (nmi) Power-to-Weight ratio (hp/lb) Table Competitor aircraft parameters 14
16 2. Concept selection and Initial sizing 2.1. Aircraft Concept Trade study Based on mission requirements, the following features of the aircraft must be satisfied: 1. The aircraft must be a top wing aircraft 2. Engines must be mounted such that water spray does not damage the propeller. 3. The cargo door must be big enough to allow cargo to be put into the fuselage and high enough to load cargo in the aircraft being on the water. Four concepts shown in Figures were created and scored among each other to determine the best configuration for the current mission. Concept 1 Concept 1 features a top wing with a conventional empennage configuration. The hull design is also conventional. The cabin and cargo doors are located on the side of the fuselage. One of the cabin doors is a double door used for cargo loading. The engines are located on the wing. Benefits of this design include reliability of the configuration and substantial experience regarding each feature of the aircraft. However, current design lack innovation. In addition, Engines placed on the wings may suffer from excessive water spray, so careful hull design and spray strips addition must be done. Figure Concept 1 model 15

17 Concept 2 Concept 2 also features a top wing and a conventional hull shape, but it has a twin vertical tail due to a back cargo door which helps load bigger and more irregular cargo shapes. Because of the cargo door, the horizontal tail is put on top of the vertical tail. Engines are put in the vertical tails, so they will not be affected by water spray during take-off and landing. However, trim requirements due to high moment arm produced by the engines and weight penalty due to structural reinforcement of the vertical tail may be significant drawbacks. In addition, the moment arm created by the engine placement Figure Concept 2 model may cause problems during take-off in terms of the aircraft rotation: engines will cause the airplane to pitch down and counteract the elevator to perform the take-off rotation and lift off. Another drawback may include extra effort to deliver fuel to the engine which is placed away from the wings. Concept 3 Concept 3 features almost same characteristics like Concept 2, but does not have a back cargo door so it features almost all benefits and drawbacks of the Concept 2. Figure Concept 3 model 16

18 Concept 4 Concept 4 is similar to Concept 1, but it features struts. Although struts may not show a significant difference in the overall configuration comparing to Concept 1, strutted wing may be substantially lighter than the cantilever one, so gross weight of the aircraft may be lower which may affect aircraft performance. On the other hand, struts may substantially decrease lift-to-drag ratio due to additional drag developed by struts, so performance of the aircraft may be reduced. Careful approximation of the strutted wing parameters such as weight and glide ratio must be considered to determine if this concept shows benefits comparing to others. Figure Concept 4 model To determine the best concept for the current mission, trade study was performed. The concept(s) that satisfy the requirement best get the full score while others get zero. Scores from each requirement are summed and weighted to determine the most suitable aircraft. Table presents the trade study results. Concept 1 shows more benefits for the current mission comparing to other aircraft. Scale Concept 1 Concept2 Concept 3 Concept 4 Propeller clearance above the water Cargo reload easiness Take-off performance Fuel required to complete the mission Structural weight penalty fuel path to engine Total Table Trade study 17
19 However, potential interest was concentrated in concept 4 due to ability to reach a balance between weight and performance that will outperform the conventional concept, so it may outperform Concept 1. To determine whether the Concept 4 has benefits, a series of measurements were done. After the construction of the Constrained diagram, determination of basic aerodynamics, performance, and flight dynamics, estimation of initial and component breakdown and development of the structural analysis MATLAB code (all details will be discussed in Section 8), it became possible to estimate the effect of struts on the design of the airplane. The key criterion if struts give any benefits to the overall design is the fuel weight ratio. The smaller the ratio is for the same aircraft payload and range, the smaller fuel per passenger will be required which is one of the requirements for the current proposal. Aspect ratio of the wing was fixed and equal to 9. Strut thickness of 25% of the strut chord was assumed and structural analysis was performed on struts at cruise conditions with load factor of three to ensure no failure at given loads. Drag increment due to struts was estimated using Gudmundsson [3]. Results of wing weight, gross weight, drag increment, and fuel-to-weight ratios are shown in Figures to Wing Weight Gross Wight Drag coefficient due to struts W (lb) W (lb) CD no strut Y=10ft Y=15ft Y=20ft no strut Y=10ft Y=15ft Y=20ft Figure Weights for different strut configurations Figure CD for different strut configurations Results show that gross weight of the aircraft with struts reaches similar value to the cantilever wing at 20ft spanwise. The wing weight with struts applied reduces with the position of the struts, but the fuel-to-weight 18
20 ratio increases with struts due to drag increase, so the struts do not introduce any benefit to the concept and the cantilever wing wins. Fuel-to-Weight ratio Fuel-to-WEight ratio no strut Y=10ft Y=15ft Y=20ft Figure Fuel-to-Weight ratios for different strut configurations 2.2 Design Sizing and layout Initial sizing was performed to come up with the initial measurements of the aircraft geometry. Constraint diagram shown in Figure presents key aircraft performance parameters: cruise, constant-velocity turn, take-off from SL, take-off from 5000ft, climb, and service ceiling. Cruise altitude was chosen to be ft at SL temperature of F. The aircraft performs a 45 0 constant velocity turn at the Power/Weight Ratio, P/W hp/lb Constraint Diagram Wing Loading, W/S (lb/ft^2) Figure Constraint diagram Design Point Cruise Climb Constantspeed turn Take-off SL Take-off 5000ft Ceiling initial design point 19
21 velocity of 215 KTAS. Aspect ratio was initially picked based on the competition experience and was equal to 10, however later it was changed to 9. The efficiency factor of the aircraft was calculated using Raymer [4]. Take-off parameters required for the constraint diagram estimation were picked using both competition study and estimation provided by Gudmundsson[3]. Correction factor based on the operational altitude was approximated to estimate power reduction of the turboprop engine with altitude. All power values were normalized with respect to sea level to adequately represent power required for particular mission maneuvers. Equation below shows the correction formula for the power versus altitude. P alt P SL = σ n Where σ is a density ratio, and nis a correction coefficient. The correction coefficient was chosen to be 0.7[5] due to lack of information regarding the engine performance at altitude. Initially, the lowest point on the constraint diagram was chosen to satisfy requirements with minimum power. However, later iterations shifted the initial design point to the position with higher wing and powerto-weight ratio. The final design point specifies power-to-weight ratio of 0.13 and wing loading of 38 psf. Final selection was compared to the competitors to determine credibility of the calculations performed and shows reasonable match. 3. Aerodynamic Design and analysis 3.1. Airfoil Selection For the wing, a number of NACA NFL airfoils ranging from 12% to 18% thick were considered to come up with a group of best airfoils that would be scored with respect to each other. Experimental results presented in Theory of Wing Section [6] were used to obtain airfoil parameters. Six best airfoils were selected for scoring analysis. All airfoils are 6-series airfoils with different drag bucked range and thickness. 20
22 Table shows airfoil scoring criteria and their characteristics at Reynolds number of nine million. Table shows scoring results and the winner. The airfoil(s) that perform the best for the particular requirement get one point while others get zero. All scores are added and the airfoil with the greatest amount of points wins. The best airfoil should have the closest lift coefficient at zero AOA to the cruise AOA, should stall gradually at most possible AOA, should have the lowest minimum drag coefficient, closest to zero pitching moment coefficient at cruise, and performance at cruise and climb should be within the drag bucket for more aerodynamic efficiency. Tables and show scoring analysis and the final airfoil selection. Parameters\Airfoil NACA63(2)-415 NACA63(2)-615 NACA63(3)-418 NACA63(3)-618 NACA65(2)-415 NACA65(3)-418 thickness Cl AOA for Cl= Clmax AOA for Clmax Stall behavior A A A A A A Cdmin Cl at Cdmin (Cl/Cd)max Cl of (Cl/Cd) max cruise Cm drag bucket start at Cl drag bucket end at Cl CL_ROC in drag bucket N Y N Y Y Y CL_Cruise in drag bucket Y N Y N Y Y Table Airfoil characteristics of best selected airfoils at Re=9 million Parameters\Airfoil NACA63(2)-415 NACA63(2)-615 NACA63(3)-418 NACA63(3)-618 NACA65(2)-415 NACA65(3)-418 Cl AOA for Cl= Clmax 1 1 AOA for Clmax 1 Stall behavior Cdmin 1 Cl at Cdmin (Cl/Cd)max 1 1 Cl of (Cl/Cd) max cruise Cm CL_ROC in drag bucket CL_Cruise in drag bucket Sum Table Scoring analysis of the airfoils 21
23 NACA 65(2)-415 was picked due to the highest score comparing to the competitors. Figure shows the wing airfoil geometry. Figure NACA 65(2)-415 airfoil geometry Horizontal and vertical tails both feature symmetric airfoils to have symmetric change in lift when an elevator or rudder is used. NACA0012 airfoil was chosen for the horizontal tail, and NACA 0010 was chosen for the vertical tail Wing configuration Design To approach to elliptic lift distribution and reduce bending moments experienced by the structure, wing and tail taper was applied to the current design. For the wing, taper ratio of 0.5 was decided to be used due to two facts: such taper ratio shows close similarity to the elliptical[4] lift distribution and shift of the highest lift coefficient along the wing span is not too far to reach the aileron, so ailerons are not disabled during stall. Taper ratio of 0.75 and 0.5 were used for horizontal and vertical tails respectively. Figure and Table show the layout of the wing and the key parameters Lift analysis Lift curve slope and maximum lift coefficient of the aircraft were calculated using Raymer[4]. Fuselage effect experienced by the wing was estimated using Torenbeek[7]. To validate theoretical calculations and take fuselage effect on the aircraft more accurately, OpenVSP and VSPAERO Vortex-Lattice package were used to obtain the lift curve. Figure shows the VSP model of KR-1, Figure shows the comparison of lift curves obtained from theoretical approach and VSPAERO, Figure shows lift distribution at 22
24 maximum angle of attack, and Table shows comparison between theoretical estimation of maximum lift coefficient and stall angle of attack and VSP. Figure Wing layout AR 9 Span Root chord 71 ft 10.5ft Taper ratio 0.5 Wing incidence 3 0 Table Wing geometric parameters Lift coefficient obtained by VSP shows close similarity comparing to theoretical approximation that gives high confidence in lift estimation. Stalling behavior shows that the wing begins to stall in the middle of the wing, but it does not significantly affect the ailerons. Stall angle of attack and maximum lift coefficient for the whole airplane show high similarity between theory and panel methods. 23
 Figure 3.3.3. Lift distribution at maximum AOA from OpenVSP Theory OpenVSP αmax 13.75 13.00 Clmax (whole airplane) 1.67 1.68 Table 3.")
25 VSP Theory CL α (deg) Figure KR-1 VSP model Figure Lift coefficient comparison Stall behavior (VSPAERO) Lift destribution at stall Clmax Cl Y(ft) Figure Lift distribution at maximum AOA from OpenVSP Theory OpenVSP αmax Clmax (whole airplane) Table Comparison of stall behavior 24
26 3.4. Drag analysis Adjusted drag model shown in Eq (3.4.1) was used to estimate drag produced by the aircraft. C D = C Dmin + k(c L C LminD ) 2 Where C Dmin a combination of pressure is, skin friction and miscellaneous drags and C LminD is lift coefficient at minimum drag. To consider laminar-turbulent transition while calculating skin-friction drag, Young s method was used. This method considers the position of the boundary layer transition both at the wing root and at the tip and considers roughness. To estimate transition of the laminar boundary layer on the wing and horizontal and vertical tails, CFD calculations were performed for roots and tips. Pointwise grid generation software was used to set up the O-grids for the airfoils. Y+ value of 1 was used to resolve the boundary layer for each airfoil. Figure shows an example grid for the wing root chord. ANSYS Fluent solver was used to calculate drag at cruise Reynolds number and zero angle-of-attack. Steady state RANS with Transitional SST turbulence model was utilized to estimate the boundary layer transition. Each solution took around 3500 iterations to reach steady state drag coefficient. Example residuals and pressure are shown in Figure and Figure respectively. After the solution was completed, ANSYS post processing tool was used to plot the skin friction coefficient transition for the wing and tails at the top and bottom surfaces at zero AOA. The fuselage was assumed to have a fully turbulent flow. To take into account the shape of the hull and the step, fuselage skin friction drag coefficient was multiplied by a factor of 2. Such estimation gives a conservative value that may be reduced in more deep preliminary design stages. Form factors used for drag calculations were averaged using methods of Raymer, Hoerner, Torenbeek, Shevell, and Jenkinson[1]. In addition, drag contributions due to floats and landing gear fearing was added to the overall parasite drag. Finally, Cumulative result of Undesirable Drag (CRUD) factor of 0.25 was used to take into account additional components that may appear in a final design and affect the drag. 25


27 Figure NACA65(2)-415 O-grid Figure Solution residuals Figure Airfoil pressure Wing Horizontal tail Vertical tail Xcr_Root top/cr 0.25 Xcr_Root top/cr 0.32 Xcr_Root top/cr 0.3 Xcr_Root bootom/cr 0.08 Xcr_Root bootom/cr 0.32 Xcr_Root bootom/cr 0.3 Xcr_Tip top/ct 0.5 Xcr_Tip top/ct 0.45 Xcr_Tip top/ct 0.5 Xcr_Tip Bottom/Ct 0.23 Xcr_Tip Bottom/Ct 0.45 Xcr_Tip Bottom/Ct 0.5 Table Critical boundary layer locations with respect to the chord Table and Figure show drag contribution by each component of the aircraft. Induced drag was calculated taking into account minimum drag lift coefficient. At the preliminary stage, C LminD was obtained 26


 25.000 Total 0.026 100 Table 3.4.2. Parasitic drag build-up at cruise speed 27")
28 from OpenVSP and was equal to Oswald s efficiency was obtained using Raymer and was equal to PARASITIC DRAG BUILD-UP Wing Horizontal tail Vertical Tail Fuselage Floats Floats 5% Fuselage 41% Wing 45% Vertical Tail 3% Horizontal tail 6% Figure Parasitic drag build-up at cruise speed CDp Contribution Wing Horizontal tail Vertical Tail Fuselage Floats CRUD (%) Total Table Parasitic drag build-up at cruise speed 27
29 3.5. High-Lift Devices Due to challenging requirements of the take-off distance both from the ground and the water, extra care must be taken to accurately estimate lift and drag contribution of high-lift devices and correctly determine an appropriate set of devices. After a number of iterations, Fowler flaps were considered as a high-lift device system. Table shows sizing of the high-lift devices and their lift and drag performances are shown in Figures and Flaps Spoilers Flap span ratio 0.55 Spoiler span ratio 0.3 Flap chord ratio 0.30 Spoiler chord ratio 0.10 Flap deflection TO (deg) 20 Spoiler deflection (deg) Flap deflection LD (deg) 40 Table Geometric layout and of flaps, slats, and spoilers Torenbeck [7] semi-empirical relations were used to calculate changes in lift and drag due to high-lift devices and Sadraey [8] estimation was used for spoiler performance estimation. Lift coefficient VSP Theory (clean) Theory (Flaps TO) Theory (Flaps LD) 3 CL α (deg) Figure Lift coefficient for different configurations 28
30 CD Drag Polar Drag Polar (Clean) Drag polar (flaps TO) Drag polar (Flaps LD) Drag polar (flaps LD+spoilers) CL Figure Drag coefficient for different configurations Results show increase in lift for both take-off and landing flap configurations with landing flaps producing more lift. Drag polars also look physical showing shift both up and to the left. Finally, maximum lift coefficients for three main configurations (clean, take-off, and landing) were obtained and are shown in Table Flight configuration Clmax Clean 1.44 Take-off 2.42 Landing 2.68 Table CLmax for various configurations 3.6. Aerodynamic performance Aerodynamic performance of the airplane can be represented by lift-to-drag ratio diagram. Figure shows values of L/D for different configurations. For the clean configuration, lift-to-drag ratio of 10 is 29
31 reached at zero AOA and maximum value reaches Lift-to-drag ratios for other configurations show substantial drop that is physically real L/D α (deg) Lift-to-Drag ratio Clean configuration Flaps 20 deg (take-off) Flaps 40 deg (Landing) Flaps 40 deg + Spoilers Figure Lift-to-drag ratio for different aircraft configurations 4. Propulsion 4.1. Engine selection As long as no constraints were presented by the requirements except availability of the engine, the designer had freedom of selecting any engine type depending on the aircraft performance requirements. Due to significant power requirements, based on the constraint diagram, relatively low Mach number (M=0.36), and low operational altitude (H=16500ft), turboprop engines shows the best combination of fuel consumption, power-to-weight ratio and weight comparing to both piston and jet engines. Pratt & Whitney Canada PT6A-68C was chosen as one of the most powerful engine of the most famous family of the 30
 572 Figure 4.1.1. Pratt & Whitney Canada PT6A Performance rating (S/L, static) (shp) 1600 Specific Fuel Consumption (lb/h/ehp) 0.542 Table 4.4.1. Pratt & Whitney Canada PT6A-PT6A-68C data 4.")
32 turboprop engines, featuring flat-rated power of 1600SHP, fuel consumption of 0.542lb/h/ehp, and shaft rotation at maximum RPM of Table shows PT6A-68C parameters. Maximum diameter (in) 71.3 Dry Weight (lb) 572 Figure Pratt & Whitney Canada PT6A Performance rating (S/L, static) (shp) 1600 Specific Fuel Consumption (lb/h/ehp) Table Pratt & Whitney Canada PT6A-PT6A-68C data 4.2. Propeller analysis and thrust estimation To get the most benefits from the engine at all stages of the mission, a constant-speed metal propeller with reverse-thrust capabilities was chosen. Propeller diameter plays an important role in the ability of the engine to transform power produced by the engine into thrust. Two key aspect must be taken into account while choosing the appropriate diameter of the propeller. First, high tip speed must be avoided to prevent losses created by the shocks appearing at the tips. For a metal propeller, maximum Mach number must range between 0.7 and 0.8. Second, spinner may significantly reduce performance of the propeller comparing to an assumption of no spinner effect. After a number of iterations, propeller diameter was chosen to be 8.25ft. Such diameter gives appropriate amount of thrust for all stages of the mission that satisfies stability requirements and CG range, and prevents the tips from getting shock waves except for the ceiling flight at maximum level speed which is a compromise for better cruise performance. Maximum Mach number was calculated based on maximum RPM of the engine shaft and maximum level speed at a particular altitude discussed in section 7.3. Table 31
33 4.2.1 shows Mach numbers at the tip for key mission altitudes. Spinner diameter was assumed one quarter of the propeller diameter based on spinner measurements of other aircraft featuring propeller engine. Max tip M Cruise 0.78 Sea-level 0.73 Ceiling 0.90 Table Maximum tip Mach number for main flight altitudes Due to absence of propeller data, thrust analysis on the propeller was performed using momentum theory for cruise conditions and cubic spline for low-speed operations to determine engine performance at takeoff and landing. Efficiency and power curves shown in Figures and respectively were obtained for the sea-level, 5000ft altitude, cruise altitude, and the ceiling. Maximum efficiency of the propeller was assumed In further design iterations, propeller data or the blade-element theory must be used to approximate thrust better. Thrust diagram Efficiency curves T (lb) Speed (KTAS) Sea level 5000ft 16500ft Ceiling η Speed (KTAS) Sea level Ceiling 16500ft 5000ft Figure Thrust output at different altitudes Figure Efficiency at different altitudes 32
34 4.3. Engine Placement Placement of the engine was determined based on a number of considerations. First, the position of the engine should be limited by the FAR Part 25 requirements: at least one inch between the blade tip and the aircraft structure and 18 inches between the tip and the water must be maintained. Second, danger zones of the propeller determine the position of it with respect to the cabin doors. In addition, water spray and clearance above the water line as well as the static stability must be taken into account while positioning the engine. Finally, and engine-out speed requirements determined by FAR Part 25 and vertical tail sizing play an important role in positioning the engine. Engine placement 7.5 ft away from the aircraft centerline and 1ft above the wing chord line determined after a number of iterations. Figure shows the engine layout and propeller diameter. Figure Engine layout and propeller dimensions. 33
35 5. Weights 5.1. Weight Estimations Gross, empty, and fuel weights of the aircraft were initially determined using take-off weight sizing from Raymer. Fuel-to-weight fractions were calculated from statistical data from Breguet range formula for the longest IFR mission with full passenger capacity presented in Section 2. Empty weight fraction was first estimated using statistical estimations for twin turboprops from Raymer [4]. Maximum take-off weight and Gross weight were assumed to be same, and Maximum landing weight was estimated considering loss of the fuel after take-off. In further stages of design, component weight breakdown of empty weight was used. To estimate weights of each aircraft component more accurately, different methods were considered: Raymer [4], Nicolai [9], and Torenbeek [7]. Average values were obtained to estimate weight of aircraft components. Finally, preliminary weights of the wing and empennage were obtained using stress analysis to increase accuracy of the estimation. For the wing and the empennage, weights obtained from structural analysis were used. Details regarding structural analysis are discussed in Section 8. Tables and show weight breakdown for the given design. Weights obtained from structural analysis show close similarity comparing to statistical values. Weight (lb) Maximum take-off Weight Maximum Landing Weight Empty Weight Fuel Weight 5645 Paylod Weight 4620 Crew Weight 581 Table General weight data 34
36 Component Weight % Weight (lb) Wing Horizontal Tail Vertical Tail Fuselage Landing Gear Engines+Naccelle Fuel system Flight control system Avionics Anti-icing+AC Hydraulics Furnishing Electrical Total Table Empty-weight breakdown Nicolai Raymer Torenbeek Structures Figure Weight breakdown comparison using different methods 35
37 5.2. Center of Gravity CG range was calculated for a number of different weight cases. To calculate maximum possible forward and aft CG locations, method provided by Sadraey [8] was used. A MATLAB script reads locations of all components with respect to the aircraft nose and eliminates all removable weights before the CG for the most aft position and after CG for the most forward position. Table shows CG positions in percent MAC obtained with the MATLAB script. Forward CG limit was determined to be too forward, so trim during take-off and landing is impossible, so the most forward CG case was considered an empty weight. Table shows an updated CG range, and CG envelope for take-off, landing and cruise conditions is shown in Figure Most fwd cg(ft) Most aft cg(ft) Sadraey KR Table CG comparison between Sadraey and KR CG envelope Take-off/Landing Cruise Weight lb CG position %MAC Figure Load and balance diagram for Take-off, Landing, and Cruise 36

38 6. Hull and floats design 6.1. Hull shape Design Design of a hull plays an important role in many aspects of the aircraft performance. Hull must be designed such that it provides adequate buoyancy for the airplane in the water. FAR Part 25 [10] requires the hull to be able to withstand 1.8 gross weights of the airplane. In addition, performance of the airplane during takeoff and landing highly depends on the hull geometry: lengths of the forebody and aftbody; location, type, and height of the step required for the airplane transition during take-off; deadrise angle; existence of flare etc. Details and decision making regarding design of each component of the hull will be described in below. Figure shows nomenclature of a common hull and Figures and show layout and dimensions of the KR-1 hull. Volume of the hull depends on the gross weight of the aircraft including FAR Part 25 requirements, and geometric constraints of the airplane such as the airplane length and width. Longer and narrower hulls (beam-to-length ratio of 10 and above) show superior performance during take-off due to their lower resistance. However, such hull shapes become problematic for transport airplanes that require particular internal layout and CG range requirements. Given aircraft features common length-to-beam ratios ratio of 5.76 that provides appropriate internal dimension Figure Hull nomenclature and common dimensions [3] of the aircraft for the mission. Hull volume was obtained with the idea to be able to load the airplane on both the water and land which is crucial for water airports. Water clearance should be big enough to open the cabin doors and load cargo or passengers. To calculate the clearance, water draft must be obtained. 37
39 Draft was calculated applying Archimedes principle and geometric properties of the aircraft (Gudmunsson) and was 1.59ft. Figure Front view and hull dimensions Center of buoyancy was initially calculated theoretically and was more accurately determined with CATIA at later stages of the design. Hull bottom design shape depends on several factors: take-off requirements, stability and control, load factors, water spray, and draft. More flat hull bottoms show superior performance during take-off and smaller draft values comparing to sharper shapes. However, bottoms that are more flat behave less stable in wavy weather conditions and experience higher loads during landing which causes structural reinforcement and weight increase. In addition, bottoms that are more flat generate more spray that may reach the engine and cause severe problems. FAR Part 25 specifies reaction load factors required to be tolerated by a hull with particular characteristics 2 C 1 V s0 n w = (tan 2/3 β)w 1/3 Where n w is a water reaction load factor, C 1 is a seaplane operations factor equal to 0.012, V s0 is stall 38
40 Figure Side view and hull dimensions speed with high-lift devices deflected, β is deadrise angle, and W is maximum aircraft landing weight. Figure shows a plot of load factors with respect to stall speeds depending on deadrise angle and the design point. After a number of iterations, load factor of 3.1 was obtained as an appropriate value depending on the deadrise angle of 22 0 to mitigate draft and stall speed discussed below. Forebody and aftbody lengths, sternpost angle, and step geometry depend on spray requirements and stability of the airplane during take-off. Empirical relations shown in Figures [11] show relations between key parameters of the hull. Form figure 6.1.5, buoyancy force coefficient if defined by C W = W ρ w B 3 Where ρ w is water density and B is the hull beam. Coefficient K is defined by K = W ρ w BL f 2 Where L f is forebody length. 39
41 Hull Load Factors vs Stall speeds (W0=20661 lb) Betta=15 deg Betta=20 deg Betta=30 deg Betta=40 deg hull Load factor, nw Stall speed, KCAS Figure Hull load factor vs stall speeds at different deadrise angles for landing configuration Considering geometric constraints, it was concluded that the current design cannot reach values of K corresponding to acceptable spray, so possible design solutions include introduction of flare of the hull bottom to turn the spray away from the engine. In addition, spray strips should be considered for more detailed design as a device mitigating spray height. Step was put such that angle between CG s and the step is within degrees as specified in Gudmundsson [3]. Forebody flat length was chosen to be equal to two beam. Mission also requires the airplane to be able to withstand sea state 3 conditions. Maximum wave height can be estimated by h wave = 1.25 ln(w) Table shows requirements for sea state 3 and maximum wave height. Maximum wave height falls into seastate 3 and covers almost all the region of state 3. However, further analysis must be obtained to determine actual value of maximum wave height 40
42 Figure Weight coefficient relation Figure Afterbody deadrise angle relation Figure Sternpost angle vs step depths Figure Aftbody-to-beam ratio vs step depth Wave height (ft) Sea State 3 Minimum 1.67 Sea State 3 Maximum 4.08 Maximum of KR Table Sea State 3 requirements and maximum wave height for KR-1 41
43 6.2. Floats design To ensure lateral stability of the aircraft on the water, a top-wing aircraft frequently requires floats. The geometric design of the float follows the same FAR Part 25 requirements and approach as the hull, although the step is not needed for the floats. The key parameters of the floats are the volume of the float, the deadrise angle, and the location of the floats with respect to the span. To calculate the displacement weight of the float, the following expression [12] is used 1.8Whsinθ = W f l f cosθ Where W f and l f are the displacement weight of the float and float position along the span respectively and θ is the lateral inclination angle before the flat is submerged. Based on the formula, a set of solutions for Float volume Water clearance 1 deg 2 deg 3 deg 4 deg 1 deg 2 deg 3 deg 4 deg Float volume (ft^3) Design point Span location % float water clearance (ft) Figure Float volume and water clearance vs float location the displacement weight and then for the float volume can be found. Smaller float volume generates less drag, so a smaller flat is preferable. Figure shows float volume appropriate for floats at particular each locations along the wing span and inclination angles. In addition, the figure presents water clearance for float combination. 42
44 Based on examples of aircraft such as Beriev Be-200, Grumman Mallard, and Beriev Be-112, approximately, 1ft of water clearance works well, so inclination of 2 0 was chosen for KR-1. As for the span location, the float was decided to be put at the wingtip to work as a wingtip device to reduce the induced drag giving the float volume of ft 3, although the float volume becomes greater at the same inclination angle and structural reinforcement may be used. An optimization study with must be performed to determine the best location of the float to achieve a compromise. The deadrise angle of 23 0 was chosen based on approach used for the hull design. The float diagram is shown in Figure Figure Float layout and dimensions 7. Aircraft performance Performance analysis consists of a number of cases required for the current proposal. First case demonstrates 250 nmi STOL runway mission with 20 passengers with take-off and landing from the ground at sea level and 5000ft at ISA +18 o F and for different runway profiles. Second case demonstrates a 250 nmi STOL water mission with 20 passengers with take-off and landing from the water at sea level and 5000ft at ISA +18 o F. Third case presents a 1000nmi mission with maximum amount of passengers with ground and water take-off and landing at sea level at ISA +18 o F. Final case shows a 500nmi cargo mission with ground and water take-off and landing at sea level at ISA +18 o F. In addition, a payload range-relationship will be discussed Take-off and Landing Take-off and landing requirements became ones of the most critical variables that determined the aircraft layout. Short take-off and landing requires the lowest possible aircraft weight, strong aerodynamic characteristics of the aircraft as well as a powerful propulsion system. To perform take-off and landing 43
45 analysis, key aircraft airspeeds must be determined. Table shows different speed obtained for the current aircraft following FAR Part 25 requirements. Take-off Landing Requirement Speed (KCAS) Requirement Speed (KCAS) VSR VSR VCLmax VSR VSR VCLmax VMC VMC 1.13 VSR 70.5 VFLR VFLR < 1.23VSR 75.3 VR VMR 1.05 VSR 72 VTD VTD < 1.1VSR 69 VLOF VLOF 1.1VSR 74 VBR VBR < 1.1VSR 69 V2min V2min 1.13VSR 76 Table FAR Part 25 speed requirements and values Ground take-off and landing Ground take-off was estimated using dynamic and kinematic equations from classical mechanics. After the aircraft reached rotation speed, transition length was estimated to be 1.5 VLOF [3]. 50ft obstacle performance was calculated using Gudmundsson s approach [1]. Figure shows ground run example for the 250nmi STOL mission with 20 passenger at sea level, and Tables and show lengths of each section of take-off and total take-off distance profiles for all performance cases form sea level and 5000ft respectively. Results for the STOL case show that the aircraft is capable of taking off within 1500ft with 50ft obstacle, so the requirement is satisfied. Landing performance was estimated using dynamic and kinematic equation as used for the take-off. Three degrees approach angle was assumed to estimate the approach distance. In addition, reverse thrust equal to 60% of engine s static thrust was assumed [3]. Tables and show lengths of each stage of landing as well as total landing distance for each performance case. Results for the STOL cases show that the aircraft is capable of landing within 1500ft with 50ft obstacle, so landing requirement is also satisfied. 44
46 V (KTAS) Take-off run Transition LOF distance Ground Run (ft) Figure Take-off run for for the 250nmi STOL mission with 20 passenger at sea level Sea Level 250 nmi mission Surface properties Ground run (ft) Transition (ft) 50 ft obstacle run (ft) Total (ft) dry concrete/aspahalt wet concrete/asphalt wet grass firm dirt soft turf nmi mission Surface properties Ground run (ft) Transition (ft) 50 ft obstacle run (ft) Total (ft) dry pavement nmi mission Surface properties Ground run (ft) Transition (ft) 50 ft obstacle run (ft) Total (ft) dry pavement Table Ground take-off distance data for different mission cases at sea level 45
47 5000 ft 250 nmi mission Surface properties Ground run (ft) Transition (ft) 50 ft obstacle run (ft) Total (ft) dry concrete/aspahalt wet concrete/asphalt wet grass firm dirt soft turf nmi mission Surface properties Ground run (ft) Transition (ft) 50 ft obstacle run (ft) Total (ft) dry pavement nmi mission Surface properties Ground run (ft) Transition (ft) 50 ft obstacle run (ft) Total (ft) dry pavement Table Ground take-off distance data for different mission cases at 5000ft. Sea level 250 nmi mission Surface properties Aproach distance (ft) Flare distance (ft) Free-roll distance (ft) Braking distance (ft) Total dry concrete/aspahalt wet concrete/asphalt wet grass firm dirt soft turf hard turf nmi mission Surface properties Aproach distance (ft) Flare distance (ft) Free-roll distance (ft) Braking distance (ft) Total dry pavement nmi mission Surface properties Aproach distance (ft) Flare distance (ft) Free-roll distance (ft) Braking distance (ft) Total dry pavement Table Ground landing distance data for different mission cases at sea level 46
48 5000 ft 250 nmi mission Surface properties Aproach distance (ft) Flare distance (ft) Free-roll distance (ft) Braking distance (ft) Total dry concrete/aspahalt wet concrete/asphalt wet grass firm dirt soft turf hard turf nmi mission Surface properties Aproach distance (ft) Flare distance (ft) Free-roll distance (ft) Braking distance (ft) Total dry pavement nmi mission Surface properties Aproach distance (ft) Flare distance (ft) Free-roll distance (ft) Braking distance (ft) Total dry pavement Table Ground landing distance data for different mission cases at 5000ft Water take-off and landing Water take-off and landing becomes a challenging task when hydrodynamic performance parameters of the hull such as water resistance and hull trim angle at different speed are unknown. To predict take-off and landing distances for the aircraft, trim angle and hull resistance coefficient were estimated using Water resistance Coefficient,CR Water Resistance y = 1.449E-04x E-03x E-02x E-01x E-01x E-01x E Resistance coefficient Poly. (Resistance coefficient) Speed Coefficient, CV Figure Water hull resistance estimation Trim Angle, deg Hull Trim Angle y = 9.803E-04x E-02x E-01x E+00x E-01x E-01x E Trim angle Poly. (Trim angle) Speed Coefficient, CV Figure Trim angle estimation 47
49 experimental data from Reference [13] for a conventional hull case. Figures and show water resistance coefficient and trim angle relation for a conventional hull. In addition, a number of assumptions were made: 1. Reduction of resistance with decrease of draft due to lift is estimated by C R = C R C C 0 Where C 0 the load coefficient at the take-off and rest is, C R is a resistance coefficient, and C is a load coefficient. 2. Once the speed coefficient exceeds 7.5, water resistance coefficient becomes zero according to Figure The airplane may not be airborne at this moment, but it is hydroplaning, so Froude frictional resistance must be considered. Froude resistance fan be calculated by R Froude = fs wet V n Where f is a coefficient of frictional resistance conservatively assumed to be 0.015, S wet is wetted area assumed to be four beam lengths, V is speed in knots, and n is a surface quality coefficients assumed to be equal to Pilot slowly increases thrust and reaches full throttle within 10 seconds. Throttle factor is assumed by t ( ), t < 10s r = { 10 1, t 10s Tables and shows take-off and landing distances using assumptions made above. STOL missions requirements of maximum take-off and landing distances of 1900ft are satisfied. 48
50 Sea Level 5000 ft 250 nmi mission 250 nmi mission Water run distance (ft) 50 ft obstacle run (ft) Total Water run distance (ft) 50 ft obstacle run (ft) Total nmi mission 1000 nmi mission Water run distance (ft) 50 ft obstacle run (ft) Total Water run distance (ft) 50 ft obstacle run (ft) Total nmi mission 500 nmi mission Water run distance (ft) 50 ft obstacle run (ft) Total Water run distance (ft) 50 ft obstacle run (ft) Total Table Water take-off distance data for different mission cases at sea level and 5000ft Sea Level 250 nmi mission Aproach distance (ft) Flare distance (ft) Braking distance (ft) Total nmi mission Aproach distance (ft) Flare distance (ft) Braking distance (ft) Total nmi mission Aproach distance (ft) Flare distance (ft) Braking distance (ft) Total Table Water landing distance data for different mission cases at sea level 5000 ft 250 nmi mission Aproach distance (ft) Flare distance (ft) Braking distance (ft) Total nmi mission Aproach distance (ft) Flare distance (ft) Braking distance (ft) Total nmi mission Aproach distance (ft) Flare distance (ft) Braking distance (ft) Total Table Water landing distance data for different mission cases at 5000ft 49
51 7.2 Climb Climb performance shown in Figure demonstrates climb performance for the 1000nmi mission weight with full payload. Both sea level and cruise altitude performance capabilities are shown. Maximum rate-ofclimb at sea level reaches 3000fpm at 135 KCAS that is a high value comparing to the competitors. Climb performance at cruise altitude shows maximum value of 1841 at 115 KCAS. Sea-level H=16500ft Rate-of-climb, fpm Aircraft speed, KCAS Figure Climb performance for a 1000nmi mission weight with full payload 7.3. Cruise Cruise performance can be described using Flight Envelope and Payload Range Curve. Cruise analysis considers for the 1000mni mission with full payload. Flight envelope shown in Figure relates minimum and maximum stall speeds with altitude. Iterative maximum level speed estimation based on an adjusted drag model was used to obtain maximum level speeds at different altitudes. Maximum speed of 254 KTAS can be reached at the sea level and increases up to 274 KTAS at the service ceiling. Cruise Stall speed at sea level equals 83 KTAS and increases with altitude until 123 KTAS. 50
52 30000 Flight Envelope Altitude, ft Airspeed, KTAS Figure Flight Envelope Payload Range Curve was obtained using Breguet range formula and is shown in Figure Point zero shows maximum possible payload and no fuel. Point one presents maximum range of the aircraft with full payload, point two shows maximum range with full fuel tanks, and point three shows maximum range with no payload. All points on the payload diagram satisfy mission range requirements. In addition, maximum range substantially outperforms competitors of KR-1, which gives the aircraft bigger coverage area which is more beneficial for any aircraft. Payload weight, lb Payload-Range Diagram Range, nmi Figure Payload Range Curve 51
53 Point Payload Weight(lb) Fuel Weight(lb) Range (nmi) Table Payload, Range, and Range for critical points of the Payload Range Curve 7.4. Steady-state turn Steady-state turn performance plays an important role in maneuverability of the aircraft. A more agile aircraft is capable of responding to different situations occurring during flight. Turn performance map is shown in Figure and presents possible turning rates for particular turning speeds. Grey lines are load factor isolines showing load factor experienced by the aircraft at a particular turn rate and speed. Turn rates are constrained by limit load factor and stall that are shown as black and dashed blue lines respectively. Figure shows that maximum turn rate achieved at maximum possible turning speed equals to 17 degrees per second and equivalent to turn radius close to 1100 ft. Turning rate, degrees/sec Turn Performance Map Possible Structural Damage Airspeed, KTAS Structural Failure n=1.1 n=1.5 n=2 n=2.5 n=3 n=4.5 Stall Boundary R=2500 R=1100 R=1450 Figure Turn Performance Map 52
54 7.5. Descent Although descent performance may not seem to be crucial for the current design mission, an airplane with strong glide performance improves aircraft safety during an emergency, such as engine failure. Descent performance was analyzed for the 1000nmi mission with full passenger density at cruise altitude. Figure shows descent performance of KR-1. Figure shows that maximum glide ratio occurs at the glide angle of -3.7 degrees with respect to the ground, and the aircraft has rate-of-descent of -980fpm at maximum glide ratio. Descent Performance Diagram True Airspeed, KTAS Rate-off-descent(fpm) L/D and Glide angle Rate-ofdescent(H=16500ft) L/D Glide angle Figure Descent Performance Diagram 8. Structures 8.1. V-n Diagram To successfully design structure of the airplane, and perform required calculation, first, a V-n diagram must be obtained. V-n diagram was developed using FAR Part 25 load requirements. Minimum ultimate positive load factor was estimated to be 2.87, but is decided to be increased up to 3, while negative factor was -1.5, considering typical transport aircraft load factors from Raymer [2]. Gust speeds of 25ft/s and 50ft/s were also considered using estimations from FAR Part 25 requirements. After design cruise speed is reached, positive load factor begins to decrease until reaches value of two at the dive speed. This decision was made to decrease maximum possible loads developed by the structure and decrease structural weight [11]. Figure 53
55 show the V-n diagrams with stall speeds at sea level, cruise altitude, and service ceiling. 4 V-n diagram for cruise altitude (16500 ft) 3 VApos=143KEAS Load factor, n VC=167KEAS VD=209KEAS VAneg=125KEAS Speed, KEAS Figure V-n Diagram at cruise altitude 8.2. Material selection Material selection plays an important role in structural behavior of the aircraft, its weight, and cost related to both manufacturing and maintenance. For the given RFP, aluminum was used as the main material due to its low cost, predictable strength capabilities, and ease of certification. For major parts of the structural analysis, Aluminum 2024-T4 was used because of its high strength and weight combination. Table shows material properties of Aluminum 2024-T4. Density (lb/in 3 ) 0.1 Ultimate Tensile Strength (ksi) 62.0 Yield Strength (ksi) 40.0 Young s Modulus (10 6 psi) 10.5 Shear Modulus (10 6 psi) 4.1 Table Aluminum 2024-T4 material properties [12] 54
56 8.3. Wing and tail structure Loads experienced by the wing structure was obtained using advanced beam method presented in Allen [14] and Megson [15]. Loads for internal forces and moments were first approximated using Schrenk s approximation, and results from OpenVSP were used for later iterations. Aircraft maximum cruise speed at cruise altitude with maximum load factor was used to calculate internal forces and moments. Maximum sideslip angle for the aircraft was assumed 12 degrees to calculated the loads on the vertical tail. Figure shows a coordinate system used for forces and moments calculations in the wing and empennage. Figures show shear force bending moment distributions along the wing and the tails. Figure Wing coordinate system used for structural analysis Safety factor of 1.5 was applied to design the structure of the aircraft. To determine the best location of the main and rear spars of the wing and the tails, several constraints were applied. First, positioning of the spars was constrained due to the presence of the lifting and control surfaces and fuel tanks in the wing. The constraint of 25% chord in the wing for the main spar and 70% for the rear spar were determined based on fuel tanks arrangements. As long as the thickest part of the spar, considering constraints, occurs at 25% chord, the main spar was put there because thicker spar would withstand higher bending stresses, so weight 55
57 Figure Internal forces and moments experienced by the wing. V=215KTAS, H=16500ft, n=3. Figure Internal forces and moments experienced by the H-tail. V=215KTAS, H=16500ft, n=3. 56
58 Figure Internal forces and moments experienced by the H-tail. V=215KTAS, H=16500ft, n=3. can be saved. The rear spar was put to 70% chord due to the flap attachment. In addition, twenty stringers were located uniformly along the wingbox to help withstand bending stresses. Main spars for the horizontal and vertical tails were put close to the thickest point of the airfoil section at 27% and 23% respectively. Rear spars was located close to the control surfaces: at 30% chord for both tails. All spars are tapered along the span. Figures show dimensions of the spars for the wing and the empennage. Skin thickness of 0.025in was used for the wing and vertical tail while 0.05in thick skin was put on the horizontal tail. Ribs were located using Euler buckling formula as a preliminary method with larger amount of ribs being close to the root and steadily decreasing amount towards the tip. A MATLAB script was developed based on methods of Allen to find modulus-weighted centroids of each wing section and investigate bending and shear stresses along the span. In addition, the script calculates preliminary weight of the structure base on material properties input. Root locations of structural components are input from Excel into MATLAB, and the script calculates all properties along the span. In addition, the code features an option of analysis of strutted wing to investigate structural behavior of the airplane and estimate the weight. Results regarding 57

59 trade study between a cantilever and strutted wings are shown in Section 2. Figures and show the structural layout of the wing and the empennage. Figure Wing Front and rear spar dimensions Fuselage structure was estimated based on a number of simplification assumptions: weights of aircraft components were assumed as point masses and analysis would be done on the section with maximum internal forces and moments experienced. Figure presents shear and moment diagrams of the fuselage. Loads with load factor of 3 were considered for the fuselage analysis. A structure of the fuselage is composed of the skin and 24 stringers to withstand the loads. Figure shows the 2_D layout of the fuselage stringers. Shear and buckling analysis of must also be perform to determine locations of fuselage ribs and skin thickness. In addition, more accurate analysis using more advanced approximations such as Finite Element Analysis needs to be done. 58


60 Figure Horizontal tail spars dimensions Figure Vertical tail pars dimensions Figure Wing structural layout Figure Empennage structural layout 59
61 Skin Stringers centroid Z(ft) Y (ft) Figure Shear and Moment diagrams of the fuselage Figure Stringers layout 9. Stability and Control To ensure adequate aircraft performance and safety, the aircraft must be statically and dynamically stable, controllable, and have appropriate handling qualities specified by MIL Specs, so the empennage and aircraft control surfaces must be properly sized Static stability and control analysis Static stability analysis was performed using classical theoretical approach from Raymer [2], Nelson [14], and Gudmundsson [3]. Aircraft must be statically stable at all operating airspeeds and cover as large cg range as possible without major losses in controllability. Horizontal tail was initially sized using historical data from Raymer [4] and was modified later for the mission requirements. Figure shows the horizontal tail layout and elevator sizing, and Table shows horizontal tail parameters and dimensions. The elevator was sized such that a combination of elevator power and losses due to large possible elevator deflections are balanced. Using DATCOM experimental data, 30% chord elevator was used along 85% percent of the elevator span. 60
62 Aspect ratio 4.36 Horizontal tail 0.83 volume ratio Span Root chord 24 ft 6.25 ft Taper ratio 0.75 Table Horizontal tail parameters Figure Horizontal tail layout In addition, vertical location of the horizontal tail plays an important role in stall recovery. Horizontal tail should not be blanked by the wake produced by the wing at high angles of attack. Figure shows different tail locations and their acceptability in terms of stall safety. Horizontal tail on KR-1 was put 1 ft below the wing level to not to interfere with the horizontal tail in case of rudder and elevator being deflected simultaneously. Such location does not put the horizontal tail into the blanked zone. Figure Horizontal vertical location diagram [2] Vertical tail was sized based on requirements of the engine-out case at low speeds. Specified by FAR Part 25: minimum control speed may not exceed 1.13 V SR. Figure show the free-body diagram of the forces and moments produced by the aircraft with one engine inoperative. The vertical tail must withstand 61
63 moments produced by the operating engine and windmilling propeller. In addition, size of the tail should not be excessive to minimize drag and weight. After multiple iterations, a good compromise of size and functionality was achieved. Figure shows the vertical tail layout, and Table shows vertical tail parameters and dimensions. Maximum rudder deflection required to trim the aircraft in case of one engine inoperative is equal to 22 0 which if is acceptable for a simple flap in terms of flow separation (Maximum deflection of 25 0 is considered to be maximum for a simple flap) [3]. Figure Engine-out case free-body diagram Figure Vertical tail layout The location of the vertical tail with respect to the horizontal tail becomes important in case of spin recovery. At least 30% of the rudder should be away from the horizontal tail wake to ensure vertical tail control characteristics. However, preliminary location of the horizontal and vertical tails enable only 11% of the rudder. To improve flow characteristics at the vertical tail at high angles of attack and increase efficiency of the rudder, a dorsal fin was used. However, the dorsal fin does not guarantee better behavior of the flow at high angles of attack. More care must be taken to reach appropriate percent of rudder unblanked. Figure shows the wake blockage diagram. 62
64 Aspect ratio 1.82 Vertical tail volume ratio Span Root chord 10 ft 7.33 ft Taper ratio 0.5 Figure Wake blockage diagram Table Vertical tail parameters To satisfy turning performance specified by FAR Part 25 of the aircraft, ailerons must be properly sized. However, aileron sizing is constrained by the flaps used to satisfy take-off requirements. Roll rate estimation was done using Sadraey [8] and compared to to MIL-STD Category B Class 2 requirements. Maximum aileron deflection was assumed to be Table shows comparison between calculations ad requirements and Figure shows the aileron layout. Time to achieve a bank angle of 45 0 (s) Sadraey 1.12 MIL-STD Category B Class Table Roll rate requirements comparison Figure Aileron layout 63
65 Table shows final static stability and control derivatives. Data shows that the aircraft is statically stable. Coefficient Value CMα CMq CYβ Cnβ Cnδr Cnδa Clβ Clp Clδr Table Static stability coefficeints 9.2. Dynamic stability analysis and handling qualities Any aircraft should satisfy dynamic stability and control requirements. Matlab/Simulink model called Figure Longitudinal motion poles and zeros Figure Lateral motion poles and zeros 64
66 NAVION developed at Embry-Riddle Aeronautical University was used to perform dynamic stability analysis. Figures and show roots of the transfer function obtained for a linearized 6 DOF model. Roots located at the zero indicated navigational states that do not depend on anything, so they are not required for the analysis. Other zeros show that the aircraft is dynamically stable. In addition, handling qualities play an important role in the aircraft design. Results obtained for cruise speed at cruise altitude were compared to MIL-STD Category B requirements [17] [18]. Table shows results obtained from the NAVION model. All values satisfy Level 1 requirements that are desired. However, dynamic stability analysis must be performed for a range of airspeeds to ensure good handling qualities for all sections of flight. Mode MIL-STD Cat. B Level 1 Requirements KR-1 Short Period Damping 0.30<ζ SP< Natural frequency (rad/s) 1.10<ω NSP< Phugoid Damping ζ PH> Dutch Roll Damping ζ DR> Natural frequency (rad/s) ω NSP< Table Dynamic stability analysis of KR-1 65
67 10. Aircraft systems and layout Landing gear Landing gear required for the RFP must provide the aircraft successfully perform on different runways and be as small and light as possible. Tricycle landing gear was chosen for the present design as one of the most commonly used type of the landing gear for transport aircraft. Longitudinal and lateral positioning of the landing gear determines the ability of the aircraft to rotate during take-off and maneuver on the ground. Nose landing gear should not carry more than 20% of MTOW with the cg being at the forward limit, and no less than 10% when the cg is at the aft limit. Table summarizes the percent of the MTOW experienced by the aircraft at the most forward and aft positions. CG location Percent MTOW Most Forward 18% Most Aft 12% Table Percent MTOW experienced by the nose landing gear at cg limits The main landing gear should be located such that the aircraft can rotate up to maximum angle of attack to prevent tail strikes. In addition, the main gear should be offset behind the most aft cg such that the angle between the vertical line through the gear and the line crossing the gear and the cg must be equal to the Figure Longitudinal landing gear location maximum possible rotation angle. Figure presents the diagram of the longitudinal landing gear location. 66
68 Wheel track of the main landing gear determines whether the aircraft is stable while turning and taxiing. The wheel track, the height of the gear, and the distance between the nose gear and the main gear should be estimated such that the angle shown in Figure should be less than The Figure demonstrates that the angle meets the requirements; however, a compromise between the landing gear positioning and the aircraft aerodynamics was made. Due to the size of the landing gear and the tires discussed below, the main landing gear was put in the fuselage and additional extended fuselage sections were designed to fit the landing gear. These sections, however, increase drag, so decrease aerodynamic efficiency of the aircraft. The retraction mechanics of the landing gear is shown in Figure Figure Lateral landing gear location Tires play an important role in aircraft abilities to take-off from different surfaces. Low-pressure tires are desired to take-off from soft and wet profiles, so 60 psi tires were considered for the current design. Weight experienced by the tires assumes the most aft cg for the main gear and most forward cg for the most forward cg as well as 25% weight increase due to historical tendency of aircraft weight increase in time. Goodyear aviation database [19] was used to find appropriate tires that can withstand the loads applied by the aircraft and have low-pressure rating. Table shows information regarding the tires used. More information regarding tires can be found in Reference
 160 160 Rated Load (lb) 5600 2770 Rated inflation (psi) 60 60 Maximum breaking load (lb) 8120 4020 Maximum breaking load (lb) 15100 7500 Table 10.")
69 Figure Landing gear retraction Main Nose Trademark Flight Leader Flight Custom 3 Part number 922C86T1 650T66-3 Number of tires 2 2 Size Ply rating 8 6 TT or TL TL TL Rated speed (mph) Rated Load (lb) Rated inflation (psi) Maximum breaking load (lb) Maximum breaking load (lb) Table Tires specs used for KR-1 landing gear [19] Oleo-pneumatic landing gear was used for the KR-1 as the system which has shock absorber features that are useful for hard landing and operation on rough surfaces. In addition, the gear itself does not have inclination with respect to the ground and no castering was used for the wheels, so the nose wheels are neutrally stable both statically and dynamically. Figure shows the layout of the landing gear. 68

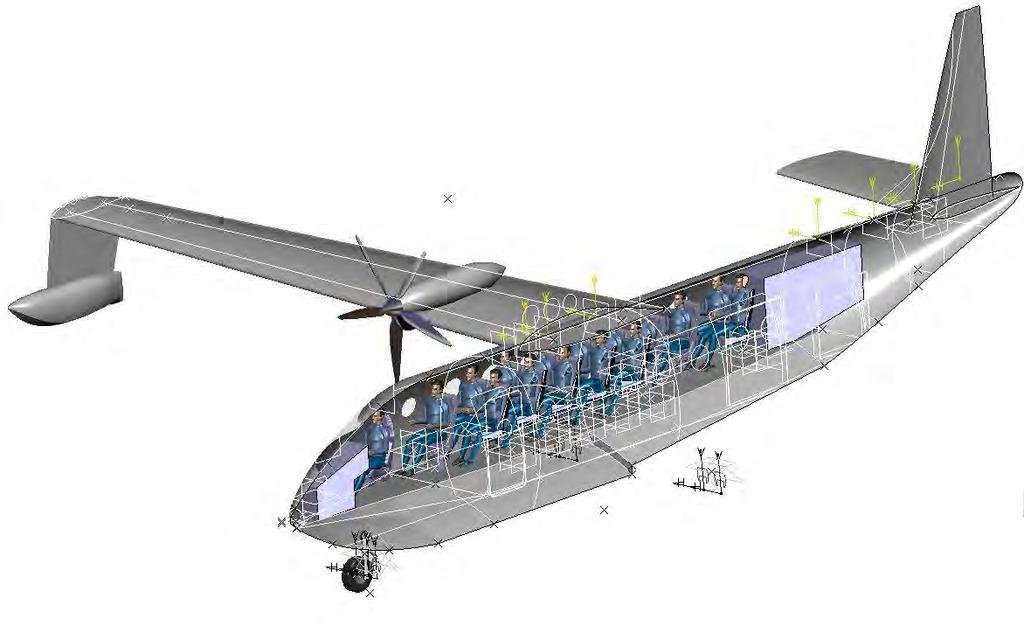
70 Figure Landing gear layout Cabin pressurization and air conditioning Due to operational altitude of 16500ft and service ceiling of 25000ft, cabin pressurization and air conditioning system is required to ensure safe and comfortable flight of both the crew and passengers. The air is transported from the turboprop engines compressors to the cabin where it is distributed in the fuselage and cooled down in the AC system Fuel system Four fuel tanks are located in the aircraft wing between the main and rear spars. The tanks are separated by the center section of the aircraft and two engines. Maximum fuel volume is 1024 gal. JET-A1 fuel was chosen for the current aircraft as a high-quality fuel, and fuel density of 6.7 lb/gal was used for all calculations. Purple section in Figure shows the layout of the fuel system inside the wing Fuselage layout The passenger cabin and its doors are substantially elevated relative to the hull bottom to enable boarding and cargo loading for the aircraft being on the water, so the doors have enough clearance comparing to the waterline The cabin was designed for 20 passengers and one cabin crewmember. The crewmember has a separate row close to one of two exits. The aft exit has double doors to quickly load heavy and irregular cargo for the cargo configuration of the aircraft. To easily distribute cargo in the cabin, integrated roller system was included in the cabin. For the passenger configuration, the rows near the aft door are arranged such that passenger 69


71 Figure Fuel tank layout have enough room to maneuver while entering or exiting the aircraft. Seat pitch in the cabin is equal to 30 inches that satisfies the RFP requirement and has more extra space for more comfort. The seats are designed for a 95-percentile passenger to cover the majority of passenger types. The aisle width is equal to 13 inches to give enough room for the passengers to move during boarding or emergency situation. Figures show the cabin dimensions and Figure demonstrates doors dimensions. Cargo configuration option is presented in Figure Figure Cabin top view 70


72 Figure Cabin front view Figure Seat pitch Figure Doors dimensions Baggage of KR-1 is located behind the cabin and has available volume of 87ft 3 which satisfies the RFP. A side door is designed to have access to the baggage section. Figure shows the baggage layout. Figure KR-1 cargo configuration 71


73 Figure Baggage compartment side view Figure Cockpit view For the cockpit, the pilot location and the windshield was designed such that the pilots have sufficient visibility to operate the aircraft. Pilot visibility angle is shown in Figure , and the angle of 13 0 satisfies common practice for transport aircraft Anti-icing system Anti-icing system is located in the wing leading edge along the whole span for both vertical and horizontal tails to ensure safe operation and prevent fatal flow separation. Figure shows the cross-section of the anti-icing system and orange sections in Figure present its location in the aircraft. Figure Anti-icing cross-section [20] Figure Anti-icing system layout 72
The Airplane That Could!
 The Airplane That Could! Critical Design Review December 6 th, 2008 Haoyun Fu Suzanne Lessack Andrew McArthur Nicholas Rooney Jin Yan Yang Yang Agenda Criteria Preliminary Designs Down Selection Features
AE 451 Aeronautical Engineering Design Final Examination. Instructor: Prof. Dr. Serkan ÖZGEN Date:
 Instructor: Prof. Dr. Serkan ÖZGEN Date: 11.01.2012 1. a) (8 pts) In what aspects an instantaneous turn performance is different from sustained turn? b) (8 pts) A low wing loading will always increase
AIAA UNDERGRADUATE TEAM DESIGN COMPETITION PROPOSAL 2017
 TADPOLE AIAA UNDERGRADUATE TEAM DESIGN COMPETITION PROPOSAL 2017 Conceptual Design of TADPOLE Multi-Mission Amphibian MIDDLE EAST TECHNICAL UNIVERSITY 5-10-2017 Team Member AIAA Number Contact Details
Aircraft Design Conceptual Design
 Université de Liège Département d Aérospatiale et de Mécanique Aircraft Design Conceptual Design Ludovic Noels Computational & Multiscale Mechanics of Materials CM3 http://www.ltas-cm3.ulg.ac.be/ Chemin
Design Considerations for Stability: Civil Aircraft
 Design Considerations for Stability: Civil Aircraft From the discussion on aircraft behavior in a small disturbance, it is clear that both aircraft geometry and mass distribution are important in the design
AIRCRAFT DESIGN SUBSONIC JET TRANSPORT
 AIRCRAFT DESIGN SUBSONIC JET TRANSPORT Analyzed by: Jin Mok Professor: Dr. R.H. Liebeck Date: June 6, 2014 1 Abstract The purpose of this report is to design the results of a given specification and to
AE 451 Aeronautical Engineering Design I Estimation of Critical Performance Parameters. Prof. Dr. Serkan Özgen Dept. Aerospace Engineering Fall 2015
 AE 451 Aeronautical Engineering Design I Estimation of Critical Performance Parameters Prof. Dr. Serkan Özgen Dept. Aerospace Engineering Fall 2015 Airfoil selection The airfoil effects the cruise speed,
DEVELOPMENT OF A CARGO AIRCRAFT, AN OVERVIEW OF THE PRELIMINARY AERODYNAMIC DESIGN PHASE
 ICAS 2000 CONGRESS DEVELOPMENT OF A CARGO AIRCRAFT, AN OVERVIEW OF THE PRELIMINARY AERODYNAMIC DESIGN PHASE S. Tsach, S. Bauminger, M. Levin, D. Penn and T. Rubin Engineering center Israel Aircraft Industries
AN ADVANCED COUNTER-ROTATING DISK WING AIRCRAFT CONCEPT Program Update. Presented to NIAC By Carl Grant November 9th, 1999
 AN ADVANCED COUNTER-ROTATING DISK WING AIRCRAFT CONCEPT Program Update Presented to NIAC By Carl Grant November 9th, 1999 DIVERSITECH, INC. Phone: (513) 772-4447 Fax: (513) 772-4476 email: carl.grant@diversitechinc.com
ECO-CARGO AIRCRAFT. ISSN: International Journal of Science, Engineering and Technology Research (IJSETR) Volume 1, Issue 2, August 2012
 Volume 1, Issue 2, August 2012") ECO-CARGO AIRCRAFT Vikrant Goyal, Pankhuri Arora Abstract- The evolution in aircraft industry has brought to us many new aircraft designs. Each and every new design is a step towards a greener tomorrow.
ECO-CARGO AIRCRAFT Vikrant Goyal, Pankhuri Arora Abstract- The evolution in aircraft industry has brought to us many new aircraft designs. Each and every new design is a step towards a greener tomorrow.
AIRCRAFT DESIGN MADE EASY. Basic Choices and Weights. By Chris Heintz
 AIRCRAFT DESIGN MADE EASY By Chris Heintz The following article, which is a first installement of a two-part article, describes a simple method for the preliminary design of an airplane of conventional
PAC 750XL PAC 750XL PAC-750XL
 PAC 750XL The PAC 750XL combines a short take off and landing performance with a large load carrying capability. The PAC 750XL is a distinctive type. Its design philosophy is reflected in the aircraft's
JetBiz. Six and Eight Passenger Business Jets
 JetBiz Presents the Six and Eight Passenger Business Jets In response to the 2016 2017 AIAA Foundation Undergraduate Team Aircraft Design Competition Request for Proposal Presented by California State
Appenidix E: Freewing MAE UAV analysis
 Appenidix E: Freewing MAE UAV analysis The vehicle summary is presented in the form of plots and descriptive text. Two alternative mission altitudes were analyzed and both meet the desired mission duration.
Aircraft Design in a Nutshell
 Dieter Scholz Aircraft Design in a Nutshell Based on the Aircraft Design Lecture Notes 1 Introduction The task of aircraft design in the practical sense is to supply the "geometrical description of a new
XIV.C. Flight Principles Engine Inoperative
 XIV.C. Flight Principles Engine Inoperative References: FAA-H-8083-3; POH/AFM Objectives The student should develop knowledge of the elements related to single engine operation. Key Elements Elements Schedule
This Flight Planning Guide is published for the purpose of providing specific information for evaluating the performance of the Cessna Corvalis TT.
 May 2010 TABLE OF CONTENTS This Flight Planning Guide is published for the purpose of providing specific information for evaluating the performance of the Cessna Corvalis TT. This guide is developed from
Flugzeugentwurf / Aircraft Design SS Part 35 points, 70 minutes, closed books. Prof. Dr.-Ing. Dieter Scholz, MSME. Date:
 DEPARTMENT FAHRZEUGTECHNIK UND FLUGZEUGBAU Flugzeugentwurf / Aircraft Design SS 2015 Duration of examination: 180 minutes Last Name: Matrikelnummer: First Name: Prof. Dr.-Ing. Dieter Scholz, MSME Date:
Performance means how fast will it go? How fast will it climb? How quickly it will take-off and land? How far it will go?
 Performance Concepts Speaker: Randall L. Brookhiser Performance means how fast will it go? How fast will it climb? How quickly it will take-off and land? How far it will go? Let s start with the phase
AIAA Foundation Student Design Competition 2015/16. Undergraduate Individual Aircraft
 AIAA Foundation Student Design Competition 2015/16 Undergraduate Individual Aircraft Conceptual Design of TAJ PEGASUS A Long Range Container Transportation Aircraft Designer & Author : Waheedullah Taj
INDIAN INSTITUTE OF TECHNOLOGY KANPUR
 INDIAN INSTITUTE OF TECHNOLOGY KANPUR INDIAN INSTITUTE OF TECHNOLOGY KANPUR Removable, Low Noise, High Speed Tip Shape Tractor Configuration, Cant angle, Low Maintainence Hingelesss, Good Manoeuverability,
THE KING OF PAYLOAD AND PERFORMANCE
 THE KING OF PAYLOAD AND PERFORMANCE TECHNICAL SPECIFICATIONS GROSS WEIGHT Standard Model FBA-2C3 GROSS WEIGHT Turbo Model FBA-2C3T > WEIGHT AND BALANCE Maximum Take-Off Weight (MTOW) 3,800 lb 1,724 kg
DUCHESS BE-76 AND COMMERCIAL MULTI ADD-ON ORAL REVIEW FOR CHECKRIDE
 DUCHESS BE-76 AND COMMERCIAL MULTI ADD-ON ORAL REVIEW FOR CHECKRIDE The Critical Engine The critical engine is the engine whose failure would most adversely affect the airplane s performance or handling
Design of Ultralight Aircraft
 Design of Ultralight Aircraft Greece 2018 Main purpose of present study The purpose of this study is to design and develop a new aircraft that complies with the European ultra-light aircraft regulations
Systems Group (Summer 2012) 4 th Year (B.Eng) Aerospace Engineering Candidate Carleton University, Ottawa,Canada Mail:
 4 th Year (B.Eng) Aerospace Engineering Candidate Carleton University, Ottawa,Canada Mail:") Memo Airport2030_M_Family_Concepts_of_Box_Wing_12-08-10.pdf Date: 12-08-10 From: Sameer Ahmed Intern at Aero Aircraft Design and Systems Group (Summer 2012) 4 th Year (B.Eng) Aerospace Engineering Candidate
Memo Airport2030_M_Family_Concepts_of_Box_Wing_12-08-10.pdf Date: 12-08-10 From: Sameer Ahmed Intern at Aero Aircraft Design and Systems Group (Summer 2012) 4 th Year (B.Eng) Aerospace Engineering Candidate
New Design Concept of Compound Helicopter
 New Design Concept of Compound Helicopter PRASETYO EDI, NUKMAN YUSOFF and AZNIJAR AHMAD YAZID Department of Engineering Design & Manufacture, Faculty of Engineering, University of Malaya, 50603 Kuala Lumpur,
Methodology for Distributed Electric Propulsion Aircraft Control Development with Simulation and Flight Demonstration
 1 Methodology for Distributed Electric Propulsion Aircraft Control Development with Simulation and Flight Demonstration Presented by: Jeff Freeman Empirical Systems Aerospace, Inc. jeff.freeman@esaero.com,
AIR TRACTOR, INC. OLNEY, TEXAS
 TABLE OF CONTENTS LOG OF REVISIONS... 2 DESCRIPTION... 4 SECTION 1 LIMITATIONS... 5 SECTION 2 NORMAL PROCEDURES... 8 SECTION 3 EMERGENCY PROCEDURES... 8 SECTION 4 MANUFACTURER'S SECTION - PERFORMANCE...
INVESTIGATION OF ICING EFFECTS ON AERODYNAMIC CHARACTERISTICS OF AIRCRAFT AT TSAGI
 INVESTIGATION OF ICING EFFECTS ON AERODYNAMIC CHARACTERISTICS OF AIRCRAFT AT TSAGI Andreev G.T., Bogatyrev V.V. Central AeroHydrodynamic Institute (TsAGI) Abstract Investigation of icing effects on aerodynamic
Ember Aviation LAT-1
 Ember Aviation Presents the LAT-1 In response to the 2015 2016 AIAA Foundation Undergraduate Team Aircraft Design Competition Presented by California Polytechnic State University, Pomona Aerospace Engineering
Multidisciplinary Design Optimization of a Truss-Braced Wing Aircraft with Tip-Mounted Engines
 Multidisciplinary Design Optimization of a Truss-Braced Wing Aircraft with Tip-Mounted Engines NASA Design MAD Center Advisory Board Meeting, November 14, 1997 Students: J.M. Grasmeyer, A. Naghshineh-Pour,
Multidisciplinary Design Optimization of a Strut-Braced Wing Transonic Transport
 Multidisciplinary Design Optimization of a Strut-Braced Wing Transonic Transport John F. Gundlach IV Masters Thesis Defense June 7,1999 Acknowledgements NASA LMAS Student Members Joel Grasmeyer Phillipe-Andre
Hawker Beechcraft Corporation on March 26, 2007
 DEPARTMENT OF TRANSPORTATION FEDERAL AVIATION ADMINISTRATION A00010WI Revision 8 Hawker Beechcraft 390 March 26, 2007 TYPE CERTIFICATE DATA SHEET NO. A00010WI This data sheet, which is part of Type Certificate
TEAM Four Critical Design Review. Kai Jian Cheong Richard B. Choroszucha* Lynn Lau Mathew Marcucci Jasmine Sadler Sapan Shah Chongyu Brian Wang
 TEAM Four Critical Design Review Kai Jian Cheong Richard B. Choroszucha* Lynn Lau Mathew Marcucci Jasmine Sadler Sapan Shah Chongyu Brian Wang 03.XII.2008 0.1 Abstract The purpose of this report is to
Environmentally Focused Aircraft: Regional Aircraft Study
 Environmentally Focused Aircraft: Regional Aircraft Study Sid Banerjee Advanced Design Product Development Engineering, Aerospace Bombardier International Workshop on Aviation and Climate Change May 18-20,
General Dynamics F-16 Fighting Falcon
 General Dynamics F-16 Fighting Falcon http://www.globalsecurity.org/military/systems/aircraft/images/f-16c-19990601-f-0073c-007.jpg Adam Entsminger David Gallagher Will Graf AOE 4124 4/21/04 1 Outline
GACE Flying Club Aircraft Review Test 2018 N5312S & N5928E. Name: GACE #: Score: Checked by: CFI #:
 GACE Flying Club Aircraft Review Test 2018 N5312S & N5928E Name: GACE #: Score: Checked by: CFI #: Date: (The majority of these questions are for N5312S. All N5928E questions will be marked 28E) 1. What
1.1 REMOTELY PILOTED AIRCRAFTS
 CHAPTER 1 1.1 REMOTELY PILOTED AIRCRAFTS Remotely Piloted aircrafts or RC Aircrafts are small model radiocontrolled airplanes that fly using electric motor, gas powered IC engines or small model jet engines.
Aircraft Design: A Systems Engineering Approach, M. Sadraey, Wiley, 2012 Chapter 11 Aircraft Weight Distribution Tables
 Aircraft Design: A Systems Engineering Approach, M. Sadraey, Wiley, 01 Chapter 11 Aircraft Weight Distribution Tables No Component group Elements Weight X cg Y cg Z cg 1 Wing 1.1. Wing main structure 1..
Chapter 10 Parametric Studies
 Chapter 10 Parametric Studies 10.1. Introduction The emergence of the next-generation high-capacity commercial transports [51 and 52] provides an excellent opportunity to demonstrate the capability of
FLASHCARDS AIRCRAFT. Courtesy of the Air Safety Institute, a Division of the AOPA Foundation, and made possible by AOPA Services Corporation.
 AIRCRAFT FLASHCARDS Courtesy of the Air Safety Institute, a Division of the AOPA Foundation, and made possible by AOPA Services Corporation. Knowing your aircraft well is essential to safe flying. These
AE 452 Aeronautical Engineering Design II Installed Engine Performance. Prof. Dr. Serkan Özgen Dept. Aerospace Engineering March 2016
 AE 452 Aeronautical Engineering Design II Installed Engine Performance Prof. Dr. Serkan Özgen Dept. Aerospace Engineering March 2016 Propulsion 2 Propulsion F = ma = m V = ρv o S V V o ; thrust, P t =
Chapter 3: Aircraft Construction
 Chapter 3: Aircraft Construction p. 1-3 1. Aircraft Design, Certification, and Airworthiness 1.1. Replace the letters A, B, C, and D by the appropriate name of aircraft component A: B: C: D: E: 1.2. What
Chapter 10 Miscellaneous topics - 2 Lecture 39 Topics
 Chapter 10 Miscellaneous topics - 2 Lecture 39 Topics 10.3 Presentation of results 10.3.1 Presentation of results of a student project 10.3.2 A typical brochure 10.3 Presentation of results At the end
Initech Aircraft is proud to present the JTC-2 E Swingliner in response to the
 ii Executive Summary Initech Aircraft is proud to present the JTC-2 E Swingliner in response to the 2006-2007 AIAA undergraduate design competition. The Swingliner has been developed as a survivable transport
SCS-527 Sea Duck. May 10, 2017
 SCS-527 Sea Duck May 10, 2017 AIAA Undergraduate Team Aircraft Design Competition 2016-2017 Austin Collett Matthew Salter Shawn Sinclair Name AIAA Number Signature Austin Collett 760598 Matthew Salter
Environautics EN-1. Aircraft Design Competition. Presented by Virginia Polytechnic Institute and State University
 Environautics EN-1 Response to the 2009-2010 AIAA Foundation Undergraduate Team Aircraft Design Competition Presented by Virginia Polytechnic Institute and State University Left to Right: Justin Cox, Julien
Lecture 5 : Static Lateral Stability and Control. or how not to move like a crab. G. Leng, Flight Dynamics, Stability & Control
 Lecture 5 : Static Lateral Stability and Control or how not to move like a crab 1.0 Lateral static stability Lateral static stability refers to the ability of the aircraft to generate a yawing moment to
Power Estimation for a Two Seater Helicopter
 Power Estimation for a Two Seater Helicopter JTSE Mohammad Nazri Mohd Jaafar, a,* Mohd Idham Mohd Nayan, a M.S.A. Ishak, b a Department of Aeronautical Engineering, Faculty of Mechanical Engineering, Universiti
31 st Annual American Helicopter Society Student Design Competition: Graduate Submission
 Rotorcraft Adaptive and Morphing Structures Lab The Emperor UAV: Executive Summary George Jacobellis Alex Angilella Jean-Paul Reddinger Andrew Howard Matthew Misiorowski Michael Pontecorvo Jayanth Krishnamurthi
Design Studies of Thin-Haul Commuter Aircraft with Distributed Electric Propulsion
 16th AIAA Aviation Technology, Integration, and Operations Conference, 13-17 June 2016, Washington, D.C. Design Studies of Thin-Haul Commuter Aircraft with Distributed Electric Propulsion Alex M. Stoll,
DESIGN AND DEVELOPMENT OF A MICRO AIR VEHICLE (µav) CONCEPT: PROJECT BIDULE
 CONCEPT: PROJECT BIDULE") DESIGN AND DEVELOPMENT OF A MICRO AIR VEHIE (µav) CONCEPT: PROJECT BIDULE Mr T. Spoerry, Dr K.C. Wong School of Aerospace, Mechanical and Mechatronic Engineering University of Sydney NSW 6 Abstract This
DESIGN AND DEVELOPMENT OF A MICRO AIR VEHIE (µav) CONCEPT: PROJECT BIDULE Mr T. Spoerry, Dr K.C. Wong School of Aerospace, Mechanical and Mechatronic Engineering University of Sydney NSW 6 Abstract This
A-VIATOR (AP68TP 600) Presentation
 Presentation") A-VIATOR (AP68TP 600) Presentation All reasonable care has been taken by VULCANAIR to ensure the accuracy of the information contained in the present document. However, the material presented is provided
A-VIATOR (AP68TP 600) Presentation All reasonable care has been taken by VULCANAIR to ensure the accuracy of the information contained in the present document. However, the material presented is provided
Wing Cuff Design for Cessna CJ1
 Wing Cuff Design for Cessna CJ1 AAE 415 Project Purdue University Saturday, December 10th, 2004 Brian Adams Kevin Clark Greg Davidson Phil Spindler Contents Background of Problem Literature Review Design
CONCEPTUAL DESIGN OF ECOLOGICAL AIRCRAFT FOR COMMUTER AIR TRANSPORTATION
 26 TH INTERNATIONAL CONGRESS OF THE AERONAUTICAL SCIENCES CONCEPTUAL DESIGN OF ECOLOGICAL AIRCRAFT FOR COMMUTER AIR TRANSPORTATION Yasuhiro TANI, Tomoe YAYAMA, Jun-Ichiro HASHIMOTO and Shigeru ASO Department
Classical Aircraft Sizing I
 Classical Aircraft Sizing I W. H. Mason from Sandusky, Northrop slide 1 Which is 1 st? You need to have a concept in mind to start The concept will be reflected in the sizing by the choice of a few key
TAKEOFF PERFORMANCE ground roll
 TAKEOFF PERFORMANCE An airplane is motionless at the end of a runway. This is denoted by location O. The pilot releases the brakes and pushes the throttle to maximum takeoff power, and the airplane accelerates
The Sonic Cruiser A Concept Analysis
 International Symposium "Aviation Technologies of the XXI Century: New Aircraft Concepts and Flight Simulation", 7-8 May 2002 Aviation Salon ILA-2002, Berlin The Sonic Cruiser A Concept Analysis Dr. Martin
PERFORMANCE ANALYSIS OF UNMANNED AIR VEHICLE INTERCEPTOR (UAV-Ip)
") TH INTERNATIONAL CONGRESS OF THE AERONAUTICAL SCIENCES PERFORMANCE ANALYSIS OF UNMANNED AIR VEHICLE INTERCEPTOR (UAV-Ip) FLT LT MUHAMMAD ASIM AHQ CHAKLALA (PROJ VISION) RAWALPINDI PAKISTAN AIR FORCE, PAKISTAN
TH INTERNATIONAL CONGRESS OF THE AERONAUTICAL SCIENCES PERFORMANCE ANALYSIS OF UNMANNED AIR VEHICLE INTERCEPTOR (UAV-Ip) FLT LT MUHAMMAD ASIM AHQ CHAKLALA (PROJ VISION) RAWALPINDI PAKISTAN AIR FORCE, PAKISTAN
Flight Test Evaluation of C-130H Aircraft Performance with NP2000 Propellers
 Flight Test Evaluation of C-130H Aircraft Performance with NP2000 Propellers Lance Bays Lockheed Martin - C-130 Flight Sciences Telephone: (770) 494-8341 E-Mail: lance.bays@lmco.com Introduction Flight
Executive Summary. Nanjing University of Aeronautics and Astronautics
 Executive Summary 29 MAY 2016 Undergraduate Design Report Executive Summary 1 Mission Requirements In response to the Design Competition sponsored by Bell Helicopter, the aim of NUAA Undergraduate Team
Optimum Seat Abreast Configuration for an Regional Jet
 7 th european conference for aeronautics and space sciences (eucass) Optimum Seat Abreast Configuration for an Regional Jet I. A. Accordi* and A. A.de Paula** *Instituto Tecnológico de Aeronáutica São
Van s Aircraft RV-7A. Pilot s Operating Handbook N585RV
 Van s Aircraft RV-7A Pilot s Operating Handbook N585RV PERFORMANCE SPECIFICATIONS SPAN:..25 0 LENGTH...20 4 HEIGHT:.. 7 10 SPEED: Maximum at Sea Level...180 knots Cruise, 75% Power at 8,000 Ft...170 knots
TELFONA, Contribution to Laminar Wing Development for Future Transport Aircraft. K. H. Horstmann Aeronautical Days, Vienna, 19 th -21 st June 2006
 TELFONA, Contribution to Laminar Wing Development for Future Transport Aircraft K. H. Horstmann Aeronautical Days, Vienna, 19 th -21 st June 2006 Content Motivation Determination of transition Objectives
A SOLAR POWERED UAV. 1 Introduction. 2 Requirements specification
 A SOLAR POWERED UAV Students: R. al Amrani, R.T.J.P.A. Cloosen, R.A.J.M. van den Eijnde, D. Jong, A.W.S. Kaas, B.T.A. Klaver, M. Klein Heerenbrink, L. van Midden, P.P. Vet, C.J. Voesenek Project tutor:
Evaluation of the Applicability of the Vortex Lattice Method to the Analysis of Human Powered Aircraft
 McNair Scholars Research Journal Volume Article Evaluation of the Applicability of the Vortex Lattice Method to the Analysis of Human Powered Aircraft Armando R. Collazo Garcia III Embry-Riddle Aeronautical
EGLIN AERO CLUB C-172 OPEN BOOK EXAMINATION Apr Total usable fuel capacity for the aircraft with long range tanks is:
 (The following questions are taken from the C-172N POH) 1. Total usable fuel capacity for the aircraft with long range tanks is: a. 54 gallons b. 50 gallons c. 62 gallons d. 40 gallons 2. Total fuel capacity
Modeling, Structural & CFD Analysis and Optimization of UAV
 Modeling, Structural & CFD Analysis and Optimization of UAV Dr Lazaros Tsioraklidis Department of Unified Engineering InterFEA Engineering, Tantalou 7 Thessaloniki GREECE Next Generation tools for UAV
Overview and Team Composition
 Overview and Team Composition Aerodynamics and MDO Andy Ko Joel Grasmeyer* John Gundlach IV* Structures Dr. Frank H. Gern Amir Naghshineh-Pour* Aeroelasticity Erwin Sulaeman CFD and Interference Drag Philippe-Andre
@AIRBUS A /-600 AIRPLANE CHARACTERISTICS FOR AIRPORT PLANNING
 @AIRBUS A340-500/-600 AIRPLANE CHARACTERISTICS FOR AIRPORT PLANNING AC The content of this document is the property of Airbus. It is supplied in confidence and commercial security on its contents must
TYPE-CERTIFICATE DATA SHEET
 TYPE-CERTIFICATE DATA SHEET NO. EASA.IM.A.073 for Beechcraft 390 (PREMIER I and IA) Type Certificate Holder: Textron Aviation Inc. One Cessna Boulevard Wichita, Kansas 67215 USA For Models: Model 390 1
AeroTactic Company. FF-1 Rainbird
 AeroTactic Company presents the FF-1 Rainbird In response to the 2015-2016 AIAA Foundation Graduate Team Aircraft Design Competition Presented by California State Polytechnic University, Pomona Aerospace
2008/2009 AIAA Undergraduate Team Aircraft Design
 2008/2009 AIAA Undergraduate Team Aircraft Design 2 3 Executive Summary Fusion Aeronautics presents the HB-86 Navigator as a solution to the 2008-2009 AIAA Undergraduate Aircraft Design Competition RFP.
Preface. Acknowledgments. List of Tables. Nomenclature: organizations. Nomenclature: acronyms. Nomenclature: main symbols. Nomenclature: Greek symbols
 Contents Preface Acknowledgments List of Tables Nomenclature: organizations Nomenclature: acronyms Nomenclature: main symbols Nomenclature: Greek symbols Nomenclature: subscripts/superscripts Supplements
7. PRELIMINARY DESIGN OF A SINGLE AISLE MEDIUM RANGE AIRCRAFT
 7. PRELIMINARY DESIGN OF A SINGLE AISLE MEDIUM RANGE AIRCRAFT Students: R.M. Bosma, T. Desmet, I.D. Dountchev, S. Halim, M. Janssen, A.G. Nammensma, M.F.A.L.M. Rommens, P.J.W. Saat, G. van der Wolf Project
Chapter 2 Lecture 5 Data collection and preliminary three-view drawing - 2 Topic
 Chapter 2 Lecture 5 Data collection and preliminary three-view dra - 2 Topic 2.3 Preliminary three-view dra Example 2.1 2.3 Preliminary three-view dra The preliminary three-view dra of the airplane gives
Air Buzz. 32nd Annual AHS International Student Design Competition
 Air Buzz 32nd Annual AHS International Student Design Competition Faculty Advisor: Dr. Daniel Schrage, Daniel.Schrage@aerospace.gatech.edu Ezgi Selin Akdemir esakdemir@gmail.com Undergraduate Middle East
Chapter 11: Flow over bodies. Lift and drag
 Chapter 11: Flow over bodies. Lift and drag Objectives Have an intuitive understanding of the various physical phenomena such as drag, friction and pressure drag, drag reduction, and lift. Calculate the
DESIGN OF AN ARMAMENT WING FOR A LIGHT CATEGORY HELICOPTER
 International Journal of Engineering Applied Sciences and Technology, 7 Published Online February-March 7 in IJEAST (http://www.ijeast.com) DESIGN OF AN ARMAMENT WING FOR A LIGHT CATEGORY HELICOPTER Miss.
Charles H. Zimmerman promoted his Flying Pancake design from 1933 to 1937 while working for the
 Model Number : V-173 Model Name : Flying Pancake Model Type: Proof of Concept, Fighter Charles H. Zimmerman promoted his Flying Pancake design from 1933 to 1937 while working for the National Advisory
Gyroplane questions from Rotorcraft Commercial Bank (From Rotorcraft questions that obviously are either gyroplane or not helicopter)
") Page-1 Gyroplane questions from Rotorcraft Commercial Bank (From Rotorcraft questions that obviously are either gyroplane or not helicopter) "X" in front of the answer indicates the likely correct answer.
Page-1 Gyroplane questions from Rotorcraft Commercial Bank (From Rotorcraft questions that obviously are either gyroplane or not helicopter) "X" in front of the answer indicates the likely correct answer.
Powertrain Design for Hand- Launchable Long Endurance Unmanned Aerial Vehicles
 Powertrain Design for Hand- Launchable Long Endurance Unmanned Aerial Vehicles Stuart Boland Derek Keen 1 Justin Nelson Brian Taylor Nick Wagner Dr. Thomas Bradley 47 th AIAA/ASME/SAE/ASEE JPC Outline
High aspect ratio for high endurance. Mechanical simplicity. Low empty weight. STOVL or STOL capability. And for the propulsion system:
 Idealized tilt-thrust (U) All of the UAV options that we've been able to analyze suffer from some deficiency. A diesel, fixed-wing UAV could possibly satisfy the range and endurance objectives, but integration
AIAA Foundation Undergraduate Team Aircraft Design Competition. RFP: Cruise Missile Carrier
 AIAA Foundation Undergraduate Team Aircraft Design Competition RFP: Cruise Missile Carrier 1999/2000 AIAA FOUNDATION Undergraduate Team Aircraft Design Competition I. RULES 1. All groups of three to ten
EFFECT OF SURFACE ROUGHNESS ON PERFORMANCE OF WIND TURBINE
 Chapter-5 EFFECT OF SURFACE ROUGHNESS ON PERFORMANCE OF WIND TURBINE 5.1 Introduction The development of modern airfoil, for their use in wind turbines was initiated in the year 1980. The requirements
Innovating the future of disaster relief
 Innovating the future of disaster relief American Helicopter Society International 33rd Annual Student Design Competition Graduate Student Team Submission VEHICLE OVERVIEW FOUR VIEW DRAWING INTERNAL COMPONENTS
Answer Key. Page 1 of 10
 Name: Answer Key Score: [1] When range and economy of operation are the principal goals, the pilot must ensure that the airplane will be operated at the recommended A. equivalent airspeed. B. specific
Ultralight airplane Design
 Ultralight airplane Design Ultralight airplane definitions: Airworthiness authorities define aircraft as vehicles that can rise or move in the air and enforce strict regulations and requirements for all
European Aviation Safety Agency
 TCDS EASA.A.109 ASI AVIATION Page 1 of 10 European Aviation Safety Agency EASA TYPE-CERTIFICATE DATA SHEET EASA.A.109 F 406 Type Certificate Holder : ASI AVIATION 14 allée René Fonck 51100 REIMS France
AAE 451 Conceptual Design Review
 AAE 451 Conceptual Design Review May 6, 2010 Team 1 Alex Mondal Beth Grilliot Brien Piersol Heath Cheung Jason Liu Jeff Cohen Jeremy Wightman Kit Fransen Lauren Hansen Nick Walls Ryan Foley Tim Fechner
CONCEPTUAL DESIGN REPORT
 CONCEPTUAL DESIGN REPORT Agricultural Unmanned Aircraft System (AUAS) Team Two-CAN Team Member Albert Lee (Team Leader) Chris Cirone Kevin Huckshold Adam Kuester Jake Niehus Michael Scott Area of Responsibility
FLIGHT PERFORMANCE AND PLANNING (1) MASS AND BALANCE
 MASS AND BALANCE") 1 The centre of gravity of an aircraft A is in a fixed position and is unaffected by aircraft loading. B must be maintained in a fixed position by careful distribution of the load. C can be allowed to
1 The centre of gravity of an aircraft A is in a fixed position and is unaffected by aircraft loading. B must be maintained in a fixed position by careful distribution of the load. C can be allowed to
AIRLINE TRANSPORT PILOTS LICENSE ( FLIGHT PERFORMANCE AND PLANNING)
") 032 01 00 00 PERFORMANCE OF SINGLE-ENGINE AEROPLANES NOT CERTIFIELD UNDER JAR/FAR 25 (LIGHT AEROPLANES) PERFORMANCE CLASS B 032 01 01 00 Definitions of terms and speeds used Define the following terms
032 01 00 00 PERFORMANCE OF SINGLE-ENGINE AEROPLANES NOT CERTIFIELD UNDER JAR/FAR 25 (LIGHT AEROPLANES) PERFORMANCE CLASS B 032 01 01 00 Definitions of terms and speeds used Define the following terms
AE 451 Aeronautical Engineering Design I Propulsion and Fuel System Integration. Prof. Dr. Serkan Özgen Dept. Aerospace Engineering December 2017
 AE 451 Aeronautical Engineering Design I Propulsion and Fuel System Integration Prof. Dr. Serkan Özgen Dept. Aerospace Engineering December 2017 Propulsion system options 2 Propulsion system options 3
FLIGHT TEST RESULTS AT TRANSONIC REGION ON SUPERSONIC EXPERIMENTAL AIRPLANE (NEXST-1)
") 26 TH INTERNATIONAL CONGRESS OF THE AERONAUTICAL SCIENCES FLIGHT TEST RESULTS AT TRANSONIC REGION ON SUPERSONIC EXPERIMENTAL AIRPLANE (NEXST-1) Dong-Youn Kwak*, Hiroaki ISHIKAWA**, Kenji YOSHIDA* *Japan
26 TH INTERNATIONAL CONGRESS OF THE AERONAUTICAL SCIENCES FLIGHT TEST RESULTS AT TRANSONIC REGION ON SUPERSONIC EXPERIMENTAL AIRPLANE (NEXST-1) Dong-Youn Kwak*, Hiroaki ISHIKAWA**, Kenji YOSHIDA* *Japan
10th Australian International Aerospace Congress
 AUSTRALIAN INTERNATIONAL AEROSPACE CONGRESS Paper presented at the 10th Australian International Aerospace Congress incorporating the 14th National Space Engineering Symposium 2003 29 July 1 August 2003
DESIGN OF A FIFTH GENERATION AIR SUPERIORITY FIGHTER AIRCRAFT
 Proceedings of the International Conference on Mechanical Engineering and Renewable Energy 2015 (ICMERE2015) 26 29 November, 2015, Chittagong, Bangladesh ICMERE2015PI152 DESIGN OF A FIFTH GENERATION AIR
Hybrid-Electric General Aviation Aircraft (HEGAA)
") 2017 2018 Undergraduate Team Aircraft Design Competition Hybrid-Electric General Aviation Aircraft (HEGAA) Presented by Federal University of Uberlândia Department of Aerospace Engineering Minas Gerais,
2017 2018 Undergraduate Team Aircraft Design Competition Hybrid-Electric General Aviation Aircraft (HEGAA) Presented by Federal University of Uberlândia Department of Aerospace Engineering Minas Gerais,
POWER ESTIMATION FOR FOUR SEATER HELICOPTER
 Jurnal Mekanikal December 2008, No. 27, 78-90 POWER ESTIMATION FOR FOUR SEATER HELICOPTER Ahmad Azlan Shah B. Ibrahim Mohammad Nazri Mohd Jaafar * Faculty of Mechanical Engineering University Technology
Aircraft Design: A Systems Engineering Approach, M. Sadraey, Wiley, 2012 Chapter 3 Aircraft Conceptual Design. Tables
 Aircraft Design: A Systems Engineering Approach, M. Sadraey, Wiley, 2012 Chapter 3 Aircraft Conceptual Design Tables No Component Primary function Major areas of influence 1 Fuselage Payload accommodations