Australian Institute of Petroleum. Downstream Petroleum 2013
|
|
|
- Ronald Tate
- 5 years ago
- Views:
Transcription


1 Australian Institute of Petroleum Downstream Petroleum 2013

2 AIP mission and objectives AIP was formed in 1976 to promote effective dialogue between the oil industry, government and the community. It replaced a number of other organisations such as the Petroleum Information Bureau that had been operating in Australia since the early 1950s. AIP has gained national and worldwide recognition as a key representative body of Australia s petroleum industry. AIP s mission is to promote and assist in the development of a strong, internationally competitive Australian petroleum products industry, operating efficiently, economically and safely, and in harmony with environment and community standards. Through the active involvement of its members, AIP provides responsible and principled representation of the industry along with factual and informed discussion of downstream petroleum sector issues. As well as its policy development role, AIP also runs the Australian Marine Oil Spill Centre (AMOSC) in Geelong to support oil spill preparedness and response by the petroleum industry. AIP encourages decisions on regulations or self regulation which are taken on a case-by-case basis in the best interests of the consumer and the industry so as to achieve excellence in standards of industry safety and product performance; and works to ensure that due diligence is maintained at all times on industry safety, occupational health and environment protection. Members and Associate Members BP AUSTRALIA PTY LTD AFTON CHEMICAL HUNT OIL RIO TINTO CALTEX AUSTRALIA LIMITED APACHE ENERGY LTD INPEX ROC OIL COMPANY LTD MOBIL OIL AUSTRALIA PTY LTD THE SHELL COMPANY OF AUSTRALIA LIMITED ASP SHIPPING MANAGEMENT PTY LTD BHP BILLITON PTY LTD CALENERGY CHEVRON AUSTRALIA PTY LTD CONOCOPHILLIPS INTEROIL LOWES PETROLEUM MURPHY OIL NEXUS ENERGY LTD NYNAS (AUSTRALIA) PTY LTD SANTOS LTD SINOPEC OIL & GAS SOUTHERN CROSS OIL STATEWIDE OIL DISTRIBUToRS TEEKAY SHIPPING (AUSTRALIA) PTY LTD EAST COAST LUBES PTY LTD ENI AUSTRALIA HESS EXPLORATION AUSTRALIA PTY LTD ORIGIN ENERGY RESOURCES LTD PAPUAN OIL SEARCH LTD PTTEP AUSTRALASIA PTY LTD VERMILION OIL AND GAS AUSTRALIA PTY LTD WOODSIDE ENERGY LTD WOOLWORTHS LTD
3 Message from the AIP Chairman 3 Downstream Petroleum 2013 sets out key industry facts and issues impacting on the downstream petroleum sector in Australia. Liquid fuels play a key role in the Australian economy and underpin the economic performance of the transport, mining and agriculture sectors. The downstream petroleum industry in Australia has a longstanding record of reliably supplying high quality, competitively priced fuels to industry and consumers. In recent years, the Australian fuels industry has faced considerable international and domestic challenges. Intense competition in international oil markets, new cost competitive sources of liquid hydrocarbons and the continued construction of mega refineries continue to drive major structural changes in the global petroleum markets. With the majority of demand growth over the next decade expected to be in Asia, new refinery capacity continues to be built in the Middle East and Asia. Surplus capacity at these new refineries continues to depress refiner margins and is challenging the commercial viability of many existing refineries in Europe, North America, Japan and Australia. Decisions have been taken to close or scale back the operations of refineries that do not have the economies of scale advantages of these new refineries, or the substantial financial incentives provided by governments in Asia. Within Australia, the downstream petroleum sector has responded through stringent cost control, enhanced efficiency, and by becoming much more integrated into the rapidly expanding Asian fuels market. Two Australian refineries are already being converted into import terminals. At the same time, independent fuel suppliers have been meeting a growing proportion of the Australian fuels demand through imports from regional fuel trading companies and from refineries operated by national oil companies. Recent government and independent reviews of Australia s energy security have confirmed that Australia has diversified fuel supply chains with strong links to regional refiners and marketers. Australian consumers are benefitting from this open market access to very competitively priced fuels, with prices determined by the supply demand balance in the regional and global fuels markets. In its 2013 review of fuel prices, the ACCC has again confirmed the competitiveness of Australian fuel prices and markets. Australian petrol and diesel prices continue to be among the lowest in OECD countries. Consumer choice continues to drive strong use of regular and premium grade petrol despite government programs and incentives intended to favour alternative fuels such as LPG and ethanol blend petrol. On the basis of current consumer behaviour and government policies it is expected that petrol, diesel and jet fuel will remain the major liquid fuels over the foreseeable future. Analysis by the Australian Government in 2013 confirms this assessment. While international factors are key forces in shaping the Australian fuels market, the cost of doing business in Australia, including labour and construction costs and tighter regulatory requirements, remains substantially higher than in Asia. Consumer demands and escalating government requirements have a significant impact on the commercial viability of fuel supply operations. The downstream petroleum industry faces a complex policy environment regulated by federal, state and local governments. There is a key role for governments in providing a clear and stable longer term policy framework for industry investment and operations, but it is essential that these policies are harmonised across jurisdictions, are properly integrated with other policies applying to industry, and apply equally to all industry participants. A strong market-based approach must be the starting point for all government policies, with any market interventions based on a demonstrated market failure that the market or consumers cannot efficiently resolve. Any government policies must show a clear net benefit to the community, while also fostering ongoing investment in regionally competitive fuel supply infrastructure and promoting liquid fuel supply security. As the Australian fuel supply industry changes in response to global and local pressures, industry members will continue to strive to increase productivity and remain regionally competitive so as to continue to deliver secure fuel supplies to meet Australian consumer needs. Andrew Warrell Chairman, AIP
4 4 Australian liquid fuel supply and demand Key messages The Australian refining industry is a price taker in the Asian region. Profitability is related to Singapore product prices less crude oil and processing costs. The Asian region has a surplus supply balance due to increased supply from new refineries and weaker than expected demand. Imports are increasing to meet the growing gap between domestic refinery production and increasing demand. Imports by independent fuel suppliers are increasing. In , Australia s domestic refineries supplied around 60 per cent of petroleum products required by major industries and the fuel distribution network of around 6300 service stations. The reliability of the fuel supply chain is robust given the unique logistic and geographic challenges in Australia. Australian petroleum refineries are highly capital intensive, technically sophisticated facilities that employ a wide range of highly skilled personnel and provide significant economic and other benefits to key Australian industries. The Australian oil refining industry produces a range of petroleum products comprising: petrol (43%) diesel (35%) jet fuel (15%) fuel oil (2%) LPG (3%) other products (2%). It also produces a substantial volume of chemical feedstock. Refineries and major fuel import terminals In Australia consumed ml (megalitres) of petroleum products (or around 151 ml per day an 8.9 per cent increase since Australian refineries produced ml of petroleum products, of which around 9 per cent was exported (excluding LPG). Net imports from over 20 countries accounted for 40 per cent (or ml) of total consumption. A proportion of this imported volume was supplied to northern and north western areas of Australia where it is more economic to supply directly from Asia. Import terminals are located throughout Australia. The bulk of imported petrol came from refiners and regional traders in Singapore. While Australia has substantial crude oil production, around 75 per cent of this oil was exported in Crude oils required to meet the product demand mix in Australia were imported by domestic refineries from over 17 countries mainly from Asia (55%), the Middle East (21%) and Africa (21%). The Australian downstream petroleum industry continues to provide very reliable supplies to consumers, despite fluctuations in demand. International crude oil and product prices and Australian taxes account for around 90 per cent of petroleum product retail prices in Australia.
5 5 Imports of petroleum products: % 100% Singapore 53% Imports of crude oil: % 100% Malaysia 18% UAE 15% Indonesia 12% Nigeria 11% South Korea 18% NZ 7% Vietnam 8% Japan 12% Others (16%) including: Chinese Taipei, Malaysia, Thailand, Indonesia, US, India, Brunei, China Others (29%) including: Gabon, Libya, Congo, PNG, Russia, Singapore Australian fuel prices Australian refineries operate in a global market and must price their petroleum products to be competitive with imports (i.e. import parity pricing) from the Asian region. There is no tariff protection and all seaboard capitals have import facilities which handle 40 per cent of domestic fuel demand. Profitability of the Australian refining industry is therefore largely determined by product prices in Asia, and its viability depends on our competitiveness against imports from refiners in Asia. Future growth in imports will further strengthen the price relationship between Australian and Asian fuel prices. source: australian petroleum statistics, bree Changing Australian demand for petroleum products Over the past decade, Australian use of petroleum products has increased by around 2 per cent per year. Petrol, diesel and jet fuel use now comprise 89 per cent of the total petroleum product demand. Since : Australian use of main petroleum products: to , ml Jet fuel Diesel use has increased by around 56 per cent due largely to growth in mining industry activities in Australia and growth in sales of vehicles with new generation diesel technology engines Diesel Jet fuel use has increased by around 80 per cent due to growth in air travel for business and leisure Petrol use has declined as vehicle fuel efficiency has continued to improve. Use of regular unleaded petrol (ULP) has declined by 32 per cent as consumers chose new vehicles that require higher octane fuels or moved to ethanol blend petrol. The demand for ethanol blend petrol increased to a peak of 16 per cent of petrol use in , largely in response to the ethanol fuel mandate in NSW, but has subsequently declined. Modelling released by the Australian Government in 2013 indicates that these general trends in petroleum product use are not expected to change materially in the future ULP PULP Proprietary brands Ethanol-blend fuel source: australian petroleum statistics, bree
6 6 International and Asian refining The global refining industry is fundamentally changing as emerging and maturing trends re-shape the global supply and demand patterns for crude oil and petroleum products. Although crude oil and petroleum products are traded globally, major regional markets have developed around the main demand centres of North America, Europe and Asia, with each market having its own characteristics. Refineries play an integral role in these regional markets, with the financial viability of individual refineries heavily influenced by supply and demand in the markets. Prior to the Global Financial Crisis (GFC) in 2008, there was a significant surge in investment in refinery upgrades and in new refinery construction commitments, largely in response to growing demand for petroleum products and the associated strong refiner margins. This was particularly apparent in Asia. However, the GFC resulted in a substantial reduction in global petroleum product demand, with only modest prospect of a recovery of lost demand over the short to medium term. As a consequence, refiner margins dropped substantially, in some cases falling into negative territory. The refining industry, particularly in Europe and OECD Asia, reacted to this financial challenge by terminating or deferring investment plans, reducing the utilisation rates for refineries, and progressively closing less viable refineries. Notwithstanding these developments, a number of countries, particularly China and India, continued to press ahead with major refinery construction programs as part of national development goals. world refining margins US$ per barrel: singapore dubai hydrocracking usgc west texas sour coking 10 nwe brent cracking 5 source: bp statistical review of world energy, june Jan 1992 Jan 1994 Jan 1996 Jan 1998 Jan 2000 Jan 2002 Jan 2004 Jan 2006 Jan 2008 Jan 2010 Jan 12 World refining capacity millions of barrels per day sources: l bp statistical review of world energy, june 2013 l oil & gas journal North America Western Europe Eastern Europe South America Africa Middle East Asia
7 7 Asian excess supply capacity proportion of total supply (%) 10% 8% 4% 0% -4% -8% excess supply (millions of barrels) source: facts global energy & caltex Although petroleum product demand has slowly recovered from the GFC, these trends have continued to play out across Europe, North America and Asia, with older refineries closing, new refineries coming on stream, continuing refinery construction across Asia and the Middle East, and lower than usual refinery utilisation rates at many refineries. For example, China has added, on average, almost 1 million barrels per day of refining capacity every year since This construction and expansion program in China is expected to peak in 2015 with the addition of about 1.4 million barrels per day in new capacity. By comparison, since 2008 some 4 million barrels per day of older refining capacity has been closed in North America, Europe, Japan and Australia. While demand for petroleum products in China has been strong it has not been sufficient to absorb all the output from new capacity additions. This has created significant surplus supplies in the Asian region which continue to depress refiner margins despite many refineries operating at below average utilisation rates. Equally importantly this surplus capacity creates a significant potential for China to increase utilisation rates at existing refineries to meet increases in Asian demand, particularly if refiner margins improve. At the same time, global refining activities have been fundamentally affected by changes in the availability of domestically produced crude oil and condensate in North America. The ready and rapidly increasing availability of light tight crude oils from deposits such as Bakken and Eagle Ford, combined with the increasing supply of heavier crude oil from Canadian oil sands, has resulted in a very well-supplied crude oil market in the US. These substantial supplies, and the US ban on exports of crude oil, have led to discounted crude oil prices for US refiners. These factors now underpin the competitiveness of the US refining sector, enabling it to operate at high utilisation rates and to displace imports of diesel from Europe. Since 2008, US imports of crude oil have dropped by over 2 million barrels per day, and petroleum industry analysts, including the IEA, BP and ExxonMobil, are forecasting a continuing high level of crude oil production in North America over the next decade. This development in North America has compounded the effects of the other global trends in the refining industry, particularly in Europe, such that there is an ongoing global surplus refining capacity and depressed refiner margins in other markets. However, with substantial new refining capacity, the Middle East and Asia is moving to become the global hub for future petroleum product refining and trade. In its 2013 World Energy Outlook, the IEA has concluded that in looking forward the new geography of demand and supply means a re-ordering of global oil trade flows towards Asian markets with the prospect that Asia becomes the unrivalled centre of global oil trade. A surplus refining capacity is forecast for the Asian region through to around 2020, notwithstanding the refinery rationalisation that is occurring across Asia, particularly with less viable refineries in Japan and Australia.
8 8 Financial performance of the Australian industry Profitability measures The financial viability of Australia s refining industry has been under significant threat since the start of the GFC due mainly to weak refiner margins and the strong Australian dollar. In addition, operability issues at some refineries led to lower production volumes and higher maintenance costs. The profitability of the Australian downstream petroleum industry in 2011 and 2012 was among the lowest for the last 20 years. In 2011, the net loss ($886 million on a statutory basis and $286 million on an underlying basis) was the largest loss since While these statutory results include a stock gain of $690 million and an offsetting write down of refinery assets of $1.2 billion, the underlying results highlight the very challenging operating environment faced by the Australian industry. The 2011 results represent a minus 5.8 per cent return on assets on a statutory basis and a minus 1 per cent return on an underlying basis. This outcome was even more challenging than the 2001 industry results when the industry was faced with significant domestic over-capacity, poor operational performance, cheap Asian imports and the residual effects of the 1997 Asian financial crisis. Australian industry profitability and return on assets improved in 2012, with a 2.3 per cent underlying return and a minus 0.5 per cent statutory return on assets reflecting stock losses and further refinery asset value write downs. However, this result is well below those achieved between 2003 and The cyclical pattern of the financial performance of the refining industry is clearly demonstrated below in a comparison of the five year average underlying return on assets and correlates with the supply balance for petroleum products over the period. In the early 1990s Australian supply and demand for petroleum products was largely in balance, but by the late 1990s, returns were driven down by a surplus of domestic production and increasing penetration of Asian imports. The average returns between 1998 and 2002 were 4 per cent. As a result, Asian region refinery construction was scaled back and refineries were closed such that there was a supply shortfall in Asia by the mid 2000s. With improved refiner margins the average returns for Australian refiners between 2003 and 2007 were just over 12 per cent. However, the advent of higher refiner margins led to a new round of refinery construction and expansion particularly in China. Despite the impact of the 2008 GFC on petroleum demand and refiner margins, a number of countries in Asia and the Middle East have continued construction of refineries to meet national development goals. As a consequence of depressed refiner margins, the average Australian returns for 2008 to 2012 dropped to 4.1 per cent. Over the longer term ( ), the average underlying return of 6.9 per cent was barely above the average long term bond rate of 5.4 per cent. These results underscore the threats to the viability of the Australian refining sector. Five-year average return on assets on underlying EBIT: per cent 15% 10% 5% EBIT on total assets: per cent 20% 15% 10% 5% 0% % -5% EBIT: statutory EBIT: underlying year bond rate Note: Measures of profitability are presented as earnings before interest and tax (EBIT) on total assets for both statutory and underlying returns so as to remove the impacts of the different capital structures of downstream petroleum companies. The statutory return is reported in company accounts and complies with reporting requirements under relevant legislation. The underlying return removes the impact of stock gains and losses to derive a profit result not affected by the impact of movements in international crude oil and product prices. Write-downs of assets are also removed. Removing the stock valuation and write-down effects from profitability measures provides a clearer picture of the fundamental economic performance of the industry.
9 9 Investment and profits Due to its capital intensive nature, the downstream petroleum industry routinely requires large and ongoing capital investment in plant and equipment to support growth and continue safe and reliable operations. Over the decade to 2012, the industry has invested over $10 billion dollars. In comparison, net profits over the same period were $7.5 billion on a statutory basis and $8.8 billion on an underlying basis. As a proportion of net profits, investment in this period was 135 per cent of statutory profits and 117 per cent of underlying profits. The proportions are even starker over the last five years with total investment of $5.3 billion compared to statutory profits of only $376 million and underlying profits of $2.2 billion. This situation of underlying profits being less than half the investment requirement is challenging for any industry and has clearly proved unsustainable for some Australian refineries. As a consequence of the combined impact of the requirement for continuing and large scale investment and very low profitability, the debt to equity ratio for the industry deteriorated from 55 per cent in 2008 to 71 per cent in Increasing indebtedness further undermines the ability of the industry to remain financially viable. It is expected that refiner margins are likely to moderate as the next phase of Chinese refining capacity comes on stream towards the middle of the decade. The value of the Australian dollar will influence whether these ongoing depressed refiner margins translate into lower profitability for Australian refiners. Australian refiners are expected to continue to seek ways to remain competitive through productivity improvements, a strong focus on cost containment, energy and process efficiency measures and technological innovation. However, any significant investment required over the coming years will be tested against the potential for greater returns from refinery investments in other countries and other non-refinery investments. For example, Shell has emphasised its global strategy to invest in cost effective refineries with appropriate scale such as Palau Bukom (Singapore) and Caltex has emphasised the strength of its distribution and marketing business as a source of company growth. Against this background, any additional investment in Australian refineries that is driven by government regulation, such as more stringent fuel standards or mandated supply of alternative fuels or biofuels, will be extremely challenging. Investment and profits: $ million Investments Profits Downstream petroleum investment and profits: $ million ( ) $10,259 m $7,582 m 2010 $8,778 m New investment Net profit (statutory) Net profit (underlying)

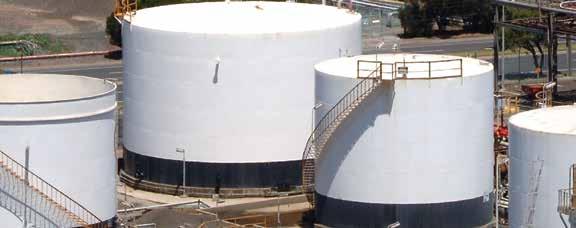
10 10 Australian refinery competitiveness Key messages The Australian refining industry is part of a highly competitive global oil market. Profitability and ongoing viability will be determined largely by supply and demand in the Asian refining industry. Australian refineries are generally smaller than regional competitors. Australian refineries face significant challenges over the next decade including: excess refinery capacity in Asia increased competition from mega-refineries in Asia commercial pressures for increased business efficiencies and avoidance of new costs implementation of climate change policies general tightening of regulatory requirements competing demand and high cost for maintenance and construction services, and skilled labour. Continued viability of Australian refineries will require sound public policies based on efficient and competitive market principles. Australia has six refineries that were generally constructed in the 1950s and 1960s, although they have been extensively upgraded since then, particularly during 2005 and 2006 to meet tighter fuel standards. These refineries are relatively small, with the largest having a capacity of ml pa (megalitres per year), compared with the four largest Asian refineries which produce between ml pa and ml pa. Australian refineries offer none of the economies of scale benefits that are available from these larger refineries. Australian refineries 2013 Refinery Capacity (ml pa) Bulwer Island (BP Brisbane) 5910 Lytton (Caltex Brisbane) 6300 Kurnell (Caltex Sydney) 7820 Altona (Mobil Melbourne) 4950 Geelong (Shell Geelong) 7470 Kwinana (BP Kwinana) 8470 Total The Kurnell (NSW) refinery is expected to cease operating as a refinery in late-2014 and is to be converted by Caltex to a fuel import terminal. The Clyde (NSW) refinery (capacity 4990 ml pa) ceased operating as a refinery in October 2012 and was converted by Shell to a fuel import terminal. The Port Stanvac (SA) refinery (capacity: 4520 ml pa) ceased operations in July 2003 and was closed permanently by Mobil in July Refinery competitiveness Economies of scale provide a key competitive advantage in refining, with larger refineries having lower unit costs of production. These economies of scale arise from larger production runs, lower capital and labour costs per unit of production, and lower purchasing costs for greater volumes of inputs, such as crude oil and energy. Newer refineries also benefit from the latest technology with efficiencies realised from greater flexibility in the crude oil inputs and product slates produced. Refiners seek to run the optimal mix of crude oils through their refineries, depending on the relative price of available crudes, the specific equipment at the refinery, and the desired output mix to meet the demand and quality standards of their target markets. While the cost of crude oil is the major input cost for refineries (around 90 per cent according to the ACCC), other key expenses for refineries include: crude oil shipment and storage additives, catalysts and chemicals capital costs, financing and depreciation wages and salaries plant maintenance site security and systems regulatory measures product shipment and storage utilities and energy charges government taxes and charges. Refineries seek to manage the challenges they face by improving the efficiency of their operations through enhanced refinery yields, reliability and cost containment. Continued availability of highly trained technical staff and contractors will contribute to high levels of refinery efficiency.
11 Australian Government policy 11 Compared to refineries across Asia, Australian refineries suffer from substantial disadvantages in operating and capital costs that virtually preclude Australia from consideration for major new refinery projects. The relatively small Australian refineries offer no economies of scale benefits. Australian labour and construction costs for new and expanded refinery investments remain high compared to costs in most countries in Asia. As an industrialised nation, Australia offers none of the capital or operating cost benefits available in many developing countries. Tax and investment regimes applying in Asia are highly attractive for new facility construction and for substantial refinery upgrades, through the provision of tax holidays, substantial investment allowances and investment facilitation. These competitive disadvantages can impact adversely on the decisions that must be taken by Australian refiners on major refinery upgrades and overhauls. More complex and costly environmental and other regulatory measures also pose significant constraints on new investment in Australia and provide ongoing challenges for existing Australian refineries. Overlapping government regulations also increase the complexity of operations and raise the costs of doing business in Australia. As Australian governments focus their attention on strategies to enhance productivity and to revitalise the role of manufacturing industry, key considerations for the future of the Australian refining industry include: how to offset the capital and operating cost advantages offered by industrialising countries in Asia and elsewhere how to reduce the complexity and cost of doing business for Australian refiners how to ensure that new and modified regulatory policies do not place Australian refineries at a further disadvantage compared to competitor refineries in Asia. AIP considers that the key role for governments is to provide a clear, stable longer term policy framework, underpinned by a strong marketbased approach. Government policy should: ensure a competitive and open market is maintained in Australia ensure that the local refining industry is not competitively disadvantaged maintain a strong commitment to technical skills development in the Australian education system. Government policies will impact on the ability of Australian refiners and fuel importers to attract further investment funds for refinery and import terminal upgrades, and ultimately for major maintenance programs. Key policy influences on the competitiveness of the Australian downstream petroleum industry are: fuel quality regulation liquid fuel supply reliability and security policies alternative fuels policies and mandates fuel and corporate taxation skilled labour availability and training climate change policy environmental and OHS regulation competition regulation fuel retailing regulation. In each of these areas, AIP and member companies advocate policies that are harmonised across all Australian jurisdictions, apply equally to all industry participants and are based on sound science supported by comprehensive economic analysis. Proposals for changes to current market-based policy settings need to clearly demonstrate that: a real market failure or vulnerability exists within the industry new policy measures will produce a net benefit to the community and will not impact adversely on the competitiveness of the industry or liquid fuel supply security and reliability continued reliance on domestic and international markets is unable to deliver a similar outcome. Any proposals for governments to intervene in the operation of the fuels markets should be on the basis that the market or consumers cannot, or cannot efficiently, do these things.
12 12 National fuel quality standards Key messages Government regulated fuel quality standards facilitate the introduction of advanced engine technologies. Benefits include improved urban air quality (through reduced smog and particulates from motor vehicles), reduced greenhouse gas emissions, and improved fuel efficiency. Cleaner fuels require major refinery investment, cost more to produce and lead to higher CO2 emissions from refineries. Benefits of further tightening fuel standards for premium grade petrol do not outweigh the costs of such action. The benefits of tightening fuel standards for regular grade petrol remain to be demonstrated. AIP supports appropriate national fuel quality standards to facilitate the introduction of advanced engine technologies and so help reduce scientifically established urban air quality impacts. The Fuel Quality Standards Act 2000 provides the regulatory framework for fuel quality standards in Australia. AIP continues to work closely with governments and the motor vehicle industry to ensure that fuel quality standards are consistent across Australia, and predictable, so that participants in the market have sufficient time to implement and adjust to any new standards. Over the past decade the Australian refining sector has invested well over $3 billion to implement the Australian Government s Cleaner Fuels Program. This program was designed to help significantly improve urban air quality, including an 80 per cent reduction in nitrogen oxides by New vehicle technologies, particularly downsized turbocharged, direct injection petrol engines and high compression, common rail diesel engines will enable further improvements in fuel economy and lower emissions to be achieved. Modelling of Victorian air quality by CSIRO confirms these reductions in motor vehicle emissions and projects that by 2030, emissions from motor vehicles will become a relatively small source of nitrogen oxide emissions compared to other domestic and industrial sources. Average daily NOx emissions: tonnes per day Reduction in vehicle emissions from cleaner fuels Petrol vehicle exhaust Diesel vehicle exhaust LPG vehicle exhaust Wood heaters and stoves Domestic and commercial activity Industrial activity source: csiro % -10% -20% -30% -40% -50% -60% -70% -80% -90% Hydrocarbons Benzene 1,3-Butadiene Oxides of nitrogen Particulate matter (PM10) Carbon monoxide
13 13 The current petrol and diesel fuel standards when combined with complementary engine technologies will address all national air quality issues that can be controlled by regulating fuel quality. All prospective major petrol vehicle technologies, except for lean burn gasoline direct injection (GDI), can operate on fuels already available in the Australian market. Some lean burn GDI engines require 10 ppm sulfur (Euro 5) PULP to operate. However, this technology is only used in the very small, high performance, luxury segment of the vehicle market, so production and distribution of a boutique fuel for such a small market segment is not commercially viable. Lean burn technologies are no longer produced in Japan and are expected to be largely phased out in Europe by No further major adjustments to Australian fuel quality standards are required to meet identified technology facilitation, urban air quality or climate change emission reduction objectives. Given the absence of vehicle operability issues and the limited environmental benefits from further changes to Australian fuel standards for petrol and diesel, any proposals for changes to these fuel standards must: be based on a sound and thorough evaluation of the scientific and economic basis for such change account for the long lead times required to make the necessary engineering changes to refineries. Asian fuel standards Petrol regulatory outlook for the Asia Pacific region Japan E5 Hong Kong E4 E5 Singapore Country specific E4 E5 Australia E4 PULP NZ E4 Malaysia E2 E4 Thailand E2 E4 China E3/E4 E4/E5 India E3 E3/E4 Indonesia E2 Diesel regulatory outlook for the Asia Pacific region Japan E5 Hong Kong E5 Singapore E4 E5 Australia E5 NZ E5 India E3/E4 Malaysia E2 E4 Thailand E3 E4 China E3/E4 E4/E5 Indonesia E2 E3 Countries in the Asian region are mandating cleaner fuels on different timelines. A key driver in a number of cases, particularly China, has been a desire by governments to begin to address extreme urban air quality problems. As demand for higher quality fuels has increased, refineries in the region are now producing these fuels as standard products rather than as boutique fuels for specific markets. This has resulted in increased availability of the cleaner fuels. Euro standards (E2, E3, E4, E5) relate mainly to the reduction of sulfur in petrol and diesel, although they also set standards for other product parameters such as benzene and other aromatics, olefins, cetane, density, lead and oxygen. For sulfur levels in petrol: E2 sets the limit at 500 ppm, E3 at 150 ppm, E4 at 50 ppm and E5 at 10 ppm. For sulfur levels in diesel: E2 sets the limit at 500 ppm, E3 at 350 ppm, E4 at 50 ppm and E5 at 10 ppm.
14 14 Biofuels and alternative fuels Key messages AIP member companies supply most of the blended biofuels and alternative fuels used in Australia. AIP strongly supports market-based approaches to the supply of all fuels in Australia. Biofuels and alternative fuels will have a place in a diversified Australian fuels market as long as they are clearly: available at a competitive price reliably supplied acceptable to consumers produced sustainably. Government policies supporting production and use of renewable and alternative fuels in Australia include fuel excise exemptions, direct production subsidies, technology facilitation grants, ethanol mandates and market facilitation support. In AIP s view, government policies in support of biofuels and alternative fuels must be: transparent, with clear, credible and tested objectives applied equitably to all industry participants stable, with clear timeframes for withdrawal of support based on sound science cognisant of other policy settings and commercial practice. Biofuels and alternative fuels that are used in Australia include: biodiesel and biodiesel blends ethanol blends in petrol up to 10 per cent high ethanol content fuel (up to 85 per cent) liquefied petroleum gas (LPG) compressed natural gas (CNG) liquefied natural gas (LNG). AIP members are contributing to efforts to overcome the challenges that biofuels and alternative fuels face in progressing to a fully sustainable market position. Ethanol blend fuels The majority of the fuel ethanol supplied by the three Australian producers was sold in the NSW market as E10 blend petrol. Vehicle compatibility issues will continue to gradually disappear as the vehicle fleet is replaced and as marine and small engines are being adapted to use ethanol blend fuels. Appropriate storage tanks for ethanol blends are being installed at many service stations, and the distribution infrastructure in place is slowly expanding in major Australian markets. However, the small number of ethanol producers, combined with the excise on imported ethanol, means the ethanol supply chain in Australia remains exposed to the impact of drought and floods on raw material production. Any proposal for mandating the inclusion of ethanol in premium unleaded petrol (PULP) will exacerbate distribution issues, reduce competition between proprietary brands, and further remove choice for consumers who do not wish to use or cannot use ethanol blends. Biodiesel blends The fuel standards framework (which allows up to 5 per cent in diesel and 20 per cent in business applications) is being revised to facilitate market development of biodiesel blends, but more consistent advice and endorsement is needed from automobile, truck and heavy vehicle manufacturers on the suitability of biodiesel for use in vehicles. Assurance of quality and sustainability of biodiesel production is being addressed by biodiesel producers and suppliers. LNG and CNG The LNG and CNG refuelling infrastructure is slowly expanding to support growth in the market coming from the progressive introduction of compatible vehicles. AIP supports the use of transparent financial incentives (excise concessions, production grants and technology and market facilitation grants) to facilitate and encourage the use of biofuels and alternative fuels in Australia provided those incentives are either: short-term and aimed at offsetting some of the up-front capital costs associated with bringing the fuel or the fuel use technology to the market or ongoing but solely aimed at recognising significant and demonstrated environmental benefits of the fuels compared to the current environmental performance of mainstream fuels. In this context, AIP supports the policy of successive governments of fuel excise neutrality based on the relative energy content of the individual fuels. However, in principle, AIP does not support mandates requiring the use of any particular fuel as a way of increasing the demand for that fuel. While AIP members will work to comply with the requirements of the NSW biofuels mandate, AIP believes mandates for biofuels that may help to increase short-term consumer demand must be designed so that they enable a normal and competitive market to develop in the medium to longer term for those fuels. Fuel mandates imply higher cost fuels, reduce market transparency for fuel suppliers and consumers, limit price competition and associated innovation, and fail to encourage the development of robust and reliable fuel supplies. AIP will continue to work with governments to ensure that the barriers to greater market uptake of biofuels and alternative fuels are fully understood and will promote sound approaches to policy design to overcome market barriers while avoiding unintended consequences. In particular, AIP will work with governments to ensure that policy and regulatory compliance regimes are credible, predictable and equitable for all fuel suppliers.


15 Reducing greenhouse gas emissions 15 Key messages Climate change presents a significant risk to the environment, and therefore to the economy and society. AIP member companies support actions to advance climate science to improve understanding and reduce the risks from future impacts. AIP member companies support a broad-based national approach to encourage GHG emissions abatement. Pathways to reduce emissions from production and use of liquid fuels include improved energy and vehicle efficiency, development and deployment of innovative technologies, and improved driver practices. Policy decisions must be based on sound scientific and economic analyses that recognise the risks, costs and benefits to society and the economy, as well as to the downstream petroleum industry. The future viability of Australian refineries, which contribute to Australia s energy security, will be dependent on maintaining the international competitiveness of Australian refined products. The Direct Action Plan The Australian Government s Direct Action Plan aims to establish a market driven framework for greenhouse gas abatement. The plan covers the main greenhouse gases, and provides financial support for least cost actions to abate emissions across the Australian economy. Measures will be included to safeguard the abatement mechanism and provide incentives for businesses not to exceed their historical emissions baselines. As capital and energy intensive operations, Australian refineries continuously seek ways to improve operational and energy efficiency. As new opportunities are identified and projects developed, these will be assessed for their potential to compete for support from the Emissions Reduction Fund. Typical projects might include butane capture and improved boiler efficiency. More significant abatement opportunities may arise during major maintenance activities or the design of new, replacement units at refineries. Petroleum refineries expect to compete for financial support available for abatement activities. AIP member companies will continue to work closely with the Australian Government on the downstream petroleum sector aspects of the Direct Action Plan. A key consideration is the ongoing competitiveness and viability of Australian refineries and Australia s future fuel supply security. Impact of carbon prices on refineries The baseline compliance measures in the Emissions Reduction Fund have the potential to increase direct and indirect petroleum refining costs in Australia. Australian petroleum refineries are energy intensive operations with significant variations in energy use and hence greenhouse gas emissions from year to year. To help maintain Australian refinery competitiveness, any assessment of emissions above a business as usual (BAU) baseline must take account of variations in refinery operations, and hence emissions, due to: changing market requirements and any disruption in refinery operations regular and ad hoc refinery maintenance refinery upgrades or changes flowing from regulatory actions by federal, state or local governments. Since almost all liquid fuels imported into Australia come from countries which are unlikely to impose a carbon price on their refinery operations over the next decade, Australian refiners will be placed at an increasing commercial disadvantage to their overseas competitors if they become subject to excess emissions charges. As verified by the ACCC, import parity pricing of liquid fuels in Australia means that there is little scope to recover these additional costs from consumers, hence industry profits will be impacted.
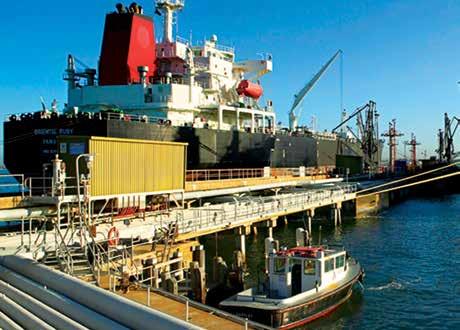
16 16 Maintaining supply security and reliability Key messages Australia s longer-term fuel supply security and transport energy needs will best be met through market measures including: open crude oil and fuels markets competitive, market determined prices clear investment and market signals flexible and resilient supply chains efficient supply management diversity of crude oil and liquid fuel sources competitive and viable domestic refineries policy and competitive neutrality between transport fuels improved vehicle technologies reliable, clean and high quality fuels acceptable to consumers. AIP considers that these conditions exist now for liquid fuels. Therefore the imperative for governments is to maintain or further strengthen these market features. Supply security Australian liquid fuels supply is highly secure, competitively priced and reliable because of: established and effective integration into the rapidly growing Asian fuels market a diversity of supply sources for crude oil and petroleum products, including domestic and imported sources a flexible, resilient and reliable supply chain, including secure shipping routes and a significant volume of stock on the water owned by local companies a domestic refining capability providing multiple supply options and the ability to convert domestic and imported crude oil into useable products actual and planned import, storage and distribution infrastructure which is able to meet growth in fuel demand a strong record of efficient and reliable supply and supply chain management by industry robust risk and emergency management by industry and government. The fuels supply chain TOTAL SUPPLY Imported cargo Refinery production Bulk fuel terminal storage WHOLESALE These market features have been confirmed in successive government and independent reviews of liquid fuel supply security over many years, and Australia s secure position is not expected to change in the coming years. Australia will continue to be able to access crude oil to meet its refining needs as well as imported petroleum products for customers as long as we support efficient and open global markets and pay prevailing international market prices. The industry has well established and reliable access to crude oil and petroleum product supplies from across the region and beyond. Current and forecast excess product in the region supports this ready availability of supplies suitable for Australian needs. Australia s market based approach has delivered secure, reliable and competitive liquid fuel supplies which meet the operational requirements of consumers and major fuel users. A continuation of this market-based approach, complemented by a stable policy and investment environment, will encourage the ongoing significant investment needed in supply infrastructure to meet growing fuel demand in Australia. Mining, farmers and commercial users Direct delivery to company and franchisee retail sites Independent branded distributors Company owned distributors Company owned distributors RETAIL Company operated and franchisee sites Independent branded sites Independent sites Retail customers for further information Imported cargo Bulk fuel terminal storage Direct delivery to company and franchisee retail sites Mining, farmers and commercial users Company operated and franchisee sites
17 17 Supply reliability Australia is well serviced by a reliable and diverse supply chain that delivers a high level of reliability by global standards. The supply chain includes crude oil and petroleum product shipments into and around Australia, refinery throughput, bulk fuel storage tanks, extensive terminal and distribution networks, around 6300 retail outlets, and substantial fuel storage facilities of major fuel users. There are strong business pressures on refiners and fuel suppliers to maintain resilient and efficient supply chains, since this is essential to minimise costs, and to maintain or increase sales through a reputation for reliable supply. To maximise the benefits of increased shipping volumes to Australia, new and expanded import and storage facilities have been built over recent years and more are under construction or planned. This infrastructure has been independently assessed as being able to meet Australia s future fuel supply needs. Independent analysis has confirmed current industry stockholdings and their management reflect a sound commercial assessment of likely operating conditions and disruption risks. Commercial stock holdings are keeping pace with increases and changes in fuel demand and planned terminal and storage capacity takes account of expected growth and changes in fuel demand. Any increase in stockholding levels beyond commercial levels would place significant additional costs on the supply system that unless government funded would be passed on to consumers. Managing supply disruptions Unplanned events can create fuel supply challenges at short notice including unplanned refinery disruptions, breakdowns in key supply infrastructure or pipelines, delays in ship arrivals, natural disasters, and customer demand exceeding contracted supply requirements. The impact of supply disruptions is rarely felt by consumers, as refiners and major fuel suppliers are adept at managing these issues as part of normal operations. Rapid and comprehensive industry response strategies are in place to address or replace any lost supply, including: numerous in-refinery technical options utilising alternative supply infrastructure and supply and distribution routes sourcing supplies from other Australian refiners and fuel wholesalers sourcing supplies from international sources and the spot market equitably allocating bulk fuel to customers drawing down industry stockholdings. All fuel consumers, particularly large fuel users supporting the economy, are expected to have plans to manage the impact of a fuel supply disruption on their operations.. Emergency supply management Industry and governments recognise the potential impacts of a severe national shortage of fuel supplies to business and consumers. Australia has robust response plans for managing a national liquid fuel emergency, which reflect Australian market characteristics, utilise proven market and commercial response mechanisms, and adopt international approaches that will be effective in our operating environment. While every effort is made by industry to ensure continuing reliable supply, the National Oil Supplies Emergency Committee (NOSEC) and the International Energy Agency (IEA) have established management plans that would help ensure a coordinated response to any supply emergency at a national or international level. According to the IEA, Australia is well served by an industry which operates a resilient and diversified supply chain, supported by a regime of policy and regulatory emergency measures, regular in-depth vulnerability assessments, and international advocacy of open global markets.. Supply line: stocks as days consumption cover AVERAGE NUMBER OF DAYS days 5 days 2 days 10 days refinery + 7 days marketing terminal 3 days 3 days Stocks on water (at sea) Crude tanks at refineries Stocks processed in refinery Product stocks at terminals Service station stocks Retail customers
18 18 Maintaining supply security and reliability The complex network of shipping routes to and around Australia is secure and highly flexible. There are ships with crude oil or petroleum products constantly on the water along each supply route, with cargo discharges sequenced every few days in major Australian ports and demand centres. Supply flexibility With the key demand centres in the southeast of the country, most imported cargoes travel a considerable period of their voyages along the Australian coast and within Australian waters. The average time petroleum products are on the water is around 12 days, varying between 6 and 23 days. Shorter voyage times reflect both closer supply locations in the Asian region and direct importing into northern Australia. The bulk of crude oil demand is in the south-east of Australia. Petroleum product stock on the water and the ready availability of petroleum tankers have proven to be very valuable for responding in a flexible and timely way to unplanned supply disruptions at particular locations in Australia. In the event of an Australian supply disruption, petroleum product cargoes at sea can be redirected by Australian companies to Australian ports to help manage the disruption. Ship discharges can be planned to ensure land-based stockholdings can be fully utilised to provide a buffer against supply disruptions and to minimise the severity of disruptions. This buffer provides time for major fuel suppliers to make decisions about how best to respond to any disruption. Supply availability Independent and government reviews have concluded that supply from overseas suppliers of refined petroleum products is considered extremely reliable. The geopolitical risks of sourcing crude oil and petroleum products from foreign countries are sometimes claimed as vulnerabilities in Australia s liquid fuels supply chain. However, international events that impact on crude oil and petroleum product markets will generally be felt by all countries, so Australia is unlikely to be placed at a supply or competitive disadvantage. Further, past instances of geopolitical instability, civil unrest and war have had a relatively small impact on global crude oil flows and have not had a major impact on the reliability of supplies to Australia. Supply diversity clearly plays a key role in managing and mitigating such risks to Australia. Australia s access to diverse supply sources and well established and flexible international and domestic supply networks suggests that any future disruption risks are unlikely to compromise Australia s access to physical supplies of liquid fuels. Australia s major import shipping routes: petroleum products South Korea Japan Middle East India days South-east Asia 6 days 6 days 12 days 13 days 13 days 8 days 14 days 12 days 15 days 15 days 14 days LPG 23 days 16 days 16 days

19 19 Stock on water: a critical part of the Australian supply chain Over the last decade, the growing volume and frequency of petroleum products imported into Australia have increased domestic supply reliability. The growing and changing demand for particular liquid fuels, coupled with the closure of a number of Australian refineries, has driven the increase in petroleum product imports. As a result, Australia now has a significant proportion of petroleum stock on the water from various source locations, particularly from Asia. About 2 3 weeks of Australian supply is typically on the water at any time, with a large proportion of this stock in Australian waters. This is some 30 per cent of all stock owned by AIP member companies. The Asian and Australian liquid fuels markets are dominated by term supply contracts to ensure known, secure and reliable supply, and these contracts ensure cargoes are delivered as planned. Consequently, as part of these normal commercial transactions, Australian companies have an ownership interest over the majority of stock on the water and generally take ownership (title) to their crude oil and petroleum product cargoes at the port where it is loaded onto the ship for transport to Australia. This stock is securely intended only for the Australian market in contrast to the European market where cargoes may be directed to any number of countries. Major changes to voyages once ships with an Australian cargo leave an Asian port are very rare, and are constrained by: expensive increases in freight rates for redirection of ships to another country limited opportunities for short term (or spot market) trading in the regional market different product specifications across the region restrictions in commercial contracts. The significant volume and wide distribution of cargoes of crude oil and petroleum products on the water serves as floating storage which provides a diverse and flexible source of supply. It also provides an efficient and cost effective logistical and storage solution, which is now fundamental to managing ongoing reliable supply of liquid fuels to Australian markets and customers. The highest level of fuel supply flexibility and reliability is achieved when stock on water can be readily diverted between Australian locations on an as needs basis. Shipping security assessments Independent assessments have found that shipping lanes to Australia are secure, supported by an ongoing military presence in key shipping lanes. While security of sea lanes from piracy and military action is a risk to be managed, it is not considered a critical risk by market experts. International cooperation to reduce the risk of piracy and terrorism has increased in Asia and the security of the Strait of Hormuz is closely monitored. While the Mallacca Strait handles a significant proportion of shipments to Australia, there are established alternative routes available (e.g. Sunda and Lombock Straits) if a major shipping route were threatened. Such alternatives would only increase costs due to additional sailing times. The IEA has reported that acts of piracy against crude oil tankers in the region have had no material impact on the regional oil market, as there was no ongoing disruption to the shipping lane or to market, trading and freight activity.
20 20 The international crude oil and product markets Key factors influencing oil prices Short and longer term changes in regional and global supply balances. Major supply disruptions from natural disasters, war, civil unrest/strikes. Seasonal demand and demand spikes. Inventory management. Shipping availability and freight rates. Market trading activities and strategies. Short term decisions of oil producing countries, National Oil Companies (NOCs) and nations holding strategic reserves. Changes in economic conditions/ sentiment. New oil discoveries. Investment in new oil production and refining capacity. Future global demand and supply balances. Population growth. Longer term global economic growth and short term conditions. Costs of oil production and refining. Technological progress. Long term policies of NOCs and oil producing nations. Regulation and government policy. International prices The price of fuel in Australia is dependent on world market prices. Crude oil, petrol, diesel and jet fuel are bought and sold in their own markets. Each market is regionally based. There are linkages and transactions between regional markets to balance global demand and supply. Prices in regional markets can be volatile and can move in different directions from each other. This can be due to the impact of factors and events unique to one market or all markets globally. Australia s regional market for petroleum products is the Asian market. Supplies of crude oil and petroleum products are sold internationally and domestically Major events impacting on crude oil prices: tapis crude oil: cents per litre (A$) Iraq War Hurricanes Dennis, Rita and Katrina in the Gulf of Mexico The steep increase in the crude oil price in 2007 and 2008 reflected the significant increase in global demand from economic growth in China and India, and global supply not keeping pace with this demand. The Global Financial Crisis subsequently led to demand destruction in many key markets and a significant fall in crude oil prices over 2008 and into Since then the recovery of demand growth, largely in Asia, together with a range of supply disruptions (e.g. civil war and unrest in the Middle East and natural disasters) and ongoing market and economic uncertainty, has contributed to higher market prices for crude oil in recent years. Petrol price trends Rapidly rising demand in China and India and tight supply These charts provide a snapshot of the movements over the period in the key market prices relevant to the price of petrol in Australia. crude oil price (tapis) singapore petrol price (mops95) mops95 plus shipping and taxes australian terminal gate price (tgp) australian pump price gross margin period average through a variety of term contract arrangements and in spot transactions. Crude oil and petroleum products are also traded on futures markets like NYMEX and ICE. Price benchmarks or markers for crude oil and petroleum products provide convenient indicators of what is happening with prices in specific markets. Information on changes in the prices of these markers is extensively reported on a daily basis. Australia s benchmark prices Tapis and Dated Brent crude oil, MOPS95 petrol and Gasoil 10 ppm sulphur diesel are quoted daily by the independent monitoring agency, Platts, based on transactions in the Singapore market on a given day. The margin shown in these charts is the difference between two market prices or benchmarks and is used to highlight trends within a specific market or market segment. It is a 5 0 gross margin and does not represent profits in the market nor take account of the range of relevant costs. -5 January 2011 December Global financial crisis and recessions (and reduced demand) Supply disruptions from natural disasters in Japan, civil war and unrest in Libya and the Middle East Ongoing supply disruption and global market and economic uncertainty International market trends: cents per litre (A$)

21 21 The Singapore to wholesale price lag Generally there is a time lag of one to two weeks between changes in international (Singapore) prices and changes in Australian wholesale prices. The link between international and Australian prices The ACCC has verified that there is a close relationship between international fuel prices and Australian wholesale and retail fuel prices. To meet Australian demand, around 40 per cent of fuel is imported, mostly from Asia and particularly Singapore. Singapore is the regional refining, distribution and trading centre and among the world s largest. Singapore prices are the key pricing benchmarks for Australia because this represents the competitive alternative for supply to Australia. Benchmark prices are adjusted by a commercially negotiated quality premium that reflects Australian fuel standards. Growth in demand for fuel in Australia will continue to be largely met by imports, further strengthening the price relationship with Singapore fuel prices. Australian refiners must price their fuel products to be competitive with fuel imports from Asia called import parity pricing (IPP). If Australian fuel prices were below Singapore prices, Australian fuel suppliers would have no commercial incentive to import the fuel needed here because sales of that fuel would incur losses. In addition, Australian refiners would have an incentive to export production. As the Singapore benchmark prices for fuel are quoted in US$ per barrel terms, their price in Australian dollar terms also reflects movements in the US$/A$ exchange rate. This means that exchange rate movements can offset or magnify changes in Singapore fuel prices. The Singapore market price for fuel, shipping costs and the exchange rate called the refined product cost plus Australian taxes represent over 90 per cent of the retail price of fuel in Australia. Overall market and fuel price transparency in Australia is assisted by data published by AIP and member companies. The ACCC also monitors fuel prices in Australia and publishes a report annually. Importantly, this time lag occurs whether prices are going up (when the lag slows price rises to consumers) or prices are going down (when the lag delays price falls). The lag is a result of using a rolling average of Singapore prices as part of the wholesale pricing methodologies of companies very similar to that used by the ACCC when wholesale prices were government regulated. According to the ACCC, this time lag can be longer during times of significant volatility in international prices. Wholesale market trends: cents per litre (A$) January 2011 December 2013 Retail market trends: cents per litre (A$) January 2011 December 2013 for further information
22 22 The Australian wholesale fuels market and prices Key messages Australian wholesale fuel prices are transparent and linked to international prices. Around 95 per cent of the wholesale fuel price is refined product cost plus taxes. There is significant wholesale market competition in Australia. There is competition for bulk fuel supply both into terminal and ex-terminal to wholesalers, resellers, retailers and other major fuel users. The underlying pricing approaches in bulk fuel contracts and TGP transactions are generally the same for all wholesale customers. Changing market shares and profitability of major fuel suppliers over time, including refiner-marketers and independent suppliers, demonstrates a competitive market. Independent fuel importers and wholesalers now own the same import storage capacity for petrol as the major oil companies. Petrol imports by independent wholesalers have increased five-fold since (ACCC). for further information Wholesale fuel prices Australian wholesale fuel prices are closely linked to international prices through Import Parity Pricing (IPP). The IPP is the landed cost of refined fuel to import terminals around Australia and includes: the refinery benchmark price for fuel (e.g. for petrol MOPS95 petrol) the quality premium for specific Australian fuel standards freight exchange rate wharfage, insurance and loss. Terminal Gate Prices (TGPs or spot wholesale prices) typically include the IPP as well as wholesaling costs to store and handle the fuel once it arrives in Australia and prior to its distribution to the domestic market. TGPs also include taxes (fuel excise and GST) and a small wholesale profit margin. Wholesale price transparency in the Australian market is assisted by the regulated publication of TGPs for petrol and diesel by all AIP members. The ACCC has concluded that by virtue of its transparency and the fact that it represents a fuel-only charge, TGP is a useful benchmark for analysing wholesale prices. Import parity pricing (IPP) The ACCC has concluded that the IPP benchmark has a strong relationship with actual costs of fuel imports into Australia. ACCC analysis shows that the actual import costs paid by major fuel suppliers have closely followed the IPP over the past three years, with the difference averaging around 1 cent per litre. With imports providing the marginal source of supply and with prices set according to IPP, the ACCC considers Australian refiners (and suppliers) have little scope to pass on costs that are out of line with international best practice. Average wholesale prices paid versus Average Terminal Gate Prices (TGP): to ulp, cents per litre ACCC analysis shows wholesale prices paid by customers vary slightly from TGP. In , the average difference was 1 cent per litre. Differences are explained by volume discounts applying to contracted customers and large orders, or charges for additional services like delivery and branding. According to the ACCC, the average annual net profit for the wholesale sector over the last decade was 0.3 cents per litre for petrol and 1.7 cents per litre across all fuels. IPP versus import costs paid by wholesale fuel suppliers: to ulp, cents per litre July 2010 June 2013 Average wholesale price paid Average TGP source: accc 0 July 2010 June 2013 Import costs IPP source: accc
23 23 Facts about bulk fuel terminals The bulk fuels market in Australia is highly competitive and efficient, with diversified ownership and operation of bulk fuel terminals, and with prices and contracts being market determined. Bulk fuel terminals are large storage facilities from which fuel is distributed to wholesalers, retailers, distributors and large end-users. These may be import, refinery or marketing terminals, or depots. Terminals can be owned and/or operated by refinermarketers (including joint ventures), independent fuel importers, and independent terminal operators. Other parties may access terminals through: hosting arrangements to store and load product at the terminal (for a market-based usage charge on a spot or long-term basis) leasing of storage capacity (typically long-term agreements based on a commercial return on capital and operating costs). Import terminal ownership: Refiner marketers: Sole ownership 40 Joint venture 3 Independent 11 Total 54 source: accc For economic and cost efficiency reasons, refiners, major fuel suppliers and independents often buy bulk fuel from each other in markets where they do not own facilities or where they do not directly import through hosting arrangements. Terminal capacity and throughput are two key measures of terminal usage. The key determinants of terminal capacity are the operating conditions that apply at individual terminals and in the supply network, including the number and size of tanks, demand patterns, mode of supply and related infrastructure, shipping schedules, berth capacity and load-out facilities. Similarly, throughput depends on a range of factors such as demand patterns, shipping and delivery schedules and loading, storage and supply capacity. Petrol capacity and throughput: Capacity (ml) Throughput Turnover (ml) (times) Independently owned Refiner-marketer owned Australia source: accc Fuel sales into and out of terminals Contracts for sales of fuel into terminals, whether from domestic or international sources, are based on import parity pricing (IPP). Sales of fuel from terminals are negotiated on commercial terms mainly to contracted wholesale and retail customers, and are based on IPP. Terminal operators seek to recover the terminal s capital and operating costs including taxes and other charges. Discounts or premiums may apply to customers depending on the volume, contract term, and any branding or marketing support provided. Spot purchases occur at terminal gate prices (TGPs) which are also based on IPP. Import infrastructure adequacy and competition issues Australia s petroleum import and distribution infrastructure is a key component of the Australian fuel supply chain and is underpinned by considerable investment in new and existing facilities. Over a number of years, major independent and government reviews have concluded that: significant investment in new or expanded facilities has been occurring and more is under construction or planned there is spare capacity to meet future demand and import growth for fuels, particularly in some independently owned import terminals terminal operations and access arrangements do not impose a constraint to import competition or to investment in supply infrastructure. There is no regulated access for third parties to bulk fuel terminals and distribution infrastructure as there is significant spare capacity in the bulk fuels market. Access is readily available on commercial terms (through leasing, hosting and usage charges). Applying access regulation to this privately owned infrastructure would seriously reduce incentives to invest in new infrastructure and maintenance, and would increase the costs of fuel supply to business and consumers. Australia s future supply security would be impacted because more investment in terminals will be needed to meet future demand and a higher level of imports. AIP supports reforms to ensure that planning, approval and regulatory processes are efficient, timely and nationally consistent, so as to facilitate longer term investment in liquid fuels import, storage and distribution infrastructure. There is also an ongoing need for governments (and private port operators) to remove supply bottlenecks and to meet future expected growth in fuel imports and demand.
24 24 The Australian retail fuels market Key messages The retail fuel market is highly dynamic and competitive. Australian retail fuel prices are closely linked to international prices. Australia has among the lowest retail fuel prices in the OECD, providing the domestic economy with a competitive advantage. A majority of consumers utilise the retail petrol price cycle in capital cities to purchase heavily discounted fuel; ACCC analysis shows retail price movements around public holidays are similar to those at other times. Prices can vary greatly between regional towns due to their differing competitive and economic characteristics. Industry profits are a very small proportion of the retail price with profit over the last decade averaging 2 cents per litre of all fuels sold (ACCC). Major supermarkets and independent operators have the majority share of the Australian retail fuels market. for further information Prices and taxes In 2012 and 2013 Australia continued to have among the lowest retail petrol and diesel prices in the OECD. The ACCC considers that Australian retail fuel prices are highly competitive. Retail fuel prices apply to almost half of the fuel sold in Australia. The remainder of sales are under competitive tenders to commercial, industrial and agricultural buyers. The components of the national average retail petrol price highlight the small proportion of the final price received by fuel wholesalers and retailers. In , the tax component (GST and fuel excise) of the final price of petrol averaged about 36 per cent or 51 cents per litre. According to the ACCC, petrol industry costs are dominated by refined international benchmark prices and taxes. Petrol and diesel prices and taxes in OECD countries: june quarter 2013 petrol: cents per litre Turkey Norway Italy Netherlands Greece Denmark Sweden Belgium Germany Finland Portugal Ireland France United Kingdom Switzerland Hungary Spain Czech Republic Austria Korea New Zealand Poland Japan Australia Canada United States Mexico Retail petrol price components: national average cpl 0 cpl 11 cpl 51 cpl 79 cpl Payments to the Australian Government in 2012 (from fuel excise, GST on fuels and income tax) by AIP member companies were over $20 billion. Fuel excise (over $15 billion) provided around 4 per cent of taxation revenue to the Australian Government in diesel: cents per litre Wholesale/retail margin and freight 8% Government taxes 36% Refined product cost 56% source: accc Turkey Norway Sweden Italy United Kingdom Switzerland Ireland Belgium Finland Denmark Netherlands Portugal Hungary Greece Germany Czech Republic Poland Austria Spain France Korea Australia Japan Canada New Zealand United States Mexico pre-tax price taxes australian pre-tax price source: australian petroleum statistics, bree
 share has declined from 83 per cent to 35 per cent.")
25 25 The retail market Retail market share The supermarket alliances and independents account for around two-thirds of the retail petrol market. Since , the major oil companies (BP, Caltex, Mobil and Shell) share has declined from 83 per cent to 35 per cent. Petrol volume sold by brand: Woolworths 24% Coles Express 24% Independents 18% Caltex 18% BP 15% The retail business and operators Branded independents 34% Shell 2% source: accc The structure of the retail market continues to evolve. The number of retail sites has decreased from sites in 1970 to around 6300 in 2013, but the ACCC has concluded that consolidation of retail sites has plateaued since the mid 2000s. Most sites now sell larger volumes of fuel and rely more on convenience store sales. The major oil companies now directly own and operate only 10 per cent of retail sites across Australia. Who sets retail prices: Relative changes in retail prices Percentage change in retail prices: Urban transport fares Electricity Bread Health Services Beer Rent Takeaway and fast food Pharmaceuticals Fuel prices (excl. taxes) Milk Coffee, tea and cocoa Eggs CPI Retail fuel prices over the last 30 years source: abs data Since 1983, the increase in retail fuel prices paid by consumers (when fuel taxes are excluded) has been less than the increase in the CPI and less than the price increases for regular household consumables and services. cents per litre 120 Supermarkets 25% Independents 23% 30 Refiner marketers 10% Refiner franchisees and commission agents 9% source: accc nominal prices real prices source: abs data
26 26 Environment, health and safety Key messages AIP and its member companies are committed to safe and environmentally sound practice in their operations. AIP member companies in Australia share the general community concern for conservation of the environment, and seek to protect air, water and soil from contamination through their operations. In doing so, their aim is to: treat with care all materials that may cause pollution achieve a zero accident rate maintain open communications with governments and local communities support market mechanisms for conservation and wise use of our valuable energy resources. Some of the programs contributing to these objectives are the AMOSC oil spill response centre, the CRC CARE research program, the petroleum industry Health Watch program, and the lubricants waste management and recycling program. Health Watch For over 33 years AIP has sponsored an epidemiological study called Health Watch which tracks the health of over past and present employees of the Australian petroleum industry. Health Watch information is important in identifying factors that may be a health risk to industry employees and ways in which these risks may be addressed. Health Watch is an independent university-based research program, currently conducted by the Monash Centre for Occupational and Environmental Health, a leading international centre for epidemiological research at Monash University. Health Watch is highly valued by petroleum companies and their employees and is an internationally respected study. Recently the study was expanded to provide new employees in participating company worksites across Australia with the opportunity to join, which expanded the Health Watch cohort by employees. The study s findings are published in regular Health Watch reports. Overall, the reports have clearly and consistently shown that petroleum industry employees represented in Health Watch have better health than the general community. The latest Health Watch Report (14th) published in late 2013 builds on the results of the preceding thirteen reports in demonstrating that: the chance of developing most types of cancer is no different for men and women in this industry compared with other Australians the overall cancer death rates in the industry workforce are significantly (30%) lower than in the general Australian population the death rate is lower for men in all major disease categories: heart disease (25% lower), cancer (20% lower), respiratory disease (30% lower), diseases of the digestive system (40% lower) and external causes like accidents (40% lower) CRC CARE AIP is a foundation participant of the Cooperative Research Centre for Contamination Assessment and Remediation of the Environment (CRC CARE) which undertakes innovative, cutting edge research aimed at preventing, assessing and remediating contamination of soil, water and air. CRC CARE is delivering research outcomes that underpin policy development work, numerous technology patents and techniques, and extensive academic and industry training. the chances of dying or of getting cancer or heart disease are very similar no matter where Health Watch members worked, including refineries, terminal and distribution worksites and upstream production sites. However, three cancers among men prostate cancer, mesothelioma and melanoma are occurring at statistically significantly higher rates than in the general population, and will continue to be closely monitored: there are more cases of prostate cancer in Health Watch than expected, but death rates from prostate cancer are the same as the general population, suggesting early screening and treatment for this cancer there are 39 mesothelioma cases, largely in refinery workers who were hired before 1980 and some may have had asbestos exposure outside the petroleum industry there are higher rates of melanoma but this is not related to duration of employment which suggests it may not be associated with employment in the petroleum industry. Health Watch also analyses the powerful effects of lifestyle on the health of industry employees: it is estimated that smoking has played a part in about 40 per cent of the deaths among Health Watch members, but quitting smoking noticeably reduces the risks low to moderate drinkers have lower overall death rates than total abstainers, but heavy drinking (7+ drinks per day) remains associated with increased overall mortality. For more information on the 14th Health Watch Report see: AIP projects involve collaboration with environmental regulators to develop best practice, risk based approaches to remediation of soil and groundwater contaminated by hydrocarbons. Work is also underway to help harmonise the regulation of remediation activities across all Australian jurisdictions. It is expected that these efforts will lead to better results for Australian communities and least cost solutions for business.
27 27 Oil spill response Each of the companies involved in petroleum exploration and production, and in refining and distribution of petroleum products, has major programs in place to minimise the risk of a marine oil spill. Company personnel are also trained to respond to any oil spill so as to minimise any environmental impact. These company specific petroleum industry activities are supported and supplemented by the Australian Marine Oil Spill Centre (AMOSC), a wholly owned subsidiary of AIP, set up in AMOSC has offices at Geelong, Victoria and Fremantle, WA. AMOSC s primary roles are to: provide equipment and personnel on a 24-hour basis to support a major oil spill response maintain petroleum industry stockpiles of equipment for use in a response to a major oil spill maintain the Australian petroleum industry Subsea First Response Toolkit maintain and support petroleum industry capability to respond to oiled wildlife during an oil spill response coordinate Australian petroleum industry mutual aid arrangements for oil spill response train, accredit and maintain a substantial group of spill response personnel. AMOSC also provides a range of ancillary services and advice to the petroleum and shipping industries, and to governments in Australia and in the South Pacific region on: oil spill response plans selection and management of oil spill response equipment, including short term equipment hire operational and strategic advice on oil spill response matters access to international oil spill response providers and petroleum industry spill response networks. AMOSC forms a key part of the petroleum industry s commitment to support Australia s national oil spill response arrangements, as set out in Australia s National Plan for Maritime Environmental Emergencies, in petroleum industry obligations under the Environment Protection and Biodiversity Conservation legislation, and in requirements imposed on the petroleum industry by the National Offshore Petroleum Safety and Environmental Management Authority (NOPSEMA). AMOSC resources and services are also made available to Australian governments, through a memorandum of understanding with the Australian Maritime Safety Authority (AMSA), to support responses to oil spills from general shipping and other sources. AMOSC has provided substantial support to all major oil spill responses in the Australasian region for many years, including the Montara oil spill off the northwest of WA, the Pacific Adventurer and Shen Neng oil spills off Queensland, the Pasha Bulker incident at Newcastle, and the Rena oil spill in New Zealand. Waste management and recycling Lubricants are not completely consumed when used and result in waste oil that needs to be collected and recycled. AIP members have adopted a product stewardship role for their products and are actively supporting the collection and recycling of waste oil and its packaging. The Australian Government has introduced a product stewardship scheme for waste oil to support recycling, funded through an excise on sales of lubricants. AIP is also a signatory to the Australian Packaging Covenant. AIP on behalf of its member companies has established a collection and recycling program for used plastic oil containers across Australia. In 2013, over 430 collection sites were maintained by VIP Packaging for AIP, with around 500 tonnes of plastic being recycled into various industrial products. Fuel for Indigenous communities Since 2005 low aromatic petrol has been supplied to remote Indigenous communities and the regions surrounding those communities. Initially produced by BP as the first of its kind in the market place, the fuel is now available from all suppliers to the communities under the Australian Government Petrol Sniffing Prevention Program. Despite this action, petrol sniffing continues to be a major concern in remote Indigenous communities. AIP member companies continue to work closely with federal, state and territory governments to help tackle petrol sniffing in Indigenous communities.


28 Australian Institute of Petroleum Australian Institute of Petroleum Ltd Level 2, 24 Marcus Clarke Street Canberra act 2600 GPO Box 279, Canberra act 2601 abn t f w
DOWNSTREAM PETROLEUM 2017 DOWNSTREAM PETROLEUM
 DOWNSTREAM PETROLEUM International and Asian Refining The global refining industry is fundamentally changing as emerging and maturing trends re-shape the global supply and demand patterns for crude oil
DOWNSTREAM PETROLEUM 2017 DOWNSTREAM PETROLEUM
 DOWNSTREAM PETROLEUM Australian liquid fuel supply and demand KEY MESSAGES The Australian refining industry is a price taker in the Asian region, and there is a direct relationship between Australian and
The Australian Refining Industry: Meeting the Challenges
 Australian Institute of Petroleum Presentation to APFI Forum The Australian Refining Industry: Meeting the Challenges Nathan Dickens Deputy CEO 1 The Take-Away... while there are ongoing challenges and
1 DOWNSTREAM PETROLEUM 2017 DOWNSTREAM PETROLEUM
 1 DOWNSTREAM PETROLEUM 2017 DOWNSTREAM PETROLEUM CONTENTS AIP mission and objectives Message from the AIP Chairman Australian liquid fuel supply and demand International and Asian refining Financial performance
Australian Institute of Petroleum. Downstream Petroleum 2009
 Australian Institute of Petroleum Downstream Petroleum 2009 AIP mission and objectives AIP was formed in 1976 to promote effective dialogue between the oil industry, government and the community. It replaced
SUPPLY CHAIN PERSPECTIVE
 SUPPLY CHAIN PERSPECTIVE FUEL Overview Australia s economy is built on key industries that rely heavily on fuel consumption. This report deals with fuel as it is processed from crude oil to refined petroleum
Global Downstream Petroleum Outlook
 Global Downstream Petroleum Outlook Claude Mandil Executive Director International Energy Agency 3 rd OPEC International Seminar Vienna, 12 September 26 Spare Refinery Capacity Has Tightened 9 1% 85 95%
Energy Security of APEC Economies in a Changing Downstream Oil Environment
 IEEJ Feb. 2018 4th APEC OGSN Forum on 7 March 2018 Session2-2 Energy Security of APEC Economies in a Changing Downstream Oil Environment Takashi MATSUMOTO and Ichiro KUTANI Manager, Global Energy Group
OVERVIEW OF THE ASIAN FUEL MARKET
 OVERVIEW OF THE ASIAN FUEL MARKET THE EUROPEAN FUELS CONFERENCE 9 March 2011 Sunanda Banerjee European Fuel Oxygenates Association - www.efoa.eu Mission and Vision Working closely with fuel policymakers,
Australian Refining Industry. Meeting the Challenges. Refined petroleum product will continue to be a major global energy source.
 Australian Refining Industry Meeting the Challenges Slide: BP Kwinana Aerial Shot Refined petroleum product will continue to be a major global energy source. The performance of a refinery depends on its
DOWNSTREAM PETROLEUM 2017 DOWNSTREAM PETROLEUM
 DOWNSTREAM PETROLEUM Economic Contribution of the Industry KEY MESSAGES Australian refineries have been very long standing participants in the local market as the major transport fuel suppliers, with all
TOWARDS LOW SULPHUR FUELS ECOWAS/ARA ROADMAP
 TOWARDS LOW SULPHUR FUELS - ECOWAS/ARA ROADMAP Engr Tony Ogbuigwe ECOWAS Regional Advisor to African Refiners Association Accra, Ghana 31 st October 2016 Presentation outline World refining environment
FACTS ABOUT DIESEL PRICES & THE AUSTRALIAN FUEL MARKET
 FACTS ABOUT DIESEL PRICES & THE AUSTRALIAN FUEL MARKET INTERNATIONAL PRICES & INFLUENCES Crude oil, diesel and petrol are different products and are bought/sold in their own markets. Each market is typically
Submission to the Inquiry into Australia s Oil Refinery Industry
 Submission to the Inquiry into Australia s Oil Refinery Industry Submission to: House of Representatives Standing Committee on Economics November 2012 Australian Institute of Petroleum Ltd t: +61 2 6247
Submission to the Department of Foreign Affairs and Trade s Asian century country strategies
 Submission to the Department of Foreign Affairs and Trade s Asian century country strategies Federal Chamber of Automotive Industries Level 1, 59 Wentworth Avenue Canberra ACT 2604 Phone: +61 2 6247 3811
Downstream & Chemicals
 Downstream & Chemicals Pierre Breber Executive Vice President 017 Chevron Corporation Downstream portfolio Fuels refining & marketing Integrated value chains Lubricants & additives Globally positioned
Fuel Quality Issues and Developments in Asia
 Fuel Quality Issues and Developments in Asia Liisa Kiuru Director, Asia International Fuel Quality Center www.ifqc.org 1 International Fuel Quality Center 2 Situation in Each Country Varies Emissions WHO/Kyoto
Abstract Process Economics Program Report 222 PETROLEUM INDUSTRY OUTLOOK (July 1999)
") Abstract Process Economics Program Report 222 PETROLEUM INDUSTRY OUTLOOK (July 1999) Global energy demand is rising, with fossil fuels oil, natural gas, and coal continuing to provide more than 90% of
Abstract Process Economics Program Report 222 PETROLEUM INDUSTRY OUTLOOK (July 1999) Global energy demand is rising, with fossil fuels oil, natural gas, and coal continuing to provide more than 90% of
Downstream & Chemicals
 Downstream & Chemicals Mark Nelson Executive Vice President Downstream & chemicals portfolio Fuels refining & marketing Focused, regional optimization Petrochemicals Advantaged feed, scale and technology
Alternative Fuel Policy A Changing landscape. Gavin Hughes CEO Biofuels Association of Australia
 Alternative Fuel Policy A Changing landscape Gavin Hughes CEO Biofuels Association of Australia Add name of presentation here on Slide Master Who are the BAA and what do we do? The Biofuels Association
Welcome and Introduction June 2007
 OVERVIEW Welcome and Introduction June 2007 Dear Subscriber, APAC Biofuels Consultants - a joint venture of EnergyQuest and Ecco Consulting - are pleased to present Australian Biofuel Projects 2007. This
Ethanol-blended Fuels Policy
 November 2016 Ethanol-blended Fuels Policy Ethanol-blended fuels, a blend of mineral petrol and ethanol, have been available in Australia for more than 10 years. The most common ethanol-blended fuel is
The Global Downstream Market
 The Global Downstream Market ANIMP Add. 2 1 The global picture The market is a challenging one for many refiners, but the picture is varied, region by region Significant capacity expansion is expected
Week ending 13 January Sunday, 13 January 2019.
 Week ending 13 January 2019 Sunday, 13 January 2019. 1 The Australian Fuel Market - An Overall Snapshot Understanding Movements in Key Diesel Price Indicators The Chart below provides an overall snapshot
Week ending 6 January Sunday, 6 January 2019.
 Week ending 6 January 2019 Sunday, 6 January 2019. 1 The Australian Fuel Market - An Overall Snapshot Understanding Movements in Key Diesel Price Indicators The Chart below provides an overall snapshot
VTTI. Storage Markets : Our Perspective. StocExpo Europe March Onur Capan: Market Intelligence
 VTTI Storage Markets : Our Perspective Onur Capan: Market Intelligence StocExpo Europe March 2017 VTTI track record at its 10 th anniversary VTTI has grown in 10 years to be one of the largest global independent
Who prices petrol? Why petrol costs are not a corporate conspiracy. Formula for success: rise early, work hard, strike oil
 I n s T i t u t e o f P u b l i c A f f a i r s March 2008 www.ipa.org.au Vol 47. Number 1 Who prices petrol? Why petrol costs are not a corporate conspiracy No retail product draws as much scrutiny as
Week ending 5 August Sunday, 5 August 2018.
 Week ending 5 August 2018 Sunday, 5 August 2018. 1 The Australian Fuel Market - An Overall Snapshot Understanding Movements in Key Diesel Price Indicators The Chart below provides an overall snapshot of
U.S. Ethanol Ready For The World Market
 U.S. Ethanol Ready For The World Market The United States has plenty of ethanol and is ready and willing to meet foreign market needs. As the U.S. Grains Council (USGC) works with its industry partners
Fuel Focus. Understanding Gasoline Markets in Canada and Economic Drivers Influencing Prices. Issue 24, Volume 8
 Fuel Focus Understanding Gasoline Markets in Canada and Economic Drivers Influencing Prices Issue 24, Volume 8 December, Copies of this publication may be obtained free of charge from: Natural Resources
Week ending 6 May Sunday, 6 May 2018.
 Week ending 6 May 2018 Sunday, 6 May 2018. 1 The Australian Fuel Market - An Overall Snapshot Understanding Movements in Key Diesel Price Indicators The Chart below provides an overall snapshot of movements
Week ending 4 February Sunday, 4 February 2018.
 Week ending 4 February 2018 Sunday, 4 February 2018. 1 The Australian Fuel Market - An Overall Snapshot Understanding Movements in Key Diesel Price Indicators The Chart below provides an overall snapshot
Oilseeds and Products
 Oilseeds and Products Oilseeds compete with major grains for area. As a result, weather impacts soybeans, rapeseed, and sunflowerseed similarly to the grain and other crops grown in the same regions. The
AN ECONOMIC ASSESSMENT OF THE INTERNATIONAL MARITIME ORGANIZATION SULPHUR REGULATIONS
 Study No. 175 CANADIAN ENERGY RESEARCH INSTITUTE AN ECONOMIC ASSESSMENT OF THE INTERNATIONAL MARITIME ORGANIZATION SULPHUR REGULATIONS ON MARKETS FOR CANADIAN CRUDE OIL Canadian Energy Research Institute
Caltex Australia comments on Carbon Pollution Reduction Scheme White Paper February 2009
 Caltex Australia comments on Carbon Pollution Reduction Scheme White Paper February 2009 Upstream Point of Liability - Fuel Tax Package Outline of scheme The Carbon Pollution Reduction Scheme (CPRS) White
The Biodiesel Leader. Renewable Energy Group, Inc. (888) REG /13_00k
 REG /13_00k") The Biodiesel Leader Renewable Energy Group, Inc. (888) REG-8686 www.regi.com Renewable Energy Group and REG are registered trademarks of Renewable Energy Group, Inc. BIOHEAT is a registered trademark
The Biodiesel Leader Renewable Energy Group, Inc. (888) REG-8686 www.regi.com Renewable Energy Group and REG are registered trademarks of Renewable Energy Group, Inc. BIOHEAT is a registered trademark
 Page 1 sur 5 17.03.2010 BMW Group plans sharp increase in group earnings Visible progress in 2010 towards profitability targets for 2012 Volume growth in solid single-digit percentage range targeted Munich.
Department of Energy Analyses in Support of the EPA Evaluation of Waivers of the Renewable Fuel Standard November 2012
 Department of Energy Analyses in Support of the EPA Evaluation of Waivers of the Renewable Fuel Standard November 2012 Ethanol Demand Curve for 2012 and 2013 In support of EPA analyses of the 2012 RFS
Please find attached a submission to the Senate Select Committee Inquiry on Fuel and Energy.
 Caltex Australia 2 Market Street Sydney NSW 2000 Tel: (02) 9250 5000 Fax: (02) 9250 5742 GPO Box 3916 Sydney NSW 2001 www.caltex.com.au 31 July 2009 Ms Naomi Blasser The Secretary Senate Select Committee
FACTS ABOUT PETROL PRICES & THE AUSTRALIAN FUEL MARKET
 FACTS ABOUT PETROL PRICES & THE AUSTRALIAN FUEL MARKET INTERNATIONAL PRICES Crude oil, petrol and diesel are different products and are bought and sold in their own markets. Each market is typically regionally-based
The Renewable Energy Market Investment Opportunities In Lithium. Prepared by: MAC Energy Research
 The Renewable Energy Market Investment Opportunities In Lithium Prepared by: MAC Energy Research 2016 Table of Contents: Introduction. Page 2 What is Lithium?... Page 2 Global Lithium Demand Page 3 Energy
CHEMSYSTEMS. Report Abstract. Petrochemical Market Dynamics Feedstocks
 CHEMSYSTEMS PPE PROGRAM Report Abstract Petrochemical Market Dynamics Feedstocks Petrochemical feedstocks industry overview, crude oil, natural gas, coal, biological hydrocarbons, olefins, aromatics, methane
Methodology. Supply. Demand
 Methodology Supply Demand Tipping the Scale 1 Overview Latin America and the Caribbean, a major petroleum product importing region, provides an important counterbalance to surpluses in refined product
Australia s Experience in Alternative Transport Fuels. An Overview
 Australia s Experience in Alternative Transport Fuels An Overview Main alternative transport fuels in use in Australia Automotive LPG (Autogas) 6% of transport need requirements by volume 5% by energy
Operational eco-efficiency in Refineries
 Operational eco-efficiency in Refineries CONTENTS BACKGROUND 3 STRATEGIC APPROACH 3 RELEVANCE TO STAKEHOLDERS 4 ACTIONS AND MEASURES 5 RESULTS ACHIEVED 5 RESULTS ACHIEVED 5 ECONOMIC IMPACTS 7 SOCIAL IMPACTS
Fuel Focus. Understanding Gasoline Markets in Canada and Economic Drivers Influencing Prices. Issue 20, Volume 8
 Fuel Focus Understanding Gasoline Markets in Canada and Economic Drivers Influencing Prices Issue 20, Volume 8 October 18, 2013 Copies of this publication may be obtained free of charge from: Natural Resources
The Petrochemical Industry From Middle Eastern Perspective?
 The Petrochemical Industry From Middle Eastern Perspective? Hydrocarbon Journey in Kuwait 1946 ENTERING CRUDE EXPORT MARKET 1949 FIRST REFINERY COMMISSIONED 1938 1 st COMMERCIAL OIL DISCOVERY 1963 AMMONIA
Japan s refining environment
 Japan s refining environment Platts Asian Refining Summit 3 March 2016, Singapore Yoshi Kobayashi The Institute of Energy Economics, Japan (IEEJ) Oil in Japan 2 Oil is the largest energy source for Japan
RNG Production for Vehicle Fuel. April 4, 2018
 RNG Production for Vehicle Fuel April 4, 2018 Forward-Looking Statements This presentation contains forward-looking statements within the meaning of Section 27A of the Securities Act of 1933 and Section
FISCAL YEAR ENDED MARCH 2011 FINANCIAL RESULTS
 FISCAL YEAR ENDED MARCH 211 FINANCIAL RESULTS Mazda Motor Corporation April 28, 211 Mazda MINAGI 1 PRESENTATION OUTLINE Highlights Fiscal Year Ended March 211 Results In Summary Question & Answer Session
FISCAL YEAR ENDING MARCH 2012 FIRST HALF FINANCIAL RESULTS
 FISCAL YEAR ENDING MARCH 2012 FIRST HALF FINANCIAL RESULTS Mazda Motor Corporation November 2, 2011 New Mazda CX-5 (European specifications) 1 PRESENTATION OUTLINE Highlights Fiscal Year Ending March 2012
Business Opportunities downstream. Hellenic Petroleum s perspective
 Business Opportunities downstream Hellenic Petroleum s perspective 9 th SE Europe Energy Dialogue Thessaloniki, Greece 29-30 June 2016 Daniil Antonopoulos Thessaloniki Refinery Operations Manager Hellenic
Submission to the Transport and Public Works Committee s inquiry into the operations of toll roads in Queensland
 9 August 2018 Mr Shane King MP Chair Transport and Public Works Committee Parliament House BRISBANE QLD 4000 Via email: tollroads@parliament.qld.gov.au Dear Mr King, RE: Submission to the Transport and
Senate Standing Committees on Economics 27 June 2014 PO Box 6100 Parliament House CANBERRA ACT 2600 By
 Senate Standing Committees on Economics 27 June 2014 PO Box 6100 Parliament House CANBERRA ACT 2600 By email: economics.sen@aph.gov.au Submission: Inquiry into Fuel Indexation (Road Funding) Bill 2014
SAPIA corporate profile
 SAPIA corporate profile SAPIA overview About SAPIA SAPIA is the voice of the South African petroleum industry. The association plays a strategic role in addressing a range of common issues relating to
SHALE-ADVANTAGED CHEMICAL INDUSTRY INVESTMENT
 9 April 2013 SHALE-ADVANTAGED CHEMICAL INDUSTRY INVESTMENT Martha Gilchrist Moore Sr. Director, Policy Analysis and Economics Shale Gas Shale gas is possibly the most important energy development in the
BMW Group posts record earnings for 2010
 10.03.2011 BMW Group posts record earnings for 2010 Profit before tax rises to euro 4,836 million Profit before financial result climbs to euro 5,094 million Automobiles segment reports EBIT of euro 4,355
Consumers, Vehicles and Energy Integration (CVEI) project
 project") Consumers, Vehicles and Energy Integration (CVEI) project Dr Stephen Skippon, Chief Technologist September 2016 Project aims To address the challenges involved in transitioning to a secure and sustainable
Consumers, Vehicles and Energy Integration (CVEI) project Dr Stephen Skippon, Chief Technologist September 2016 Project aims To address the challenges involved in transitioning to a secure and sustainable
A perspective on the refining industry. Platts European Refining Summit Brussels, 29 September2016 Kristine Petrosyan, International Energy Agency
 A perspective on the refining industry Platts European Refining Summit Brussels, 29 September2016 Kristine Petrosyan, International Energy Agency OECD/IEA 2016 mb/d European refiners: busy 2015 OECD Europe
Thank you, Chairman Shimkus and Ranking Member Tonko. I appreciate the opportunity to
 Thank you, Chairman Shimkus and Ranking Member Tonko. I appreciate the opportunity to testify today on behalf of the National Corn Growers Association (NCGA). NCGA represents nearly 40,000 dues-paying
Future Funding The sustainability of current transport revenue tools model and report November 2014
 Future Funding The sustainability of current transport revenue tools model and report November 214 Ensuring our transport system helps New Zealand thrive Future Funding: The sustainability of current transport
GEAR 2030 Working Group 1 Project Team 2 'Zero emission vehicles' DRAFT RECOMMENDATIONS
 GEAR 2030 Working Group 1 Project Team 2 'Zero emission vehicles' DRAFT RECOMMENDATIONS Introduction The EU Member States have committed to reducing greenhouse gas emissions by 80-95% by 2050 with an intermediate
IGE Business Model Presentation. FOYSON RESOURCES LIMITED EXTRAORDINARY GENERAL MEETING 31 st March 2015
 IGE Business Model Presentation FOYSON RESOURCES LIMITED EXTRAORDINARY GENERAL MEETING 31 st March 2015 The IGE Project Overview Development Status Australian Feedstock Supply IGE Solution IGE Technology
FISCAL YEAR MARCH 2014 FIRST HALF FINANCIAL RESULTS. New Mazda Axela (Overseas name: New Mazda3)
") FISCAL YEAR MARCH 2014 FIRST HALF FINANCIAL RESULTS New Mazda Axela (Overseas name: New Mazda3) Mazda Motor Corporation October 31, 2013 1 PRESENTATION OUTLINE Highlights Fiscal Year March 2014 First Half
FISCAL YEAR MARCH 2014 FIRST HALF FINANCIAL RESULTS New Mazda Axela (Overseas name: New Mazda3) Mazda Motor Corporation October 31, 2013 1 PRESENTATION OUTLINE Highlights Fiscal Year March 2014 First Half
New Ultra Low Sulfur Diesel fuel and new engines and vehicles with advanced emissions control systems offer significant air quality improvement.
 New Ultra Low Sulfur Diesel fuel and new engines and vehicles with advanced emissions control systems offer significant air quality improvement. The U.S. Environmental Protection Agency (EPA) has issued
Submission to Select Committee on Electric Vehicles - inquiry into the use and manufacture of electric vehicles in Australia
 31 July 2018 Senator Tim Storer Department of the Senate PO Box 6100 Parliament House Canberra ACT 2600 Dear Senator Storer, RE: Submission to Select Committee on Electric Vehicles - inquiry into the use
Implications Across the Supply Chain. Prepared for Sustainableshipping Conference San Francisco 30 September 2009
 Implications Across the Supply Chain Prepared for Sustainableshipping Conference San Francisco 30 September 2009 Agenda Residual Markets & Quality Refinery Bunker Production Supply & Pricing 2 World marine
Corporate Communications. Media Information 15 March 2011
 15 March 2011 BMW Group aims to further increase earnings in 2011 EBIT margin of over 8% expected in Automobiles segment Sales volume of well in excess of 1.5 million vehicles targeted Margin of 8% to
Biofuels Production to Reach B10 in 2012 and E10 in 2011
 THIS REPORT CONTAINS ASSESSMENTS OF COMMODITY AND TRADE ISSUES MADE BY USDA STAFF AND NOT NECESSARILY STATEMENTS OF OFFICIAL U.S. GOVERNMENT POLICY Required Report - public distribution Date: GAIN Report
US$82,814m. Total assets. US$3,403m. Net debt. By Sector # US$411m Property. US$157m Insurance broking & financial services.
 Jardine Matheson Group Profile 2018 Jardine Matheson Holdings Limited 2017 Financial Highlights * US$83,808m Gross revenue US$4,378m Underlying profit before tax + US$82,814m Total assets 444,000 People
Operating Refineries in a High Cost Environment. Options for RFS Compliance. March 20, Baker & O Brien, Inc. All rights reserved.
 Operating Refineries in a High Cost Environment Options for RFS Compliance March 2, 217 Baker & O Brien, Inc. All rights reserved. Discussion Points Introduction Renewable Fuels Standard (RFS) Overview
Australian Institute of Petroleum. Downstream Petroleum 2003
 Australian Institute of Petroleum Downstream Petroleum 2003 AIP mission and objectives AIP was formed in 1976 to promote effective dialogue between the oil industry, government and the community. It replaced
Response of the Road Haulage Association to Transport for London s Consultation. Changes to the Ultra Low Emission Zone and Low Emission Zone.
 Response of the Road Haulage Association to Transport for London s Consultation Changes to the Ultra Low Emission Zone and Low Emission Zone. Summary 27 Feb 2018 1. The London Mayor is consulting on changing
Downstream & Chemicals
 Downstream & Chemicals Pierre Breber Executive Vice President Profitable downstream & chemicals portfolio Fuels refining & marketing Focused, regional optimization Petrochemicals Advantaged feed, scale
Austria. Advanced Motor Fuels Statistics
 Austria Austria Drivers and Policies In December 2016, the national strategy framework Saubere Energie im Verkehr (Clean Energy in Transportation) 1 was introduced to the Ministerial Council by the Federal
The Malaysia Automotive Institute (MAI) is an agency under the Ministry of International Trade and Industry (MITI)
 is an agency under the Ministry of International Trade and Industry (MITI)") The Malaysia Automotive Institute (MAI) is an agency under the Ministry of International Trade and Industry (MITI) We are a think tank, tasked to strengthen the Malaysian automotive sector. An Intermediary
The Malaysia Automotive Institute (MAI) is an agency under the Ministry of International Trade and Industry (MITI) We are a think tank, tasked to strengthen the Malaysian automotive sector. An Intermediary
2003 fourth quarter and full-year results
 Dinesh Paliwal Member of Group Executive Committee, Head of Automation Technologies Division 2003 fourth quarter and full-year results Automation Technologies Copyright 2003 ABB. All rights reserved. -
Oilseeds and Products
 Oilseeds and Products Oilseeds compete with major grains for area. As a result, weather impacts soybeans, rapeseed, and sunflowerseed similarly to grain and other crops grown in the same regions. The same
Linu Mathew Philip. Centre for Trade and Development (Centad), New Delhi, India
, New Delhi, India") Linu Mathew Philip Centre for Trade and Development (Centad), New Delhi, India Regional Dialogue in Biofuels in Asia 9-10 November 2009 Relevance of Biofuel in the new context Trends Production Consumption
Linu Mathew Philip Centre for Trade and Development (Centad), New Delhi, India Regional Dialogue in Biofuels in Asia 9-10 November 2009 Relevance of Biofuel in the new context Trends Production Consumption
SABOA CONFERENCE : Availability and Price Trends of Fuel Over the Next 20 Years March
 SABOA CONFERENCE : Availability and Price Trends of Fuel Over the Next 20 Years 2015 March DISCLAIMER The information contained herein is of a general nature and not intended to be a detailed analysis
Technology and policy drivers of the fuel economy of new light-duty vehicles Comparative analysis across selected automotive markets
 Technology and policy drivers of the fuel economy of new light-duty vehicles Comparative analysis across selected automotive markets Pierpaolo Cazzola, International Energy Agency Content GFEI and the
I m Tetsuji Yamanishi, Corporate Officer at TDK. Thank you for taking the time to attend TDK s performance briefing for the fiscal year ended March
 I m Tetsuji Yamanishi, Corporate Officer at TDK. Thank you for taking the time to attend TDK s performance briefing for the fiscal year ended March 2016. I will be presenting an overview of our consolidated
Fuel Economy Policy Pathways for the ASEAN Region
 Fuel Economy Policy Pathways for the ASEAN Region Fuel economy standards in Asia Few Asian countries have fuel economy standards but growing over the years! Standards for passenger cars (LDV) are given
The Supply of Oil. Projections to Oil and the Macroeconomy in a Changing World Federal Reserve Bank of Boston June 9, 2010 Boston, MA
 The Supply of Oil Projections to 2035 Oil and the Macroeconomy in a Changing World Federal Reserve Bank of Boston June 9, 2010 Boston, MA Howard Gruenspecht, Deputy Administrator Near-term oil price uncertainty
Canada s Refining Industry Sector Performance Report
 Canada s Refining Industry 217 Sector Performance Report The Canadian Fuels Association represents the industry that produces, distributes and markets petroleum products in Canada including 95 percent
FISCAL YEAR MARCH 2015 FIRST HALF FINANCIAL RESULTS. New Mazda Demio
 FISCAL YEAR MARCH 2015 FIRST HALF FINANCIAL RESULTS New Mazda Demio Mazda Motor Corporation October 31, 2014 1 PRESENTATION OUTLINE Highlights Fiscal Year March 2015 First Half Results Fiscal Year March
2015 Interim Results Announcement
 China Petroleum & Chemical Corporation 2015 Interim Results Announcement August 27, 2015 Hong Kong Cautionary Statement This presentation and the presentation materials distributed herein include forward-looking
Road Transport Energy Demand and CO 2 Emissions in APEC Economies through 2040
 The 34 th edition of the International Energy Workshop (IEW) June 03 05, 2015, Abu Dhabi Road Transport Energy Demand and CO 2 Emissions in APEC Economies through 2040 Atit Tippichai Asia Pacific Energy
European Union follow-up A view from the industry
 5th EU Refining Forum, Brussels June 15, 2015 European Union follow-up A view from the industry Gianni Murano, ExxonMobil CEO of Esso Italiana, former refinery manager of Trecate refinery This presentation
Recent Developments in EU Refining and in the Supply and Trade of Petroleum Products
 Recent Developments in EU Refining and in the Supply and Trade of Petroleum Products Third Meeting of the EU Refining Forum Brussels, 22 May 2014 Toril Bosoni, International Energy Agency OECD/IEA 2014
Warring Neilsen Corporate Affairs Manager Elgas
 Warring Neilsen Corporate Affairs Manager Elgas Stimulating Growth thru Innovation To be successful in creating growth we need innovation thru partnerships and technology adaption. A clear strategy invest
FISCAL YEAR MARCH 2014 FINANCIAL RESULTS
 FISCAL YEAR MARCH 214 FINANCIAL RESULTS Mazda CX-5 Mazda Atenza Mazda Motor Corporation April 25, 214 New Mazda Axela 1 PRESENTATION OUTLINE Highlights Fiscal Year March 214 Results Fiscal Year March 215
I remind you that our presentation is available on our website. We can start from the first 2 slides that show Piaggio Group First
 CONFERENCE CALL 2009 1 st HALF RESULTS Good afternoon and welcome to everybody. I remind you that our presentation is available on our website. We can start from the first 2 slides that show Piaggio Group
IEA Analysis of Fossil-Fuel Subsidies for APEC
 211/SOM3/DIA/3 Session 2 IEA Analysis of Fossil-Fuel Subsidies for APEC Submitted by: IEA Policy Dialogue on Fossil Fuel Subsidy Reform San Francisco, United States 23 September 211 IEA analysis of fossil
PERSPECTIVES FOR THE BRAZILIAN REFINING INDUSTRY
 PERSPECTIVES FOR THE BRAZILIAN REFINING INDUSTRY Jorge Celestino Refining & Natural Gas Executive Director 24.10.2016 Transformations facing the oil industry Changes in the competitive scenario: shale
Financial Summary for 2Q-FY2017 And Projections for FY2017
 Financial Summary for 2Q-FY2017 And Projections for FY2017 1 INDEX 01 Financial Summary for 2Q-FY2017 02 Performance Forecast for FY2017 03 Topics 2 01 Financial Summary for 2Q-FY2017 3 01 Financial Summary
Downstream Petroleum Sector The Growing Prominence of Asian Refining
 Downstream Petroleum Sector The Growing Prominence of Asian Refining Mr. Fahad Al-Dihani Deputy CEO,MAA Refinery, Kuwait National Petroleum Company-Kuwait Outline.. Global refining trends Kuwait s Position
Q Analyst Teleconference. 9 August 2018
 9 August 218 Disclaimer This presentation contains forward-looking statements that reflect the Company management s current views with respect to certain future events. Although it is believed that the
OCTANE THE NEW ECONOMICS OF. What Drives the Cost of Octane and Why Octane Costs Have Risen Since 2012 T. J. HIGGINS. A Report By:
 THE NEW ECONOMICS OF OCTANE What Drives the Cost of Octane and Why Octane Costs Have Risen Since 2012 A Report By: T. J. HIGGINS Contents Foreword... 1 1. Executive Summary... 2 2. Tracking the Changing
AUTOGAS A GLOBAL OVERVIEW. Michael Treloar Elaflex Pacific Pty Ltd APFI Forum 6 th September th September 2018
 A GLOBAL OVERVIEW Michael Treloar Elaflex Pacific Pty Ltd APFI Forum 6 th September 2018 6 th September 2018 INTRODUCING 2 Elaflex Pacific Pty Ltd / 6 th September 2018 AGENDA AutoGas Demand Current global