West Coast and Alaska Marine Fuel Prices
|
|
|
- Todd Allen
- 5 years ago
- Views:
Transcription
 595-3100 voice * (503) 595-3232 fax")
1 West Coast and Alaska Marine Fuel Prices Annual Report Economic Fisheries Information Network Pacific States Marine Fisheries Commission 205 S.E. Spokane Street, Suite 100 Portland, OR * (503) voice * (503) fax
2 Marine Fuel Prices Table of Contents This document was created to assist users of marine fuel price data from the Economic Fisheries Information Network (EFIN) Website. It contains the following information: General Information Data Retrieval Location Contacts Sample Port Selection Method Selected Ports Changes Since Inception Fuel Suppliers Data Collection Date of Collection Price Data Collected Data Availability Variable Formats Data Charts for Alaska, Washington, Oregon & California State-Level Summary o 2018 State-Level Summary o 2017 State-Level Summary o 2016 State-Level Summary Regional-Level Summary for Alaska o 2018 Regional-Level Summary for Alaska o 2018 Southeast Alaska o 2018 Rest of Alaska Regional-Level Summary for Washington o 2018 Regional-Level Summary for Washington o 2018 Northern Washington o 2018 Puget Sound o 2018 Washington Coast Regional-Level Summary for Oregon o 2018 Regional-Level Summary for Oregon o 2018 All Oregon Regional-Level Summary for California o 2018 Regional-Level Summary for California o 2018 All California
3 General Information Data Retrieval Location Contacts This data was retrieved from the Pacific States Marine Fisheries Commission's EFIN Program at Please direct any questions, suggestions or other comments to: (503) Geana Tyler Project Manager Dave Colpo Sr. Program Manager
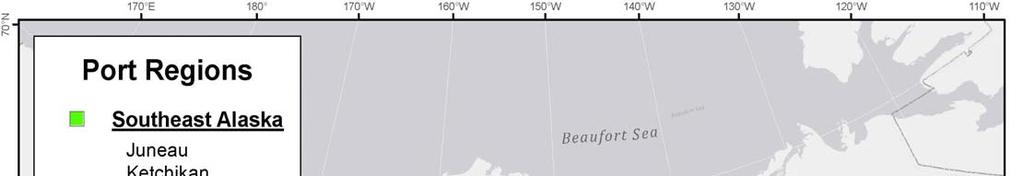
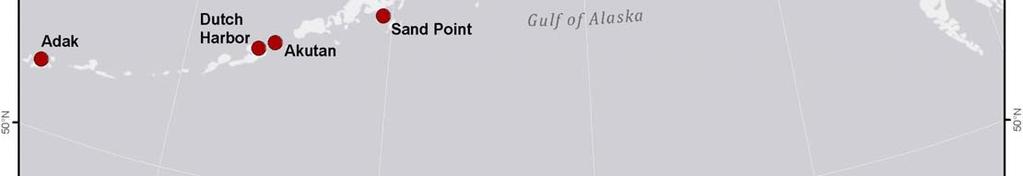
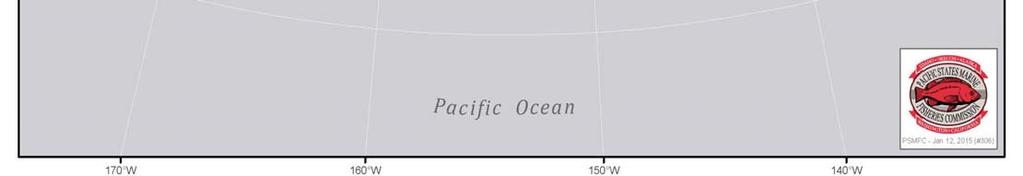
4 Sample Port Selection Method Alaska Originally, ports were selected out of discussions with Alaska Department of Fish and Game (ADF&G) and North Pacific Fishery Management Council (NPFMC) staff. The selected ports were chosen to include ports with significant revenue generation, and were broadly geographically representative of commercial fishing ports in Alaska. California/Oregon/Washington Ports in Washington, Oregon and California were selected if: The port meets at least one of the following: was included in the National Marine Fisheries Service (NMFS) Southwest Region's collection of fuel prices, which was suspended in 1994; or was one of the top 25 revenue generating ports * on the West Coast in 1997; or was one of the top 10 revenue generating ports * in the state in 1997; and has a fuel supplier and is identified by a single port in the PacFIN port codes (as opposed to a group of ports; e.g., OSF - Other San Francisco Ports) Changes since Inception Grouping Changes Astoria was grouped with N. Oregon 2001 Bay Area and Southern California were grouped together in 2004 Southern California was grouped into All California 2011 S. Oregon group was merged with All Oregon 2012 Seattle was grouped into Puget Sound 2014 Fuel Docks Added Fuel Docks Dropped Adak, Dillingham (AK) 2001 Terminal Island, Monterey Bay (CA) Willapa Bay (WA) 1999 Yakutat, Wrangell (AK) 2001 Coos Bay (OR) 2000 Brookings (OR) 2005 Princeton (CA) Port Orford, Brookings (OR) 2001 Tacoma, Seattle (WA) Tillamook (OR) 2006 St. Paul Island (AK) 2002 San Francisco (CA) 2013 Morro Bay, (CA) Astoria, Depot Bay (OR) 2003 Bodega Bay (CA) 2008 Brookings (OR) 2009 Fort Brag (CA) 2011 Gold Beach (OR) 2012 Tacoma (WA) 2013 Tillamook/Garibaldi (OR) 2014 Blaine (WA) & San Pedro (CA) 2016, Santa Barbara (CA) 2017 Port Townsend (WA) 2018 * Revenue generation figures are based on revenue data associated with all species from PacFIN on 30 Dec 98.
5
6
7 Fuel Suppliers At least one fuel supplier in each selected port was surveyed. Its Fuel Dock Identifier uniquely identifies each fuel supplier. This identifier was formed by using the three-letter Pacific Fisheries Information Network and Alaska Fisheries Information Network s (PacFIN/AKFIN) port code for the location of the fuel supplier followed by a sequential number. For example, KTN2 identifies the second fuel supplier surveyed in Ketchikan, AK and SEA4 identifies the fourth fuel supplier surveyed in Seattle, WA. A fuel supplier s identifier will remain unique to that dock throughout the collection of this data to allow a single dock to be identified over time. Fuel suppliers were selected on the following basis: 1. If a fuel supplier was included in NMFS SW Region's fuel price collection and the dock's phone number is still operational. 2. If a fuel supplier was listed in the "Port Guide" appearing in the 1998 National Fisherman's Journal Pilothouse Guide and Yellow Pages. 3. If a fuel supplier was not located through the "Port Guide" method for a given port, the US West Dex Internet Yellow Pages and/or the Marine Yellow Pages was used to locate a fuel supplier at that port. 4. In some cases, the Port Office is called in lieu of a fuel supplier. Some suppliers were added to increase coverage in certain areas as their contact information became available.
8 Data Collection Date of Collection Fuel prices are collected the first Tuesday of each month, given the following contingencies: If the first Tuesday of a month is a holiday, prices are collected the following Thursday. For instance, July 4, 2000 was a Tuesday. Price data for July 2000 was collected on Thursday, July 6, The date the data is collected is stored with the data. If the fuel supplier being surveyed does not answer their phone on the first Tuesday of the month, the person surveying the fuel suppliers will try to reach the dock in question one more time during that day and three times on the following Thursday (until the dock is reached). If the dock could not be reached during these attempts, a missing value will appear in the data for that dock. If there are other circumstances that prevent the person conducting the survey from being able to do so on the first Tuesday of the month, fuel prices will be collected on the next business day. A noted exception happened in 2014 when price collection was performed the second week in September. Price Data Collected The data to be collected are the before tax (where applicable) cash price for 600 gallons of #2 marine diesel for a commercial fishing vessel. If the before tax price is not available, (i.e., the fuel supplier cannot/will not provide before tax price) the pre-tax price is calculated when possible and a note is made in the "notes" column. The price collected at 600 gallons, attempts to account for price-breaks that many fuel suppliers have for purchases above gallons. We realize that many fishing vessels purchase thousands of gallons at a time and price breaks are offered for larger purchases, however, the largest and most common breaks occur below 600 gallons. Data Availability Fuel price data is available by state and in a combined West Coast/Alaska file. These data are entered and made available on the Economic Fisheries Information Network (EFIN) website in EXCEL and ASCII formats by the second Tuesday of each month. The link to this data is:
9 Variable Formats Marine fuel price data are available in two formats: as an EXCEL file and as an ASCII fixed width file. Each file contains the following variables: Variable Type Width Variable Title Data Values/Notes Year Numeric 4.0 Year of fuel price collection Month Numeric 2.0 Month of fuel price collection 1=January, 2=February, etc. Day Numeric 2.0 Date of fuel price collection Port Character 3 PacFIN/AKFIN port code PortName Character 30 Name of port State Character 2 State in which port is located DockCode Character 4 Fuel dock identifier Pricettl Dollar 10.2 Pricegal Dollar 6.3 PxQuoted Numeric 1.0 Quoted Price Notes Character 51 Total cash price before tax of 600 gallons of #2 marine diesel in current US dollars Cash price per gallon before tax of 600 gallons of #2 marine diesel in current US dollars Any notes related to anomalies, exceptions, caveats, etc, associated with the data in the record 2-letter US Postal Service official abbreviation Pricettl=$0.00 indicates that a total price was unavailable for this fuel supplier Pricegal=$0.000 indicates that a total price was unavailable for this fuel supplier 0 = No Price Quoted - See Notes 1 = Price per Gallon Quoted 2 = Total Price Quoted 3 = Both Prices Quoted
10 Data Charts for Alaska, Washington, Oregon and California
11 State Average Before Tax Cash Price Based on the Purchase of 600 Gallons of #2 Marine Diesel $4.50 Price Per Gallon $4.00 $3.50 $3.00 $ AK 2018 WA 2018 OR 2018 CA 2017 AK 2017 WA 2017 OR 2017 CA 2016 AK 2016 WA 2016 OR 2016 CA $2.00 $1.50 JAN Pacific FEB States MAR Marine APRFisheries MAYCommission JUN Economic JUL AUG Fisheries SEP Information OCT Network NOV DEC Month January 2019
12 State Level Summary JAN FEB MAR APR MAY JUN JUL AUG SEP OCT NOV DEC Alaska $2.87 $2.94 $2.90 $2.93 $2.95 $3.16 $3.18 $3.25 $3.21 $3.24 $3.32 $3.25 Washington $2.76 $2.77 $2.60 $2.96 $3.12 $3.27 $3.13 $3.07 $3.00 $3.09 $3.16 $2.91 Oregon $2.51 $2.53 $2.45 $2.61 $2.79 $2.91 $2.86 $2.76 $2.77 $2.79 $2.93 $2.76 California $3.16 $3.26 $3.17 $3.23 $3.43 $3.51 $3.48 $3.33 $3.62 $3.61 $3.70 $ JAN FEB MAR APR MAY JUN JUL AUG SEP OCT NOV DEC Alaska $2.49 $2.57 $2.57 $2.54 $2.59 $2.73 $2.64 $2.61 $2.69 $2.78 $2.86 $2.79 Washington $2.35 $2.38 $2.32 $2.28 $2.40 $2.39 $2.39 $2.38 $2.59 $2.65 $2.78 $2.79 Oregon $2.14 $2.15 $2.09 $2.10 $2.09 $2.17 $2.10 $2.22 $2.42 $2.53 $2.44 $2.44 California $2.96 $2.96 $3.02 $2.98 $2.95 $2.90 $2.73 $2.78 $3.12 $3.00 $3.07 $ JAN FEB MAR APR MAY JUN JUL AUG SEP OCT NOV DEC Alaska $2.68 $2.51 $2.40 $2.28 $2.30 $2.47 $2.49 $2.52 $2.53 $2.51 $2.50 $2.49 Washington $1.96 $1.73 $1.74 $1.78 $2.13 $2.37 $2.39 $2.06 $2.20 $2.15 $2.35 $2.26 Oregon $2.09 $2.26 $2.10 $2.05 $2.27 $2.11 $2.13 $1.94 $2.10 $2.06 $2.05 $2.07 California $2.68 $2.41 $2.41 $2.50 $2.67 $2.88 $2.87 $2.77 $2.78 $2.77 $2.93 $2.83
13 $ West Coast Fuel Prices State-Level Summaries 2018 State Average Before Tax Cash Price Based on the Purchase of 600 Gallons of #2 Marine Diesel $4.00 Price Per Gallon $3.50 $ AK 2018 WA 2018 OR 2018 CA $2.50 $2.00 JAN FEB MAR APR MAY JUN JUL AUG SEP OCT NOV DEC Month 2018 JAN FEB MAR APR MAY JUN JUL AUG SEP OCT NOV DEC Alaska $2.87 $2.94 $2.90 $2.93 $2.95 $3.16 $3.18 $3.25 $3.21 $3.24 $3.32 $3.25 Washington $2.76 $2.77 $2.60 $2.96 $3.12 $3.27 $3.13 $3.07 $3.00 $3.09 $3.16 $2.91 Oregon $2.51 $2.53 $2.45 $2.61 $2.79 $2.91 $2.86 $2.76 $2.77 $2.79 $2.93 $2.76 California $3.16 $3.26 $3.17 $3.23 $3.43 $3.51 $3.48 $3.33 $3.62 $3.61 $3.70 $3.59
14 2017 West Coast Fuel Prices State-Level Summaries 2017 State Average Before Tax Cash Price Based on the Purchase of 600 Gallons of #2 Marine Diesel $4.00 $3.50 Price Per Gallon $3.00 $2.50 $ AK 2017 WA 2017 OR 2017 CA $1.50 $1.00 JAN FEB MAR APR MAY JUNMonthJUL AUG SEP OCT NOV DEC 2017 JAN FEB MAR APR MAY JUN JUL AUG SEP OCT NOV DEC Alaska $2.49 $2.57 $2.57 $2.54 $2.59 $2.73 $2.64 $2.61 $2.69 $2.78 $2.86 $2.79 Washington $2.35 $2.38 $2.32 $2.28 $2.40 $2.39 $2.39 $2.38 $2.59 $2.65 $2.78 $2.79 Oregon $2.14 $2.15 $2.09 $2.10 $2.09 $2.17 $2.10 $2.22 $2.42 $2.53 $2.44 $2.44 California $2.96 $2.96 $3.02 $2.98 $2.95 $2.90 $2.73 $2.78 $3.12 $3.00 $3.07 $3.29
15 2016 West Coast Fuel Prices State-Level Summaries 2016 State Average Before Tax Cash Price Based on the Purchase of 600 Gallons of #2 Marine Diesel $4.00 Price Per Gallon $3.50 $3.00 $ AK 2016 WA 2016 OR 2016 CA $2.00 $1.50 JAN FEB MAR APR MAY JUN Month JUL AUG SEP OCT NOV DEC 2016 JAN FEB MAR APR MAY JUN JUL AUG SEP OCT NOV DEC Alaska $2.68 $2.51 $2.40 $2.28 $2.30 $2.47 $2.49 $2.52 $2.53 $2.51 $2.50 $2.49 Washington $1.96 $1.73 $1.74 $1.78 $2.13 $2.37 $2.39 $2.06 $2.20 $2.15 $2.35 $2.26 Oregon $2.09 $2.26 $2.10 $2.05 $2.27 $2.11 $2.13 $1.94 $2.10 $2.06 $2.05 $2.07 California $2.68 $2.41 $2.41 $2.50 $2.67 $2.88 $2.87 $2.77 $2.78 $2.77 $2.93 $2.83
16 Regional-Level Summary for Alaska
17 $ Alaska Fuel Prices State Level Summaries Average Before Tax Cash Price Based on the Purchase of 600 Gallons of #2 Marine Diesel $4.00 Price Per Gallon $3.50 $3.00 $ Rest of AK 2018 SE Alaska 2017 Rest of AK 2017 SE Alaska 2016 Rest of AK 2016 SE Alaska $2.00 $1.50 JAN FEB MAR APR MAY JUN JUL AUG SEP OCT NOV DEC
18 The Rest of Alaska Southeast Alaska Adak Juneau Akutan Ketchikan Cordova Petersburg Dillingham Sitka Dutch Harbor Wrangell Homer Yakutat Kodiak Sand Point Seward 2018 JAN FEB MAR APR MAY JUN JUL AUG SEP OCT NOV DEC Rest of Alaska $2.94 $2.97 $2.98 $2.97 $2.97 $3.20 $3.25 $3.33 $3.29 $3.33 $3.38 $3.27 SE Alaska $2.78 $2.90 $2.78 $2.87 $2.92 $3.08 $3.04 $3.09 $3.09 $3.09 $3.22 $ JAN FEB MAR APR MAY JUN JUL AUG SEP OCT NOV DEC Rest of Alaska $2.57 $2.65 $2.61 $2.55 $2.65 $2.76 $2.67 $2.63 $2.71 $2.83 $2.91 $2.87 SE Alaska $2.40 $2.47 $2.51 $2.52 $2.50 $2.70 $2.60 $2.59 $2.68 $2.71 $2.78 $ JAN FEB MAR APR MAY JUN JUL AUG SEP OCT NOV DEC Rest of Alaska $2.64 $2.48 $2.42 $2.20 $2.37 $2.56 $2.59 $2.58 $2.56 $2.57 $2.59 $2.58 Southeast Alaska $2.78 $2.90 $2.78 $2.87 $2.92 $3.08 $3.04 $3.09 $3.09 $3.09 $3.22 $3.23
19 2018 Alaska Fuel Prices State Level Summaries Average Before Tax Cash Price Based on the Purchase of 600 Gallons of #2 Marine Diesel $4.00 $3.50 Price Per Gallon $3.00 $2.50 Rest of Alaska SE Alaska $2.00 $1.50 JAN FEB MAR APR MAY JUN JUL AUG SEP OCT NOV DEC Month
20 2018 Rest of Alaska 2018 Rest of Alaska Monthly Maximum, Mean, Minimum Before Tax Cash Price Based on the Purchase of 600 Gallons of #2 Marine Diesel Price Per Gallon $5.00 $4.50 $4.00 $3.50 $3.00 $2.50 Maximum Mean Minimum $2.00 JAN FEB MAR APR MAY JUN JUL AUG SEP OCT NOV DEC Month Month Maximum Mean Minimum Standard Deviation Number of Fuel Suppliers Responding JAN $3.51 $2.94 $2.70 $ FEB $3.51 $2.98 $2.70 $ MAR $3.51 $2.97 $2.70 $ APR $4.66 $3.25 $2.85 $ MAY $4.33 $3.29 $2.95 $ JUN $4.66 $3.38 $2.95 $ JUL $3.03 $2.78 $2.46 $ AUG $3.35 $2.78 $2.54 $ SEP $3.13 $2.92 $2.74 $ OCT $3.18 $3.04 $2.82 $ NOV $3.45 $3.09 $2.82 $ DEC $3.75 $3.22 $2.91 $0.32 6
21 2018 Southeast Alaska 2018 Southeast Alaska Monthly Maximum, Mean, Minimum Before Tax Cash Price Based on the Purchase of 600 Gallons of #2 Marine Diesel Price Per Gallon $5.00 $4.50 $4.00 $3.50 $3.00 $2.50 Maximum Mean Minimum $2.00 JAN FEB MAR APR MAY JUN JUL AUG SEP OCT NOV DEC Month Month Maximum Mean Minimum Standard Deviation Number of Fuel Suppliers Responding JAN $3.03 $2.78 $2.46 $ FEB $3.89 $2.90 $2.53 $ MAR $3.35 $2.78 $2.54 $ APR $3.13 $2.87 $2.69 $ MAY $3.13 $2.92 $2.74 $ JUN $3.57 $3.08 $2.82 $ JUL $3.18 $3.04 $2.82 $ AUG $3.28 $3.09 $2.88 $ SEP $3.45 $3.09 $2.82 $ OCT $3.42 $3.09 $2.88 $ NOV $3.75 $3.22 $2.91 $ DEC $3.89 $3.23 $2.91 $0.32 7
22 Regional-Level Summary for Washington
23 $ Washington Fuel Prices State Level Summaries Average Before Tax Cash Price Based on the Purchase of 600 Gallons of #2 Marine Diesel $4.00 Price Per Gallon $3.50 $3.00 $2.50 $ Northern WA 2018 Puget Sound 2018 WA Coast 2017 Northern WA 2017 Puget Sound 2017 WA Coast 2016 Northern WA 2016 Puget Sound 2016 WA Coast $1.50 $1.00 JAN FEB MAR APR MAY JUN JUL AUG SEP OCT NOV DEC
24 Regional-Level Summary for Washington Northern Washington Puget Sound Washington Coast Anacortes Everett Ilwaco/Chinook Bellingham Bay Olympia Neah Bay Port Townsend Seattle Port Angeles Shelton Westport 2018 JAN FEB MAR APR MAY JUN JUL AUG SEP OCT NOV DEC Northern Washington $2.68 $2.64 $2.51 $2.87 $2.99 $3.10 $2.88 $2.80 $2.81 $2.94 $3.02 $2.71 Puget Sound $2.95 $2.85 $2.73 $3.15 $3.24 $3.49 $3.37 $3.38 $3.17 $3.35 $3.37 $3.15 Washington Coast $2.53 $2.73 $2.53 $2.76 $3.03 $3.01 $2.91 $2.73 $2.88 $2.82 $2.90 $ JAN FEB MAR APR MAY JUN JUL AUG SEP OCT NOV DEC Northern Washington $2.20 $2.25 $2.20 $2.17 $2.28 $2.01 $2.29 $2.24 $2.41 $2.60 $2.69 $2.68 Puget Sound $2.57 $2.57 $2.50 $2.44 $2.48 $2.70 $2.64 $2.59 $2.79 $2.77 $2.99 $3.00 Washington Coast $2.20 $2.18 $2.15 $2.16 $2.38 $2.14 $2.06 $2.12 $2.44 $2.51 $2.55 $ JAN FEB MAR APR MAY JUN JUL AUG SEP OCT NOV DEC Northern Washington $1.80 $1.58 $1.62 $1.67 $1.93 $2.29 $2.25 $2.04 $2.21 $2.10 $2.20 $2.24 Puget Sound $2.14 $1.96 $2.01 $2.03 $2.39 $2.54 $2.64 $2.22 $2.30 $2.32 $2.59 $2.40 Washington Coast $1.84 $1.51 $1.46 $1.52 $1.89 $2.17 $2.10 $1.85 $2.07 $1.94 $2.08 $2.07
25 2018 Washington Fuel Prices State Level Summaries Average Before Tax Cash Price Based on the Purchase of 600 Gallons of #2 Marine Diesel $4.00 $3.50 Price Per Gallon $3.00 $2.50 $ Northern WA 2018 Puget Sound 2018 WA Coast $1.50 $1.00 JAN FEB MAR APR MAY JUN JUL AUG SEP OCT NOV DEC Month
26 $ Northern Washington 2018 Northern Washington Monthly Maximum, Mean, Minimum Before Tax Cash Price Based on the Purchase of 600 Gallons of #2 Marine Diesel Price Per Gallon $4.50 $4.00 $3.50 $3.00 $2.50 Maximum Mean Minimum $2.00 JAN FEB MAR APR MAY JUN JUL AUG SEP OCT NOV DEC Month Standard Month Maximum Mean Minimum Deviation Number of Fuel Suppliers Responding JAN $2.86 $ 2.68 $2.36 $ FEB $2.83 $ 2.64 $2.34 $ MAR $2.66 $ 2.51 $2.30 $ APR $3.04 $ 2.87 $2.56 $ MAY $3.18 $ 2.99 $2.69 $ JUN $3.29 $ 3.10 $2.74 $ JUL $3.07 $ 2.88 $2.67 $ AUG $3.04 $ 2.80 $2.55 $ SEP $2.96 $ 2.81 $2.61 $ OCT $3.06 $ 2.94 $2.72 $ NOV $3.24 $ 3.02 $2.68 $ DEC $2.90 $ 2.71 $2.55 $
27 Price Per Gallon $5.00 $4.50 $4.00 $3.50 $3.00 $2.50 $ Puget Sound 2018 Puget Sound Monthly Maximum, Mean, Minimum Before Tax Cash Price Based on the Purchase of 600 Gallons of #2 Marine Diesel JAN FEB MAR APR MAY JUN JUL AUG SEP OCT NOV DEC Month Maximum Mean Minimum Month Maximum Mean Minimum Standard Deviation Number of Fuel Suppliers Responding JAN $3.50 $ 2.95 $2.33 $ FEB $3.25 $ 2.85 $2.49 $ MAR $3.09 $ 2.73 $2.30 $ APR $3.50 $ 3.15 $2.57 $ MAY $3.59 $ 3.24 $2.68 $ JUN $3.99 $ 3.49 $2.87 $ JUL $3.97 $ 3.37 $2.74 $ AUG $3.99 $ 3.38 $2.56 $ SEP $3.49 $ 3.17 $2.57 $ OCT $3.75 $ 3.35 $2.71 $ NOV $3.87 $ 3.37 $2.70 $ DEC $3.69 $ 3.15 $2.24 $
28 2018 Washington Coast 2018 Washington Coast Monthly Maximum, Mean, Minimum Before Tax Cash Price Based on the Purchase of 600 Gallons of #2 Marine Diesel Price Per Gallon $5.00 $4.50 $4.00 $3.50 $3.00 $2.50 Maximum Mean Minimum $2.00 JAN FEB MAR APR MAY JUN JUL AUG SEP OCT NOV DEC Month Month Maximum Mean Minimum Standard Deviation Number of Fuel Suppliers Responding JAN $2.65 $ 2.53 $2.35 $ FEB $3.24 $ 2.73 $2.42 $ MAR $2.60 $ 2.53 $2.38 $ APR $2.98 $ 2.76 $2.52 $ MAY $3.54 $ 3.03 $2.62 $ JUN $3.12 $ 3.01 $2.73 $ JUL $3.02 $ 2.91 $2.73 $ AUG $2.81 $ 2.73 $2.62 $ SEP $3.39 $ 2.88 $2.55 $ OCT $2.89 $ 2.82 $2.68 $ NOV $3.06 $ 2.90 $2.67 $ DEC $3.01 $ 2.69 $2.50 $
29 Regional-Level Summary for Oregon
30 Oregon Fuel Prices State Level Summaries Average Before Tax Cash Price Based on the Purchase of 600 Gallons of #2 Marine Diesel $4.00 $3.50 $3.00 Price Per Gallon $2.50 $ All Oregon 2017 All Oregon 2016 All Oregon $1.50 $1.00 JAN FEB MAR APR MAY JUN JUL AUG SEP OCT NOV DEC Month
31 Regional-Level Summary for Oregon The ports in Oregon are grouped into one region: All Oregon Astoria Newport Florence Winchester Bay 2018 JAN FEB MAR APR MAY JUN JUL AUG SEP OCT NOV DEC All Oregon $2.51 $2.53 $2.45 $2.61 $2.79 $2.91 $2.86 $2.76 $2.77 $2.79 $2.93 $ JAN FEB MAR APR MAY JUN JUL AUG SEP OCT NOV DEC All Oregon $2.14 $2.15 $2.09 $2.10 $2.09 $2.17 $2.10 $2.22 $2.42 $2.53 $2.44 $ JAN FEB MAR APR MAY JUN JUL AUG SEP OCT NOV DEC All Oregon $2.09 $2.26 $2.10 $2.05 $2.27 $2.11 $2.13 $1.94 $2.10 $2.06 $2.05 $2.07
32
33 2018 All Oregon Price Per Gallon $5.00 $4.50 $4.00 $3.50 $3.00 $2.50 $ All Oregon Monthly Maximum, Mean, Minimum Before Tax Cash Price Based on the Purchase of 600 Gallons of #2 Marine Diesel JAN FEB MAR APR MAY JUN JUL AUG SEP OCT NOV DEC Month Maximum Mean Minimum Month Maximum Mean Minimum Standard Deviation Number of Fuel Suppliers Responding JAN $2.73 $2.51 $2.29 $ FEB $2.75 $2.53 $2.29 $ MAR $2.61 $2.45 $2.29 $ APR $2.84 $2.61 $2.29 $ MAY $3.39 $2.79 $2.29 $ JUN $3.07 $2.91 $2.70 $ JUL $2.99 $2.86 $2.64 $ AUG $2.90 $2.76 $2.50 $ SEP $2.90 $2.77 $2.49 $ OCT $2.89 $2.79 $2.57 $ NOV $2.99 $2.93 $2.80 $ DEC $2.99 $2.76 $2.34 $0.29 4
34 Regional-Level Summary for California
35 California Fuel Prices State Level Summaries Average Before Tax Cash Price Based on the Purchase of 600 Gallons of #2 Marine Diesel $4.00 $3.50 $3.00 Price Per Gallon $2.50 $ All California 2017 All California 2016 All California $1.50 $1.00 JAN FEB MAR APR MAY JUN JUL AUG SEP OCT NOV DEC Month
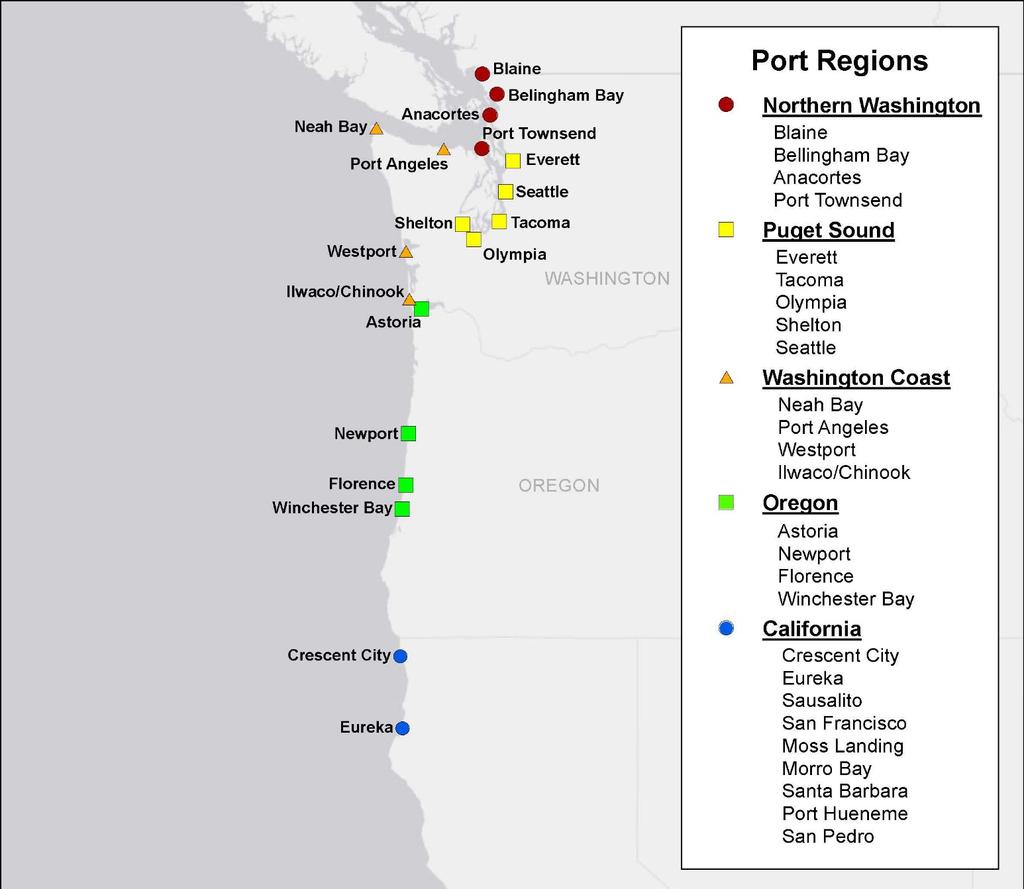
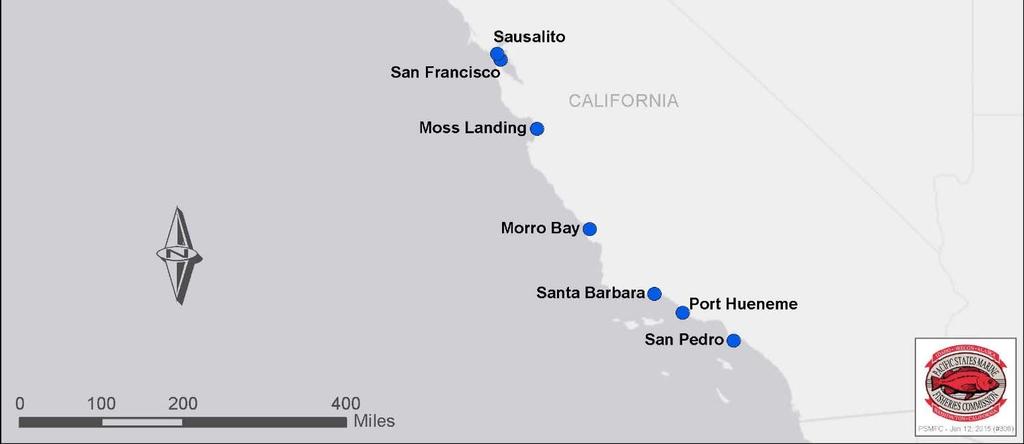
36 2018 All California The ports in California are grouped into one region: All California Bodega Bay Crescent City Eureka Morro Bay Moss Landing Port Hueneme San Francisco San Pedro Santa Barbara Sausalito 2018 JAN FEB MAR APR MAY JUN JUL AUG SEP OCT NOV DEC All California $3.16 $3.26 $3.17 $3.23 $3.43 $3.51 $3.48 $3.33 $3.62 $3.61 $3.70 $ JAN FEB MAR APR MAY JUN JUL AUG SEP OCT NOV DEC All California $2.96 $2.96 $3.02 $2.98 $2.95 $2.90 $2.73 $2.78 $3.12 $3.00 $3.07 $ JAN FEB MAR APR MAY JUN JUL AUG SEP OCT NOV DEC All California $2.68 $2.41 $2.41 $2.50 $2.67 $2.88 $2.87 $2.77 $2.78 $2.77 $2.93 $2.83
37 2018 California Fuel Prices State Level Summaries Average Before Tax Cash Price Based on the Purchase of 600 Gallons of #2 Marine Diesel $4.00 $3.50 Price Per Gallon $3.00 $2.50 All California $2.00 $1.50 JAN FEB MAR APR MAY JUN JUL AUG SEP OCT NOV DEC Month
38 2018 All California 2018 All California Monthly Maximum, Mean, Minimum Before Tax Cash Price Based on the Purchase of 600 Gallons of #2 Marine Diesel Price Per Gallon $5.00 $4.50 $4.00 $3.50 $3.00 $2.50 Maximum Mean Minimum $2.00 JAN FEB MAR APR MAY JUN JUL AUG SEP OCT NOV DEC Month Month Maximum Mean Minimum Standard Deviation Number of Fuel Suppliers Responding JAN $3.56 $3.16 $2.67 $ FEB $3.71 $3.26 $2.85 $ MAR $3.81 $3.17 $2.55 $ APR $3.68 $3.23 $2.86 $ MAY $3.85 $3.43 $2.95 $ JUN $4.04 $3.51 $3.09 $ JUL $4.12 $3.48 $3.03 $ AUG $3.95 $3.33 $3.05 $ SEP $3.89 $3.62 $3.11 $ OCT $4.14 $3.61 $3.09 $ NOV $4.14 $3.70 $3.32 $ DEC $3.99 $3.59 $3.18 $0.26 7
West Coast and Alaska Marine Fuel Prices
 West Coast and Alaska Marine Fuel Prices 2010-2012 Annual Report Economic Fisheries Information Network Pacific States Marine Fisheries Commission 205 S.E. Spokane Street, Suite 100 Portland, OR 97202
Marine Fuel Prices on the Economics Data Program Website
 Marine Fuel s on the Economics Data Program Website Data Series Economics Data Program Pacific States Marine Fisheries Commission 7600 Sand Point Way NE, Building 4 Seattle, WA 98115 efin@psmfc.org? http://www.psmfc.org/efin
Commercial-in-Confidence Ashton Old Baths Financial Model - Detailed Cashflow
 Year 0 1 2 3 4 5 6 7 8 9 10 11 12 13 Oct-16 Nov-16 Dec-16 Jan-17 Feb-17 Mar-17 Apr-17 May-17 Jun-17 Jul-17 Aug-17 Sep-17 Oct-17 2,038 2,922 4,089 4,349 6,256 7,124 8,885 8,885 8,885 8,885 8,885 8,885 9,107
COMPARISON OF FIXED & VARIABLE RATES (25 YEARS) CHARTERED BANK ADMINISTERED INTEREST RATES - PRIME BUSINESS*
 CHARTERED BANK ADMINISTERED INTEREST RATES - PRIME BUSINESS*") COMPARISON OF FIXED & VARIABLE RATES (25 YEARS) 2 Fixed Rates Variable Rates For Internal Use Only. FIXED RATES OF THE PAST 25 YEARS AVERAGE RESIDENTIAL MORTGAGE LENDING RATE - 5 YEAR* (Per cent) Year
COMPARISON OF FIXED & VARIABLE RATES (25 YEARS) 2 Fixed Rates Variable Rates For Internal Use Only. FIXED RATES OF THE PAST 25 YEARS AVERAGE RESIDENTIAL MORTGAGE LENDING RATE - 5 YEAR* (Per cent) Year
COMPARISON OF FIXED & VARIABLE RATES (25 YEARS) CHARTERED BANK ADMINISTERED INTEREST RATES - PRIME BUSINESS*
 CHARTERED BANK ADMINISTERED INTEREST RATES - PRIME BUSINESS*") COMPARISON OF FIXED & VARIABLE RATES (25 YEARS) 2 Fixed Rates Variable Rates FIXED RATES OF THE PAST 25 YEARS AVERAGE RESIDENTIAL MORTGAGE LENDING RATE - 5 YEAR* (Per cent) Year Jan Feb Mar Apr May Jun
COMPARISON OF FIXED & VARIABLE RATES (25 YEARS) 2 Fixed Rates Variable Rates FIXED RATES OF THE PAST 25 YEARS AVERAGE RESIDENTIAL MORTGAGE LENDING RATE - 5 YEAR* (Per cent) Year Jan Feb Mar Apr May Jun
APPENDIX A HISTORICAL RECORD OF OCEAN SALMON FISHERY EFFORT AND LANDINGS
 APPENDIX A HISTORICAL RECORD OF OCEAN SALMON FISHERY EFFORT AND LANDINGS Tae Al. LIST OF TABLES Summary of Cifornia troll smon fishing effort in days fished and landings in numbers of fish by port area...........................................
1999 in Review. Benchmark Revision. Employment Scene. Department of Labor and Workforce Development Tony Knowles, Governor of Alaska
 1999 in Review 8 Benchmark Revision Employment Scene Department of Labor and Workforce Development Tony Knowles, Governor of Alaska April 2000 Volume 20 Number 4 ISSN 0160-3345 Alaska Economic Trends is
Up and Down Months of the Stock Market
 Up and Down Months of the Stock Market 1926-2017 Positive years (66) in the stock market were not good all year long and losing years (24) were not losers throughout the year. Winning years produce losing
Oriented Strand Board Sheathing (delivered, Los Angeles) 7/16-inch 2005 to 2009
 7/16-inch 2005 to 2009") Oriented Strand Board Sheathing (delivered, Los Angeles) 7/16-inch 2005 to 2009 OSB Sheathing (del. LA) 7/16" 2005 2006 2007 2008 2009 Average Month Price Change Price Change Price Change Price Change
Oriented Strand Board Sheathing (delivered, Los Angeles) 7/16-inch 2005 to 2009 OSB Sheathing (del. LA) 7/16" 2005 2006 2007 2008 2009 Average Month Price Change Price Change Price Change Price Change
ANCR CRU Statistics February 2007 to December 2007
 ANCR CRU Statistics February 2007 to December 2007 o Jan/07 Feb/07* Mar/07 Apr/07 May/07 Jun/07 Jul/07 Aug/07 Sep/07 Oct/07 Nov/07 Dec/07 Total notes data from Perimeter phone system unavailable prior
Updated: Analysis of Crude Oil Tanker Ballast Water Data for Valdez & Prince William Sound, Alaska. Final Report
 Updated: Analysis of Crude Oil Tanker Ballast Water Data for Valdez & Prince William Sound, Alaska Final Report Presented To: Prince William Sound Regional Citizens Advisory Council 3709 Spenard Road Suite
NEWS Release. U.S. Manufacturing Technology Orders. Year-to-date U.S. manufacturing technology orders up 4.1% over 2011
 U.S. Manufacturing Technology Orders A statistical program of AMT NEWS Release FOR RELEASE: October 8, 2012 Contact: Pat McGibbon, AMT, 703-827-5255 Year-to-date U.S. manufacturing technology orders up
-1- INTRODUCTION. This report presents historical tabulated data on landings and value of the New Bedford sea scallop fishery from
 -1- INTRODUCTION Since the late 1930's, New Bedford, Massachusetts,has been the leading port for sea scallop (Placopecten magellanicus) landings in the United States. In 1983, New Bedford sea scallop landings
2017 U.S. Ethanol Exports and Imports. Statistical Summary Renewable Fuels Association. All Rights Reserved.
 2017 U.S. Ethanol Exports and Imports Statistical Summary 2018 Renewable Fuels Association. All Rights Reserved. 2017 U.S. ETHANOL EXPORTS Annual U.S. Ethanol Exports 1, 1, 1,000 800 600-1,367 1,193 1,169
January Manufacturing Technology Orders Off After a Strong December
 Contact: Bonnie Gurney, AMT, 703-827-5277 bgurney@amtonline.org For Release: March 9, 2015 January Manufacturing Technology Orders Off After a Strong December January U.S. manufacturing technology orders
NE (SE) Beam
 Beam") Predicted clear day beam and diffuse irradiances (/ W m 2 ) on vertical and horizontal surfaces on specified days in northern (N) and southern (S) hemispheres (see notes at foot of table): LATITUDE 60
Predicted clear day beam and diffuse irradiances (/ W m 2 ) on vertical and horizontal surfaces on specified days in northern (N) and southern (S) hemispheres (see notes at foot of table): LATITUDE 60
Sunrise: 05:48 N (S) Beam
 Beam") Predicted clear day beam and diffuse irradiances (/ W m 2 ) on vertical and horizontal surfaces on specified days in northern (N) and southern (S) hemispheres (see notes at foot of table): LATITUDE 40
Predicted clear day beam and diffuse irradiances (/ W m 2 ) on vertical and horizontal surfaces on specified days in northern (N) and southern (S) hemispheres (see notes at foot of table): LATITUDE 40
2016 U.S. ETHANOL EXPORTS AND IMPORTS
 2016 U.S. ETHANOL EXPORTS AND IMPORTS STATISTICAL SUMMARY Copyright 2017 Renewable Fuels Association. All Rights Reserved 2016 U.S. ETHANOL EXPORTS U.S. Ethanol Exports, 2006-2016 1,200 1,000 800 600 396
Year to Date Summary. Average and Median Sale Prices
 A Publication of RMLS, The Source for Real Estate Statistics in Your Community Residential Review: Southwest Washington September 2018 Reporting Period September Residential Highlights Southwest Washington
Total Production by Month (Acre Feet)
") Production by Month (acre-feet) 2008 2009 2010 2011 2012 2013 2014 2015 2016 January 25 339.10 228.90 249.50 297.99 243.06 327.14 247.66 212.37 February 234.00 218.80 212.10 241.52 245.82 279.08 234.16
Production by Month (acre-feet) 2008 2009 2010 2011 2012 2013 2014 2015 2016 January 25 339.10 228.90 249.50 297.99 243.06 327.14 247.66 212.37 February 234.00 218.80 212.10 241.52 245.82 279.08 234.16
December. Next release: 13 February Oct/Sep Nov/Oct Dec/Nov Janu19 January Febru13 February 2018 Oct/Sep Nov/Oct Dec/Nov 2017
 Oct/Sep Nov/Oct Dec/Nov 2017 19 Janu19 January 2018 13 Febru13 February 2018 Oct/Sep Nov/Oct Dec/Nov 2017 Next release: 13 February 2018 DecembDecember December TABLE OF CONTENTS Page Charts 1 Latest IEA
November. Next release: 19 January Sep/AugOct/Sep Nov/Oct Dec 14 December Janu 19 January 2018 Sep/AugOct/Sep Nov/Oct 2017
 Sep/AugOct/Sep Nov/Oct 2017 14 Dec 14 December 2017 19 Janu 19 January 2018 Sep/AugOct/Sep Nov/Oct 2017 Next release: 19 January 2018 NovembNovember November Monthly Oil Price Statistics TABLE OF CONTENTS
ANCR CRU Statistics Februa.. to December 2007
 ANCR CRU Statistics Februa.. to December 2007 Jan/07 Feb/07* Mar/07 Apr/07 May/07 Jun/07 Jul/07 Aug/07 Sep/07 Oct/07 Nov/07 Dec/07 Total notes Answered dato from Perimeter phone system unavailable prior
Appendix F. Ship Drift Analysis West Coast of North America: Alaska to Southern California HAZMAT Report ; April 2000
 Appendix F Ship Drift Analysis West Coast of North America: Alaska to Southern California HAZMAT Report 2000-2; April 2000 2.2 Drift Factors When its propulsion or steering device fails, a ship will drift
The Changing Relationship Between the Price of Crude Oil and the Price At the Pump
 In 2007, what goes up, does not necessarily come down... May 3, 2007 The Changing Relationship Between the Price of Crude Oil and the Price At the Pump Prepared by: Tim Hamilton Petroleum Industry Consultant
TRAFFIC VOLUME TRENDS July 2002
 TRAFFIC VOLUME TRENDS July 2002 Travel on all roads and streets changed by +2.3 percent for July 2002 as compared to July 2001. Estimated Vehicle-Miles of Travel by Region - July 2002 - (in Billions) West
City of Biddeford Solid Waste Management Commission January 10, :00 PM Public Works
 City of Biddeford Solid Waste Management Commission January 10, 2017 7:00 PM Public Works 1. Call to Order 2. Approval of Minutes - December 13, 3. Discussion / Approval 3.1. Food Waste curbside collection
W (W) Beam
 Beam") Predicted clear day beam and diffuse irradiances (/ W m 2 ) on vertical and horizontal surfaces on specified days in northern (N) and southern (S) hemispheres (see notes at foot of table): LATITUDE 0 N/S
Predicted clear day beam and diffuse irradiances (/ W m 2 ) on vertical and horizontal surfaces on specified days in northern (N) and southern (S) hemispheres (see notes at foot of table): LATITUDE 0 N/S
Valley Real Estate Review
 Valley Real Estate Review 35, 3, 25, 2, 15, 1, 5, December 218 Listings Months of Inventory 217 218 % of Change 2,479 2,74 1.53% 2.46 2.77 12.6% Offices Combined Force Total Listing Issued Total Annual
Season Totals by Port for All Weeks
 Salmon Fishery Estimates for the Area from Cape Falcon to the Oregon/California Border No. Fish Harvested No. Fish Released Retained Catch Port Per Garibaldi 6,372 2,206 697 1,213 125 0.46 Pacific City
The Peoples Gas Light and Coke Company
 History of Gas Charges Due to the Operation of Rider 2 (Cents per Therm) Factors for Transportation Customers (Riders FST, SST, P, CFY and AGG) Non- Total Standby Standby Aggregation Commodity Commodity
December 2018 RenewableGenerations Monthly Report
 2018 RenewableGenerations Monthly Report Ecosystem of Clean Energy Programs Contractor Training Webinar Table of Contents Solar Electric... 3 Solar Thermal Heating (Northern Nevada Gas Customers)... 5
Temporary Adjustments to Rates for Low-Income Programs.
 Onita R. King Rates & Regulatory Affairs Tel: 503.721.2452 Fax: 503.721.2516 email: ork@nwnatural.com September 12, 2016 NWN WUTC Advice No.16-04 / UG- Steven V. King, Executive Director & Secretary Washington
Macroeconomic Outlook. Presented by Dr. Bruce A. Scherr Chairman of the Board Chief Executive Officer Emeritus
 Macroeconomic Outlook Presented by Dr. Bruce A. Scherr Chairman of the Board Chief Executive Officer Emeritus Waterways Symposium Cincinnati, OH November 15-17, 2016 Topics Energy Macro Implications Inflation
DMM 2017 Q4 Report Highlights
 DMM 2017 Q4 Report Highlights Gabe Murtaugh Senior Analyst Department of Market Monitoring Conference Call February 21, 2018 Outline Real-time market performance Higher prices in the 15-minute market Large
RIDERSHIP TRENDS. April 2018
 RIDERSHIP TRENDS April Prepared by the Division of Strategic Capital Planning June Table of Contents Executive Summary...1 Ridership...3 Estimated Passenger Trips by Line...3 Estimated Passenger Trips
CCoWS. Central Coast Watershed Studies. Summary of Precipitation and Streamflow for Potrero and San Clemente Creeks in Water-Year 2007
 Central Coast Watershed Studies CCoWS Summary of Precipitation and Streamflow for Potrero and San Clemente Creeks in Water-Year 2007 Santa Lucia Preserve Monterey County, California Publication No. WI-2008-01
RIDERSHIP TRENDS. July 2018
 RIDERSHIP TRENDS July Prepared by the Division of Strategic Capital Planning September Table of Contents Executive Summary...1 Ridership...3 Estimated Passenger Trips by Line...3 Estimated Passenger Trips
TABLE C-43. Manufacturers' new and unfilled orders, {Amounts in millions of dollars] Nondurable. Capital goods. Total. goods.
![TABLE C-43. Manufacturers' new and unfilled orders, {Amounts in millions of dollars] Nondurable. Capital goods. Total. goods.](/thumbs/93/112603708.jpg "TABLE C-43. Manufacturers' new and unfilled orders, {Amounts in millions of dollars] Nondurable. Capital goods. Total. goods.") TABLE C-43. Manufacturers' new and unfilled orders, -74 {Amounts in millions of dollars] New orders t, I960. 27, 559 26, 903 30,672 30,115 31,086 33,005 35,322 37,952 41, 803 45, 944 46,763 50, 243 53,
TABLE C-43. Manufacturers' new and unfilled orders, -74 {Amounts in millions of dollars] New orders t, I960. 27, 559 26, 903 30,672 30,115 31,086 33,005 35,322 37,952 41, 803 45, 944 46,763 50, 243 53,
U.S. manufacturing technology orders kick off 2018 on a high note
 Contact: Penny Brown, AMT, 703-827-5275 pbrown@amtonline.org For Release: March 12th, 2018 U.S. manufacturing technology orders kick off 2018 on a high note Orders for manufacturing technology in January
TRAFFIC VOLUME TRENDS
 Page 1 U. S. Department Transportation Federal Highway Administration Office Highway Policy Information TRAFFIC VOLUME TRENDS September Travel on all roads and streets changed by +2.5 (5.8 billion vehicle
California s Petroleum Infrastructure Overview and Import Projections
 California s Petroleum Infrastructure Overview and Import Projections Port of Los Angeles Harbor Commission Meeting San Pedro, CA February 1, 2007 Gordon Schremp Fuels and Transportation Division California
M o n. a t i s t i c s. M o n t h l y NOVEMBER 2009
 M o n t h l y M o n t S h l t y a t i s t i c s NOVEMBER 29 For Immediate Release December 7, 29 CONTACT: Kimberly Clifton, President (52) 954-8 Wes Wiggins Vice President, MLS (52) 82-8792 Cheri Meadows
Past Due. Account Charges. Contract Charges Security Deposit Due - Jun 09, , Customer Service. Jun 19, PAST DUE $1,693.
 11983978 Jun 19, 217 1 124 958 PAST DUE $1,693.97 Meter Reading Information Meter # 55271 May 3 655 Jun 15 6642 17 days 1397 on or about Aug 15 82 Past Due Balance payable includes an amount which is payable
WIM #37 was operational for the entire month of September Volume was computed using all monthly data.
 SEPTEMBER 2016 WIM Site Location WIM #37 is located on I-94 near Otsego in Wright county. The WIM is located only on the westbound (WB) side of I-94, meaning that all data mentioned in this report pertains
STATISTICS BOTSWANA ELECTRICITY GENERATION & DISTRIBUTION 2016/2 STATS BRIEF, FIRST QUARTER Copyrights Statistics Botswana 2016
 2016/2 ELECTRICITY GENERATION & DISTRIBUTION STATS BRIEF, FIRST QUARTER 2016 Copyrights Statistics Botswana 2016 Statistics Botswana. Private Bag 0024 Botswana Tel: (267) 367 1300. Fax: (267) 395 2201.
Balance from your previous bill $0.00 Meter # Basic Charge: 17 $ /day 3.23* Energy charge:¹ 2
 11983979 Jun 19, 217 1 124 962 Jul 11, 217 $24.34 Meter Reading Previous Bill. Balance from your previous bill $. Meter # 552711 May 3 19813 Account Account charge 12.4* Charges 17 days 82 Jun 15 19895
The Fuel and Vehicle Trends Report August 31, 2016
 ISSN 1948-2388 The Fuel and Vehicle Trends Report August 31, 2016 This report is a summary of the latest fuel prices and other oil industry key statistics. In addition, this report provides the latest
NEU Electric and Natural Gas Price Update
 Exelon s $24 Billion Energy Bill Senate Bill 2814 Short-Term Energy Price Outlook On November 15, 2016, Exelon, through its legislative supporters, introduced Senate Bill 2814, a massive 446 page document
STEEL IMPORTS DOWN 5% YEAR-TO-DATE THROUGH FEBRUARY Finished Import Market Share YTD at 25%
 News Release FOR IMMEDIATE RELEASE March 23, 2018 CONTACT Lisa Harrison 202.452.7115/lharrison@steel.org STEEL IMPORTS DOWN 5% YEAR-TO-DATE THROUGH FEBRUARY Finished Import Market Share YTD at 25% Washington,
BRANCH AND DISTRICT DATA
 OREGON DEPARTMENT OF HUMAN SERVICES SELF SUFFICIENCY PROGRAMS BRANCH AND DISTRICT DATA APRIL 2011 STATE OF OREGON DEPARTMENT OF HUMAN SERVICES Human Services Building 500 Summer Street NE Salem, OR 97310-1013
Thursday, March 6, 2014 Houston, TX. 8:30 9:40 a.m. AN ECONOMIST S-EYE VIEW OF THE ENERGY INDUSTRY: HYDROCARBON HAT TRICK
 Thursday, March 6, 214 Houston, TX 8:3 9:4 a.m. AN ECONOMIST S-EYE VIEW OF THE ENERGY INDUSTRY: HYDROCARBON HAT TRICK Presented by Jesse Thompson Business Economist Federal Reserve Bank of Dallas, Houston
RE: Advice Schedule 45 Public DC Fast Charger Delivery Service Optional Transitional Rate REPLACEMENT PAGES
 January 31, 2017 VIA ELECTRONIC FILING Public Utility Commission of Oregon 201 High Street SE, Suite 100 Salem, OR 97301-3398 Attn: Filing Center RE: Advice 16-020 Schedule 45 Public DC Fast Charger Delivery
Foothill Transit Battery Electric Bus Performance Results
 Foothill Transit Battery Electric Bus Performance Results Leslie Eudy Matt Jeffers EV Summit, Cocoa Beach, Florida October 18, 2016 Presentation Outline NREL overview Zero emission bus (ZEB) evaluation
Presented by Eric Englert Puget Sound Energy September 11, 2002
 Results from PSE s First Year of Time of Use Program Presented by Eric Englert Puget Sound Energy September 11, 2002 Puget Sound Energy Overview 973,489 Total Electric Customers 908,949 are AMR Capable
DEPARTMENT of OCEANOGRAPHY
 (7- C. 6 ) COL LIMB/4 R, 0 7 Njorine Oregon 11:\iiver;inv DEPARTMENT of OCEANOGRAPHY SCHOOL of SCIENCE OREGON STATE UNIVERSITY wrezon FISK COMM, RESEARCH LA 89 OLNEY AVE. ASTORIA, 1R GOY SURFACE TEMPERATURE
FOR IMMEDIATE RELEASE
 Article No. 5842 Available on www.roymorgan.com Roy Morgan Unemployment Profile Thursday, 2 October 2014 Unemployment climbs to 9.9% in September as full-time work lowest since October 2011; 2.2 million
Performance Measures Second Quarter 2012
 Performance Measures Second Quarter 2012 2Q2011 Earn & Retain Community Trust 6 Performance Measures: Ridership Cost Effectiveness (Cost per Passenger) Cost Efficiency (Cost per Revenue Hour) Service Effectiveness
2012/2013 Convenience and Necessity
 2012/2013 Convenience and Necessity PART 1 - INTRODUCTION REVIEW PER AMC 11.10.030 Last review in March 2010. Request from E-Cab, LLC for issuance of geographic permit to operate in Eagle River and JBER.
CCoWS. Central Coast Watershed Studies. Summary of Precipitation and Streamflow for Potrero and San Clemente Creeks in Water-Year 2008
 Central Coast Watershed Studies CCoWS Summary of Precipitation and Streamflow for Potrero and San Clemente Creeks in Water-Year 2008 Santa Lucia Preserve Monterey County, California Publication No. WI-2009-01
TRANSPACIFIC CUSTOMER ADVISORY Implementation of New BAF Formula Effective January 01, 2019
 December 7, 2018 TRANSPACIFIC CUSTOMER ADVISORY Implementation of New BAF Formula Effective January 01, 2019 Dear Valued Customer, Bunker is one of the important cost components for a container shipping
September 2016 Water Production & Consumption Data
 September 2016 Water Production & Consumption Data September 2016 monthly water production (288.48 AF) was lowest in at least 17 years. Monthly water production has increased slightly each month since
NEW HAMPSHIRE GAS CORPORATION WINTER PERIOD ORIGINAL FILING CONTENTS 3. CONVERSION OF GAS COSTS - GALLONS TO THERMS SCHEDULE A
 NEW HAMPSHIRE GAS CORPORATION COST OF GAS RATE FILING - DG 13- WINTER PERIOD 2013-2014 ORIGINAL FILING CONTENTS 1. TARIFF PAGE - COST OF GAS RATE 2. MARKED TARIFF PAGE - COST OF GAS RATE 3. CONVERSION
November 2017 Customer Switching Report for the Electricity and Gas Retail Markets
 An Coimisiún um Rialáil Fóntas Commission for Regulation of Utilities November 2017 Customer Switching Report for the Electricity and Gas Retail Markets Information Paper Reference: CRU18011 Date Published:
M onthly arket. Jan Table of Contents. Monthly Highlights
 Table of Contents Market Inventory...2 www.gaar.com Monthly Highlights January 2014 had a 12.29% increase in the number of homes sales when compared to same time last year. The average sale price of single-family
Multiple Listing Service
 For Immediate Release: January 7, 21 CONTACT: Dan Santa Maria MLS President (52) 795-1492 Wes Wiggins Vice President, MLS (52) 382-8792 Cheri Meadows Senior Vice President, TAR (52) 327-4218 For Tucson
National Routing Number Administration p-ani Activity and Projected Exhaust Report
 National Routing Number Administration 2016 p-ani Activity and Projected Exhaust Report The ATIS Industry Numbering Committee developed the P-ANI Administration Guidelines, which contain the following
OCEANOGRAPHY. Department of SCHOOL OF SCIENCE OREGON STATE UNIVERSITY 0/17. LIBRARY Marine Science Laboratory Oregon State University
 a 01 Department of LIBRARY Marine Science Laboratory Oregon State University OCEANOGRAPHY 0/17 Surface Temperature and Salinity Observations at Pacific Northwest Shore Stations During 1970 by SCHOOL OF
FOR IMMEDIATE RELEASE
 Article No. 7433 Available on www.roymorgan.com Roy Morgan Unemployment Profile Friday, 12 January 2018 2.6m Australians unemployed or under-employed in December The latest data for the Roy Morgan employment
STEEL IMPORTS UP 17% IN JANUARY Finished Import Market Share at 26%
 News Release FOR IMMEDIATE RELEASE February 26, 2018 CONTACT Lisa Harrison 202.452.7115/lharrison@steel.org STEEL IMPORTS UP 17% IN JANUARY Finished Import Market Share at 26% Washington, D.C. Based on
Price Category Breakdown - February 2010
 SINGLE FAMILY RESIDENTIAL BREAKDOWN ruary 21 ruary Sales and Average Price Increase Annually TORONTO - Wednesday, March 3, 21 7.3 % 24.6 % 1.8 % 7.3%.2%.1 % Greater Toronto REALTORS reported 7,291 sales
August 15, Please contact the undersigned directly with any questions or concerns regarding the foregoing.
 California Independent System Operator Corporation The Honorable Kimberly D. Bose Secretary Federal Energy Regulatory Commission 888 First Street, NE Washington, DC 20426 August 15, 2017 Re: California
FOR IMMEDIATE RELEASE
 Article No. 7761 Available on www.roymorgan.com Roy Morgan Unemployment Profile Monday, 8 October 2018 Unemployment down to 9.4% in September off two-year high Australian employment has grown solidly over
Performance Measures 4 th Quarter/Year End 2010
 Performance Measures 4 th Quarter/Year End 2010 Earn & Retain Community Trust 6 Performance Measures: Ridership Cost Effectiveness (Cost per Passenger) Cost Efficiency (Cost per Revenue Hour) Service Effectiveness
Transmission Planning Attachment K Public Input Meeting
 Transmission Planning Attachment K Public Input Meeting FERC 890 6 th Quarter Meeting May 25, 2011 Agenda Mountain Time Topic Presenter 1:00 1:15 Greetings and Introduction Dennis Desmarais 1:15 1:30 Attachment
Orange County Transportation Authority
 Orange County Transportation Authority Sales Tax Review Meeting 2 nd Quarter 2011 December 14, 2011 www.muniservices.com 800.800.8181 Transportation Authorities Sales Tax Net Cash Receipts: Three Advances
SECOND QUARTER 2018 THE BLUE MOUNTAINS REAL ESTATE MARKET REPORT LOCATIONS ROYAL LEPAGE S 2016 BROKERAGE OF THE YEAR FOR ONTARIO
 THE BLUE MOUNTAINS REAL ESTATE MARKET REPORT SECOND QUARTER 2018 WE RE PROUD AND GRATEFUL TO HAVE BEEN CHOSEN AS ROYAL LEPAGE S BROKERAGE OF THE YEAR FOR ONTARIO OVERVIEW SECOND BEST Q2 VOLUME SALES EVER,
2011 Puget Sound Maritime Air Emission Inventory
 Overview and Progress Update West Coast Collaborative Port Sector Call 27 October 2011 Steering Committee Members American Lung Association of the Mountain Pacific BNSF Railway, Northwest Clean Air Agency,
FOR IMMEDIATE RELEASE
 Article No. 6928 Available on www.roymorgan.com Roy Morgan Unemployment Profile Wednesday, 17 August 2016 Australian real unemployment jumps to 10.5% (up 0.9%) in July during post-election uncertainty
/ PRELIMINARY STEEL IMPORTS INCREASE 2% IN MAY Import Market Share 23% in May
 News Release FOR IMMEDIATE RELEASE June 25, 2013 CONTACT Lisa Harrison 202.452.7115/ lharrison@steel.org PRELIMINARY STEEL IMPORTS INCREASE 2% IN MAY Import Market Share 23% in May Washington, D.C. Based
A summary of national and global energy indicators. FEDERAL RESERVE BANK of KANSAS CITY
 THE U.S. Energy DATABOOK A summary of national and global energy indicators JULY 1, 17 FEDERAL RESERVE BANK of KANSAS CITY SUMMARY OF CURRENT ENERGY CONDITIONS The number of total active drilling rigs
Fort York Food Bank Monthly Performance Report (FYFB)
") September 2012 Current Month Fort York Food Bank Monthly Performance Report (FYFB) 2010 2011 2012 % change 2010 2011 2012 2009 2010 2011 2012 % change Food Baskets Distributed (3 days of meals/basket)
September 2012 Current Month Fort York Food Bank Monthly Performance Report (FYFB) 2010 2011 2012 % change 2010 2011 2012 2009 2010 2011 2012 % change Food Baskets Distributed (3 days of meals/basket)
Port Botany. Trade Statistics Bulletin 1 July June 2018
 Port Botany Trade Statistics Bulletin 1 July 2017 30 June 2018 FY 2017/18 Port Botany Container Trade Jul 2017 Aug 2017 Sep 2017 Oct 2017 Nov 2017 Dec 2017 Jan 2018 Feb 2018 Mar 2018 Apr 2018 May 2018
TENTH DISTRICT MANUFACTURING SURVEY REBOUNDED MODERATELY Federal Reserve Bank of Kansas City Releases January Manufacturing Survey
 FOR RELEASE Thursday, January 23, 2014 EMBARGOED FOR 10 A.M. CENTRAL TIME CONTACT: Bill Medley 816-881-2556 Bill.Medley@kc.frb.org TENTH DISTRICT MANUFACTURING SURVEY REBOUNDED MODERATELY Federal Reserve
DRINKING WATER SYSTEM ANNUAL REPORT Reporting Period: January 1 st to December 31 st, 2016
 DRINKING WATER SYSTEM ANNUAL REPORT Reporting Period: January 1 st to December 31 st, 2016 Water System: Coal Harbour Water System Water System Owner Regional District of Mount Waddington Primary Contact
ENERGY SLIDESHOW. Federal Reserve Bank of Dallas
 ENERGY SLIDESHOW Updated: January 16, 2019 ENERGY PRICES www.dallasfed.org/research/energy Brent & WTI & Crude Brent Oil Crude Oil Dollars per barrel 140 120 100 Brent (Jan 11 = $58.64) WTI (Jan 11 = $50.78)
2017 Adjusted Count Report February 12, 2018
 A statewide multi-use trail user study and volunteer data collection program 2017 Adjusted Count Report February 12, 2018 The following report includes the final adjusted infrared (IR) counter data at
TECHNICAL SERVICE BULLETIN
 TECHNICAL SERVICE BULLETIN To: Minuteman Dealers and Customers From: Minuteman Technical Support Date: 1/12/2011 Subject: TSB for the KIT # K-FRSPEEDSWT. For the FR17115, FR17220, FR20115 and FR20220 models.
CLEARWATER POLICE DEPARTMENT. Traffic Safety Improvement Program July 1, 2012 to June 30, 2014
 CLEARWATER POLICE DEPARTMENT Traffic Safety Improvement Program July 1, 2012 to June 30, 2014 Red Light Cameras were installed at two intersections to help reduce the number of red light running crashes
STEEL IMPORTS DOWN 10% YEAR-TO-DATE Finished Import Market Share YTD at 25%
 News Release FOR IMMEDIATE RELEASE August 24, 2018 CONTACT Lisa Harrison 202.452.7115/lharrison@steel.org STEEL IMPORTS DOWN 10% YEAR-TO-DATE Finished Import Market Share YTD at 25% Washington, D.C. Based
November 2018 Customer Switching Report for the Electricity and Gas Retail Markets
 An Coimisiún um Rialáil Fóntas Commission for Regulation of Utilities November 2018 Customer Switching Report for the Electricity and Gas Retail Markets Information Paper Reference: CRU18266 Date Published:
NEU Electric and Natural Gas Price Update
 $ / MWH Jan-11 May-11 Sep-11 Sep-12 Jan-13 Electric: Short-Term Outlook The NYMEX Northern Illinois Hub 12-month forward price at the end of August 2016 for the September 2016 to August 2017 period was
FOR IMMEDIATE RELEASE
 Article No. 7353 Available on www.roymorgan.com Roy Morgan Unemployment Profile Wednesday, 11 October 2017 2.498 million Australians (18.9%) now unemployed or under-employed In September 1.202 million
CLIMATOLOGICAL SUMMARY
 DEPARTMENT OF REGISTRATION AND EDUCATION CTATP OF ILLINOIS ILLINOIS STATE WATER SURVEY DIVISION URBANA, ILLINOIS ISWS MP-19 Archive ISWS Illinois State Water Survey )CAL CLIMATOLOGICAL DATA MP-19 LOCAL
August 18, 2016 NWN OPUC Advice No A / UG 309 SUPPLEMENT A (UM 1766)
") ONITA R. KING Rates & Regulatory Affairs Tel: 503.721.2452 Fax: 503.721.2516 Email: ork@nwnatural.com August 18, 2016 NWN OPUC Advice No. 16-13A / UG 309 SUPPLEMENT A (UM 1766) VIA ELECTRONIC FILING Public
ONITA R. KING Rates & Regulatory Affairs Tel: 503.721.2452 Fax: 503.721.2516 Email: ork@nwnatural.com August 18, 2016 NWN OPUC Advice No. 16-13A / UG 309 SUPPLEMENT A (UM 1766) VIA ELECTRONIC FILING Public
August 2018 MLS Statistical Report
 January February March April May June July August Septem October Novem Decem August 218 MLS Statistical Report Total Sales Overall, sales are down 3%; however, total volume sold is up 7% and Median Sale
ORANGE COUNTY TRANSPORTATION AUTHORITY. MuniServices - Sales Tax Update. PowerPoint
 ORANGE COUNTY TRANSPORTATION AUTHORITY MuniServices - Sales Tax Update PowerPoint Orange County Transportation Authority Sales Tax Update 3 rd Quarter 2011 February 22, 2012 www.muniservices.com 800.800.8181
GoToBermuda.com. Q3 Arrivals and Statistics at September 30 th 2015
 Q3 Arrivals and Statistics at September 30 th 2015 1 Q3 Total Vacation Visitor Arrivals Q3 Arrivals 2014 2015 YTD 2014 YTD 2015 Air - Vacation 54,305 54,473 0.31% 168 117,639 116,700-0.80% (939) Cruise
Factory activity accelerated further in our region this month, posting its highest composite reading since 2011, said Wilkerson.
 FOR RELEASE Thursday, October 26, 17 EMBARGOED FOR A.M. CENTRAL TIME CONTACT: Pam Campbell 45-27-8617 Pam.Campbell@kc.frb.org TENTH DISTRICT MANUFACTURING ACTIVITY POSTS STRONG GROWTH Federal Reserve Bank
STEEL IMPORTS UP 15% IN 2017 Finished Import Market Share Increased to 27%
 News Release FOR IMMEDIATE RELEASE January 26, 2018 CONTACT Lisa Harrison 202.452.7115/lharrison@steel.org STEEL IMPORTS UP 15% IN 2017 Finished Import Market Share Increased to 27% Washington, D.C. Based