Outlook for Crop Farm Income, Cash Rent, and Farmland Prices. Gary Schnitkey University of Illinois
|
|
|
- Chad Walters
- 5 years ago
- Views:
Transcription
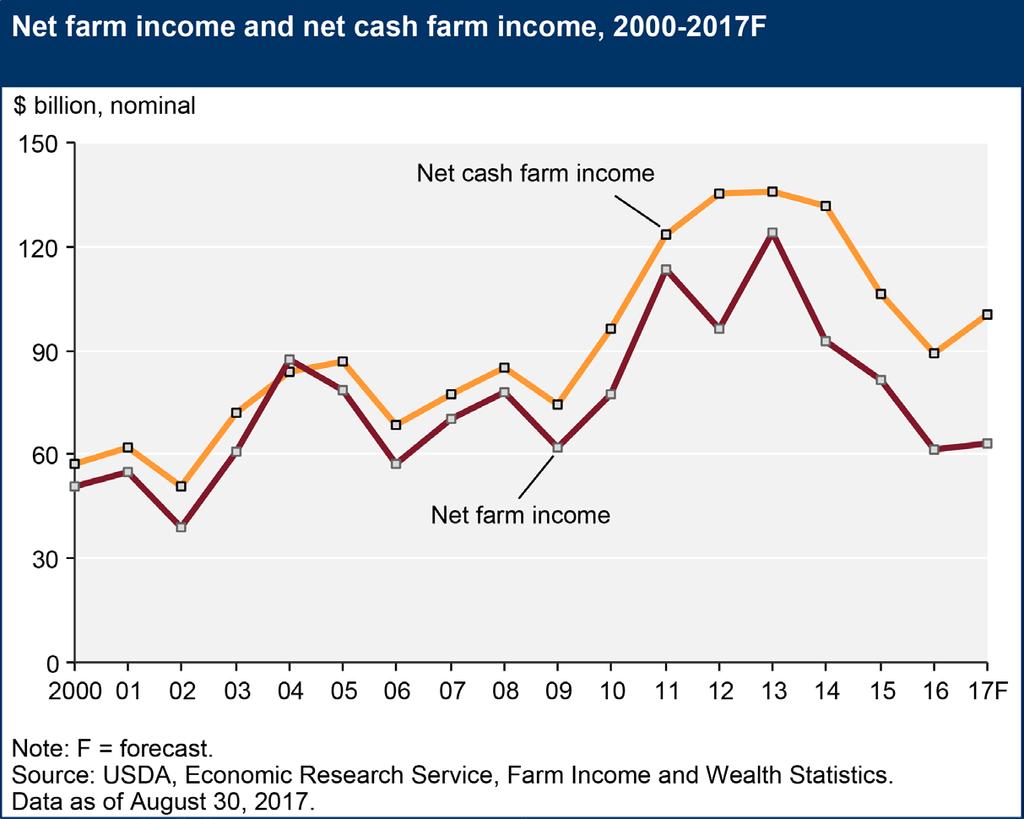
1 Outlook for Crop Farm Income, Cash Rent, and Farmland Prices Gary Schnitkey University of Illinois
2 Net Income on Illinois Grain Farms, , 2017P
3
4 U.S. Corn Yield, U.S. USDA release 2017 forecast on August 10 USDA forecast = bu. per acre Trend yield = bu. per acre
5 Illinois State Yields, Corn USDA release 2017 forecast on August 10 USDA forecast = 188 bu. per acre Trend yield = 178 bu. per acre
6 U.S. Soybean Yields USDA release 2017 forecast on August 10 USDA forecast = 49.4 bu. per acre Trend yield = 46.9 bu. per acre
7
8 Market Year Average Prices and Forecasts Period P 17P 18P Corn ($/bu.) Soybeans ($/bu.) Wheat ($/bu.) Projection for 2016 and 2017 are WASDE projections, 2018 are looking at future markets Fall 2017 bids (east-central Illinois, Sept 8): $3.30 corn $9.45 soybeans
9 ARC-CO Payments, Corn, McLean County Input Agricultural Risk Coverage (ARC) - County County MYA Benchmark ARC ARC Price Loss Coverage (PLC) Year Yield Price 1 Yield 2 Price 3 Guarantee 4 Payment 5 Payment $/a cre $/a cre * Five-Year Average National loan rate equals: 1.95 Reference price equals: 3.70
10 Table 1. Projected 2016 ARC-CO Payments per Base Acre After Sequestion by Crop, Illinois. 1,2,3,4 Soy- Soy- Soy- Corn Beans Wheat Corn Beans Wheat Corn Beans Wheat 2016 ARC-CO Payments (received this fall, still estimates) Corn Payments From $0 to $60 per base acre, more of the highs in southern Illinois Soybean Payments Mostly $0 per base acre Wheat Payments From $0 to mid $0 per base acre Adams Hardin NA 0 NA Morgan Alexander Henderson 25 2 NA Moultrie 39 0 NA Bond NA NA NA Henry Ogle Boone Iroquois Peoria 8 1 NA Brown 15 0 NA Jackson 56 NA NA Perry 49 0 NA Bureau 66 0 NA Jasper Piatt Calhoun NA NA 18 Jefferson 49 0 NA Pike Carroll Jersey Pope NA Cass Jo Daviess Pulaski Champaign Johnson 50 NA NA Putnam Christian Kane Randolph Clark NA NA 34 Kankakee Richland Clay Kendall 26 NA NA Rock Island 31 0 NA Clinton Knox St. Clair Coles NA 0 NA Lake Saline Cook 0 NA NA LaSalle 45 0 NA Sangamon 5 0 NA Crawford NA 0 32 Lawrence NA NA 32 Schuyler Cumberland Lee Scott 0 0 NA DeKalb Livingston Shelby De Witt NA Logan 8 0 NA Stark Douglas McDonough Stephenson DuPage NA NA NA McHenry Tazewell Edgar 51 0 NA McLean Union 51 2 NA Edwards Macon Vermilion 0 0 NA Effingham Macoupin 0 0 NA Wabash Fayette 50 0 NA Madison Warren 5 0 NA Ford 0 0 NA Marion Washington Franklin Marshall 45 0 NA Wayne NA 0 NA Fulton 11 0 NA Mason NA NA NA White Gallatin Massac Whiteside 43 0 NA Greene Menard 48 0 NA Will NA 0 NA Grundy 0 0 NA Mercer 31 0 NA Williamson 57 0 NA Hamilton 56 0 NA Monroe Winnebago Hancock 0 0 NA Montgomery 9 0 NA Woodford

11 Non-land Costs, Corn and Soybeans
12 Costs and Changes, Corn, Central Illinois Year Change $/acre $/acre $/acre $/acre $/acre Non-land costs Fertilizer Seed Pesticides Mach. depreciation Mach. Repair Fuel Non-land interest Cash rent

13 Operator and Land Returns, and Cash Rents, Central Illinois, High-Productivity Farmland
14 Illinois Cash Rents, State

15 Cash Rent by County, 2019 Released by USDA, September 8, cash rents Average cash rents for each county
16
17 Average and Professionally Managed Farmland, Illinois Land Productivity Averages Professionally Managed Farmland 2 (Expected corn yield) P $/acre $/acre $/acre $/acre $/acre State average Excellent (190+ bushels) Good ( bushels) Average ( bushels) Fair (Less than 150 bushels)


18 2017 Illinois Farmland Values & Lease Trends Understanding Our Farmland Categories Using the Productivity Index from the University of Illinois (Bulletin 811). Excellent Productivity 147 to 133 Good Productivity 132 to 117 Average Productivity 116 to 100 Fair Productivity Less than 100 Recreational Tracts Transitional Tracts
19
20 2016 Excellent Quality Farmland Mid Range Land Value Comments Region 1 $10,500 Higher supply of land south of Illinois River led to more decrease there. Some new 1031 exchange money in the market supporting values. Region 2 $11,500 Farmers still the main land buyers. Tight supply. 9 sales still over $12,000/acre. Region 3 $11,000 Low volume with sellers resisting lower prices. Location has become much more important to high sales prices. Region 4 $10,750 Wider range of prices than Bare, square, high percentage tillable bringing a premium. Low volume. Region 5 $10,325 Prices down 5-8%. Same notes as Region 4 on volume and price for premium tracts. Especially strong in Champaign & Douglas Counties. Region 6 $10,525 Down 8-9%. Larger disparity between low priced tracts and high priced sales (Over $4,100/ac). Location important. Region 7 $12,200 This region sustained the high quality land values Region 8 -- Region 9 $10,250 Region $10,880 (average) better than any other region. Auction -March 17 Evidenced by 888 ac.


21 2016 Good Quality Farmland Mid Range Land Value Comments Region 1 $8,200 Prices down ~7%, most found in Will County area. Prices higher in the south and west side of this Region. Region 2 $8,000 Median sales price down 11%. Mostly farmer buyers but investors were picking up opportunities. Wide price range. Region 3 $8,250 Less liquidity than the highest quality farmland. Field shape & percent tillable really influenced price negatively. Region 4 $8,750 Higher volume than Prices declined early and leveled out later. Region 5 $7,950 Sought out by investors and farmers when excellent land seemed not available. Price down~11%. Volume -20%. Region 6 $9,425 Better quality good farms sold in 2016 vs Longer marketing timeframe to move most tracts. Region 7 $8,755 Several option or easement payments being 1031 ed into farmland purchases by local landowners. Region 8 $10,700 The best soils in this region. This average actually rose likely as compared to Region 9 $8,800 Very similar price to Region 10 $8,000 Similar price average to 2015-or a little higher. Wide range in price per acre.
22 AgLetter Chicago FED, August 2017

23 AgLetter Chicago FED, August 2017
24 Land Prices, Illinois
25
26 AgLetter Chicago FED, August 2017
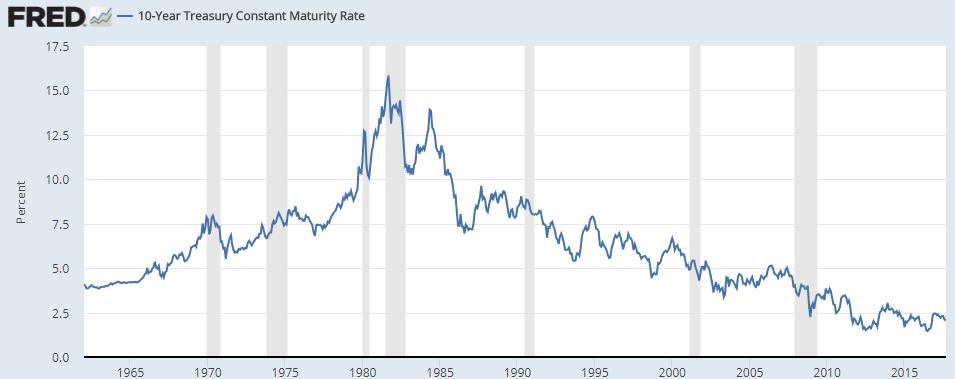
27 Land Prices When will cash rents break if we continue to have below $4.00 corn? Very low interest rates Stable to decreasing land prices unless cash rents decline
Illinois Association of Realtors Sales by County All Sales Year to Date Through December 2007
 All Sales to Date Through December ADAMS ALEXANDER BOND BOONE BROWN BUREAU CALHOUN CARROLL CASS CHAMPAIGN CHRISTIAN CLARK CLAY CLINTON COLES COOK CRAWFORD CUMBERLAND DE KALB DEWITT DOUGLAS DU PAGE EDGAR
Illinois Association of Realtors Sales by County All Sales Year to Date Through December 2006
 All Sales to Date Through December ADAMS ALEXANDER BOND BOONE BROWN BUREAU CALHOUN CARROLL CASS CHAMPAIGN CHRISTIAN CLARK CLAY CLINTON COLES COOK CRAWFORD CUMBERLAND DE KALB DEWITT DOUGLAS DU PAGE EDGAR
Illinois Farm Related Fatalities Listed by County. 01/1986 through 12/2012
 Illinois Farm Related Fatalities 1986-2012 Listed by County 01/1986 through 12/2012 Date Age Sex County Incident Description 12/97 80 M Adams Tractor - Run over while on ground 01/87 59 M Adams Pinned
No Tillage Use for Crop Production in Kentucky Counties in 1996
 No Tillage Use for Crop Production in Kentucky Counties in 1996 G.R. Haszler and G.W. Thomas Two years ago, we reported the status of notillage adoption in Kentucky counties in the year 1994. Now, CTIC
Housing Price Forecasts. Illinois MSAs. Third Quarter, 2017
 Housing Price Forecasts Illinois MSAs Third Quarter, 2017 Presented To Illinois REALTORS From R E A L Regional Economics Applications Laboratory, Institute of Government and Public Affairs University of
County Census Tract Poverty Rate (%)
") Kentucky Census Tracts Below 20% Poverty Rate 2015 Five-Year U.S. Census Estimates Source: Table S1701 Poverty Status in the Past 12 Months, line item titled "Population for whom poverty status is determined."
Kentucky Census Tracts Below 20% Poverty Rate 2015 Five-Year U.S. Census Estimates Source: Table S1701 Poverty Status in the Past 12 Months, line item titled "Population for whom poverty status is determined."
Table E-13 Boat and ATV Registrations for Missouri Counties
 Table E-13 Adair Motor Boats 738 824 898 1,097 1,182 1,264 1,369 1,428 Boat Motors 591 744 882 1,071 1,217 1,360 1,501 1,582 ATV s 61 59 87 172 195 246 298 283 Total 1,390 1,627 1,867 2,340 2,594 2,870
Missouri Soybean Facts
 Missouri Soybean Facts $1,929,659,800: Five-year average value of Missouri soybean production between 2006 and 2010 a Top Soybean Production Regions, 2010 a Rank United States Rank Missouri Counties 1
Population and Components of Change, by County: 1930 through 2003
 29000 Missouri 1930-1940 3,629,367 3,784,664 155,297 586,049 442,789 143,260 12,037 29000 Missouri 1940-1950 3,784,664 3,954,653 169,989 745,523 430,494 315,029-145,040 29000 Missouri 1950-1960 3,954,653
Purdue University Agricultural Safety and Health Program
 Purdue University Agricultural Safety and Health Program 998 Indiana Farm Fatality Summary Compiled by the Purdue University Agricultural Safety and Health Program Agricultural and Biological Engineering
Table A-1 Ohio counties ranked by growth rate from 2010 to 2015 of seniors (population age 60 and older)
") Appendices Table A-1 Ohio counties ranked by growth rate from 2010 to 2015 of seniors (population age 60 and older) Rank County Senior population growth rate Estimated number of seniors 2015 1 Delaware
Appendices Table A-1 Ohio counties ranked by growth rate from 2010 to 2015 of seniors (population age 60 and older) Rank County Senior population growth rate Estimated number of seniors 2015 1 Delaware
Summary of Land Capability Class (LCC) for Iowa counties
 for Iowa counties") Summary of Land Capability Class (LCC) for Iowa counties Compiled from ISPAID 7.3 by Brad Oneal, January 2011 Statewide --* 824293 2.29% 1 3365810 9.37% 2E 6920618 19.26% 2S 536398 1.49% 2W 8673296 24.14%
Summary of Land Capability Class (LCC) for Iowa counties Compiled from ISPAID 7.3 by Brad Oneal, January 2011 Statewide --* 824293 2.29% 1 3365810 9.37% 2E 6920618 19.26% 2S 536398 1.49% 2W 8673296 24.14%
courts of common pleas Juvenile Division
 courts of common pleas Juvenile Division Composite Report for the Entire State Delinquency Traffic Dependency, Neglect or Abuse Unruly Adult Permanent Custody Motion Change of Custody/Visitation Enforce/Modify
Purdue University Agricultural Safety and Health Program
 Purdue University Agricultural Safety and Health Program 999 Indiana Farm Fatality Summary Compiled by the Purdue University Agricultural Safety and Health Program Agricultural and Biological Engineering
2009 Indiana County Highway Department Wage and Salary Survey
 Purdue University Purdue e-pubs Indiana Local Technical Assistance Program (LTAP) Publications Indiana Local Technical Assistance Program (LTAP) 12-2009 2009 Indiana Highway Department Wage and Salary
Jackson, TN MSA 64,640 62,050 2, Johnson City-Kingsport-Bristol, TN-VA CSA 229, ,310 8,
 Labor Force Estimates - United States & Tennessee Release: 1:30 PM CT on 10/25/2018 September, 2018 preliminary Aug. '18 revised Sep. '17 Seasonally Adjusted* Labor Force Employed Unemployed Rate Rate
Population for whom poverty status is determined One race alone All races White Black or African American American Indian/Alaska Native
 Universe: Population for whom poverty is determined All races White Black or African American American Indian/Alaska Native Asian Area Total Number Percent Total Number Percent Total Number Percent Total
Coal Mine Employment by State* (CY )
") Coal Mine Employment by State* (CY 2009 2015) State CY 2009 CY 2010 CY 2011 CY 2012 CY 2013 CY 2014 CY 2015 AK 119 127 136 145 127 123 114 AL 4,415 4,520 4,877 5,114 4,362 3,858 3,300 AR 46 52 94 74 70
Coal Mine Employment by State* (CY 2009 2015) State CY 2009 CY 2010 CY 2011 CY 2012 CY 2013 CY 2014 CY 2015 AK 119 127 136 145 127 123 114 AL 4,415 4,520 4,877 5,114 4,362 3,858 3,300 AR 46 52 94 74 70
Total Affordable Units. Affordable Housing Share. Total Year-
 Planning and Appeal Act: 2013 Report on Statewide Local Government Affordability Alphabetical (determination based on 2011 American Community Survey, 5-year Estimate) Total 1 Abingdon KNOX 3394 1362 1139
1 of 9. Rank RCDT County Name District Name 2014 Need Index
 1 2009780106060 White Wabash & Ohio Valley Sp Ed Dist 12.91591 250,000.00 2 3204625900400 Kankakee Pembroke CCSD 259 9.80815 37,517.50 3 0601609900200 Cook Cicero SD 99 9.13161 139,500.00 4 3003918606161
FY 14 Unduplicated Count of Special Education Students
 FY 14 Unduplicated Count of Special Education The attached excel worksheet provides each LEA with the unduplicated count of special education students as of June 30, 2014. All counts were taken from the
Contemporary Immigration in Iowa: Hispanics, Language, and Foreign Born
 Contemporary Immigration in Iowa: Hispanics, Language, and Foreign Born Iowa Sandra Charvat Burke Community Vitality Center scburke@iastate.edu www.cvcia.org 2 Contents: Contents and Introduction. p. 2
Agricultural Safety and Health Program Indiana Farm Fatality Summary
 Purdue University Agricultural Safety and Health Program 994 Indiana Farm Fatality Summary Compiled by the Purdue University Agricultural Safety and Health Program Agricultural and Biological Engineering
2011 Indiana Agricultural Outlook
 2011 Indiana Agricultural Outlook Corinne Alexander & Chris Hurt hurtc@purdue.edu September 13, 2010 World Economic Growth Ethanol Dollar Value Surprises and Uncertainty! Change Wheat Production 2010 vs.
What Does the March Prospective Plantings Report Mean for the Outlook? Chris Hurt & Corinne Alexander
 What Does the March Prospective Plantings Report Mean for the 2014-2015 Outlook? Chris Hurt & Corinne Alexander hurtc@purdue.edu cealexan@purdue.edu Purdue University April 1, 2014" Webinar: April 1, 2014
World Wheat Supply and Demand Situation
 World Wheat Supply and Demand Situation September 218 Major data source: USDA World Agricultural Supply and Demand Estimates released September 12, 218. Projections will change over the course of the year
World Wheat Supply and Demand Situation October 2018
 World Wheat Supply and Demand Situation October 218 Major data source: USDA World Agricultural Supply and Demand Estimates released October 12, 218. Projections will change over the course of the year
World Wheat Supply and Demand Situation
 World Wheat Supply and Demand Situation November 218 Major data source: USDA World Agricultural Supply and Demand Estimates released November, 218. Projections will change over the course of the year depending
World Wheat Supply and Demand Situation August 2018
 World Wheat Supply and Demand Situation August 218 Major data source: USDA World Agricultural Supply and Demand Estimates released August 1, 218. Projections will change over the course of the year depending
World Wheat Supply and Demand Situation December 2018
 World Wheat Supply and Demand Situation December 218 Major data source: USDA World Agricultural Supply and Demand Estimates released December 11, 218. Projections will change over the course of the year
Upper Midwest Marketing Area -- F.O. 30 State and County Data 1/ (pool pounds) March 2009
 March 2009") and Data 1/ (pool pounds) Idaho Jerome 16 053 R R Minidoka 16 067 R R Idaho Total 16 R 2/ R 2/ Illinois Boone 17 007 31 3,431,362 Carroll 17 015 10 1,222,809 De Kalb 17 037 9 1,698,362 Jo Daviess 17 085
and Data 1/ (pool pounds) Idaho Jerome 16 053 R R Minidoka 16 067 R R Idaho Total 16 R 2/ R 2/ Illinois Boone 17 007 31 3,431,362 Carroll 17 015 10 1,222,809 De Kalb 17 037 9 1,698,362 Jo Daviess 17 085
Crude Oil, Biofuels,, and Implications for Corn and Soybean Markets
 Crude Oil, Biofuels,, and Implications for Corn and Soybean Markets By Dr. Robert Wisner, Emeritus University Professor and Biofuels Economist AgMarketing Resource Center Iowa State University Grain Prices:
Upper Midwest Marketing Area -- F.O. 30 State and County Data 1/ (pool pounds) August 2011
 August 2011") and Data 1/ (pool pounds) Idaho Bear Lake 16 7 4 132,258 Caribou 16 29 R R Franklin 16 41 8 2/ 491,364 2/ Idaho Total 16 12 623,622 Illinois Boone 17 7 29 3,407,324 Carroll 17 15 13 1,586,519 De Kalb 17
and Data 1/ (pool pounds) Idaho Bear Lake 16 7 4 132,258 Caribou 16 29 R R Franklin 16 41 8 2/ 491,364 2/ Idaho Total 16 12 623,622 Illinois Boone 17 7 29 3,407,324 Carroll 17 15 13 1,586,519 De Kalb 17
World Wheat Supply and Demand Situation March 2018
 World Wheat Supply and Demand Situation March 218 Major data source: USDA World Agricultural Supply and Demand Estimates released March 8, 218. Projections will change over the course of the year depending
Fundamentals Driving U.S. Agricultural Prosperity
 Fundamentals Driving U.S. Agricultural Prosperity Chris Hurt Purdue Extension Service March 2013, hurtc@purdue.edu Economic Shock Transition to New-Equilibrium 250 Hypothetical 29 Year Cycle: Index Base
Market Outlook. David Reinbott.
 Market Outlook David Reinbott Agriculture Business Specialist P.O. Box 187 Benton, MO 63736 (573) 545-3516 http://extension.missouri.edu/scott/agriculture.aspx reinbottd@missouri.edu Trending Issues Volatile
HOUSING VOUCHERS FUNDED IN OHIO UNDER PENDING PROPOSALS
 820 First Street NE, Suite 510 Washington, DC 20002 Tel: 202-408-1080 Fax: 202-408-1056 center@cbpp.org www.cbpp.org November 1, HOUSING VOUCHERS FUNDED IN OHIO UNDER PENDING PROPOSALS Due largely to the
Economic and Commodity Market Outlook
 Economic and Commodity Market Outlook August 12, 2016 By Robert Coats, Ph.D. Professor Economics Department of Agricultural Economics and Agribusiness Division of Agriculture University of Arkansas System
Indicators Program. Community and Economic Development. Race and Hispanic Origin in Iowa: Sandra Charvat Burke
 Community and Economic Development Indicators Program Race and Hispanic Origin in Iowa: 1980-2015 Sandra Charvat Burke Findings Although all race groups are estimated to have increased between 2010 and
Georgia 24,403 27,238 26,928-2, % -2, %
 Statewide Unemployment Insurance Initial Claims Georgia 24,403 27,238 26,928-2,835-10.4% -2,525-9.4% County Unemployment Insurance Initial Claims Appling 16 109 140 99-31 -22.1% 10 10.1% Atkinson 18 15
Appendix G: Data Usage
 Appendix G: Data Usage G.1 Instructions for Using Weights For the purposes of design-based (variance) estimation, the data file includes the following design variables: WT_A, WT_C, adjusted survey weights
Districts pay employer normal cost 5-5.3% % % % % % % 0 482
 May 3, 2012 - Updated (see page 46 for details) How will this affect your? Currently, the state pays the employer portion costs. How would shifting this cost back to the true employer school s affect local
No sale Farmers continue to hold tight By Bryce Knorr
 No sale Farmers continue to hold tight By Bryce Knorr Basis in the grain cash market didn t firm everywhere during Thanksgiving week, but overall the trend is for strengthening as growers resist selling
LIGHT TRUCKS June 2009
 June 2009 A collision produces three levels of data: collision, unit (vehicles), and individual. For this reason, readers should pay particular attention to the wording of statements about the data to
Upper Midwest Marketing Area -- F.O. 30 State and County Data* (pool pounds) August 2000
 August 2000") California Butte 6 7 R R Glenn 6 21 15 ** 7,800,306 ** Tehama 6 103 3 1,187,932 Restricted R R California Total 6 18 8,988,238 Illinois Boone 17 7 24 2,977,946 Bureau 17 11 R R Carroll 17 15 22 3,851,694
California Butte 6 7 R R Glenn 6 21 15 ** 7,800,306 ** Tehama 6 103 3 1,187,932 Restricted R R California Total 6 18 8,988,238 Illinois Boone 17 7 24 2,977,946 Bureau 17 11 R R Carroll 17 15 22 3,851,694
Georgia 30,325 26,345 27,946 3, % 2, %
 Statewide Unemployment Insurance Initial Claims Georgia 30,325 26,345 27,946 3,980 15.1% 2,379 8.5% County Unemployment Insurance Initial Claims Appling 16 169 174 157-5 -2.9% 12 7.6% Atkinson 18 29 50
DANGEROUS DRIVING 2007
 May 2008 A collision produces three levels of data: collision, unit (vehicles), and individual. For this reason, readers should pay particular attention to the wording of statements about the data to avoid
SOYBEAN OUTLOOK Midwest & Great Plains/Western Extension Summer Outlook Conference. St. Louis, Missouri
 SOYBEAN OUTLOOK 2014 Midwest & Great Plains/Western Extension Summer Outlook Conference St. Louis, Missouri Jim Hilker Department of Agricultural, Food, And Resource Economics Michigan State University
TABLE B-17 RESIDENT LIVE BIRTHS BY RACE AND HISPANIC ORIGIN OF MOTHER BY COUNTY TOTAL BIRTHS, BIRTH AND GENERAL FERTILITY RATES*: PENNSYLVANIA, 1996
 TABLE B-17 RESIDENT LIVE BIRTHS BY RACE AND HISPANIC ORIGIN OF MOTHER BY COUNTY TOTAL BIRTHS, BIRTH AND GENERAL FERTILITY RATES*: PENNSYLVANIA, 1996 ---------------------------------------------------------------------------------------------------
3. EMPLOYMENT AND EARNINGS
 3. 3. EMPLOYMENT AND EARNINGS The Bureau of Labor Statistics (BLS) in the U.S. Department of Labor publishes state, regional, and national data on employment and earnings. The Employment Cost Index (ECI),
Crop Market Outlook 8/22/2017
 MSU is an affirmativeaction, equal-opportunity employer. Michigan State University Extension programs and materials are open to all without regard to race, color, national origin, gender, gender identity,
*** Applicable to SRO units that do not contain both sanitary (bathroom) and food preparation (kitchen) facilities.
 and food preparation (kitchen) facilities.") P E N N S Y L V A N I A H O U S I N G F I N A N C E A G E N C Y PAGE 1 ADAMS 20% 73,900 10,260 11,720 13,180 14,640 15,820 17,000 18,160 19,340 20,500 20%/FMR 470 256 274 329 380 425 468 512 30% 6/15/2017
P E N N S Y L V A N I A H O U S I N G F I N A N C E A G E N C Y PAGE 1 ADAMS 20% 73,900 10,260 11,720 13,180 14,640 15,820 17,000 18,160 19,340 20,500 20%/FMR 470 256 274 329 380 425 468 512 30% 6/15/2017
Upper Midwest Marketing Area -- F.O. 30 State and County Data 1/ (pool pounds) April 2008
 April 2008") and Data 1/ (pool pounds) Idaho Jerome 16 53 R R Idaho Total 16 R 2/ R 2/ Illinois Boone 17 7 31 3,309,422 Carroll 17 15 5 586,480 De Kalb 17 37 9 1,299,938 Jo Daviess 17 85 39 4,323,059 Kane 17 89 10
and Data 1/ (pool pounds) Idaho Jerome 16 53 R R Idaho Total 16 R 2/ R 2/ Illinois Boone 17 7 31 3,309,422 Carroll 17 15 5 586,480 De Kalb 17 37 9 1,299,938 Jo Daviess 17 85 39 4,323,059 Kane 17 89 10
P E N N S Y L V A N I A H O U S I N G F I N A N C E A G E N C Y PAGE 2 BRADFORD 20% 57,700 8,080 9,240 10,400 11,540 12,480 13,400 14,320 15,240 16,16
 P E N N S Y L V A N I A H O U S I N G F I N A N C E A G E N C Y PAGE 1 ADAMS 20% 68,500 9,600 10,960 12,340 13,700 14,800 15,900 17,000 18,100 19,180 20% 513 240 257 308 356 397 438 479 30% 6/06/2016 14,400
BEAVER 20% 65,600 9,200 10,500 11,820 13,120 14,180 15,220 16,280 17,320 18,360 20%
 P E N N S Y L V A N I A H O U S I N G F I N A N C E A G E N C Y PAGE 1 ADAMS 20% 64,100 9,100 10,400 11,700 13,000 14,040 15,080 16,120 17,160 18,200 20% 477 227 243 292 338 377 416 455 30% 5/01/2014 13,650
P E N N S Y L V A N I A H O U S I N G F I N A N C E A G E N C Y PAGE 2 BRADFORD 20% 57,500 8,280 9,460 10,640 11,820 12,780 13,720 14,660 15,620 16,54
 P E N N S Y L V A N I A H O U S I N G F I N A N C E A G E N C Y PAGE 1 ADAMS 20% 75,100 9,640 11,020 12,400 13,760 14,880 15,980 17,080 18,180 19,260 20% 457 241 258 310 358 399 440 481 30% 6/01/2015 14,500
THIS REPORT CONTAINS ASSESSMENTS OF COMMODITY AND TRADE ISSUES MADE BY USDA STAFF AND NOT NECESSARILY STATEMENTS OF OFFICIAL U.S.
 THIS REPORT CONTAINS ASSESSMENTS OF COMMODITY AND TRADE ISSUES MADE BY USDA STAFF AND NOT NECESSARILY STATEMENTS OF OFFICIAL U.S. GOVERNMENT POLICY Required Report - public distribution Date: GAIN Report
Ohio Agricultural Statistics for 1929
 BULLETN 460 SEPTEMBER, 1930 Ohio Agricultural Statistics for 1929 G. S. Ray } U. S. Department of A. R. Tuttle Agriculture R. E. Straszheim, Ohio Experiment Station OHO AGRCULTURAL EXPERMENT STATON Wooster,
CANCER of the PANCREAS
 CANCER of the PANCREAS Data Highlights The highest 1991-95 average annual age-adjusted incidence rate for pancreatic cancer occurred in black males (14.1). Black females had the second highest rate (10.4).
TRACTOR DAY Friday, August 3, 2018 JD Equipment in London, OH Mary Griffith and Dewey Mann, Assistant Superintendents
 TRACTOR DAY Friday, August 3, 2018 JD Equipment in London, OH Mary Griffith and Dewey Mann, Assistant Superintendents Contest is held at JD Equipment in London, OH. The address is: 1660 U.S. 42 London,
Corn Outlook. David Miller Director of Research & Commodity Services Iowa Farm Bureau Federation December 2013
 Corn Outlook David Miller Director of Research & Commodity Services Iowa Farm Bureau Federation December 2013 Source: USDA-WAOB U.S. Corn Supply & Usage U.S. Corn Supply & Usage Comments With the largest
Year Over Year Unemployment Rates Decline Or Hold Steady In All 12 Wisconsin Metro Areas For 58 th Consecutive Month
 Department of Workforce Development Secretary s Office 201 E. Washington Avenue P.O. Box 7946 Madison, WI 53707 Telephone: (608) 266-3131 Fax: (608) 266-1784 Email: sec@dwd.wisconsin.gov Scott Walker,
CANCER of the ESOPHAGUS
 CANCER of the ESOPHAGUS Data Highlights As with other tobacco and alcohol-related cancers, blacks, especially males, had the highest average annual (1991-95) ageadjusted incidence rates 15.1, compared
17. HEALTH AND VITAL STATISTICS
 17. 17. HEALTH AND VITAL STATISTICS Tables of this chapter primarily refer to resident data. These include all births or deaths of residents of the specific area, regardless of the place of occurrence.
FIGURE 23 Average Annual Age-Adjusted Incidence and Mortality Rates* by Sex and Race, Pennsylvania Residents,
 MULTIPLE MYELOMA Data Highlights Incidence rates for multiple myeloma reported from the National Cancer Institute's SEER Program show the highest risks in blacks. The 1992-96 average annual age-adjusted
Ohio's Transportation Stimulus Projects. County Project Description Stimulus Funds
 District 1 Allen City of Lima; Rail Highway Safety Upgrade $ 11,000,000 Allen ODOT; Repair/Replace Deteriorated Median Barrier on I 75 and Hancock 68 $ 839,000 Defiance City of Defiance; Roadway/Bridge
P E N N S Y L V A N I A H O U S I N G F I N A N C E A G E N C Y PAGE 1 MTXR044 9:53:16 COUNTY-WIDE
 P E N N S Y L V A N I A H O U S I N G F I N A N C E A G E N C Y PAGE 1 ADAMS 20% 68,300 9,580 10,940 12,300 13,660 14,760 15,860 16,940 18,040 19,120 20%/FMR 413 239 256 307 355 396 437 478 40% 2/09/2012
CANCER of the PANCREAS
 CANCER of the PANCREAS Data Highlights The highest 1992-96 average annual age-adjusted incidence rate for pancreatic cancer occurred in black males (13.9). Black females had the second highest rate (10.5).
CANCER of the KIDNEY and RENAL PELVIS
 CANCER of the KIDNEY and RENAL PELVIS Data Highlights There were 1,695 cases of cancer of the kidney and renal pelvis diagnosed in 1997 among residents of Pennsylvania, the highest annual number since
CrossRail Chicago. CrossRail Chicago, a modern vision for transportation in our region. 1:00 1:00. Union Station 0:30 1:00
 To Madison To Milwaukee 1:00 Rockford Belvidere Gurnee Travel Time from Union 1:00 Winnebago Boone 20 McHenry Lake Deerfield Ogle DeKalb Kane 47 Elgin Hoffman Estates Schaumburg DuPage Arlington Heights
Basis gains despite transport woes Floods shut river system while congestion snarls rail traffic to Mexico By Bryce Knorr
 Basis gains despite transport woes Floods shut river system while congestion snarls rail traffic to Mexico By Bryce Knorr Transportation problems at harvest are nothing new for farmers, but when they occur
462 CENSUS OF AGRICULTURE-OHIO
 462 CENSUS OF AGRICULTURE-OHIO CouNTvTAsLE IV:-SPECIFIED CLASSES OF LIVESTOCK ON FARMS AND RANCHES, APR. 1, 1940 [The 1936 figures are in italics as they are not exactly (For definitions: ITEM nfarms reporting,"
Wednesday, April 20, 2016
 Wednesday, April 20, 2016 MARCH 2015-MARCH 2016 REVENUE VARIANCE % CHANGE $8.6 4.3% $1.7 2.7% -$0.8-6.1% $0.3 6.3% $-21.3-53.4% $1.7 73.9% $-0.6 5.0% $-10.4-3.3% $365.0 $315.0 $311.2 $300.8 $265.0 $215.0
FIGURE 5 Average Annual Age-Adjusted Incidence and Mortality Rates* by Sex and Race, Pennsylvania Residents,
 CANCER of the COLON Data Highlights There were 7,011 resident cases of colon cancer diagnosed in 1996. It was the third most common cancer site among both males and females, accounting for over 10 percent
Soybean Farming Pays the BILLS
 J. J. Production Soybean Farming Pays the BILLS Farmer Joe is an average Illinois Soybean Farmer. His farm has 36 acres for soybean planting. Soybeans are weighed by the bushel. The crop yield is how many
Georgia Labor Force Estimates
 Labor Force Estimates (Seasonally adjusted) (Not seasonally adjusted) Albany MSA Athens -Clarke County MSA Atlanta MSA Augusta-Richmond County MSA Brunswick MSA Columbus MSA Dalton MSA Gainesville MSA
HOME HEALTH STAFFING CENSUS STATEWIDE FIGURES
 STATEWIDE FIGURES Month: Unskilled Unskilled HCS Totals: 3179 822 26% 32 88.5 11 7 11.15 Average Totals: 36 29 27 110 Unskilled Unskilled AREA 1 HCS Northwest 145 40 28% 1 6 3 0 1 Marion 109 20 18% 1 4
ECONOMIC BENEFITS AND CHALLENGES TO BIOFUELS EXPANSION* Otto C. Doering III and Chris Hurt Purdue University Lafayette, IN
 ECONOMIC BENEFITS AND CHALLENGES TO BIOFUELS EXPANSION* Otto C. Doering III and Chris Hurt Purdue University Lafayette, IN Introduction There is not a question of whether there will be biofuels expansion;
Corn & Bean Producers-1
 Largest Corn Producing Countries - 2016 est. Largest Corn Importing Countries - 2016 est. (Marketing year - thousands of hectares, tons per hectare, and thousands of metric tons) (Marketing year - thousands
290 CENSUS OF AGRICULTURE-ALABAMA
 290 CENSUS OF AGRICULTURE-ALABAMA CoUNTYTABLE L-FARMS, FARM ACREAGE, AND VALUE, BY COLOR OF OPERATOR, 19, OF BUILDINGS AND IMPLEMENTS 1 2 3 4 5 6 7 8 9 10 11 12 13 14 15 16 17 18 19 20 21 22 23 25 26 27
USDA Projections of Bioenergy-Related Corn and Soyoil Use for
 USDA Projections of Bioenergy-Related Corn and Soyoil Use for 2010-2019 Daniel M. O Brien, Extension Agricultural Economist K-State Research and Extension The United States Department of Agriculture released
AUDITED SCHOOL ENROLLMENTS SCHOOL BOYS9 BOYS10 BOYS11 BOYS12 BOYSSPEC GIRLS9 GIRLS10 GIRLS11 GIRLS12 GIRLSPEC ENR ENROLL4G ENROLL3G ENRO911
 Riverside Christian 3 6 2 2 0 4 3 3 3 0 1 26 19 21 13 26 13 232 Kentucky School f/t Blind 5 4 7 2 1 3 2 7 3 1 1 35 27 30 19 35 19 143 Valor Traditional 5 3 4 8 0 3 4 5 4 0 1 36 28 24 20 36 20 335 June
AUDITED SCHOOL ENROLLMENTS SCHOOL BOYS9 BOYS10 BOYS11 BOYS12 BOYSSPEC GIRLS9 GIRLS10 GIRLS11 GIRLS12 GIRLSPEC ENR ENROLL4G ENROLL3G ENRO911
 Valor Traditional 2 2 6 2 0 3 3 2 3 0 1 23 18 18 12 23 12 335 Riverside Christian 6 4 2 1 0 5 3 3 0 0 1 24 13 23 13 24 13 232 Kentucky School f/t Blind 5 6 1 3 0 5 8 0 3 3 1 34 24 28 15 34 15 143 Rose
Iowa State University Extension
 Iowa State University Extension Dr. Robert Wisner, University Professor & Extension Economist Dr. Robert Wisner: Grain Outlook Biofuels Update & Outlook 3/15/06 11/27/07 Global Biofuels Developments Dramatic
Georgia Labor Force Estimates
 Labor Force Estimates (Seasonally adjusted) (Not seasonally adjusted) Albany MSA Athens -Clarke County MSA Atlanta MSA Augusta-Richmond County MSA Brunswick MSA Columbus MSA Dalton MSA Gainesville MSA
Georgia Labor Force Estimates
 Labor Force Estimates (Seasonally adjusted) (Not seasonally adjusted) Albany MSA Athens -Clarke County MSA Atlanta MSA Augusta-Richmond County MSA Brunswick MSA Columbus MSA Dalton MSA Gainesville MSA
FIGURE 10 Average Annual Age-Adjusted Incidence and Mortality Rates* by Sex and Race, Pennsylvania Residents,
 MELANOMA of the SKIN Data Highlights Average annual (1991-95) age-adjusted incidence rates for melanoma of the skin among white males and females were 11. and 7., respectively; while among black males
ELEMENTARY HS UNIT QUARTILE RANKING RANKING RANKING
 REGION 1 - ADAMS / BROWN / CASS / MORGAN / PIKE / SCOTT ADAMS COUNTY 01-001-0010-26 Payson CUSD 1 $130,159 520.87 $249.89 179 2 01-001-0020-26 Liberty CUSD 2 $149,954 523.58 $286.40 150 2 01-001-0030-26
Georgia Labor Force Estimates
 Georgia Labor Force Estimates Status Preliminary APR 2009 Georgia (Seasonally adjusted) Georgia (Not seasonally adjusted) Albany MSA Athens-Clarke County MSA Atlanta MSA Augusta-Richmond County MSA Brunswick
External Market Factors Impacting US Soybean Meal
 External Market Factors Impacting US Soybean Meal USSEC Luncheon International Production and Processing Expo January 3, 213 Atlanta, GA Paul Smolen Presentation Objectives Examine the economic drivers
CHARTS AND PRICE PROJECTIONS
 CHARTS AND PRICE PROJECTIONS 18 / Charts and Price Projections: FAPRI 27 Agricultural Outlook Average Annual GDP Growth Percent Change 9 8 7 6 4 3 2 1 26-216 Canada China EU NMS EU- India Japan Latin America
Georgia Labor Force Estimates
 Labor Force Estimates (Seasonally adjusted) (Not seasonally adjusted) Albany MSA Athens -Clarke County MSA Atlanta MSA Augusta-Richmond County MSA Brunswick MSA Columbus MSA Dalton MSA Gainesville MSA
Georgia Labor Force Estimates
 Labor Force Estimates (Seasonally adjusted) (Not seasonally adjusted) Albany MSA Athens -Clarke County MSA Atlanta MSA Augusta-Richmond County MSA Brunswick MSA Columbus MSA Dalton MSA Gainesville MSA
Impact of Ethanol on Iowa s Transportation System
 Impact of Ethanol on Iowa s Transportation System Legislative Agriculture Chairs Summit VI St Louis, MO January 18-20, 2008 Craig O Riley, Office of Systems Planning 1 Discussion Topics Agricultural Trends
TOOL #5: C&S WASDE PRICE STUDY FOR DECEMBER CORN 7/09/10 For the July 9 th to the August 12 th time frame for CZ 2010
 TOOL #5: C&S WASDE PRICE STUDY FOR DECEMBER CORN 7/09/10 For the July 9 th to the August 12 th time frame for CZ 2010 Brief summary: In the month ahead, my best estimate is that CZ 2010 could trade in
Heightened Expectations
 Q 0 INDUSTRIAL BIG BOX THE BIG BOX REPORT A SNAPSHOT OF S BULK WAREHOUSE DISTRIBUTION TRENDS Heightened Expectations MARKET SNAPSHOT > > The Chicago big box inventory base consists of 40 facilities totaling
Agricultural and Construction Equipment 2014 Outlook
 Agricultural and Construction Equipment 2014 Outlook Federal Reserve Bank of Chicago 2013 Outlook Symposium December 6, 2013 Agenda Agricultural Machinery Current Situation Demand Factors 2014 Outlook
Statistical Data
 Statistical Data 2008-2009 Research and Effectiveness Division 3825 Ridgewood Rd Jackson, MS 39211 Voice: 601 432-6373 Fax: 601-432-6363 Email: RFletes@mccb.edu CONTENTS Title Page Foreword 2 Credit Enrollment
Tennessee Soybean Producers Views on Biodiesel Marketing
 Tennessee Soybean Producers Views on Biodiesel Marketing By Kim Jensen, Burton English, and Jamey Menard* April 2003 *Professors and Research Associate, respectively, Department of Agricultural Economics,
Greater Albuquerque Area Monthly Housing Trends vs. 2017
 Month Greater Albuquerque Association of REALTORS Greater Albuquerque Area Monthly Housing Trends - 2016 vs. 2017 Class R1 (Existing Single-Family Detached) and Class R2 (Existing Condo/Townhome Attached)