POINTS TO COVER UNCONVENTIONAL OIL AND GAS AND THE SHALE REVOLUTION: GAME CHANGER 4/16/2014. If we don t screw it up! Context Implications Risks
|
|
|
- Roxanne Hunter
- 5 years ago
- Views:
Transcription
1 UNCONVENTIONAL OIL AND GAS AND THE SHALE REVOLUTION: GAME CHANGER If we don t screw it up! POINTS TO COVER Context Implications Risks April 11 1


2 You can always count on Americans to do the right thing -- After they ve tried everything else. April 11 2


3 CONTEXT US FOREIGN POLICY DRIVEN BY THESE EVENTS FOR THE PAST 40 YEARS April 11 3


4 WE HAD TO ENDURE MANY DIFFICULTIES BACK TO THE FUTURE Iranian oil is off the market Libya production is virtually zero Egyptian oil output is down Iraqi output is reduced April 11 4
 Forecast 3.50 3.00 2.50 2.00 1.50 1.00 0.50 0.")
5 BACK TO THE FUTURE Iranian oil is off the market Libya production is virtually zero Iraqi output is reduced Egyptian output is reduced 4.00 Annual Motor Gasoline Regular Grade Retail Price dollars per gallon Nominal Price Real Price (Jan 2014 $) Forecast EIA Short-Term Energy Outlook, January 2014 April 11 5
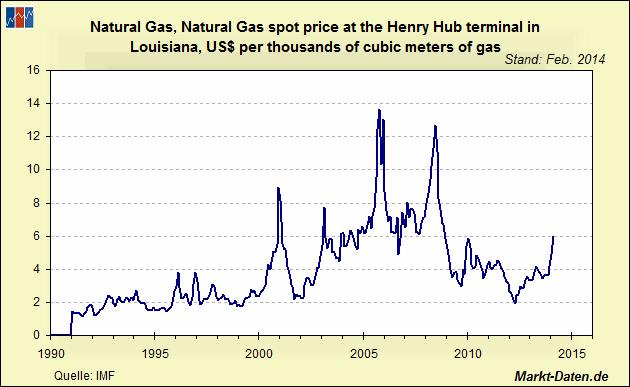
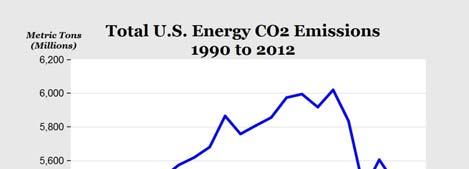
6 SO, WHAT S GOING ON? The improving economy? The large reduction in the balance of trade deficit? The US manufacturing renaissance? US Carbon Footprint down to early 1990 s level? ANSWER: DOMESTIC OIL AND GAS PRODUCTION FROM SHALE. April 11 6


7 CONTEXT Directional Change in the Oil and Gas Industry April 11 7


8 E&P CAPEX MOVED ONSHORE Offshore Onshore WHY THE SHIFT TO ONSHORE? Cost Production costs versus price for produced product Permitting Lack of access to promising offshore fields Risk profile Reaction to Government Policy April 11 8

9 WHY THE SHIFT TO ONSHORE? Cost Production costs versus price for produced product Lack of access to promising offshore fields Risk profile Reaction to Government Policy WHO DROVE THE MOVE ONSHORE? Not the Majors Shell, BP, ExxonMobil, Chevron, etc. Small, Independent Producers Continental Resources, EOG, Whiting Oil, Marathon, Range Resources, etc. Why is that important? Appetite for risk Access to capital April 11 9


10 WHAT IS THE DIFFERENCE BETWEEN CONVENTIONAL AND UNCONVENTIONAL? April 11 10


11 TECHNOLOGY Moore s Law Analytics Telemetry Remote monitoring Making mechanical devises smart (SCADA) ENABLING TECHNOLOGIES: 3 D SEISMIC April 11 11


12 ROTARY STEERABLE DRILLING HYDRAULIC FRACTURING April 11 12


13 HOW DOES HYDRAULIC FRACTURING WORK? WHAT IS THIS STUFF THEY FRACK WITH? April 11 13
14 IMPLICATIONS US OIL PRODUCTION ON THE RISE April 11 14

15 US OIL PRODUCTION ON THE RISE US OIL PRODUCTION ON THE RISE April 11 15

16 DROP IN CRUDE IMPORTS HELPING BALANCE OF TRADE REDUCING THE TRADE GAP The US produced 6.5 million barrels of oil per day in 2012, according to the US Energy Information Administration (EIA). That is expected to rise to 9.6 million barrels of oil per day in 2019, largely on account of new drilling techniques that tap oil in low-permeability rock formations. Production will level off at or above about 7.5 million barrels per day through 2040, EIA projects. The new oil and gas production helped lower the trade gap by 12.9 percent to $34.3 billion in November. Source: Christian Science Monitor, 11/13 April 11 16
17 JOB GROWTH (thousands) Source: Bureau of Labor Statistics WHERE ARE THE OPPORTUNITIES? NORTH AMERICA April 11 17
18 WHERE ARE THE OPPORTUNITIES? NORTH AMERICA WHERE ARE THE OPPORTUNITIES? GLOBAL April 11 18
19 WHERE ARE THE OPPORTUNITIES? GLOBAL TOP 10 COUNTRIES WITH TECHNICALLY RECOVERABLE SHALE OIL AND GAS RESOURCES Rank Country Shale Oil (billions barrels) Rank Country Shale Gas (trillion cubic feet) 1 Russia 75 1 China 1,115 2 United States 58 2 Argentina China 32 3 Algeria Argentina 27 4 United States Libya 26 5 Canada Australia 18 6 Mexico Venezuela 13 7 Australia Mexico 13 8 South Africa Pakistan 9 9 Russia Canada 9 10 Brazil 245 Source: Source: EIA EIA World Total 345 World Total 7,299 April 11 19
20 TOP 10 COUNTRIES WITH TECHNICALLY RECOVERABLE SHALE OIL AND GAS RESOURCES Rank Country Shale Oil (billions barrels) Rank Country Shale Gas (trillion cubic feet) 1 Russia 75 1 China 1,115 2 United States 58 2 Argentina China 32 3 Algeria Argentina 27 4 United States Libya 26 5 Canada Australia 18 6 Mexico Venezuela 13 7 Australia Mexico 13 8 South Africa Pakistan 9 9 Russia Canada 9 10 Brazil 245 World Total 345 World Total 7,299 Source: EIA TOP 10 COUNTRIES WITH TECHNICALLY RECOVERABLE SHALE OIL AND GAS RESOURCES Rank Country Shale Oil (billions barrels) Rank Country Shale Gas (trillion cubic feet) 1 Russia 75 1 China 1,115 2 United States 58 2 Argentina China 32 3 Algeria Argentina 27 4 United States Libya 26 5 Canada Australia 18 6 Mexico Venezuela 13 7 Australia Mexico 13 8 South Africa Pakistan 9 9 Russia Canada 9 10 Brazil 245 World Total 345 World Total 7,299 Source: EIA April 11 20
 1 Russia 75 1 China 1,115 2 United States 58 2 Argentina 802 3 China")


21 TOP 10 COUNTRIES WITH TECHNICALLY RECOVERABLE SHALE OIL AND GAS RESOURCES Rank Country Shale Oil (billions barrels) Rank Country Shale Gas (trillion cubic feet) 1 Russia 75 1 China 1,115 2 United States 58 2 Argentina China 32 3 Algeria Argentina 27 4 United States Libya 26 5 Canada Australia 18 6 Mexico Venezuela` 13 7 Australia Mexico 13 8 South Africa Pakistan 9 9 Russia Canada 9 10 Brazil 245 World Total 345 World Total 7,299 Source: EIA GEOPOLITICAL IMPLICATIONS Less dependent on Middle East and North Africa for oil Reduced resource competition among superpowers Europe could be less dependent on Russia for natural gas April 11 21

22 GEOPOLITICAL IMPLICATIONS GEOPOLITICAL IMPLICATIONS April 11 22


23 ENVIRONMENTAL IMPLICATIONS ENVIRONMENTAL IMPLICATIONS April 11 23


24 SO WHO BENEFITS? GEARS AND BEARINGS Upstream Oil and Gas Midstream Downstream April 11 24


25 GEARS AND BEARINGS Upstream Oil and Gas Midstream Downstream GEARS AND BEARINGS Upstream Oil and Gas Midstream Downstream April 11 25


26 GEARS AND BEARINGS Upstream Oil and Gas Midstream Downstream OTHER INDUSTRIES LIKELY TO BENEFIT Steel Ship Building Plastics Mining April 11 26

27 RISKS More than any other time in history, mankind faces a crossroads. One path leads to despair and utter hopelessness. The other, to total extinction. April 11 27


28 Let us pray we have the wisdom to choose correctly. RISKS Risk 1 April 11 28

29 RISKS Risk 1 Risk 2 METHANE EMISSIONS WSJ article March 28, 2014 April 11 29


30 RISKS Risk 1 Risk 2 Risk 3 UNINTENDED CONSEQUENCES April 11 30

31 RISKS Risk 4 Activists RISKS Risk 4 Activists Risk 5 Oil Prices April 11 31
32 EIA Short-Term Energy Outlook,January 2014 Annual Average Imported Crude Oil Price Return to Contents Consumer Price Imported Crude Oil Price ($/barrel) Year Index ( =1) Nominal Real Base CPI (1/2014) EIA Short-Term Energy Outlook, January 2014 Forecast / estimated values shown in blue Real Price (Jan 2014 $) See Notes and Sources for more information EIA Short-Term Energy Outlook,January 2014 Annual Average Imported Crude Oil Price Return to Contents Consumer Price Imported Crude Oil Price ($/barrel) Year Index ( =1) Nominal Real Base CPI (1/2014) EIA Short-Term Energy Outlook, January 2014 Forecast / estimated values shown in blue Real Price (Jan 2014 $) See Notes and Sources for more information 4/16/2014 Annual Imported Crude Oil Price dollars per barrel Nominal Price Real Price (Jan 2014 $) Forecast EIA Short-Term Energy Outlook, January 2014 Annual Imported Crude Oil Price dollars per barrel Nominal Price Real Price (Jan 2014 $) Economic Threshold for US Unconventional Oil Forecast EIA Short-Term Energy Outlook, January 2014 April 11 32


33 MISGUIDED GOVERNMENT POLICY Political Pandering Misunderstanding economics The best argument against democracy... April 11 33

34 Is a five-minute discussion with the average voter. QUESTIONS April 11 34
For Region 5 and Region 7 Regional Response Teams Meeting April 22, 2015 St. Charles, Missouri via video/teleconference
 For Region 5 and Region 7 Regional Response Teams Meeting St. Charles, Missouri via video/teleconference By Grant Nülle, Upstream Oil & Gas Economist, Exploration and Production Analysis Team U.S. Energy
Petroleum and Natural Gas Outlook
 Petroleum and Natural Gas Outlook Energy Summit 26: Developing and Supporting Critical Energy Infrastructures at the LSU Center for Energy Studies Baton Rouge, Louisiana October 2, 26 A. Michael Schaal,
World Geographic Shares
 World Geographic Shares North America South America Europe Africa Asia Australia/ Oceania 18% 13% 7% 22% 33% 6% World Population Shares North America South America Europe Africa Asia Australia/ Oceania
ENERGY SLIDESHOW. Federal Reserve Bank of Dallas
 ENERGY SLIDESHOW Updated: January 16, 2019 ENERGY PRICES www.dallasfed.org/research/energy Brent & WTI & Crude Brent Oil Crude Oil Dollars per barrel 140 120 100 Brent (Jan 11 = $58.64) WTI (Jan 11 = $50.78)
The Supply of Oil. Projections to Oil and the Macroeconomy in a Changing World Federal Reserve Bank of Boston June 9, 2010 Boston, MA
 The Supply of Oil Projections to 2035 Oil and the Macroeconomy in a Changing World Federal Reserve Bank of Boston June 9, 2010 Boston, MA Howard Gruenspecht, Deputy Administrator Near-term oil price uncertainty
The Outlook for Energy:
 The Outlook for Energy: A View to 2040 Paul L. Tanaka November 9, 2015 This presentation includes forward-looking statements. Actual future conditions (including economic conditions, energy demand, and
ENERGY SLIDESHOW. Federal Reserve Bank of Dallas
 ENERGY SLIDESHOW Updated: March 13, 2018 ENERGY PRICES www.dallasfed.org/research/energy Brent & WTI & Crude Brent Oil Crude Oil Dollars per barrel 140 Brent (Mar 9 = $65.12) WTI (Mar 9 = $61.65) 120 100
May 2018 Short-Term Energy Outlook
 May 2018 for Williston Basin Petroleum Conference Bismarck, N.D. by Dr. Linda Capuano Administrator U.S. Energy Information Administration Independent Statistics & Analysis www.eia.gov Brent crude oil
UK Continental Shelf (UKCS) Oil and Gas Production and the UK Economy. Mike Earp
 Oil and Gas Production and the UK Economy. Mike Earp") UK Continental Shelf (UKCS) Oil and Gas Production and the UK Economy Mike Earp 15 June 215 Outline Production and Reserves Expenditure, Income and Taxation Gross Value Added Trade Recent Production History
UK Continental Shelf (UKCS) Oil and Gas Production and the UK Economy Mike Earp 15 June 215 Outline Production and Reserves Expenditure, Income and Taxation Gross Value Added Trade Recent Production History
Emerging Trends in Petroleum Markets
 Emerging Trends in Petroleum Markets For Defense Logistics Agency, Worldwide Energy Conference Washington, D.C. By T. Mason Hamilton, Petroleum Markets Analyst U.S. Energy Information Administration Independent
U.S. Rail Crude Oil Traffic
 U.S. Rail Crude Oil Traffic Association of American Railroads November 215 Summary U.S. crude oil production has risen sharply in recent years, with much of the increased output moving by rail. In 28,
Implications of the U.S. Shale Revolution
 Implications of the U.S. Shale Revolution For October 17, 214 Chicago, Illinois By Adam Sieminski, Administrator U.S. Energy Information Administration U.S. Energy Information Administration Independent
The Alliance October 23, 2008
 The Alliance October 23, 2008 Energy Security Erec Isaacson Vice President, Commercial Assets ConocoPhillips Alaska, Inc. Cautionary Statement FOR THE PURPOSES OF THE SAFE HARBOR PROVISIONS OF THE PRIVATE
Petroleum Geopolitics at the beginning of the 21 st century
 Petroleum Geopolitics at the beginning of the 21 st century JP. Favennec Director - Center for Economics and management Institut français du pétrole 26 th Annual Conference International Association for
OPEC PRIMARY ENERGY CONSUMPTION IN 2005 (1)
") CHAPTER 4 I n 1384, political tensions in the Middle East and some oil-producing countries, sabotage in Iraq s oil industry and speculation in the market raised oil prices incrementally. As of the beginning
CHAPTER 4 I n 1384, political tensions in the Middle East and some oil-producing countries, sabotage in Iraq s oil industry and speculation in the market raised oil prices incrementally. As of the beginning
Global Monthly March 2019
 Global Monthly March 19 Percent of world bonds outstanding 3 5 15 5 Jan-1 Jun-1 Nov-1 Apr-15 Sep-15 Feb-1 Jul-1 Dec-1 May-17 Oct-17 Mar-1 Aug-1 Dec-1 Mar-19 March 19 Percent, year-on-year 7 5 3 1 1Q1 1Q
U.S. Rail Crude Oil Traffic
 U.S. Rail Crude Oil Traffic Association of American Railroads May 217 Summary U.S. crude oil production has risen sharply in recent years, with much of the increased output moving by rail. In 28, U.S.
Oil and gas prices down off 2008 highs
 Oil and gas prices down off 28 highs $ US$ per per barrel barrel US$ $ per thousand cubic feet 16 9 14 8 12 7 Natural gas (wellhead) 6 1 (Right) 5 8 4 6 3 4 2 Crude oil 2 (Left) 1 198 1985 199 1995 2 25
SHALE-ADVANTAGED CHEMICAL INDUSTRY INVESTMENT
 9 April 2013 SHALE-ADVANTAGED CHEMICAL INDUSTRY INVESTMENT Martha Gilchrist Moore Sr. Director, Policy Analysis and Economics Shale Gas Shale gas is possibly the most important energy development in the
The Outlook for Energy: A View to 2040
 The Outlook for Energy: A View to 24 Dr. David Khemakhem Riyadh, Kingdom of Saudi Arabia March 25, 213 This presentation includes forward-looking statements. Actual future conditions (including economic
World Energy Investment 2017
 World Energy Investment 217 Economics and Investment Office IEA OECD/IEA 217 USD (216) billion Global energy investment fell 12% in 216, a second consecutive year of decline 1 75 5-1% Networks Global energy
Oil Industry Trends. Rob Arnott. 26 th January /29/2004 1
 Oil Industry Trends Rob Arnott 26 th January 2004 3/29/2004 1 Oil Industry Trends Overview of global industry trends Regional costs and capital migration Industry costs and implications Why is further
Methodology. Supply. Demand
 Methodology Supply Demand Tipping the Scale 1 Overview Latin America and the Caribbean, a major petroleum product importing region, provides an important counterbalance to surpluses in refined product
Energy Outlook. U.S. Energy Information Administration. For EnerCom Dallas February 22, 2018 Dallas, TX
 Energy Outlook For EnerCom Dallas Dallas, TX Jeff Barron Industry Economist, U.S. Energy Information Administration U.S. Energy Information Administration Independent Statistics & Analysis www.eia.gov
COMPETITION FOR FOREIGN INVESTMENT IN E&P IN LATIN AMERICA
 COMPETITION FOR FOREIGN INVESTMENT IN E&P IN LATIN AMERICA Prof. Edmar de Almeida Energy Economics Group Institute of Economics Federal University of Rio de Janeiro Workshop The Changing Global Energy
1. Introduction Regional Analysis...4
 Table of Contents i Table of Contents 1. Introduction...1 1.1 Opportunities for international manufacturers...1 1.2 Objectives and structure of this report...2 2. Regional Analysis...4 2.1 Description
Market Report Series: Oil 2018 Analysis & Forecasts to Energy Community 10 th Oil Forum, Belgrade, 25 September 2018
 Market Report Series: Oil 218 Analysis & Forecasts to 223 Energy Community 1 th Oil Forum, Belgrade, 25 September 218 Short term update: crude prices (excl. WTI) up strongly Aug/Sep $/bbl 8 Benchmark Crude
The Outlook for Energy: A View to 2040
 The Outlook for Energy: A View to 24 Todd Onderdonk June 213 This presentation includes forward-looking statements. Actual future conditions (including economic conditions, energy demand, and energy supply)
2007 atmospheric distillation capacity, top petroleum companies top petroleum companies by natural gas production
 International comparisons 28 proved crude oil reserves, selected countries 28 proved natural gas reserves, selected countries 28 crude oil production, selected countries 28 natural gas production, selected
Fuel Use in Electricity Generation The changing landscape
 Fuel Use in Electricity Generation The changing landscape for Bipartisan Policy Center: Understanding the New Energy Landscape June 27, 212 Washington, DC, Director, Office Electricity, Coal, Nuclear and
Evolving Global Oil Trade Flows. IEA-IEF-OPEC Joint Meeting Vienna, March 2018
 Evolving Global Oil Trade Flows IEA-IEF-OPEC Joint Meeting Vienna, March 2018 SHIFTING FLOWS: WHAT HAS THIS MEANT IN PRACTICE? US/Europe crude imports & exports Saudi crude to Poland Chinese teapots importing
Technical Session: Crude Oil Supply High Quality Competitive Distillate Fuels from Coal-to-Liquids Processing
 Technical Session: Crude Oil Supply High Quality Competitive Distillate Fuels from Coal-to-Liquids Processing NPRA Annual Meeting March 20, 2007 Mark Landrum / Jon Warzel BAKER & O BRIEN Incorporated,
AN ECONOMIC AND ENVIRONMENTAL ASSESSMENT OF EASTERN CANADIAN CRUDE OIL IMPORTS
 Study No. 167 CANADIAN ENERGY RESEARCH INSTITUTE AN ECONOMIC AND ENVIRONMENTAL ASSESSMENT OF EASTERN CANADIAN CRUDE OIL IMPORTS Canadian Energy Research Institute Relevant Independent Objective An Economic
Global Monthly February 2018
 Global Monthly February 18 3 1-year Treasury yields 1-year breakeven inflation rate 1 1 15 16 17 18 February 18 5 3 Global GDP growth Composite PMI (RHS) Index 56 5 5 1 5 1 13 1 15 16 17 18 3..5. 1.5 1.
A summary of national and global energy indicators. FEDERAL RESERVE BANK of KANSAS CITY
 THE U.S. Energy DATABOOK A summary of national and global energy indicators JULY 1, 17 FEDERAL RESERVE BANK of KANSAS CITY SUMMARY OF CURRENT ENERGY CONDITIONS The number of total active drilling rigs
Midwest Association of Rail Shippers
 January 13, 2016 Midwest Association of Rail Shippers Lance Fritz Chairman and CEO Union Pacific 1 2015 Economic Results Consumer-driven growth 1 Consumer Spending 2 Light Vehicle Sales 3.6% 3.0% 3.0%
The Great Transition: Shifting from Fossil Fuels to Solar and Wind Energy Supporting Data - Coal
 The Great Transition: Shifting from Fossil Fuels to Solar and Wind Energy Supporting Data - Coal Proved Coal Reserves, 213 GRAPH: Proved Coal Reserves in Top Countries, 213 Coal Production in Top Ten Countries
2009 Mexico in the World Proved crude oil reserves 17 Proved gas reserves 31 Crude oil production 6 Natural gas production 12 Atmospheric
 07 INTERNATIONAL COMPARISONS 2009 Mexico in the World Proved crude oil reserves 17 Proved gas reserves 31 Crude oil production 6 Natural gas production 12 Atmospheric distillation capacity 14 International
Macroeconomic Assumptions
 Macroeconomic Assumptions A major factor affecting the global economy this year continues to be weakness in Chinese financial markets and the resulting fallout affecting trading partners dependent on the
Energy Security of APEC Economies in a Changing Downstream Oil Environment
 IEEJ Feb. 2018 4th APEC OGSN Forum on 7 March 2018 Session2-2 Energy Security of APEC Economies in a Changing Downstream Oil Environment Takashi MATSUMOTO and Ichiro KUTANI Manager, Global Energy Group
Fresh Connections: Netherlands
 Fresh Connections: Netherlands SHIFTING TRADE WINDS: GEOPOLITICS, GLOBAL TRADE & YOU JULIEN MARCILLY CHIEF ECONOMIST APRIL 29, 215 Oil prices: Lower for longer 14 Oil price (Brent, source: OPEC) 12 Oil
IEA Analysis of Fossil-Fuel Subsidies for APEC
 211/SOM3/DIA/3 Session 2 IEA Analysis of Fossil-Fuel Subsidies for APEC Submitted by: IEA Policy Dialogue on Fossil Fuel Subsidy Reform San Francisco, United States 23 September 211 IEA analysis of fossil
Bob Costello American Trucking Associations
 Bob Costello American Trucking Associations Economic & Trucking Industry Update August 7, 2018 Bob Costello Chief Economist & Senior Vice President of International Trade Policy & Cross-Border Ops American
FutureMetrics LLC. 8 Airport Road Bethel, ME 04217, USA. Cheap Natural Gas will be Good for the Wood-to-Energy Sector!
 FutureMetrics LLC 8 Airport Road Bethel, ME 04217, USA Cheap Natural Gas will be Good for the Wood-to-Energy Sector! January 13, 2013 By Dr. William Strauss, FutureMetrics It is not uncommon to hear that
proved natural gas reserves, selected countries oil production, selected countries
 [66] 07 7.1 2010 proved oil reserves, selected countries 7.2 2010 proved natural gas reserves, selected countries 7.3 2010 oil production, selected countries 7.4 7.5 2010 natural 2009 gas production, atmospheric
The Case for Mexico to Improve Vehicle Fuel Efficiency
 The Case for Mexico to Improve Vehicle Fuel Efficiency Feng An Energy and Transportation Technologies LLC Katherine Blumberg International Council on Clean Transportation Workshop on Sustainable Transport
CHARTS AND PRICE PROJECTIONS
 CHARTS AND PRICE PROJECTIONS 18 / Charts and Price Projections: FAPRI 28 Agricultural Outlook Average Annual GDP Growth, 27-217 Percent Change 1 8 8.4 7.92 6 4 4.44 3.67 4.6 4.34 2 2.37 2.17 1.38 2.44
Coconut Oil Prices Spike
 United States Department of Agriculture Foreign Agricultural Service Coconut Oil Prices Spike Coconut oil prices have surged over the past year in contrast to the general downward trend in other vegetable
Pakistan Oilseed Processors Seize Opportunity to Crush Soybeans
 United States Department of Agriculture Foreign Agricultural Service December 2015 Pakistan Oilseed Processors Seize Opportunity to Crush Soybeans Pakistan, long an importer of soybean meal, is transitioning
Textile Per Capita Consumption
 November 2017 Textile Per Capita Consumption 2005-2022 Part 1: Lower middle income countries CHF300.- Table of Contents Preface... 4 Sources... 5 Definitions... 6 Charts... 7 Executive Summary... 9 Country
Citrus: World Markets and Trade
 United States Department of Agriculture Foreign Agricultural Service uary 2015 Citrus: World Markets and Trade Oranges Global orange production for is forecast to decline 4 percent from the previous year
CHARTS AND PRICE PROJECTIONS
 CHARTS AND PRICE PROJECTIONS 18 / Charts and Price Projections: FAPRI 27 Agricultural Outlook Average Annual GDP Growth Percent Change 9 8 7 6 4 3 2 1 26-216 Canada China EU NMS EU- India Japan Latin America
U.S. Natural Gas Outlook The 3rd London Gas & LNG Forum September 26 and 27, 2016 The Rag Army & Navy Club London
 U.S. Natural Gas Outlook The 3rd London Gas & LNG Forum September 26 and 27, 216 The Rag Army & Navy Club London Lucian Pugliaresi Energy Policy Research Foundation, Inc. Washington, DC 1 About EPRINC!
U.S. Crude Exports and Impact on Trade
 U.S. Crude Exports and Impact on Trade 32 nd Annual Asia Pacific Petroleum Conference Dr. Helen Currie Senior Economist September 7, 2016 Cautionary Statement The following presentation includes forward-looking
North American Natural Gas Market Outlook
 North American Natural Gas Market Outlook How Long will Natural Gas Prices Stay Low? Based on ICF s Gas Market Compass January Base Case ACEEE 2013 National Symposium on Market Transformation March 25,
Energy Economics. Lecture 3 Crude Oil Market ECO Asst. Prof. Dr. Istemi Berk
 Energy Economics ECO-4420 Lecture 3 Crude Oil Market Asst. Prof. Dr. Istemi Berk istemi.berk@deu.edu.tr 1 World Fossil Fuel Consumption A Comparison btw. Coal, Oil and Gas Million Tons of Oil Equivalent
Tight Oil: A Solution to U.S. Import Dependence?
 Tight Oil: A Solution to U.S. Import Dependence? Geological Society of America Denver, Colorado October 28, 213 J. David Hughes Global Sustainability Research Inc. Post Carbon Institute The Shale Revolution
Global Oil Exports: Smooth Sailing Or Midnight on the Titanic?
 Global Oil Exports: Smooth Sailing Or Midnight on the Titanic? Jeffrey J. Brown; Samuel Foucher, PhD; Tiger Craft*, Fortress Investment Group April 26, 2012 * All views are those of the authors, and Fortress
Citrus: World Markets and Trade
 United States Department of Agriculture Foreign Agricultural Service July 2015 Citrus: World Markets and Trade Oranges Global orange production for is estimated to decline 7 percent from the previous year
Trends in U.S. crude oil and petroleum product exports
 Trends in U.S. crude oil and petroleum product exports For ENERCOM Oil & Gas Conference August 21, 218 Denver, Colorado By T. Mason Hamilton, Petroleum Markets Analyst, Office of Energy Markets and Financial
Chemical and Petrochemical Opportunities in Iran
 Chemical and Petrochemical Opportunities in Iran by Mohammad Reza Ghasemian Managing Director of Chemicalways LLC. Greece Oct 2015 In cooperation with Best Land to produce Petrochemicals in ME Natural
The evolution of Petrobras in an industry in transformation. Nelson Silva Chief Strategy and Performance Officer
 The evolution of Petrobras in an industry in transformation Nelson Silva Chief Strategy and Performance Officer OUR TOP METRICS Safety TOTAL RECORDABLE INJURY FREQUENCY RATE (TRI)* Financial NET DEBT /
Macroeconomic Outlook. Presented by Dr. Bruce A. Scherr Chairman of the Board Chief Executive Officer Emeritus
 Macroeconomic Outlook Presented by Dr. Bruce A. Scherr Chairman of the Board Chief Executive Officer Emeritus Waterways Symposium Cincinnati, OH November 15-17, 2016 Topics Energy Macro Implications Inflation
280 / World Cotton: FAPRI 2005 Agricultural Outlook. World Cotton
 WORLD COTTON 280 / World Cotton: FAPRI 2005 Agricultural Outlook World Cotton The 2004/05 crop can be characterized simply as record breaking. A record 35.8 mha of cotton were harvested, producing a record
Weak Real to Boost Brazil s Soybean Exports in 2016
 United States Department of Agriculture Foreign Agricultural Service October 2015 Weak Real to Boost Brazil s Soybean Exports in 2016 Brazil s exchange rate is having a significant impact on domestic and
TANK BARGE OPPORTUNITIES RELATED TO CRUDE OIL PRODUCTION & MOVEMENT
 TANK BARGE OPPORTUNITIES RELATED TO CRUDE OIL PRODUCTION & MOVEMENT Third Edition A SPECIAL INDUSTRY STUDY Prepared by: November 2014 775 Ridge Lake Boulevard, Suite 400 ~ Memphis, Tennessee 38120-9403
Petroleum and Natural Gas Situation
 Petroleum and Natural Gas Situation John C. Felmy Chief Economist and Director Statistics Department American Petroleum Institute Felmyj@api.org www.api.org www.gasolineandyou.org www.naturalgasfacts.org
Executive Panel Discussion
 Theme: Executive Panel Discussion, Thursday Dec 14, 2017 Executive Panel Discussion Moderator: Dave Witte - IHS Markit Panelists: Walter Pinto - Lyondellbasell Tony Jones - Valero Ron Corn - CPChem Mike
Minerals Management Service
 U.S. Department of the Interior Minerals Management Service Future US Energy Sources US Offshore - Offshore Arctic Dave Marin MMS Maritime Transportation of Energy Mare Forum USA 2008 February 14, 2008
Soybean Trade Growth: A Story of Brazil, the United States, and China
 United States Department of Agriculture Foreign Agricultural Service October 2017 Soybean Trade Growth: A Story of Brazil, the United States, and China 12-Month Soybean Export Growth Year Ending September
Oil and Gas Projects in Mexico and Expectations for Japanese Technologies
 JOGMEC Techno Forum 2013 PEMEX Exploración y Producción Subdirección de Distribución y Comercialización Gerencia De Operaciones Oil and Gas Projects in Mexico and Expectations for Japanese Technologies
Spain s exports by oil product group and country of destination
 Corporación de Reservas Estratégicas de Productos Petrolíferos Castellana, 79 28046 Madrid T. +34 91 360 09 10 Updated F. +34 91 420 on39 45 www.cores.es February 13 th 2017 Spain s exports by oil product
Organisation de Coopération et de Développement Economiques Organisation for Economic Co-operation and Development
 For Official Use DSTI/SU/SC(2007)25 DSTI/SU/SC(2007)25 For Official Use Organisation de Coopération et de Développement Economiques Organisation for Economic Co-operation and Development 14-May-2007 English
Indian Soybean Meal Exports Unlikely to Recover in 2015/16
 United States Department of Agriculture Foreign Agricultural Service November 2015 Indian Soybean Meal Exports Unlikely to Recover in Though once a significant regional exporter of soybean meal, India
Global Downstream Petroleum Outlook
 Global Downstream Petroleum Outlook Claude Mandil Executive Director International Energy Agency 3 rd OPEC International Seminar Vienna, 12 September 26 Spare Refinery Capacity Has Tightened 9 1% 85 95%
Growing Latin America: Feedstocks and Competitiveness
 MIDSTREAM DOWNSTREAM CHEMICAL Presentation Growing Latin America: Feedstocks and Competitiveness November 216 ihsmarkit.com Dr. Nick Rados, Global Business Director, Feedstocks +1 832 619 8593, nick.rados@ihsmarkit.com
Market Outlook for Malaysian Rubber Products in th February 2014
 Market Outlook for Malaysian Rubber Products in 2014 25 th February 2014 World Economic Scenario World Economic Outlook For 2014 World growth increase from 3% in 2013 to 3.7% in 2014 Advanced economies
European Power Workshop. David Goldsack Principal Coal Consultant, Global Energy Group
 European Power Workshop David Goldsack Principal Coal Consultant, Global Energy Group Today s Presentation Upstream Coal Industry Transport Issues Contracting for Supplies Price Outlook Copyright 2007
Westport Innovations Inc.
 Energy & Environment Perspectives 2008 1 David Demers, CEO, Westport Innovations Inc. 2 Westport Innovations Inc. Recognized as the world leader in gaseous fuels technology (natural gas, hydrogen, LPG,
Algae is a superior renewable feedstock
 Tim Zenk VP of Corporate Affairs, Sapphire Energy Inc. October 11, 2012 Cost of production ($ per barrel) Algae is a superior renewable feedstock Superior attributes of algae Scalable to millions of barrels
Update from U.S. - Shale 2.0. Chris Faulkner CEO, Breitling Oil and Gas Shale Gas World Europe 2013 Warsaw, Poland
 Update from U.S. - Shale 2.0 Chris Faulkner CEO, Breitling Oil and Gas Shale Gas World Europe 2013 Warsaw, Poland Unconventional Gas Play Rankings Remaining Recoverable Gas Resources (Tcf) Marcellus Haynesville
Tanker Market Outlook
 Tanker Market Outlook 4 th Maritime Indonesia Simon Chattrabhuti, Director, Head of Tanker Market Analysis Jakarta, 22 March 212 Disclaimer THIS PRESENTATION IS CONFIDENTIAL AND IS SOLELY FOR THE USE OF
Revised July 17, 2017
 Revised July 17, 2017 ISM Manufacturing Purchasing Managers Index (June 2016 June 2017) 66 64 62 60 58 56 54 52 50 48 46 Jun-16 Jul Aug Sept Oct Nov Dec Jan-17 Feb Mar Apr May Jun Purchasing Managers'
Global Aluminum-Nickel Catalyst Market (By Type, By End- Use Industry, By Region, By Country): Opportunities and Forecasts ( )
: Opportunities and Forecasts ( )") Global Aluminum-Nickel Catalyst Market (By Type, By End- Use Industry, By Region, By Country): Opportunities and Forecasts (2016-2021) By Type (Activated and Non-Activated) By End-User Industry (Refinery,
Global Aluminum-Nickel Catalyst Market (By Type, By End- Use Industry, By Region, By Country): Opportunities and Forecasts (2016-2021) By Type (Activated and Non-Activated) By End-User Industry (Refinery,
Spain s exports by oil product group and country of destination. Year Corporación de Reservas Estratégicas de Productos Petrolíferos
 Corporación de Reservas Estratégicas de Productos Petrolíferos Castellana, 79 28046 Madrid T. +34 91 360 09 10 Updated F. +34 91 420 on39 45 www.cores.es July 13 th 2015 Spain s exports by oil product
Outlook for Franchised New Car Dealers
 1 Outlook for Franchised New Car Dealers Fourteenth Annual Automotive Outlook Symposium June 1, 2007 Paul Taylor, Ph.D., Chief Economist National Automobile Dealers Association, McLean, VA www.nada.org
Global Petrochemical Market Outlook
 Global Petrochemical Market Outlook Leveraging Competitive Feedstocks Given Energy Market Uncertainty Presented To: Congreso Argentino de Petroquimica June 14, 216 Centro Costa Salguero Buenos Aires, Argentina
Where Are Oil Prices Headed? Graham Loveland Senior Consultant, Oil
 Resource Scramble or Market Rebalance: Where Are Oil Prices Headed? Graham Loveland Senior Consultant, Oil Presentation Outline & Approach Outline Key messages Demand Supply Costs & Prices Refining & Products
World Air Conditioner Demand by Region
 World Air Conditioner Demand by Region April 2015 The Japan Refrigeration and Air Conditioning Industry Association 1 World Air Conditioner Demand by Region April 2015 The Japan Refrigeration and Air Conditioning
North American Nitrogen Outlook
 North American Nitrogen Outlook TFI Outlook November 2016 Doug Hoadley : Over 25 years of experience in the fertilizer industry Expert on the nitrogen, phosphates and potash industries Detailed knowledge
Natural gas. 26 Reserves 28 Production and consumption 33 Prices 34 Trade movements. 67 th edition
 Natural gas 26 Reserves 28 Production and consumption 33 Prices 34 Trade movements 67 th edition Natural gas Total proved reserves At end 1997 At end 2007 At end 2016 At end Trillion Trillion Trillion
International Olive Council. International Olive Council
 Advisory Committee on Olive Oil and Table Olives 29 June 29 1 115 CHANGES IN WORLD CROP AREA (thousand hectares) Bearing Non-bearing Irrigated Dry-farmed % change between years = 2% 11,52 9,137,867 1,21,39
Statistical Appendix
 Statistical Appendix Middle East and Central Asia Department REO Update, May 2013 The IMF s Middle East and Central Asia Department (MCD) countries and territories comprise Afghanistan, Algeria, Armenia,
Section 5. Crude Oil and Natural Gas Resource Development
 Section 5. Crude Oil and Natural Gas Resource Development The September 4 rotary rig count was 1,4, slightly higher than the count in August 4 and 13 percent higher than the count in September 3. Of the
The State of Alaska s Refining Industry
 The State of Alaska s Refining Industry Barry Pulliam Managing Director Econ One Research, Inc. Anchorage, Alaska December 2016 Econ One Research, Inc. 1 Econ One Research, Inc. In Alaska Three Decades
Global transport outlook to 2050 Targets and scenarios for a low-carbon transport sector
 OECD/IEA 2012 Global transport outlook to 2050 Targets and scenarios for a low-carbon transport sector John Dulac Energy Analyst, Energy Technology Policy Division International Energy Agency Content IEA
Early-Season U.S. Soybean Meal Sales Surge
 United States Department of Agriculture Foreign Agricultural Service November 2014 Early-Season U.S. Soybean Meal Sales Surge U.S. soybean meal export commitments (accumulated exports plus outstanding
US Economic Indicators: Merchandise Trade
 US Economic Indicators: Merchandise Trade July 6, 218 Dr. Edward Yardeni 516-972-7683 eyardeni@ Debbie Johnson 48-664-1333 djohnson@ Mali Quintana 48-664-1333 aquintana@ Please visit our sites at www.
Sharp Decline in Vegetable Oil Stocks Leads to Steeply Higher Prices
 United States Department of Agriculture Foreign Agricultural Service Circular Series FOP 1-11 Sharp Decline in Vegetable Oil Leads to Steeply Higher Prices Commodity prices have been on an upward trend
Global Motorcycle Market Research Report 2018
 Report Information More information from: https://www.wiseguyreports.com/reports/3271957-global-motorcycle-market-research-report-2018 Global Motorcycle Market Research Report 2018 Report / Search Code: