AMR based meter fleet surveillance
|
|
|
- Hollie Sullivan
- 5 years ago
- Views:
Transcription

1
 Statistical sample test (mainly used in Denmark) AMR based meter fleet")
2 Methods for periodical re-verification of heat meters Replacement of all heat meters e.g. with 5 years interval (most used principle in Europe) Statistical sample test (mainly used in Denmark) AMR based meter fleet surveillance (accepted by DANAK in Denmark)

3 Facts about AMR based meter fleet surveillance 5 years field experience 7308 installations made from 2004 to Heat utilities in Denmark are using this method Accepted by DANAK in February 2006
4 Interval (Years) AMR based meter fleet surveillance 7 Re-verification intervals in Europe (or no official rules for re-verification of heat meters) Austria Belgium Cyprus Czech Rep. Denmark Estonia Finland France Germany Greece Hungary Ireland Italy Latvia Lithuania Luxembourg Malta Netherlands Poland Portugal Slovakia Slovenia Spain Sweden United Kingdom Iceland Norway Switzerland Source: Working group Thermal Energy within AQUA, Sep. 2008

5 The principles behind AMR based meter fleet surveillance
6 Odd meter numbers UTILITY SIDE HEAT METER COMSUMER SIDE Even meter numbers UTILITY SIDE HEAT METER COMSUMER SIDE

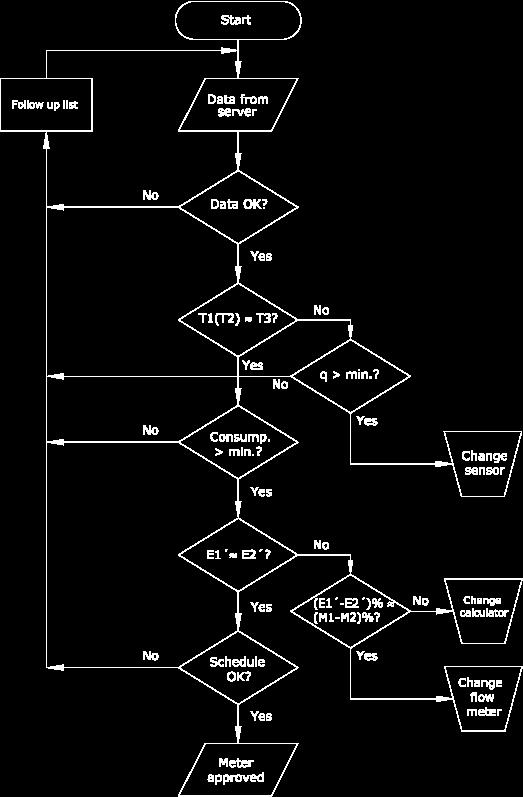
7

8 The heat meters used for AMR based meter fleet surveillance


9 AMR-based heat calculator for 2 flow meters and 3 temperature sensors Long-life flow meters qp m 3 /h. Insensitive to flow disturbances and magnetite


10 Parallel The ultrasonic beam runs in parallel with the measuring pipe and is transmitted from the transducers via the reflectors Triangle The ultrasonic beam covers the measuring pipe in a triangle. The ultrasonic beam is transmitted from the transducers and reflected in a triangle to cover the measuring pipe
11 Temperature loss/meter pipe (K) AMR based meter fleet surveillance Temperature loss in steel pipes 2 1,8 1,6 Reference conditions Water: 55 C Ambient: 23 C 1,4 1,2 Non isolated ¾ black steel pipe 1 0,8 0,6 0,4 0,2 Foam isolated ¾ black steel pipe Flow rate (Liter/hour)

12 Non isolated Max. pipe distances between sensors when allowing up to 0.25 K error at qi (15 liter/hour) Foam isolated ¾ black steel pipe

13 Results from AMR based meter fleet surveillance
14 Deviation E2-E1 (%) AMR based meter fleet surveillance 10 E2 -E1 % deviation per May 2004 Max. in-service-error set by the surveillance system Max. in-service-error acc. to the Danish rules Number of heat meter installations (357 meters per May 2004)
15 Deviation E2-E1 (%) AMR based meter fleet surveillance 10 E2 -E1 % deviation per May 2009 Max. in-service-error set by the surveillance system Max. in-service-error acc. to the Danish rules Number of heat meter installations (471 meters per May 2009)
16 Main meter in relation to check meter in % (E2-E1)/E1*100 % AMR based meter fleet surveillance Flow meters in flow pipe and return pipe, wrongly installed Flow pipe sensor were mounted in return pipe and vice versa Date of corrected installations Number of data readings (weekly) Due to the water density, the inlet is about 2.2% higher than the outlet at the temperature sets 75 C/27 C. This means approx. 4.4% error when the flow sensors are wrongly installed.
17 Deviation in K AMR based meter fleet surveillance Deviations in temperature sensor validations 0,5 0,4 0,3 0,2 0,1 0-0,1-0,2-0, ,4-0,5 Measurements per week Max. in-service-error set by the surveillance system
18 Measurement error i % AMR based meter fleet surveillance Compliance between system result and Laboratory re-verification (complete heat meters) ,01 0, F F F F F MDIR MDIR Flow (m3/h) 3qi - 0,1qp - 0,7qp Max. in-service-error acc. to the Danish rules

19 Cost comparison between: Replacement of all heat meters with 5 years interval and AMR based meter fleet surveillance
20 Euro s per meter AMR based meter fleet surveillance Accumulated cost of new meters and installations AMR based Ultrasonic heat meters Standard heat meters Years of service

21 Advantages with AMR based meter fleet surveillance Environmental savings because heat meters are in service as long as they are performing well Economical savings for the heat supplier Heat loss due to defective meters is reduced to a minimum

22 Advantages with AMR based meter fleet surveillance Meter surveillance in real installations means also surveillance of the impact of e.g. flow disturbances AMR and leak surveillance are included, meaning economical savings on meter reading and reduced supply water Efficient fraud detection

23 Thank you for your attention! Søren Lang Product Group Manager Meter Division, Heat, Cooling and Water
ACEA Report. Vehicles in use Europe 2017
 ACEA Report Vehicles in use Europe 2017 TABLE OF CONTENTS Summary... 2 Vehicles in use in Europe... 3 Passenger cars... 3 Light commercial vehicles... 4 Medium and heavy commercial vehicles... 5 Buses...
NEW ALTERNATIVE FUEL VEHICLE REGISTRATIONS IN THE EUROPEAN UNION 1 Q1 2015
 NEW ALTERNATIVE FUEL VEHICLE REGISTRATIONS IN THE Q1 2015 ALTERNATIVE FUEL VEHICLE registrations: +28.8% in in first quarter In the first quarter of 2015, total alternative fuel vehicle (AFV) registrations
NEW ALTERNATIVE FUEL VEHICLE REGISTRATIONS IN THE EUROPEAN UNION 1 Q2 2015
 NEW ALTERNATIVE FUEL VEHICLE REGISTRATIONS IN THE Q2 2015 New alternative fuel vehicle (AFV) registrations in the EU by engine type Q2 2014 Q2 2015 Thousand units 70 60 50 40 30 20 10 0 EVs HEVs AFVs other
NEW PASSENGER CAR REGISTRATIONS BY ALTERNATIVE FUEL TYPE IN THE EUROPEAN UNION 1 Quarter
 PRESS EMBARGO: NEW PASSENGER CAR REGISTRATIONS BY ALTERNATIVE FUEL TYPE IN THE EUROPEAN UNION 1 Quarter 3 2017 Alternative fuel vehicle registrations: +51.4% in third quarter of 2017 In the third quarter
Emissions per capita and GDP
 Emissions per capita and GDP (1990 -) CEIP Centre on Emission Inventories and Projections Emissions per capita and emissions per GDP were calculated for all years from 1990 to where data was available
NEW COMMERCIAL VEHICLE REGISTRATIONS EUROPEAN UNION 1 February 2018
 PRESS EMBARGO: NEW COMMERCIAL VEHICLE REGISTRATIONS EUROPEAN UNION 1 February 2018 Next press release: Tuesday 24 April 2018 1 Malta not available Page 1 of 7 Commercial vehicle registrations: +6.5% first
NEW COMMERCIAL VEHICLE REGISTRATIONS EUROPEAN UNION 1. April 2017
 PRESS EMBARGO: NEW COMMERCIAL VEHICLE REGISTRATIONS EUROPEAN UNION 1 April 2017 Next press release: Friday 23 June 2017 1 Data for Malta unavailable Page 1 of 7 Commercial vehicle registrations: +3.8%
NEW COMMERCIAL VEHICLE REGISTRATIONS EUROPEAN UNION 1. October 2016
 PRESS EMBARGO: NEW COMMERCIAL VEHICLE REGISTRATIONS EUROPEAN UNION 1 October 2016 Next press release: Thursday 22 December 2016 1 Data for Malta unavailable Page 1 of 7 Commercial vehicle registrations:
December 2011 compared with November 2011 Industrial producer prices down by 0.2% in both euro area and EU27
 18/2012-2 February 2012 December 2011 compared with November 2011 Industrial producer prices down by 0.2% in both euro area and EU27 In December 2011, compared with November 2011, the industrial producer
NEW PASSENGER CAR REGISTRATIONS BY FUEL TYPE IN THE EUROPEAN UNION 1
 PRESS EMBARGO: NEW PASSENGER CAR REGISTRATIONS BY FUEL TYPE IN THE EUROPEAN UNION 1 Quarter 3 2018 Fuel types of new cars: diesel 18.2%, petrol +15.2%, electric +30.0% in third quarter of 2018 In the third
NEW PASSENGER CAR REGISTRATIONS BY ALTERNATIVE FUEL TYPE IN THE EUROPEAN UNION 1 Quarter
 PRESS EMBARGO: NEW PASSENGER CAR REGISTRATIONS BY ALTERNATIVE FUEL TYPE IN THE EUROPEAN UNION 1 Quarter 2 2016 Alternative fuel vehicle registrations: +0.6% in second quarter of 2016 In the second quarter
NEW PASSENGER CAR REGISTRATIONS BY ALTERNATIVE FUEL TYPE IN THE EUROPEAN UNION 1 Quarter
 PRESS EMBARGO: NEW PASSENGER CAR REGISTRATIONS BY ALTERNATIVE FUEL TYPE IN THE EUROPEAN UNION 1 Quarter 2 2017 Alternative fuel vehicle registrations: +38.0% in second quarter of 2017 In the second quarter
1. INTERNATIONAL OVERVIEW. 1.0 Area and population. population (1,000) area
 area") 1.0 Area and population area population (1,000) km 2 2000 2010 2018 1 inhabitants per km 2 Belgium 30,530 10,251 10,920 11,443 375 Germany 357,380 82,212 81,777 82,952 232 Estonia 45,230 1,397 1,331 1,315
1.0 Area and population area population (1,000) km 2 2000 2010 2018 1 inhabitants per km 2 Belgium 30,530 10,251 10,920 11,443 375 Germany 357,380 82,212 81,777 82,952 232 Estonia 45,230 1,397 1,331 1,315
NEW PASSENGER CARS BY FUEL TYPE IN THE EUROPEAN UNION 1 Quarter
 PRESS EMBARGO: NEW PASSENGER CARS BY FUEL TYPE IN THE EUROPEAN UNION 1 Quarter 1 2018 Next press release: Thursday 6 September 2018 1 Data for Croatia, Cyprus, Luxembourg and Malta is not available Page
NEW PASSENGER CARS BY FUEL TYPE IN THE EUROPEAN UNION 1 Quarter
 PRESS EMBARGO: NEW PASSENGER CARS BY FUEL TYPE IN THE EUROPEAN UNION 1 Quarter 1 2018 Next press release: Thursday 6 September 2018 1 Data for Croatia, Cyprus, Luxembourg and Malta is not available Page
September 2011 compared with August 2011 Industrial producer prices up by 0.3% in euro area Up by 0.4% in EU27
 161/2011-4 November 2011 September 2011 compared with August 2011 Industrial producer prices up by 0.3% in euro area Up by 0.4% in EU27 In September 2011 compared with August 2011, the industrial producer
NEW COMMERCIAL VEHICLE REGISTRATIONS EUROPEAN UNION 1. December 2018
 PRESS EMBARGO: NEW COMMERCIAL VEHICLE REGISTRATIONS EUROPEAN UNION 1 December 2018 Commercial vehicle registrations: +3.2% in 2018; 4.0% in December Total new commercial vehicles In December 2018, commercial
June EU Countries NEW COMMERCIAL VEHICLE REGISTRATIONS. PRESS EMBARGO FOR ALL DATA: July 26, 2013, 8.00 A.M. (6.00 A.M. GMT)
") PRESS EMBARGO FOR ALL DATA: y 26, 213, 8. A.M. (6. A.M. GMT) Press s Release e e NEW COMMERCIAL VEHICLE REGISTRATIONS e 213 EU Countries 15, LCVs up to 3.5t 2, Heavy Trucks of 16t and over ons New Registrati
PRESS EMBARGO FOR ALL DATA: y 26, 213, 8. A.M. (6. A.M. GMT) Press s Release e e NEW COMMERCIAL VEHICLE REGISTRATIONS e 213 EU Countries 15, LCVs up to 3.5t 2, Heavy Trucks of 16t and over ons New Registrati
NEW COMMERCIAL VEHICLE REGISTRATIONS EUROPEAN UNION* September 2014
 PRESS EMBARGO: 8.00 A.M. (7.00 A.M GMT), October 28, 2014 NEW COMMERCIAL VEHICLE REGISTRATIONS EUROPEAN UNION* September 2014 Next Press Release: November 27, 2014 *Data for Malta unavailable Page 1 of
Winners & Losers by Market - January 2019 vs January 2018
 Countries 19/18 % Chg LITHUANIA +49,0 ROMANIA +18,8 HUNGARY +9,2 PORTUGAL +8,3 DENMARK +7,0 GREECE +3,7 LATVIA +0,7 POLAND -0,3 FRANCE -1,1 GERMANY -1,4 UNITED KINGDOM -1,6 NORWAY -2,2 LUXEMBOURG -3,4
BREXIT AND THE AUTO INDUSTRY: FACTS AND FIGURES
 BREXIT AND THE AUTO INDUSTRY: FACTS AND FIGURES GLOBAL TRADE European Union EU vehicle imports: Total value: 45,693 million Quantity: 3,395,419 units EU vehicle exports: Total value: 135,398 million Quantity:
AUSTRIA. Table 1. FDI flows in the host economy, by geographical origin. (Millions of US dollars)
") Table 1. FDI flows in the host economy, by geographical origin World 5 690 138 6 195 3 184 10 784 7 933 31 154 6 858 9 303 840 10 618 5 760 Developed economies 5 740 13 5 341 2 689 10 137 6 291 29 721
Table 1. FDI flows in the host economy, by geographical origin World 5 690 138 6 195 3 184 10 784 7 933 31 154 6 858 9 303 840 10 618 5 760 Developed economies 5 740 13 5 341 2 689 10 137 6 291 29 721
BREXIT AND THE AUTO INDUSTRY: FACTS AND FIGURES
 BREXIT AND THE AUTO INDUSTRY: FACTS AND FIGURES GLOBAL TRADE European Union EU vehicle imports: Total value: 48,019 million Quantity: 3,640,975 units EU vehicle exports: Total value: 138,536 million Quantity:
NEW COMMERCIAL VEHICLE REGISTRATIONS EUROPEAN UNION 1. November 2018
 PRESS EMBARGO: NEW COMMERCIAL VEHICLE REGISTRATIONS EUROPEAN UNION 1 November 2018 Commercial vehicle registrations: +3.8% 11 months into 2018; +2.7% in November Total new commercial vehicles In November
ACEA Report. Vehicles in use Europe 2018
 ACEA Report Vehicles in use Europe 2018 TABLE OF CONTENTS Summary... 2 Vehicles in use in Europe... 3 Passenger cars... 3 Light commercial vehicles... 4 Medium and heavy commercial vehicles... 5 Buses...
NEW PASSENGER CAR REGISTRATIONS EUROPEAN UNION 1
 PRESS EMBARGO: 8.00 AM (6.00 AM GMT), 19 September 2018 NEW PASSENGER CAR REGISTRATIONS EUROPEAN UNION 1 Passenger car registrations: +6.1% eight months into 2018; +10.5% in July and +31.2% in August In
February 2014 Euro area unemployment rate at 11.9% EU28 at 10.6%
 STAT/14/52 1 April 2014 February 2014 Euro area unemployment rate at 11.9% EU28 at 10.6% The euro area 1 (EA18) seasonally-adjusted 2 unemployment rate 3 was 11.9% in February 2014, stable since October
P r e s s R e l e a s e. June 2007
 PRESS EMBARGO FOR ALL DATA: 26 July 27, 8. A.M. (6. A.M. GMT) P r e s s NEW COMMERCIAL VEHICLE REGISTRATIONS June 27 European Union + EFTA Countries LCVs up to 3.5t Heavy Trucks over 16t 25, 3, 2, 15,
May 2014 Euro area unemployment rate at 11.6% EU28 at 10.3%
 STAT/14/103-1 July 2014 May 2014 Euro area unemployment rate at 11.6% EU28 at 10.3% The euro area 1 (EA18) seasonally-adjusted 2 unemployment rate 3 was 11.6% in May 2014, stable compared with April 2014
June EU Countries NEW COMMERCIAL VEHICLE REGISTRATIONS. PRESS EMBARGO FOR ALL DATA: July 26, 2012, 8.00 A.M. (6.00 A.M. GMT) LCVs up to 3.
 LCVs up to 3.") PRESS EMBARGO FOR ALL DATA: y 26, 212, 8. A.M. (6. A.M. GMT) Press s Release e e NEW COMMERCIAL VEHICLE REGISTRATIONS e 212 EU Countries 15, LCVs up to 3.5t 2, Heavy Trucks over 16t New Regis strations
PRESS EMBARGO FOR ALL DATA: y 26, 212, 8. A.M. (6. A.M. GMT) Press s Release e e NEW COMMERCIAL VEHICLE REGISTRATIONS e 212 EU Countries 15, LCVs up to 3.5t 2, Heavy Trucks over 16t New Regis strations
Jan. 13/12. Countries. % Chg Winners & Losers by Market - Jan vs Jan. 2012
 Countries Jan. 13/12 ICELAND +43,8 ESTONIA +28,4 DENMARK +14,5 BELGIUM +13,3 UNITED KINGDOM +11,5 POLAND +8,8 NORWAY +7,4 AUSTRIA +3,5 PORTUGAL +0,7 LITHUANIA -1,3 CZECH REPUBLIC -6,6 LUXEMBURG -7,5 EU27*+EFTA
Production of heat by type Terajoules
 Production of heat by type Table Notes geo represents heat used directly for district heating, agriculture etc. without a commercial transaction taking place. Please refer to the Definitions Section on
June 2014 Euro area unemployment rate at 11.5% EU28 at 10.2%
 STAT/14/121 31 July 2014 June 2014 Euro area unemployment rate at 11.5% EU28 at 10.2% The euro area 1 (EA18) seasonally-adjusted 2 unemployment rate 3 was 11.5% in June 2014, down from 11.6% in May 2014
Winners & Losers by Market - July 2018 vs July 2017
 Countries July 18/17 % Chg LITHUANIA +56,5 CROATIA +43,7 ROMANIA +34,2 HUNGARY +29,0 POLAND +25,7 SPAIN +19,3 FRANCE +18,9 SLOVENIA +17,6 BELGIUM +16,8 PORTUGAL +13,6 AUSTRIA +13,5 GERMANY +12,3 NETHERLANDS
Euro area unemployment rate at 10.5%
 3/2016-7 January 2016 November 2015 Euro area unemployment rate at 10.5% EU28 at 9.1% The euro area (EA19) seasonally-adjusted unemployment rate was 10.5% in November 2015, down from 10.6% in October 2015,
Winners & Losers by Market - December 2018 vs December 2017
 Countries December 18/17 % Chg LITHUANIA +24,8 CROATIA +16,1 NETHERLANDS +15,3 ROMANIA +12,3 ITALY +2,0 GREECE -1,1 SPAIN -3,5 PORTUGAL -5,3 CYPRUS -5,3 POLAND -5,5 UNITED KINGDOM -5,5 GERMANY -6,7 LUXEMBOURG
Winners & Losers by Market - September 2018 vs September 2017
 Countries September 18/17 % Chg BULGARIA +8,5 CROATIA +3,3 SLOVENIA -7,3 HUNGARY -7,4 LITHUANIA -8,3 CYPRUS -9,9 LATVIA -11,0 FRANCE -12,8 PORTUGAL -14,0 DENMARK -16,0 NETHERLANDS -16,7 SWITZERLAND -16,8
OECD unemployment rate down to 6.5% in January 2016
 OECD unemployment rate down to 6.% in January 2016 The OECD unemployment rate fell by 0.1 percentage point to 6.% in January 2016, 1.6 percentage points below the January 2013 peak. Across the OECD area,
September 2003 Industrial producer prices stable in euro-zone and EU15
 STAT/03/123 31 October 2003 September 2003 Industrial producer prices stable in euro-zone and EU15 The euro-zone 1 industrial producer price index 2 remained unchanged in September 2003 compared with the
NEW PASSENGER CAR REGISTRATIONS EUROPEAN UNION 1
 PRESS EMBARGO: 8.00 AM (6.00 AM GMT), 17 October 2018 NEW PASSENGER CAR REGISTRATIONS EUROPEAN UNION 1 Passenger car registrations: +2.5% nine months into 2018; 23.5% in In 2018, registrations of new passenger
OECD unemployment rate stable at 5.3% in July 2018
 OECD unemployment rate stable at.3% in July 208 The OECD unemployment rate was stable at.3% in July 208. Across the OECD, 33. million people were unemployed,.7 million less than the peak in January 203
Sectoral Profile - Services
 Sectoral Profile - Services Energy consumption Changes in energy consumption and value added in services Since 2008 strong contraction of total energy consumption (-0.3%/year) although electricity consumption
NEW PASSENGER CAR REGISTRATIONS EUROPEAN UNION 1
 PRESS EMBARGO: 8.00 AM (7.00 AM GMT), 15 February 2018 NEW PASSENGER CAR REGISTRATIONS EUROPEAN UNION 1 Passenger car registrations: +7.1% in 2018 In 2018, demand for passenger cars in the European Union
SOUTH AFRICAN NATIONAL STANDARD
 ISBN 978-0-626-31521-4 EN 300:2006 SOUTH AFRICAN NATIONAL STANDARD Oriented Strand Boards (OSB) Definitions, classification and specifications This national standard is the identical implementation of
OECD unemployment rate stable at 5.5% in January 2018
 OECD unemployment rate stable at.% in January 2018 The OECD unemployment rate was stable at.% in January 2018. Across the OECD area, 34. million people were unemployed, 1.9 million more than in April 2008.
NEW PASSENGER CAR REGISTRATIONS EUROPEAN UNION 1
 PRESS EMBARGO: 8.00 AM (7.00 AM GMT), 15 February 2019 NEW PASSENGER CAR REGISTRATIONS EUROPEAN UNION 1 Passenger car registrations: 4.6% in 2019 In 2019, the European passenger car market saw a slow start
NEW PASSENGER CAR REGISTRATIONS EUROPEAN UNION 1
 PRESS EMBARGO: 8.00 AM (7.00 AM GMT), 17 January 2018 NEW PASSENGER CAR REGISTRATIONS EUROPEAN UNION 1 Passenger car registrations: +3.4% in 2017; 4.9% in In 2017, new passenger car registrations in the
NEW PASSENGER CAR REGISTRATIONS EUROPEAN UNION 1
 PRESS EMBARGO: 8.00 AM (6.00 AM GMT), 17 October 2017 NEW PASSENGER CAR REGISTRATIONS EUROPEAN UNION 1 Passenger car registrations: +3.7% over nine months; 2.0% in In 2017, passenger car registrations
Production of heat by type Terajoules
 Production of heat by type Table Notes geo represents heat used directly for district heating, agriculture etc. without a commercial transaction taking place. represents heat used for the production of
NEW PASSENGER CAR REGISTRATIONS EUROPEAN UNION 1
 PRESS EMBARGO: 8.00 AM (6.00 AM GMT), 17 May 2018 NEW PASSENGER CAR REGISTRATIONS EUROPEAN UNION 1 Passenger car registrations: +2.7% four months into 2018; +9.6% in In 2018, the EU passenger car market
Infographics on Electromobility (January 2019)
") Infographics on Electromobility (January 2019) Publisher: BMW Group Corporate Communications Electromobility Last Update: 04.01.2019 Contact: presse@bmw.de ELECTROMOBILITY IN GERMANY. SHARE IN NEW REGISTRATIONS
Infographics on Electromobility (January 2019) Publisher: BMW Group Corporate Communications Electromobility Last Update: 04.01.2019 Contact: presse@bmw.de ELECTROMOBILITY IN GERMANY. SHARE IN NEW REGISTRATIONS
OECD unemployment rate falls to 6.0% in March 2017
 OECD unemployment rate falls to 6.0% in March 017 The OECD unemployment rate for the population as a whole fell by 0.1 percentage point, to 6.0%, in March 017. Across the OECD area, 37.5 million people
OECD unemployment rate down to 6.4% in March 2016
 OECD unemployment rate down to 6.4% in March 2016 The OECD unemployment rate fell by 0.1 percentage point to 6.4% in March 2016, 1.7 percentage point below the January 2013 peak. Across the OECD area,
NEW PASSENGER CAR REGISTRATIONS EUROPEAN UNION 1
 PRESS EMBARGO: 8.00 AM (6.00 AM GMT), 16 May 2017 NEW PASSENGER CAR REGISTRATIONS EUROPEAN UNION 1 Passenger car registrations: +4.7% four months into 2017; 6.6% in In 2017, the number of passenger cars
NEW PASSENGER CAR REGISTRATIONS EUROPEAN UNION 1
 PRESS EMBARGO: 8.00 AM (6.00 AM GMT), 16 June 2017 NEW PASSENGER CAR REGISTRATIONS EUROPEAN UNION 1 Passenger car registrations: +5.3% five months into 2017; +7.6% in In 2017, passenger car registrations
Photo courtesy of NZTA
 international comparisons for road deaths Photo courtesy of NZTA 14 Motor Vehicle Crashes in New Zealand international comparisons for road deaths 141 Contents TABLES Table 1 International comparison of
Winners & Losers by Market - April 2017 vs April 2016
 Countries April 17/16 % Chg CROATIA +29,6 1 PORTUGAL +17,8 2 POLAND +14,4 BULGARIA +14,1 LITHUANIA +10,7 SLOVENIA +9,7 HUNGARY +7,7 ROMANIA +7,5 NETHERLANDS +6,3 ESTONIA +4,3 SPAIN +1,1 SLOVAKIA -0,1 CZECH
Winners & Losers by Market - June 2017 vs June 2016
 Countries June 17/16 % Chg ROMANIA +47,0 1 CYPRUS +46,0 2 LITHUANIA +40,6 ESTONIA +33,7 BULGARIA +31,4 SLOVENIA +16,4 SLOVAKIA +14,5 GREECE +14,4 ITALY +12,9 HUNGARY +11,6 ICELAND +10,2 CROATIA +8,8 POLAND
NEW PASSENGER CAR REGISTRATIONS EUROPEAN UNION 1
 PRESS EMBARGO: 8.00 AM (6.00 AM GMT), 19 April 2017 NEW PASSENGER CAR REGISTRATIONS EUROPEAN UNION 1 Passenger car registrations: +8.4% first three months of 2017; +11.2% in In 2017, EU passenger car registrations
March 2013 Euro area unemployment rate at 12.1% EU27 at 10.9%
 STAT/13/70 30 April 2013 March 2013 Euro area unemployment rate at 12.1% at 10.9% The euro area 1 (EA17) seasonally-adjusted 2 unemployment rate 3 was 12.1% in March 2013, up from 12.0% in February 4.
OECD unemployment rate stable at 5.8% in August 2017
 OECD unemployment rate stable at 5.8% in August 017 The OECD unemployment rate was stable at 5.8% in August 017, unchanged since May. Across the OECD area, 36.1 million people were unemployed, 3.5 million
NEW PASSENGER CAR REGISTRATIONS EUROPEAN UNION 1
 PRESS EMBARGO: 8.00 AM (6.00 AM GMT), 17 July 2018 NEW PASSENGER CAR REGISTRATIONS EUROPEAN UNION 1 Passenger car registrations: +2.9% during first half of 2018; +5.2% in In 2018, passenger car registrations
5-door FRS-ID: Year of production Legend. Version 4.3b / Opel Automobile GmbH. High strength zone
 Ampera-e 5-door Legend Airbag Stored gas inflator Seat belt pretensioner Gas strut / Preloaded spring High strength zone High voltage power cable / component High voltage disconnect SRS control unit Battery
RISK DASHBOARD ANNEX CREDIT RISK PARAMETERS Q2 2017
 RISK DASHBOARD ANNEX CREDIT RISK PARAMETERS Q2 2017 Corporates 4 0.57% 0.81% 0.84% 0.81% 4 8.75% 17.51% 26.12% 22.73% 57 0.23% 0.45% 1.66% 1.64% 58 33.81% 42.41% 45.00% 29.97% Corporates - Of Which: Specialised
RISK DASHBOARD ANNEX CREDIT RISK PARAMETERS Q4 2017
 RISK DASHBOARD ANNEX CREDIT RISK PARAMETERS Q4 2017 Corporates 10 1.22% 4.02% 26.81% 1.95% 9 15.68% 32.84% 36.64% 31.60% 51 0.20% 1.00% 4.08% 2.02% 54 34.12% 43.96% 45.10% 29.73% Corporates - Of Which:
Labour Market Latest Trends- 1st quarter 2008 data 1
 Population and social conditions Author: Fabrice ROMANS Data in focus 34/2008 Labour Market Latest Trends- 1st quarter 2008 data 1 Chart 1: Employment rate 2 (15-64 years) for from 2000Q1 to 2008Q1 % 66.5
NEW PASSENGER CAR REGISTRATIONS EUROPEAN UNION 1
 PRESS EMBARGO: 8.00 AM (6.00 AM GMT), 15 June 2018 NEW PASSENGER CAR REGISTRATIONS EUROPEAN UNION 1 Passenger car registrations: +2.4% five months into 2018; +0.8% in In 2018, the EU passenger car market
NEW PASSENGER CAR REGISTRATIONS EUROPEAN UNION
 PRESS EMBARGO: 8.00 A.M. (6.00 A.M GMT), October 17, 2014 NEW PASSENGER CAR REGISTRATIONS EUROPEAN UNION PASSENGER CAR registrations: +6.1% over nine months; +6.4% in In, the EU* market for new passenger
NEW PASSENGER CAR REGISTRATIONS EUROPEAN UNION 1
 PRESS EMBARGO: 8.00 AM (7.00 AM GMT), 14 December 2017 NEW PASSENGER CAR REGISTRATIONS EUROPEAN UNION 1 Passenger car registrations: +4.1% over 11 months; +5.9% in In 2017, registrations of new passenger
Workshop on Road Traffic Statistics
 Document: RTS-2008-2-EN Original: English EU transport statistics Workshop on Road Traffic Statistics Luxembourg, 04-05 November 2008 Bech Building Room BECH QUETELET Beginning 10:00 AM Measuring road
NEW PASSENGER CAR REGISTRATIONS EUROPEAN UNION 1
 PRESS EMBARGO: 8.00 AM (7.00 AM GMT), 16 January 2019 NEW PASSENGER CAR REGISTRATIONS EUROPEAN UNION 1 Passenger car registrations: +0.1% in 2018; 8.4% in In 2018, the EU passenger car market declined
OECD unemployment rate stable at 5.4% in March 2018
 OECD unemployment rate stable at.4% in March 2018 The OECD unemployment rate remained stable at.4% in March 2018. Across the OECD area, 34 million people were unemployed, 1.4 million more than in April
NEW PASSENGER CAR REGISTRATIONS EUROPEAN UNION 1
 PRESS EMBARGO: 8.00 AM (7.00 AM GMT), 14 December 2018 NEW PASSENGER CAR REGISTRATIONS EUROPEAN UNION 1 Passenger car registrations: +0.8% 11 months into 2018; 8.0% in In 2018, passenger car demand fell
New Passenger Car Registrations European Union
 PRESS EMBARGO : 8.00am (7.00am GMT), April 17, 2013 New Passenger Car Registrations European Union April 17, 2013 Units 1,700,000 1,500,000 7.0% New Passenger Car Registrations in the EU Last 12 months
Winners & Losers by Market - Feb 2014 vs Feb 2013
 Countries Feb. 14/13 % Chg PORTUGAL +40,2 LITHUANIA +40,1 POLAND +35,2 BULGARIA +32,5 ICELAND +30,3 AUSTRIA +30,2 HUNGARY +29,1 SLOVAKIA +22,4 CZECH REPUBLIC +21,0 IRELAND +20,6 DENMARK +20,5 SWEDEN +20,5
THE EUROPEAN MARKETS AND STRATEGIES TO WATCH FOR MAXIMUM OPPORTUNITY
 THE EUROPEAN MARKETS AND STRATEGIES TO WATCH FOR MAXIMUM OPPORTUNITY BRIAN MADSEN ONLINE AUCTIONS IT SOLUTIONS SMART DATA 1 THE SPEED OF CHANGE IS FASTER THAN EVER 2 THE NEW NORMAL 3 CHANGE OF OWMERSHIP
NEW PASSENGER CAR REGISTRATIONS EUROPEAN UNION *
 PRESS EMBARGO: 8.00 AM (7.00 AM GMT), 17 November 2015 NEW PASSENGER CAR REGISTRATIONS EUROPEAN UNION * Passenger car registrations: +8.2% over ten months; +2.9% in In 2015, the EU passenger car market
In national currency
 Euro-super 95 In national currency Gas oil automobile Automotive gas oil Dieselkraftstoff Gasoil de chauffage Heating gas oil Heizöl (II) Soufre
In national currency
 Euro-super 95 In national currency Gas oil automobile Automotive gas oil Dieselkraftstoff Gasoil de chauffage Heating gas oil Heizöl (II) Soufre
In national currency
 Euro-super 95 In national currency Gas oil automobile Automotive gas oil Dieselkraftstoff Gasoil de chauffage Heating gas oil Heizöl (II) Soufre
In national currency. Gas oil automobile Automotive gas oil Dieselkraftstoff (I)
") In national currency Euro-super 95 Gas oil automobile Automotive gas oil Dieselkraftstoff Gasoil de chauffage Heating gas oil Heizöl (II) Soufre
In national currency Euro-super 95 Gas oil automobile Automotive gas oil Dieselkraftstoff Gasoil de chauffage Heating gas oil Heizöl (II) Soufre
DEUTSCHE NORM February 2005 DIN EN ISO 1514 { Paints and varnishes Standard panels for testing (ISO 1514 : 2004) English version of DIN EN ISO 1514
 English version of DIN EN ISO 1514") DEUTSCHE NORM February 2005 DIN EN ISO 1514 { ICS 87.100 Supersedes September 1997 edition. Paints and varnishes Standard panels for testing (ISO 1514 : 2004) English version of DIN EN ISO 1514 Beschichtungsstoffe
DEUTSCHE NORM February 2005 DIN EN ISO 1514 { ICS 87.100 Supersedes September 1997 edition. Paints and varnishes Standard panels for testing (ISO 1514 : 2004) English version of DIN EN ISO 1514 Beschichtungsstoffe
Monitoring the CO 2 emissions from new passenger cars in the EU: summary of data for 2010
 Monitoring the CO 2 emissions from new passenger cars in the EU: summary of data for 2010 EXECUTIVE SUMMARY EEA has collected data submitted by Member States on vehicle registrations in the year 2010,
NEW PASSENGER CAR REGISTRATIONS EUROPEAN UNION 1
 PRESS EMBARGO: 8.00 AM (6.00 AM GMT), 19 September 2018 NEW PASSENGER CAR REGISTRATIONS EUROPEAN UNION 1 Passenger car registrations: +6.1% eight months into 2018; +10.5% in July and +31.2% in August In
PROVISIONAL NEW PASSENGER CAR REGISTRATIONS BY MARKET
 Association des Constructeurs Européens d'automobiles Av. des Nerviens 85 B-14 Bruxelles Tel (32 2) 732 55 5 Fax (32 2) 738 73 1 NEW PASSENGER CAR REGISTRATIONS BY MARKET (32 2) 738 73 11 15/9/9 August
Winners & Losers by Market - May 2015 vs May 2014
 Countries PORTUGAL +33,1 GREECE +21,6 ICELAND +21,3 CZECH REPUBLIC +17,6 SPAIN +14,0 SLOVENIA +13,7 POLAND +11,0 ITALY +10,8 BULGARIA +10,7 IRELAND +10,3 LITHUANIA +9,6 CYPRUS +7,4 SWEDEN +6,5 SWITZERLAND
New Passenger Car Registrations European Union
 PRESS EMBARGO : 8.00am (7.00am GMT), November 19, 2013 New Passenger Car Registrations European Union November 19, 2013 Units 1,700,000 1,500,000 New Passenger Car Registrations in the EU Last 12 months
New Passenger Car Registrations European Union
 PRESS EMBARGO : 8.00am (7.00am GMT), February 18, 2014 New Passenger Car Registrations European Union February 18, 2014 Units 1,700,000 1,500,000 New Passenger Car Registrations in the EU Last 12 months
Over time consistency of PPP results in the OECD countries
 Public Disclosure Authorized Public Disclosure Authorized Public Disclosure Authorized Public Disclosure Authorized International Comparison Program Over time consistency of PPP results in the OECD countries
New Passenger Car Registrations European Union
 PRESS EMBARGO : 8.00am (6.00am GMT), September 17, 2013 New Passenger Car Registrations European Union September 17, 2013 Units 1,700,000 1,500,000 New Passenger Car Registrations in the EU Last 12 months
Please find attached a copy of JAR-VLR Amendment 2 dated February 2007.
 oint Aviation Authorities Postal Address: P.O. Box 3000 2130 KA Hoofddorp Visiting Address: Saturnusstraat 50 The Netherlands Tel.: 31 (0)23-5679700 Fax: 31 (0)23-5621714 Our reference number: 01606evd
New Passenger Car Registrations European Union
 PRESS EMBARGO : 8.00am (7.00am GMT), January 16, 2013 New Passenger Car Registrations European Union January 16, 2013 Units 1,700,000 1,500,000 New Passenger Car Registrations in the EU Last 12 months
Civil Dialogue Group on WINE Thursday April 19th, 2018
 COMMISSION EUROPÉENNE DIRECTION GÉNÉRALE DE L'AGRICULTURE ET DU DÉVELOPPEMENT RURAL Directorate G. Markets and Observatories G.2. Wine, spirits and horticultural products Bruxelles, le G.2/GD(2017) Civil