Monthly, Seasonal and Annual Rainfall Time Series for All-India, Homogeneous Regions and Meteorological Subdivisions:
|
|
|
- Rosalyn Bell
- 6 years ago
- Views:
Transcription
/189 Monthly, Seasonal and Annual Rainfall Time Series for All-India, Homogeneous Regions and Meteorological Subdivisions: 1871-2016 All-India summer monsoon (JJAS)")
1 ISSN Contribution from IITM Research Report No. RR-138 ESSO/IITM/STCVP/SR/02(2017)/189 Monthly, Seasonal and Annual Rainfall Time Series for All-India, Homogeneous Regions and Meteorological Subdivisions: All-India summer monsoon (JJAS) rainfall: D.R. Kothawale and M. Rajeevan Indian Institute of Tropical Meteorology (IITM) Earth System Science Organization (ESSO) Ministry of Earth Sciences (MoES) PUNE, INDIA
2 ISSN Contribution from IITM Research Report No. RR-138 ESSO/IITM/STCVP/SR/02(2017)/189 Monthly, Seasonal and Annual Rainfall Time Series for All-India, Homogeneous Regions and Meteorological Subdivisions: D.R. Kothawale 1 and M. Rajeevan 2 1 Indian Institute of Tropical Meteorology, Pune Ministry of Earth Sciences, Govt. of India, New Delhi *Corresponding Author Address: Dr. D.R. Kothawale Indian Institute of Tropical Meteorology, Dr. Homi Bhabha Road, Pashan, Pune , INDIA kotha@tropmet.res.in Phone: Indian Institute of Tropical Meteorology (IITM) Earth System Science Organization (ESSO) Ministry of Earth Sciences (MoES) PUNE, INDIA
3 DOCUMENT CONTROL SHEET Earth System Science Organization (ESSO) Ministry of Earth Sciences (MoES) Indian Institute of Tropical Meteorology (IITM) ESSO Document Number ESSO/IITM/STCVP/SR/02(2017)/189 Title of the Report Monthly, Seasonal and Annual Rainfall time series for All-India, Homogeneous Regions and Meteorological Subdivisions: Authors D.R. Kothawale, M. Rajeevan Type of Document Scientific Report (Research Report) Number of pages and figures 169, 40 Number of references 16 Keywords Southwest monsoon, significant trend, excess monsoon years, deficit monsoon years Security classification Open Distribution Unrestricted Date of Publication August, 2017 Abstract In this scientific research report, monthly, seasonal and annual area weighted rainfall time series for all-india, 5 homogeneous regions and 30 meteorological subdivisions for the period are constructed on the basis of a fixed and well distributed network of 306 rain gauge stations over India. Summer monsoon rainfall percentage departure series for all-india, homogeneous regions and all the subdivisions have been plotted indicating the excess, deficit and normal monsoon years. The statistical characteristics of the series i.e. Mean, Standard Deviation, Trend for different periods ( : Entire period and : Recent period) are also shown in the diagrams.
4 Summary All-India monsoon rainfall shows very weak decreasing trend of mm and mm per year for the period and respectively. During the recent period , on the sub-divisional scale, East Rajasthan and Saurashtra, Kutch & Diu show significant increasing trend in monsoon rainfall at 10% and 5% significance level respectively. Whereas, there are 3 subdivisions namely East Uttar Pradesh, Assam and Meghalaya and Sub-Himalayan West Bengal which show significant decreasing trend at 1%, 10 % and 10 % significance level respectively. The recent period mean seasonal rainfall of India as whole is decreased by 24.0 mm from the mean seasonal rainfall based on the period However, change in mean rainfall is not statistically significant. While, mean seasonal rainfall of Central Northeast India and Northeast India for the recent period is significantly reduced from the period On the sub-divisional scale, the mean seasonal rainfall based on the period is significantly reduced from mean seasonal rainfall for the period over the 7 subdivisions 1) Assam & Meghalaya, 2) Nagaland, Mani., Mizoram &Tripura, 3) East Uttar Pradesh, 4) West Uttar Pradesh, 5) East Madhya Pradesh, 6) Chhattisgarh and 7) Kerala and increased over 2 subdivisions 1) Konkan & Goa and 2) Coastal Andhra Pradesh. The information of regional and sub-divisional rainfall is very much useful to the Researchers, Policy makers and Governmental agencies. This report is updated version of earlier IITM Research Report (Parthasarthy et al. 1995).
5 Contents 1. Introduction 1 2. Details of Rainfall Data and Methodology 2 3. Quality Control of the Data 3 4. Preparation of All-India, Homogeneous Regions and 4 Subdivisional Rainfall Series 5. Statistical Characteristics of All-India, 5 Homogeneous Regions and Subdivisional Rainfall Series 6. Summary 8 Acknowledgements 9 References 9 Figure Captions 10 Table Captions 13 Figures 16 Tables 56
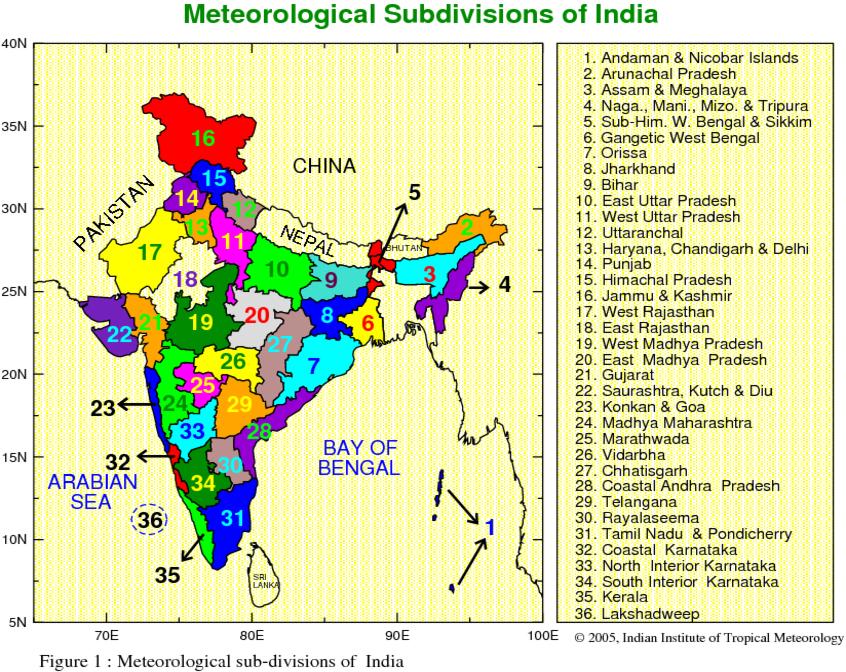
6 1 Introduction The variability of the Indian summer monsoon (ISM) affects the agriculture food grain production, industry and generation of hydroelectric power, causing severe strain on the national economy. Large parts of the country are severely affected due to deficit monsoon rainfall and government of India spends large amount of money on providing relief in affected areas. Importance of ISM to Indian economy and as major global circulation parameter has motivated many scientists to study the variability of Indian monsoon, in the past. During the last 4 to 5 decades, the rainfall series have been tabulated and the interannual variability of monsoon rainfall has been rigorously examined by several researchers, notably by Parthasarathy and Dhar (1976), Parthasarathy and Mooley (1978), Alvi and Koteswarm (1998), Thapliyal and Kulshresta (1991), Srivastava et al. (1992). These series were prepared with the number of rain gauge stations varying from 300 to 3,000 spread all over India for the different length of period starting from 1841 onwards. Recently Guhathakurtha and Rajeevan (2008) constructed monthly, seasonal and annual rainfall time series of 36 meteorological subdivisions of India (Figure 1) and India as one unit using the monthly rainfall data for the period with fixed network of 1476 rain gauge stations and later updated by Gughathakurta et al. (2015). They found a very good agreement between all-india summer monsoon rainfall series constructed by them and IITM rainfall data series. The correlation between these two series is Parthasarathy et al. (1995) have prepared monthly, seasonal and annual rainfall time series for all-india, 29 meteorological subdivisions and 5 homogeneous regions on the basis of fixed 306 rain gauge stations for the period These rainfall series were updated time to time up to the However, the rainfall time series for the period 1991 to 2014 were not based on fixed network of 306 stations due to insufficient availability of station rainfall data. Hence, rainfall series for the period 1991 to the latest available period (2014) were constructed by using sub-divisional rainfall data obtained from India Meteorological Department (IMD) by applying method given by Parthasarathy et al. (1992b) to maintain the consistency with rainfall series based on the station data. In the present Research Report, maximum efforts have been made to update the monthly rainfall data of 306 stations for the period 1991 to the recent available (up to 2014) and all-india, homogeneous regions and sub-divisional rainfall series were constructed for the same period. However, due to insufficient availability of stations data 1
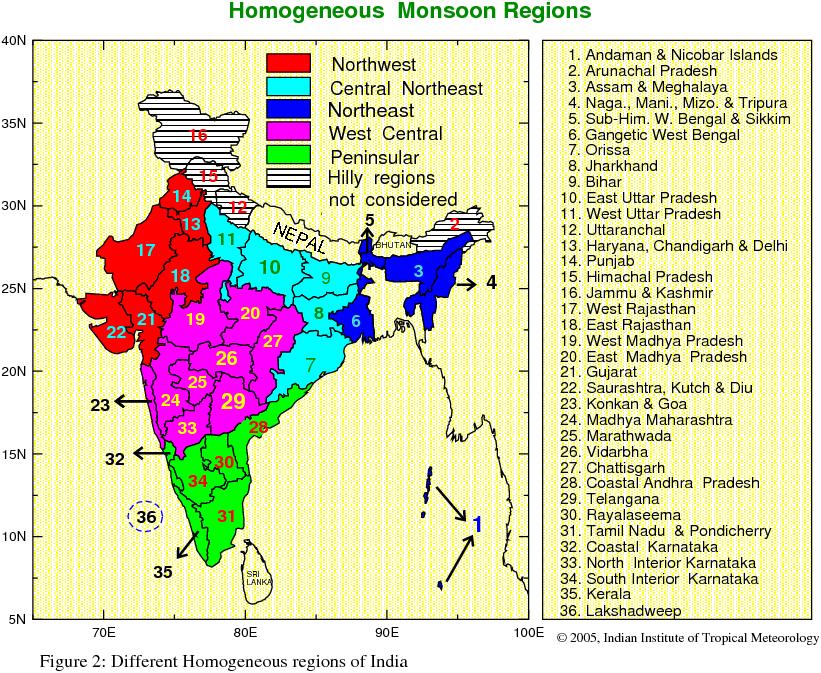
7 for the period the rainfall series of all-india, homogeneous regions and few subdivisions were constructed from IMD sub-divisional rainfall, as mentioned above. 2 Details of rainfall data and Methodology The validity of any statistical analysis depends on the quality of the data network of the stations used in the analysis. The number of rain gauge stations in the country has increased from about 50 in 1850 to 5,000 in 1990 (Parthasarthy et al. 1995). To avoid inhomogeneity, the initial screening of all the available data sets have been made and 306 rain gauge stations, one from each of the districts in the plain regions of India and distributed fairly uniform over the country, were selected to form the network of rain gauge stations in this report. A care has been taken to exclude a non-homogeneous record and only reliable or corrected stations data have been used to construct area averaged rainfall series. The earliest year for which reliable data are available for these stations is The relevant monthly rainfall data of 306 stations have been obtained for the period 1871 to the present from the records of IMD, Pune. The hilly regions consisting of four subdivisions in Himalayas (hatched areas in Figure 2, subdivision number 2, 12, 15 and 16) have not been considered in view of the inadequate rain gauge network and low areal representation of a rain gauge in a hilly area; moreover these regions receive substantial rainfall in the other seasons than the monsoon season. The island in the Bay of Bengal (subdivision number 1) and the Arabian sea ( subdivision number 36) have also not been considered for the present study to maintain contiguity. The contiguous area considered measures 2.88X10 6 Sq. Km. which constitutes about 90% of the country s total area. The spatial pattern of mean summer monsoon rainfall map based on data for 306 stations over the period ( Parthasarathy 1984a) is in good agreement with climatological (normal) map prepared by the India Meteorological Department (IMD) on the basis of about 3,000 rain gauge stations for the period (Rao, 1976, IMD, 1981). This shows that the rainfall stations selected in this study are adequately representative. The main source of monthly rainfall data of the 306 stations is National Data Center, IMD Pune. However, rainfall data of some of the 306 stations were not readily available in the published form or in the form of soft copy with IMD Pune. Hence, attempts were made to fill up the missing rainfall values from the different data sources i. e. Irrigation Dept., Revenue Dept., Agriculture Department of State Government, Regional Meteorological Centre of respective stations, Indian Daily Weather Reports 2
8 (IDWR) and Monthly Climatic Data for the World. The quality and homogeneity of the obtained data were examined critically. After filling the missing rainfall values, 93 to 97% of the 306 stations rainfall data are available for the period except the 2014, where 75% of the 306 stations data are available. On the sub-divisional scale, 90 to 100% stations rainfall data out of total number of stations in those sub-division are available for the period However, for very few subdivisions, 70 to 80 % stations rainfall data are available for the year 2013 and Lastly, remaining missing monthly rainfall values were estimated by the technique mentioned by Parthasarthy et al. (1992b). The technique is as follow. Where, R STN(i, j) = Station Rainfall, R SD(i, j) = Sub-divisional Rainfall, RSTN(J) = Station mean Rainfall, RSD(j) = Subdivisional mean Rainfall, i is the year & j is the month. 3 Quality control of the data Quality control measures were also taken up to identify outliers/errors in data archival process, such as keying or printing mistakes. The following procedures were followed to identify outliers/errors in the data sets. The monthly rainfall values for individual stations that differ from their corresponding long term means by more than four times their standard deviation were listed. The monthly rainfall of some of the 306 stations are reported in the IDWR and identified outlier values of these stations were checked from it and ensured, and finally outlier values were replaced by IDWR values. However, for some of the stations data are not reported in the IDWR, rainfall data of such stations were checked with rainfall of surrounding stations as well as percentage departure of respective sub-divisional rainfall. The synoptic systems during that month over that region have also been checked. If the identified outlier value is consistent with surrounding stations rainfall values and the respective station sub-divisional percentage departure rainfall of that month, then it is not treated as outlier. The identified outlier values were put as missing (-99.9), and those values were 3
9 interpolated as discussed above. During keying the data, the rainfall of very few stations for monsoon months (June-September) were wrongly reported as zero. For these stations, location of station and monsoon onset dates were checked for June and July months, and for August and September values were checked as per above discussed method and finally these values were interpolated as per above technique. 4 Preparation of All-India, Homogeneous region and Sub-divisional rainfall series Figure 1 shows the Meteorological subdivisions into which the country has been divided. Area weighted mean monthly rainfall (January through December ) for each of the 30 meteorological subdivisions (Figure 2) have been prepared by assigning the district area as a weight for each respective rain gauge station for the period However, for very few subdivisions, availability of stations data for the years 2013 and 2014 were not sufficient ( less than 80 % of total stations available in the subdivisions). Hence, the sub-divisional rainfall for those years were constructed by using IMD sub-divisional rainfall data as procedure given by Parthasarthy et al. (1992 a), and these years were also mentioned in respective sub-divisional rainfall time series listing as well as in corresponding figure. For the years 2015 and 2016, monthly rainfall of all the 306 stations are not readily available. Hence, the rainfall series of 2015 and 2016 of all the subdivisions were prepared from IMD sub divisional rainfall as mentioned above. All-India (India taken as one unit) average monthly rainfall values were computed by weighing each of the 30 sub-divisional rainfall, with their corresponding area as a weight for the period The country is then divided into five homogeneous regions on the basis of similarity in rainfall characteristics and association of sub divisional monsoon rainfall with regional/global circulation parameters (Parthasarathy et al. 1995). The five homogeneous regions are (i) Northwest (NW); (ii) West Central (WC); (iii) Central Northeast (CNE); (iv) Northeast (NE) and (v) Peninsular (PEN). Figure 2 shows these five homogeneous regions and the subdivisions comprising of them. Mean monthly rainfall series for the five homogeneous regions are also prepared by areaweighing the rainfall of the corresponding subdivisions, for the period It is to be noted that the all-india and regional rainfall for the period are based on station rainfall data due to inadequate availability of station rainfall data for the period 2014 to 2016, the rainfall for these 3 years were prepared from IMD sub-divisional rainfall as discussed earlier. The information of regional and sub-divisional rainfall is very 4
10 much useful to the Researchers, Policy makers and Governmental agencies. This report is updated version of earlier IITM Research Report ( Parthasarthy et al. 1995). 5 Statistical Characteristics of All-India, Homogeneous regions and Sub-divisional rainfall series The monsoon rainfall is very much important to the Indian economy and studies of global circulations. Hence, important statistical characteristics (Mean (M), Standard Deviation (SD) and Coefficient of Variation (CV) ) of monthly and seasonal rainfall series of 30 subdivisions, 5 homogeneous regions and all-india for the period have been computed and given in the Table For India as a whole, the monsoon months June, July, August and September are main rainy months. The mean rainfall of June, July, August and September is 163.1, 272.5, and mm respectively. The rainfall of July month is the highest and contributes 25 % of annual rainfall ( mm, Percentage to Annual: P-Ann.). The August rainfall is slightly less than that of July and contributes 22.3 % of the annual rainfall. The June and September rainfalls are almost same and they contribute 15.1 % and 15.7 % of the annual rainfall respectively. The year has been divided into four seasons viz., Winter (January+February: J+F), Pre-monsoon (March+April+May: MAM), Southwest Monsoon (June to September: JJAS) and Post Monsoon (October +November+December: OND) and the mean seasonal rainfall are 23.2 mm, 94.4 mm, mm and mm respectively. The Winter, Pre-Monsoon, Monsoon and Post-monsoon season contribute 2.1%, 8.7%, 78.1% and 11.1% of annual rainfall respectively. The CV is low in monsoon season 9.8 % and the highest in winter season 49.9%. Abnormalities in the performance of Southwest monsoon rainfall over different parts of India have a significant impact on national economy. The abnormalities in the performance of Southwest monsoon rainfall is the occurrence of excess or deficit monsoon rainfall. Hence, all-india, homogeneous regions and sub-divisional monsoon rainfall of each year has been classified into three categories viz., Excess, Deficit and Normal as follows Excess : R > or = M+SD Deficit : R < or = M-SD Normal : M-SD < R < M+SD 5
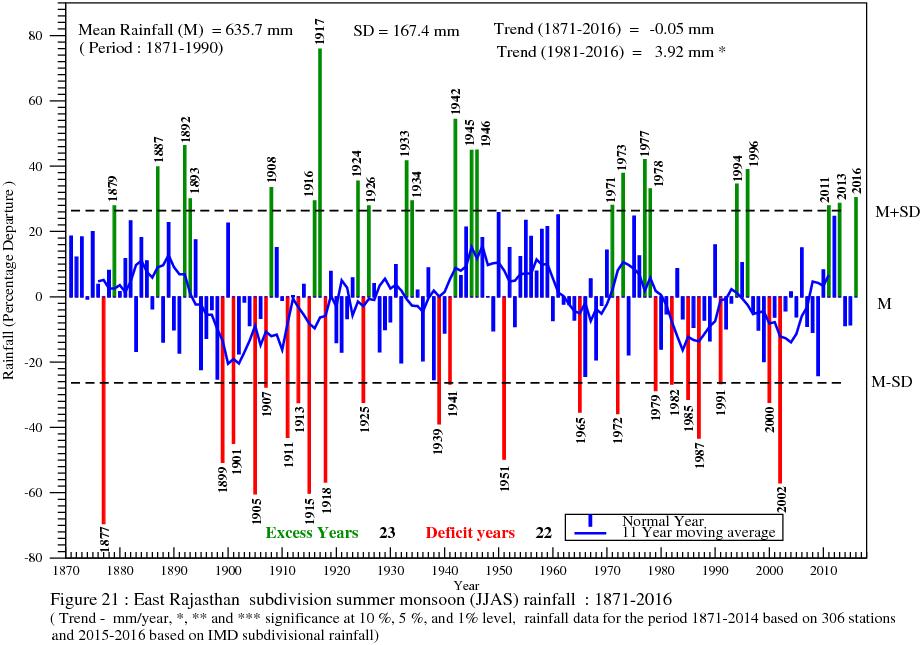
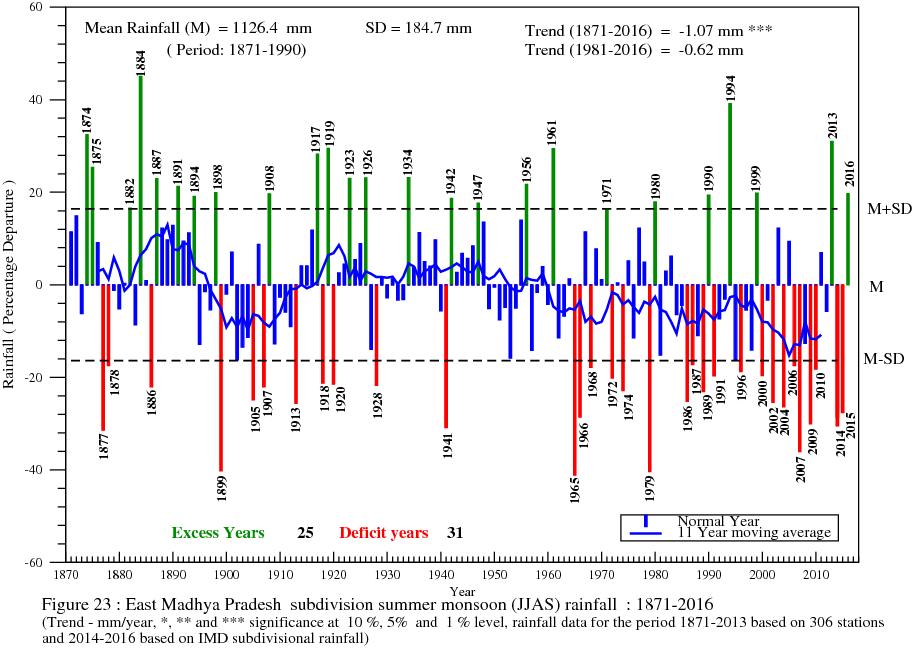
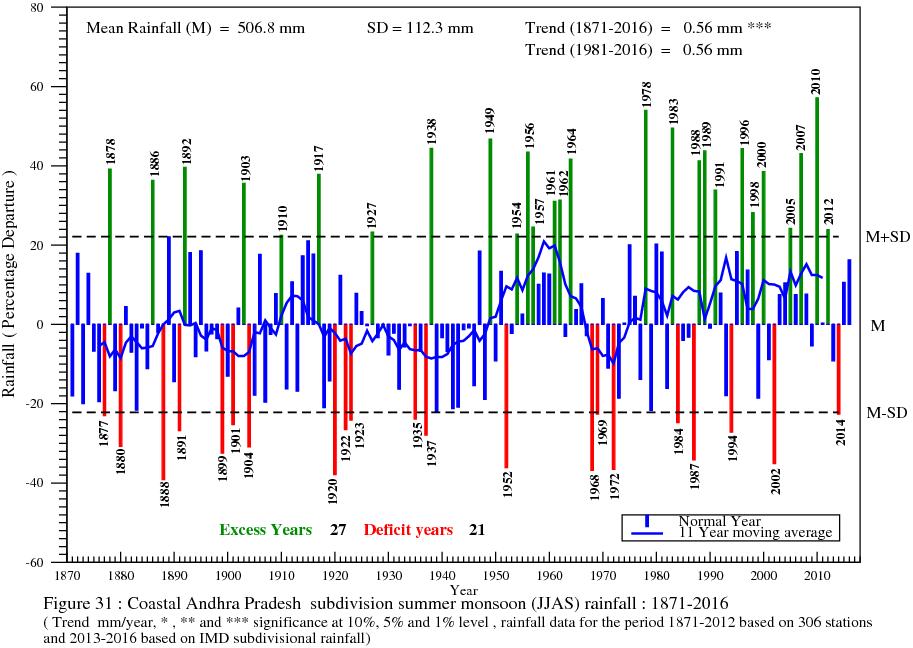
11 Where M and SD are Mean and Standard Deviation of seasonal rainfall time series, R is seasonal rainfall. The criteria used in this study is taken from Parthasarathy et al. (1992b). For all-india, during the period , seasonal rainfall was excess in 20 years (green bars), deficit in 27 years (red bars) and normal in 99 years (blue bars) ( Figure 3 ). It is observed that there are relatively more frequent deficit years (10) during the period During the recent period ( , 36 years) deficit years are 9 and out of 9, 4 years ( 1982, 1985, 1986 and 1987) are common in both periods. The linear trend in seasonal rainfall series have been examined for the entire as well as recent period and very weak decreasing trend of mm and mm per year is observed respectively (Figure 3 ). For the country as a whole, the summer monsoon rainfall do not show any significant trend. However, there may be large variation in the regional scale. In order to study the long term changes in regional as well as sub divisional scale, we have carried out linear trend analysis using monsoon season rainfall of five homogeneous regions and 30 meteorological subdivisions for the period and recent period The significance of trend has been assessed by Mann Kendall rank statistic test. Year wise variation in the summer monsoon rainfall indicating excess, deficit and normal years during the period of all-india, 5 homogeneous regions and 30 meteorological are shown in the Figures 3 to 38. The statistical characteristics of all-india, homogeneous regions and subdivisions are also given in the Figure 3 to 38. During the entire period , three subdivisions viz., Konkan & Goa, Coastal Karnataka and Coastal Andhra Pradesh show significant increasing trend at 1%, 5 % and 1% level of significance respectively. While, 7 subdivisions viz., Assam & Meghalaya (5%), Nagaland, Manipur, Mizoram and Tripura (1%), East Uttar Pradesh (5%), West Uttar Pradesh (5%), East Madhya Pradesh (1%), Chhattisgarh (1%) and Kerala (10%) show significant decreasing trend ( Table 37, numbers in the bracts are level of significance). During the recent period , three subdivisions namely East Uttar Pradesh (1%), Assam and Meghalaya (10%) and Sub Himalayan West Bengal (10%) show significant decreasing trend, while only two subdivisions viz., East Rajasthan and Saurashtra, Kutch & Diu show significant increasing trend at 10 % and 5 % significance level respectively (Table 37, Figure 21 and Figure 25 ). 6
12 Keeping the view that the recent period is an accelerated warming period (Kothawale and Rupa Kumar 2005, Kothawale et al. 2010) and climate regime shift has been observed in 1980s (Terray and Dominiak 2005), all-india, regional and sub-divisional rainfall series were divided in two parts i. e and and the means of summer monsoon seasonal rainfall have been computed for all-india, homogeneous regions and 30 meteorological subdivisions for both periods and change between their rainfall means were examined. It is observed that mean seasonal rainfall of the period is less than that of mean rainfall of the period for the 18 subdivisions and also for all-india (Figure 40). Out of 18 subdivisions, the mean seasonal rainfall based on the period is significantly reduced from mean seasonal rainfall for the period over the 7 subdivisions viz., Assam & Meghalaya (5%), Nagaland, Manipur, Mizoram and Tripura (5%), East Uttar Pradesh (5%), West Uttar Pradesh (10%), East Madhya Pradesh (5%), Chhattisgarh (5%) and Kerala (10%), and increased over 2 subdivisions Konkan & Goa and Coastal Andhra Pradesh, at 5% significance level (Figure 40). The significance of change is tested by student t-test. India as whole, mean monsoon season rainfall for the period and are mm and mm respectively. The recent period mean seasonal rainfall is decreased by 24 mm from the mean rainfall based on the period However, change in mean rainfall is not statistically significant. The mean seasonal rainfall of Central Northeast India and Northeast India for the recent period is significantly reduced from the period The probability of occurrence of excess/deficit monsoon is computed for all-india and 30 subdivisions. The probability of occurrence of deficit monsoon is very less (10%) over Konkan & Goa and is the highest over Assam & Meghalaya and East Madhya Pradesh (21.2 %). India as whole, probability of deficit /excess monsoon year is 19/14 %. 7
13 Summary Monthly, seasonal and annual rainfall series have been prepared for all-india (India taken as one unit), 5 homogeneous regions and 30 meteorological sub-divisions after thoroughly scrutinizing the 306 rain gauge stations for the period and their statistical characteristics and long term variability are discussed. Monthly and seasonal rainfall data listing of all-india, 5 homogeneous regions and 30 meteorological subdivisions are given to meet needs of researchers working on Indian rainfall. Southwest monsoon rainfall (% departures) of India as whole, 5 homogeneous regions and 30 subdivisions are presented indicating excess, deficit and normal monsoon years as well as trend for two periods and All-India monsoon rainfall shows very weak decreasing trend of mm and mm per year for the period and respectively. During the recent period , on the sub-divisional scale, East Rajasthan and Saurashtra, Kutch & Diu show significant increasing trend in monsoon rainfall at 10% and 5 % significance level respectively. Whereas, there are 3 subdivisions namely East Uttar Pradesh, Assam and Meghalaya and Sub-Himalayan West Bengal show significant decreasing trend at 1%, 10 % and 10 % significance level respectively. The recent period mean seasonal rainfall of India as whole is decreased by 24.0 mm from the mean rainfall based on the period However, change in mean rainfall is not statistically significant. However, mean seasonal rainfall of Central Northeast India and Northeast India for the recent period is significantly reduced from the period On the sub-divisional scale, the mean seasonal rainfall based on the period is significantly reduced from mean seasonal rainfall for the period over the 7 subdivisions 1) Assam & Meghalaya, 2) Nagaland, Mani. Mizoram & Tripura, 3) East Uttar Pradesh, 4) West Uttar Pradesh, 5) East Madhya Pradesh, 6) Chhattisgarh and 7) Kerala and increased over 2 subdivisions 1) Konkan & Goa and 2) Coastal Andhra Pradesh 8
14 Acknowledgements The authors would like to thank Prof. Ravi S. Nanjundiah Director, Indian Institute of Tropical Meteorology (IITM), Pune and Dr. R. Krishnan Executive Director of CCCR for providing the necessary facilities for this study. The authors are also grateful to India Meteorological Department, Pune, Regional Meteorological Centers for providing station rainfall data and Irrigation, Revenue, Agriculture Department of State Government for providing rainfall data of selected years. Sincere thanks to Drs. Ashwini Kulkarni, N.R. Deshpande, H.N. Singh and J.R. Kulkarni for valuable suggestion in preparation of the data series and Dr. S.K. Patwardhan reviewing the manuscript critically. References Alvi, S.M.A. and Koteswaram, P Time series analysis of annual rainfall over India. Mausam, 36, Guhathakurta, P. and Rajeevan, M Trends in the rainfall pattern over India. Int. J. Climatol. 28, Guhathakurta, P., Rajeevan, M., Sikka, D.R. and Tyagi A Observed changes in southwest monsoon rainfall over India during Int. J. Climatol., 35, India Meteorological Department, Climatological Atlas of India: Part A (Rainfall). IMD, Pune. Kothawale, D.R. and Rupa Kuamr, K On the recent changes in surface temperature trends over India. Geophysical Res. Lett. 32:L Doi: /2005GL Kothawale, D.R., Munot, A.A. and Krishna Kumar, K Surface air temperature variability over India during , and its association with ENSO. Clim. Res. Vol. 42: Parthasarathy, B. and Dhar, O. N A study of trends and periodicities in the seasonal and annual rainfall of India. Indian J. Meteorol. Hydrol. And Geophs., Parthasarathy, B. and Mooley, D.A Some features of a long homogeneous series of Indian summer monsoon rainfall. Mon. Wea. Rev., Parthasarathy, B., Some Aspect of Large-Scale fluctuations in the summer monsoon rainfall over India during Ph. D. Thesis, University of Poona, Pune, P.370. Parthasarathy, B., Rupa Kumar, K. and Kothawale, D.R. 1992(a). Indian summer monsoon rainfall indices; Meteorol. Mag., 121, Parthasarathy, B., Rupa Kumar, K. and Munot, A.A. 1992(b). Forecasting of rainy-season food grain production based on monsoon rainfall. Indian J. Agri., 62,
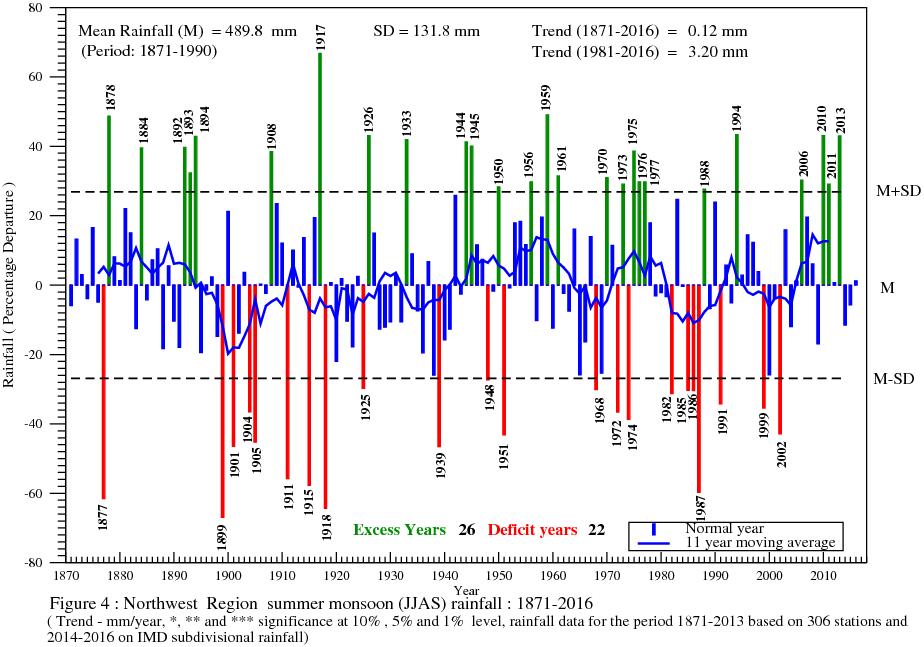
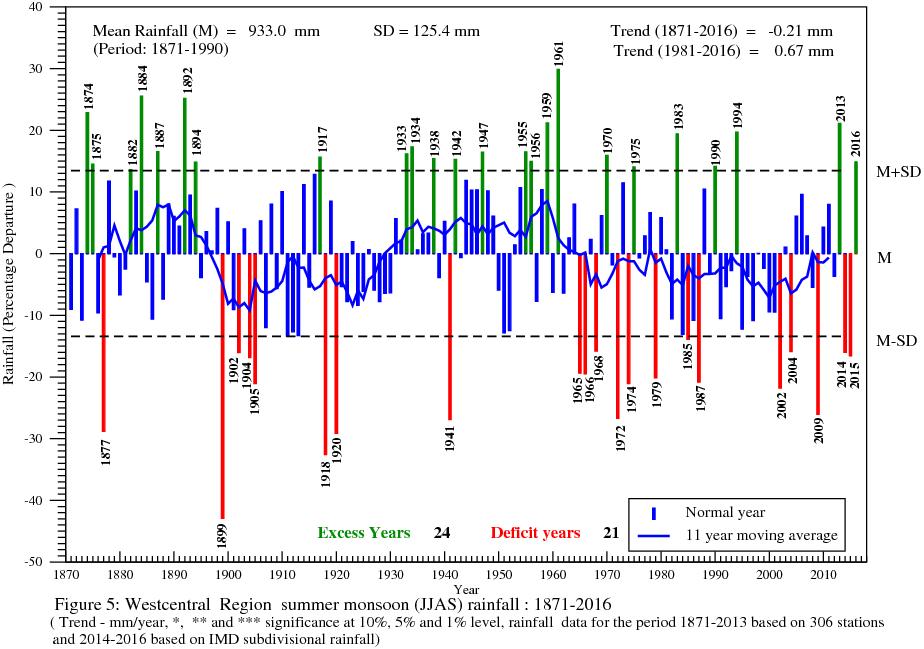
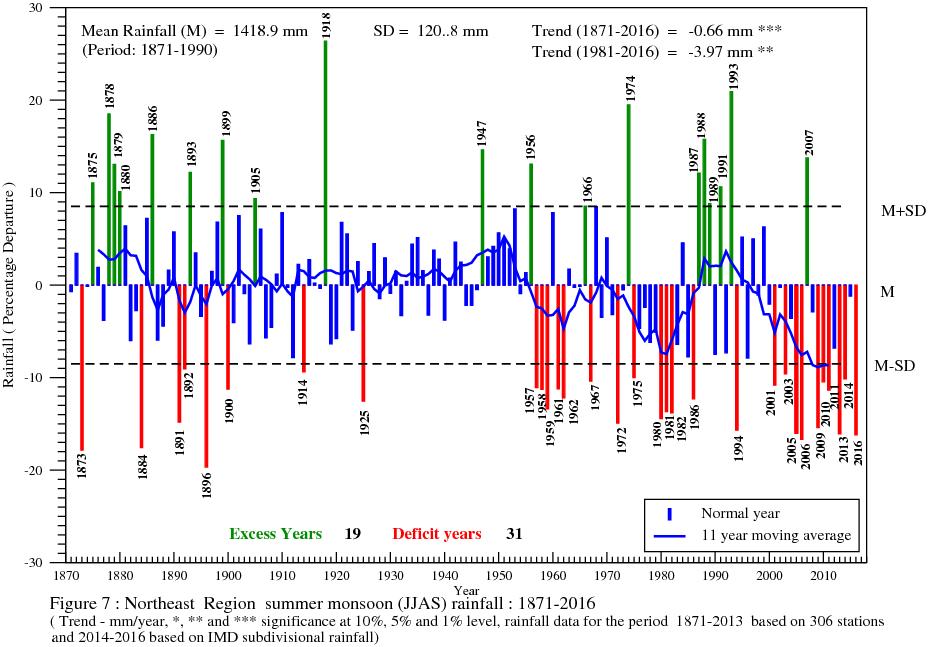
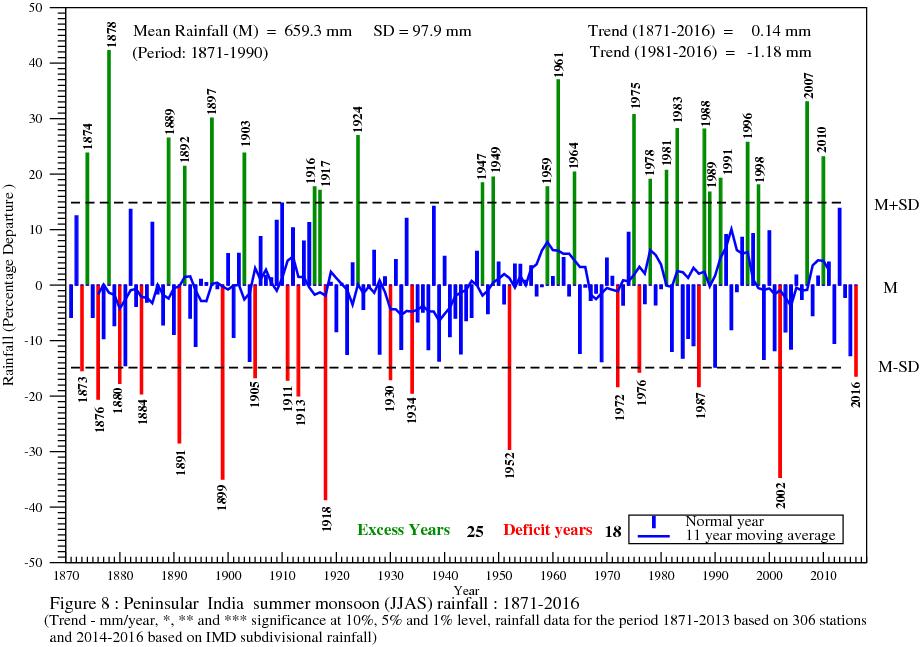
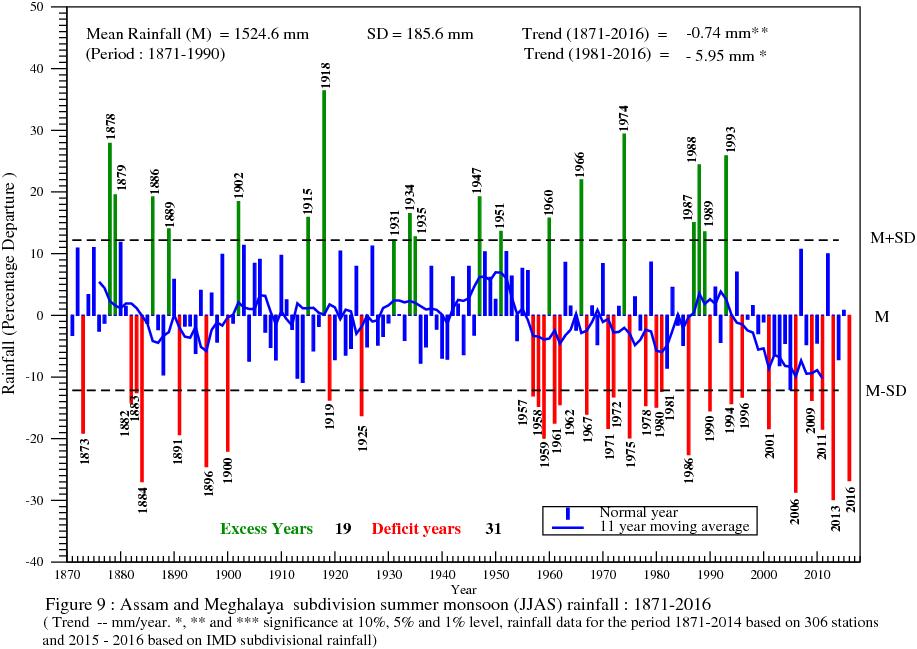
15 Parthasarathy, B., Munot, A.A. and Kothawale, D.R., Monthly and seasonal rainfall series for all-india, Homogeneous Regions and Meteorological subdivisions: IIIN , Research Report No. RR-065. Rao, Y.P Southwest Monsoon, Meteorological Monograph Synoptic Meteorology No. 1/1976, India Meteorological Department, Pune, pp Srivastava, H.N., Dewan, B.N., Dixit, S.K., Prakash Rao, G.S., Singh, S.S. and Rao, K.R Decadal trends in climate over India. Mausam, 43, Thapliyal, V. and Kulshrestha, S.M Climate changes and trends over India. Mausam, 42, Terray, P. and Dominiak, S. (2005), Indian Ocean sea surface temperature and El Niño Southern Oscillation: A new perspective, J. Clim., 18, Figure Captions Figure 1: Meteorological subdivisions of India. Figure 2: Different Homogeneous regions of India Figure 3 : All-India Summer monsoon (JJAS) rainfall : (Trend mm/year, *,** and *** significance at 10%,5% and 1% level, rainfall for the periods based on 306 stations and based on IMD subdivisional rainfall) Figure 4: Northwest India Summer monsoon (JJAS) rainfall : (Trend mm/year, *,** and *** significance at 10%,5% and 1% level, rainfall for the periods based on 306 stations and based on IMD subdivisional rainfall) Figure 5: West Central India Summer monsoon (JJAS) rainfall : (Trend mm/year, *,** and *** significance at 10%,5% and 1% level, rainfall for the periods based on 306 stations and based on IMD subdivisional rainfall) Figure 6: Central Northeast India Summer monsoon (JJAS) rainfall : (Trend mm/year, *,** and *** significance at 10%,5% and 1% level, rainfall for the periods based on 306 stations and based on IMD subdivisional rainfall) Figure 7: Northeast India Summer monsoon (JJAS) rainfall : (Trend mm/year, *,** and *** significance at 10%,5% and 1% level, rainfall for the periods based on 306 stations and based on IMD subdivisional rainfall) Figure 8: Peninsular India Summer monsoon (JJAS) rainfall : (Trend mm/year, *,** and *** significance at 10%,5% and 1% level, rainfall for the periods based on 306 stations and based on IMD subdivisional rainfall) Figure 9: Assam and Meghalaya subdivision Summer monsoon (JJAS) rainfall : (Trend mm/year, *,** and *** significance at 10%,5% and 1% level, rainfall for the periods based on 306 stations and based on IMD subdivisional rainfall) Figure 10: Nagaland, Manipur, Mizoram and Tripura subdivision Summer monsoon (JJAS) rainfall : (Trend mm/year, *,** and *** significance at 10%, 5% and 1% level, rainfall for the periods based on 306 stations and based on IMD subdivisional rainfall) 10
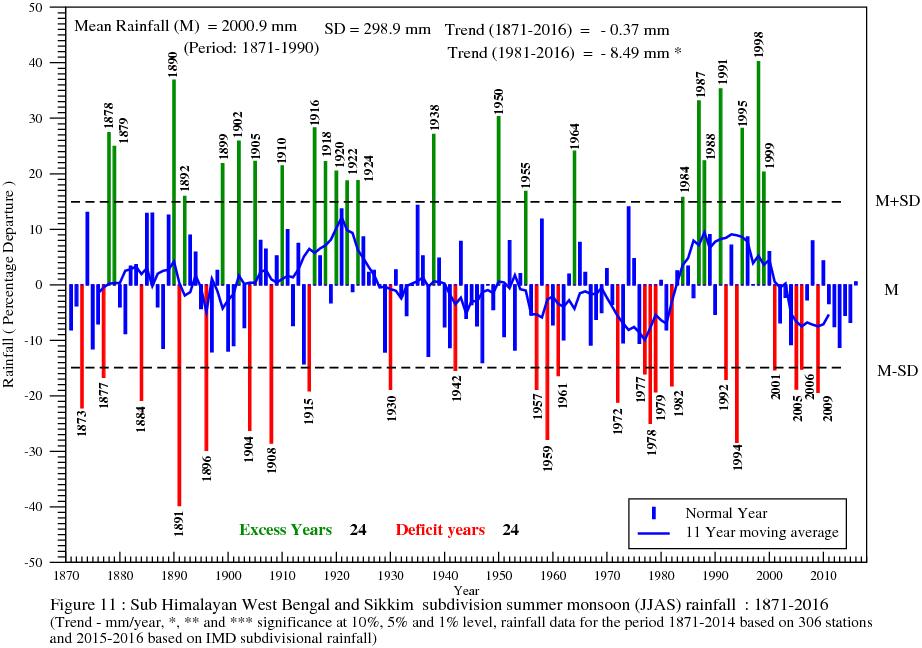
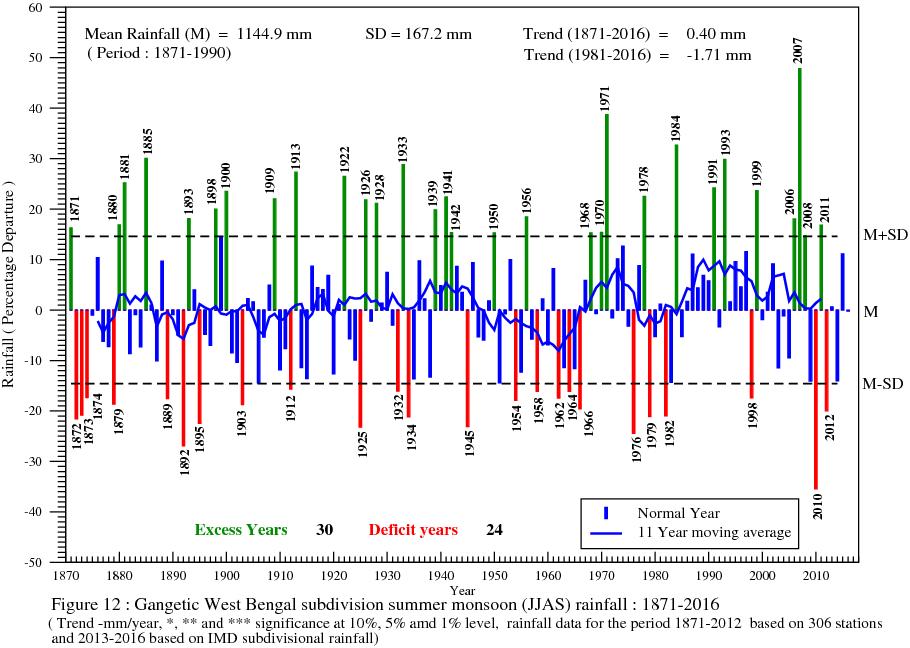
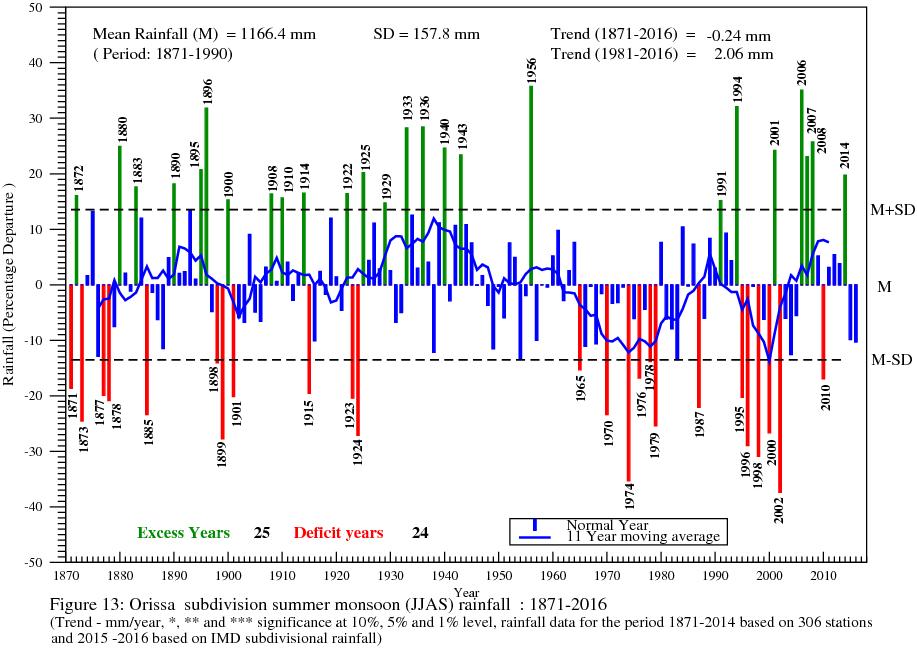
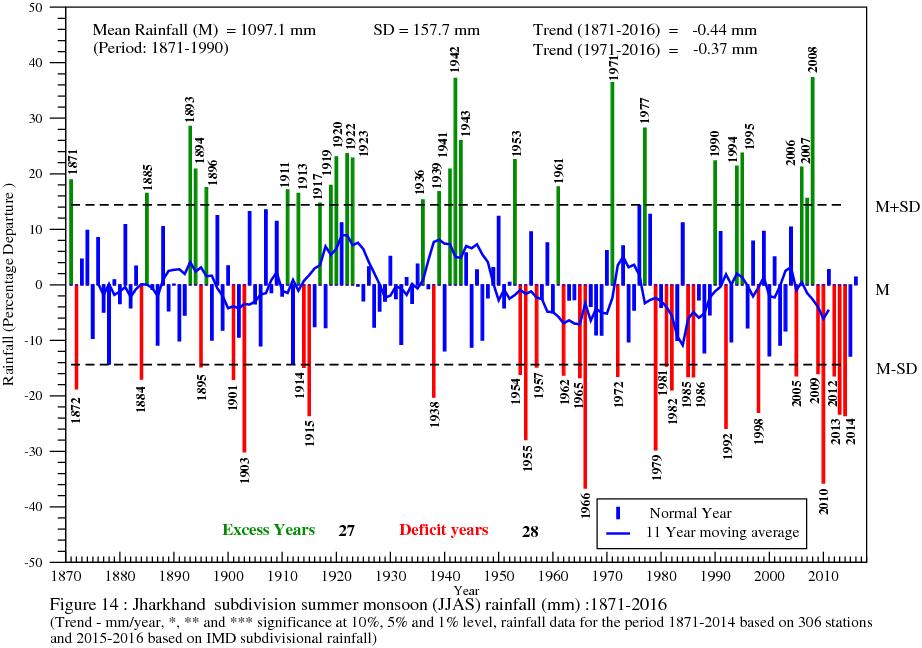
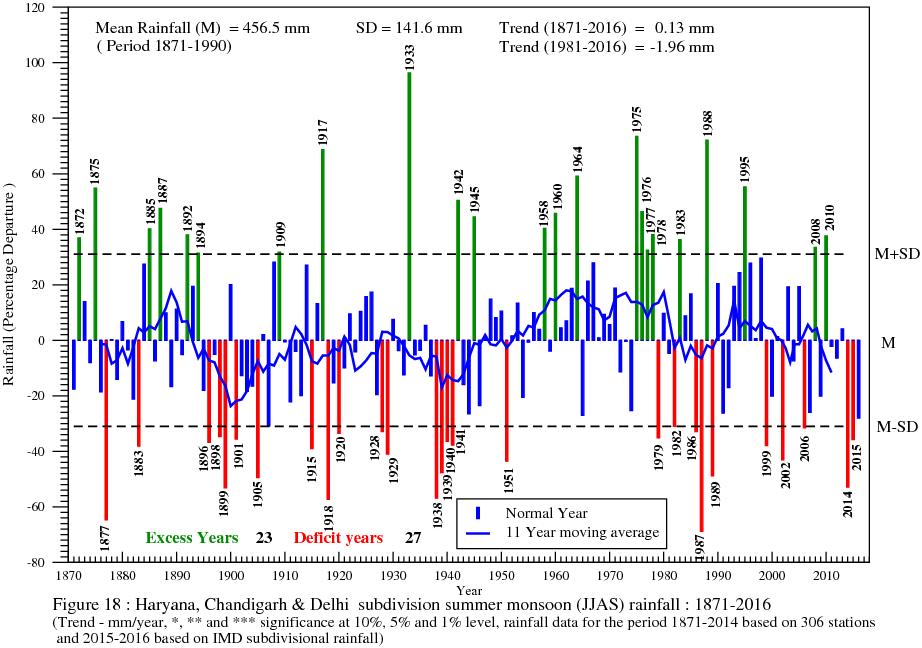
16 Figure 11: Sub Himalayan West Bengal & Sikkim subdivision Summer monsoon (JJAS) rainfall : (Trend mm/year, *,** and *** significant at 10%, 5% and 1% level, rainfall for the periods based on 306 stations and based on IMD subdivisional rainfall) Figure 12: Gangetic West Bengal subdivision Summer monsoon (JJAS) rainfall : (Trend mm/year, *,** and *** significance at 10%, 5% and 1% level, rainfall for the periods based on 306 stations and based on IMD subdivisional rainfall) Figure 13: Orissa subdivision Summer monsoon (JJAS) rainfall : (Trend mm/year, *,** and *** significance at 10%, 5% and 1% level, rainfall for the periods based on 306 stations and based on IMD subdivisional rainfall) Figure 14: Jharkhand subdivision Summer monsoon (JJAS) rainfall : (Trend mm/year, *,** and *** significance at 10%, 5% and 1% level, rainfall for the periods based on 306 stations and based on IMD subdivisional rainfall) Figure 15: Bihar subdivision Summer monsoon (JJAS) rainfall : (Trend mm/year, *,** and *** significance at 10%, 5% and 1% level, rainfall for the periods based on 306 stations and based on IMD subdivisional rainfall) Figure 16: East Uttar Pradesh subdivision Summer monsoon (JJAS) rainfall : (Trend mm/year, *,** and *** significance at 10%, 5% and 1% level, rainfall for the periods based on 306 stations and based on IMD subdivisional rainfall) Figure 17: West Uttar Pradesh subdivision Summer monsoon (JJAS) rainfall : (Trend mm/year, *,** and *** significance at 10%, 5% and 1% level, rainfall for the periods based on 306 stations and based on IMD subdivisional rainfall) Figure 18: Haryana, Chandigarh & Delhi subdivision Summer monsoon (JJAS) rainfall : (Trend mm/year, *,** and *** significance at 10%, 5% and 1% level, rainfall for the periods based on 306 stations and based on IMD subdivisional rainfall) Figure 19: Punjab subdivision Summer monsoon (JJAS) rainfall : (Trend mm/year, *,** and *** significance at 10%, 5% and 1% level, rainfall for the periods based on 306 stations and based on IMD subdivisional rainfall) Figure 20: West Rajasthan subdivision Summer monsoon (JJAS) rainfall : (Trend mm/year, *,** and *** significance at 10%, 5% and 1% level, rainfall for the periods based on 306 stations and based on IMD subdivisional rainfall) Figure 21: East Rajasthan subdivision Summer monsoon (JJAS) rainfall : (Trend mm/year, *,** and *** significance at 10%, 5% and 1% level, rainfall for the periods based on 306 stations and based on IMD subdivisional rainfall) Figure 22: West Madhya Pradesh Summer monsoon (JJAS) rainfall : (Trend mm/year, *,** and *** significance at 10%, 5% and 1% level, rainfall for the periods based on 306 stations and based on IMD subdivisional rainfall) Figure 23: East Madhya Pradesh Summer monsoon (JJAS) rainfall : (Trend mm/year, *,** and *** significance at 10%, 5% and 1% level, rainfall for the periods based on 306 stations and based on IMD subdivisional rainfall) 11
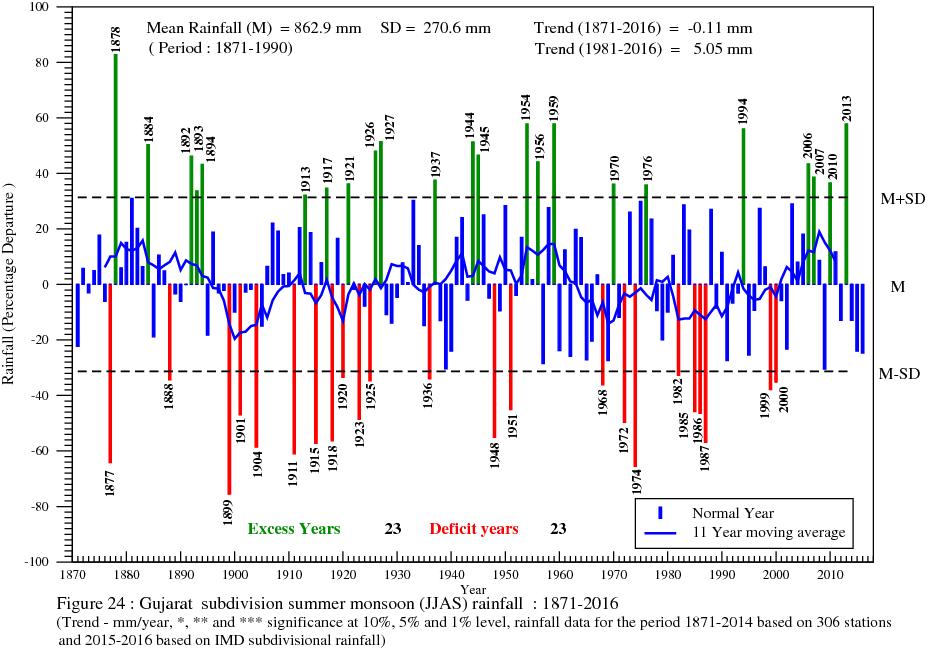
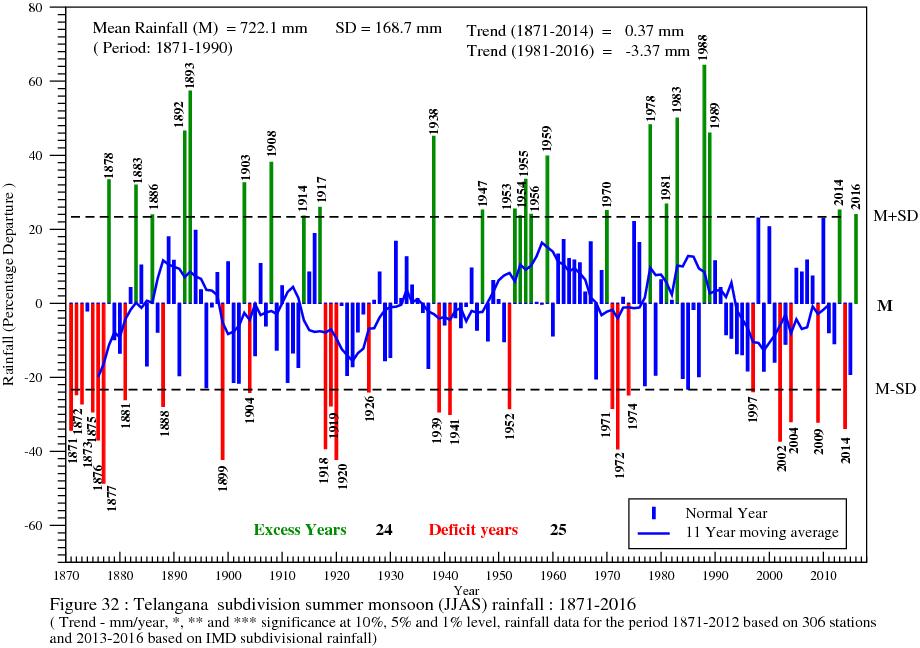
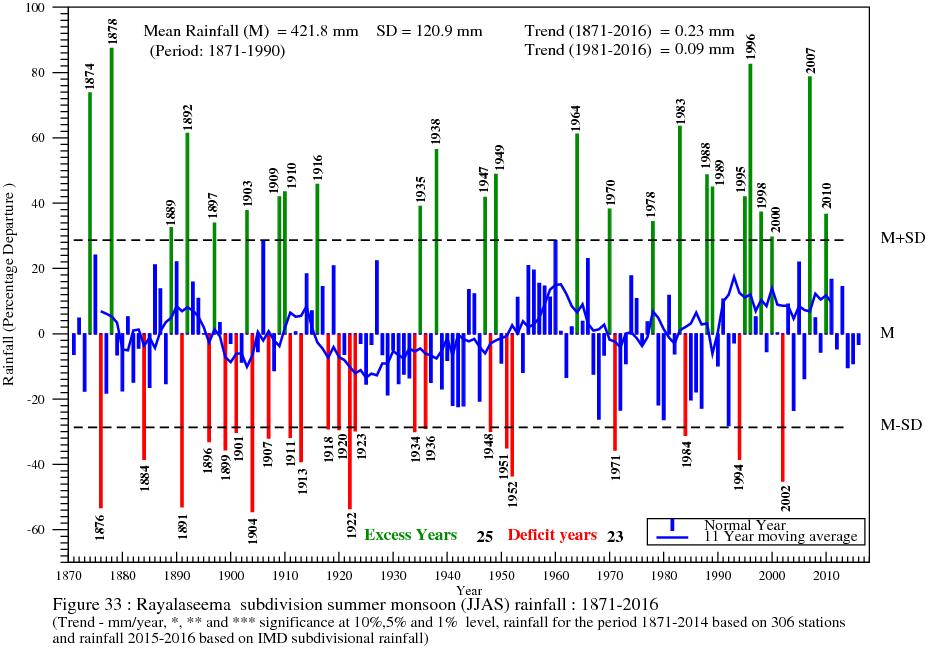
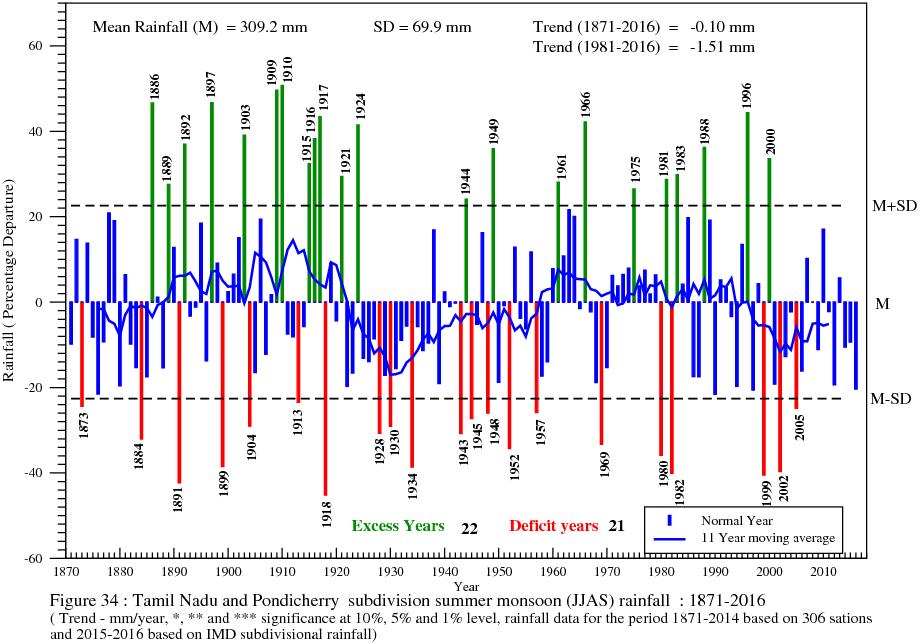
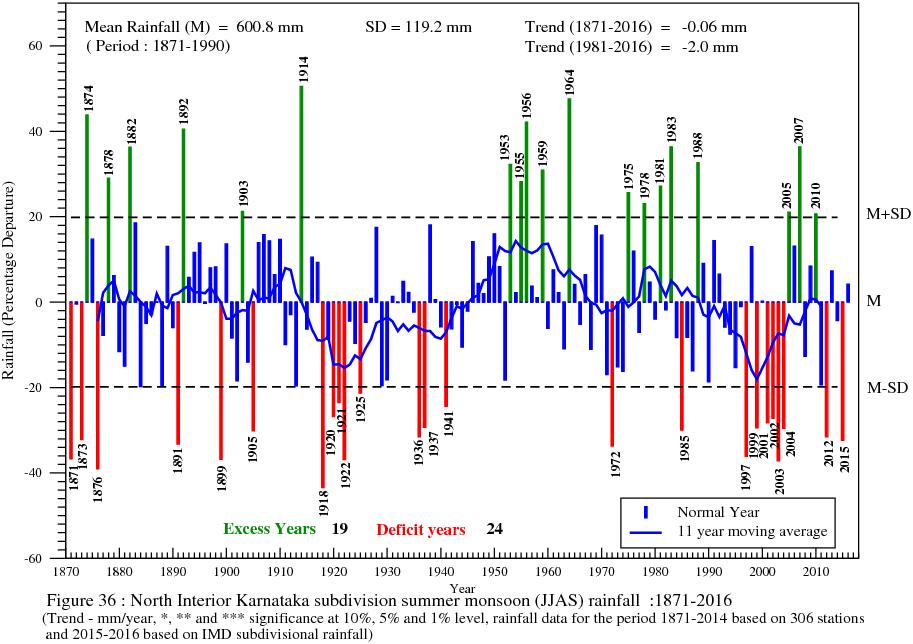
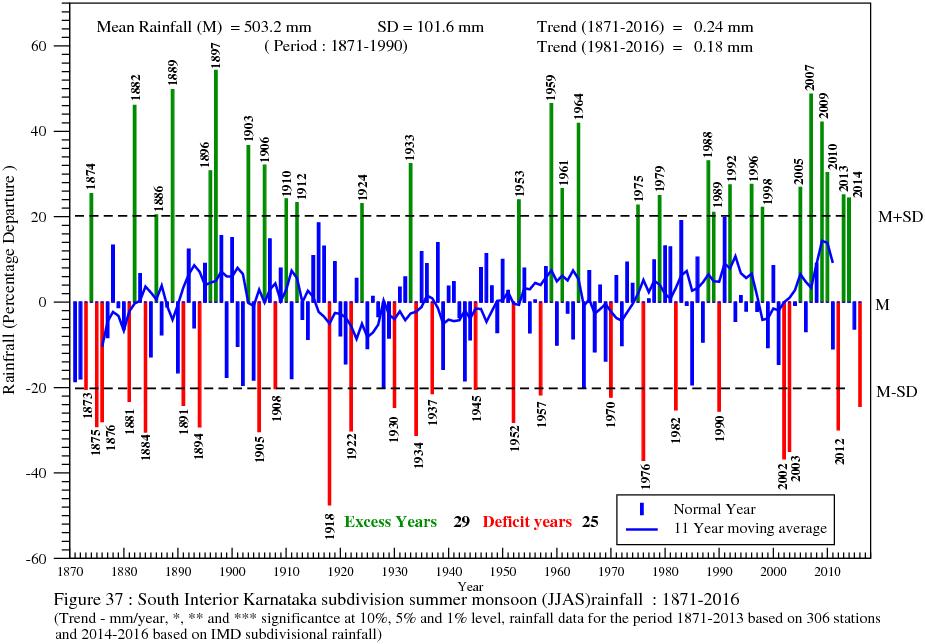
17 Figure 24: Gujarat subdivision Summer monsoon (JJAS) rainfall : (Trend mm/year, *,** and *** significance at 10%, 5% and 1% level, rainfall for the periods based on 306 stations and based on IMD sub divisional rainfall) Figure 25: Saurashtra, Kutch & Diu subdivision Summer monsoon (JJAS) rainfall : (Trend mm/year, *,** and *** significant at 10%, 5% and 1% level, rainfall for the periods based on 306 stations and based on IMD subdivisional rainfall) Figure 26: Konkan & Goa subdivision Summer monsoon (JJAS) rainfall : (Trend mm/year, *,** and *** significance at 10%, 5% and 1% level, rainfall for the periods based on 306 stations and based on IMD subdivisional rainfall) Figure 27: Madhya Maharashtra subdivision Summer monsoon (JJAS) rainfall : (Trend mm/year, *,** and *** significant at 10%, 5% and 1% level, rainfall for the periods based on 306 stations and based on IMD subdivisional rainfall) Figure 28: Marathwada subdivision Summer monsoon (JJAS) rainfall : (Trend mm/year, *,** and *** significance at 10%, 5% and 1% level, rainfall for the periods based on 306 stations and based on IMD subdivisional rainfall) Figure 29: Vidarbha subdivision Summer monsoon (JJAS) rainfall : (Trend mm/year, *,** and *** significance at 10%, 5% and 1% level, rainfall for the periods based on 306 stations and based on IMD subdivisional rainfall) Figure 30: Chhattisgarh subdivision Summer monsoon (JJAS) rainfall : (Trend mm/year, *,** and *** significance at 10%, 5% and 1% level, rainfall for the periods based on 306 stations and based on IMD subdivisional rainfall) Figure 31: Coastal Andhra Pradesh subdivision Summer monsoon (JJAS) rainfall : (Trend mm/year, *,** and *** significance at 10%, 5% and 1% level, rainfall for the periods based on 306 stations and based on IMD subdivisional rainfall) Figure 32: Telengana subdivision Summer monsoon (JJAS) rainfall : (Trend mm/year, *,** and *** significance at 10%, 5% and 1% level, rainfall for the periods based on 306 stations and based on IMD subdivisional rainfall) Figure 33: Rayalseema subdivision Summer monsoon (JJAS) rainfall : (Trend mm/year, *,** and *** significance at 10%, 5% and 1% level, rainfall for the periods based on 306 stations and based on IMD subdivisional rainfall) Figure 34: Tamil Nadu & Pondicherry Summer monsoon (JJAS) rainfall : (Trend mm/year, *,** and *** significance at 10%, 5% and 1% level, rainfall for the periods based on 306 stations and based on IMD subdivisional rainfall) Figure 35: Coastal Karnataka subdivision Summer monsoon (JJAS) rainfall : (Trend mm/year, *,** and *** significance at 10%, 5% and 1% level, rainfall for the periods based on 306 stations and based on IMD subdivisional rainfall) Figure 36: North Interior Karnataka subdivision Summer monsoon (JJAS) rainfall : (Trend mm/year, *,** and *** significant at 10%, 5% and 1% level, rainfall for the periods based on 306 stations and based on IMD subdivisional rainfall) Figure 37: South Interior Karnataka subdivision Summer monsoon (JJAS) rainfall : (Trend mm/year, *,** and *** significance at 10%, 5% and 1% level, rainfall for the periods based on 306 stations and based on IMD subdivisional rainfall) 12
18 Figure 38: Kerala subdivision Summer monsoon (JJAS) rainfall : (Trend mm/year, *,** and *** significance at 10%, 5% and 1% level, rainfall for the periods based on 306 stations and based on IMD subdivisional rainfall) Figure 39: Trends in summer monsoon rainfall of 30 meteorological subdivisions, 5 homogeneous regions and All-India for the period and (*, ** and *** significance at 10%, 5% and 1% level) Figure 40 : Comparison between mean summer monsoon rainfall based on the period and for 30 meteorological subdivisions, 5 homogeneous regions and All-India ( * and ** significance at 10% and 5 % level) Table Table 1: ALL-INDIA RAINFALL ( ) 30 SUBDIVISIONS, AREA SQ.KM. Monthly and seasonal and Annual rainfall (in 10th of mm) ( based on 306 stations and based on IMD Subdivisional rainfall) Table 2: NORTHWEST INDIA RAINFALL ( ) 6 SUB, AREA SQ.KM Monthly and seasonal and Annual rainfall (in 10th of mm) ( based on 306 stations and based on IMD Subdivisional rainfall Table 3: WEST CENTRAL INDIA RAINFALL( ) 9 SUBDIVISIONS, AREA SQ.KM Monthly and seasonal and Annual rainfall (in 10th of mm) ( based on 306 stations and based on IMD Subdivisional rainfall Table 4: NORTHEAST INDIA RAINFAL ( ) 4 SUBDIVISIONS, AREA SQ.KM Monthly and seasonal and Annual rainfall (in 10th of mm) ( based on 306 stations and based on IMD Subdivisional rainfall Table 5: CENTRAL NORTHEAST INDIA RAINFAL ( ) 4 SUBDIVISIONS, AREA SQ.KM. Monthly and seasonal and Annual rainfall (in 10th of mm) ( based on 306 stations and based on IMD Subdivisional rainfall) Table 6 : PENINSULAR INDIA RAINFALL ( ) 6 SUBDIVISIONS, AREA SQ.KM Monthly, seasonal and Annual rainfall (in 10th of mm) ( based on 306 stations and based on IMD Subdivisional rainfall Table 7: ASSAM & MEGHALAYA SUBDIVISION, AREA SQ.KM 3.79 PER, 10 STN Monthly, seasonal and Annual rainfall (in 10th of mm) ( based on 306 stations and based on IMD Subdivisional rainfall Table 8: NAGA.MANI.MIZO.&TRIP SUBDIVISION, AREA SQ.KM 2.45 PER, 4 STN Monthly and seasonal and Annual rainfall (in 10th of mm) ( based on 306 stations and based on IMD Subdivisional rainfall) Table 9: SUB-HIMA. WEST BENGAL SUBDIVISION, AREA SQ.KM 0.75 PER, 5 STN Monthly, seasonal and Annual rainfall (in 10th of mm) ( based on 306 stations and based on IMD Subdivisional rainfall) Table 10: GANGETIC WEST BENGAL SUBDIVISION, AREA SQ.KM 2.30 PER, 11 STN Monthly, seasonal and Annual rainfall (in 10th of mm) ( based on 306 stations and based on IMD Subdivisional rainfall) Table 11: ORISSA SUBDIVISION, AREA SQ.KM PER, 13 STN 13
19 Monthly, seasonal and Annual rainfall (in 10th of mm) ( based on 306 stations and based on IMD Subdivisional rainfall) Table 12: JHARKHAND SUBDIVISION, AREA SQ.KM 2.76 PER, 6 STN Monthly, seasonal and Annual rainfall (in 10th of mm) ( based on 306 stations and based on IMD Subdivisional rainfall. Table 13: BIHAR SUBDIVISION, AREA SQ.KM 3.27 PER, 11 STN Monthly and seasonal and Annual rainfall (in 10th of mm) ( based on 306 stations and based on IMD Subdivisional rainfall Table 14: EAST UTTAR PRADESH SUBDIVISION, AREA SQ.KM 5.09 PER, 26 STN Monthly, seasonal and Annual rainfall (in 10th of mm) ( based on 306 stations and based on IMD Subdivisional rainfall Table 15: WEST UTTAR PRADESH PLAINS, SUBDIVISION, AREA SQ.KM 3.36 PER, 19 STN Monthly and seasonal and Annual rainfall (in 10th of mm) ( based on 306 stations and based on IMD Subdivisional rainfall). Table 16: HARYANA, CHANDIGARH & DELHI SUBDIVISION, AREA SQ.KM 1.59 PER 12 STN Monthly, seasonal and Annual rainfall (in 10th of mm) ( based on 306 stations and based on IMD Subdivisional rainfall). Table 17: PUNJAB SUBDIVISION, AREA SQ.KM 1.75 PER, 10 STN Monthly, seasonal and Annual rainfall (in 10th of mm) ( based on 306 stations and based on IMD Subdivisional rainfall) Table 18: WEST RAJASTHAN SUBDIVISION, AREA SQ.KM 6.77 PER, 9 STN Monthly, seasonal and Annual rainfall (in 10th of mm) ( based on 306 stations and based on IMD Subdivisional rainfall) Table 19: EAST RAJASTHAN SUBDIVISION, AREA SQ.KM 5.11 PER, 17 STN Monthly, seasonal and Annual rainfall (in 10th of mm) ( based on 306 stations and based on IMD Subdivisional rainfall) Table 20: WEST MADHYA PRADESH SUBDIVISION, AREA SQ.KM 6.09 PER, 22 STN Monthly and seasonal and Annual rainfall (in 10th of mm) ( based on 306 stations and based on IMD Subdivisional rainfall) Table 21: EAST MADHYA PRADESH SUBDIVISION, AREA SQ.KM 4.69 PER, 15 STN Monthly, seasonal and Annual rainfall (in 10th of mm) ( based on 306 stations and based on IMD Subdivisional rainfall) Table 22: GUJARAT SUBDIVISION, AREA SQ.KM 2.99 PER, 11 STN Monthly, seasonal and Annual rainfall (in 10th of mm) ( based on 306 stations and based on IMD Subdivisional rainfall) Table 23: SAURASHTRA, KUTCH & DIU SUBDIVISION, AREA SQ.KM 3.82 PER, 7 STN Monthly, seasonal and Annual rainfall (in 10th of mm) ( based on 306 stations and based on IMD Subdivisional rainfall Table 24: KONKAN AND GOA SUBDIVISION, AREA SQ.KM 1.18 PER, 5 STN Monthly, seasonal and Annual rainfall (in 10th of mm) ( based on 306 stations and based on IMD Subdivisional rainfall) Table 25: MADHYA MAHARASHTRA SUBDIVISION, AREA SQ.KM 4.00 PER, 9 STN 14
20 Monthly, seasonal and Annual rainfall (in 10th of mm) ( based on 306 stations and based on IMD Subdivisional rainfall) Table 26: MARATHWADA SUBDIVISION, AREA SQ.KM 2.24 PER, 5 STN Monthly, seasonal and Annual rainfall (in 10th of mm) ( based on 306 stations and based on IMD Subdivisional rainfall). Table 27: VIDARBHA SUBDIVISION, AREA SQ.KM 3.39 PER, 8 STN Monthly, seasonal and Annual rainfall (in 10th of mm) ( based on 306 stations and based on IMD Subdivisional rainfall). Table 28: CHATTISGARH SUBDIVISION, AREA SQ.KM 5.07 PER, 6 STN Monthly and seasonal and Annual rainfall (in 10th of mm) ( based on 306 stations and based on IMD Subdivisional rainfall). Table 29: COASTAL ANDHR SUBDIVISION, AREA SQ.KM 3.23 PER, 8 STN Monthly, seasonal and Annual rainfall (in 10th of mm) ( based on 306 stations and based on IMD Subdivisional rainfall). Table 30: TELANGANA SUBDIVISION, AREA SQ.KM 3.98 PER, 9 STN Monthly, seasonal and Annual rainfall (in 10th of mm) ( based on 306 stations and based on IMD Subdivisional rainfall). Table 31: RAYALASEEMA SUBDIVISION, AREA SQ.KM 2.40 PER, 4 STN Monthly, seasonal and Annual rainfall (in 10th of mm) ( based on 306 stations and based on IMD Subdivisional rainfall). Table 32: TAMIL NADU & PONDICHERRY SUBDIVISION, AREA SQ.KM 4.52 PER, 15 STN Monthly, seasonal and Annual rainfall (in 10th of mm) ( based on 306 stations and based on IMD Subdivisional rainfall). Table 33: COASTAL KARNATAKA SUBDIVISION, AREA SQ.KM 0.65 PER, 2 STN Monthly, seasonal and Annual rainfall (in 10th of mm) ( based on 306 stations and based on IMD Subdivisional rainfall). Table 34: N. INT. KARNATAKA SUBDIVISION, AREA SQ.KM 2.77 PER 6 STN Monthly, seasonal and Annual rainfall (in 10th of mm) ( based on 306 stations and based on IMD Subdivisional rainfall). Table 35: SOUTH. INT. KARNATAKA SUBDIVISION, AREA SQ.KM 3.23 PER, 11 STN Monthly, seasonal and Annual rainfall (in 10th of mm) ( based on 306 stations and based on IMD Subdivisional rainfall). Table 36: KERALA SUBDIVISION, AREA SQ.KM 1.35 PER 10 STN Monthly, seasonal and Annual rainfall (in 10th of mm) ( based on 306 stations and based on IMD Subdivisional rainfall Table 37: Trends (mm/year) in summer monsoon (JJAS) rainfall for the period and for all-india and 30 meteorological subdivisions. 15
21 16
22 17
23 18
24 19
25 20
26 21
27 22
28 23
29 24
30 25
31 26
32 27
33 28
34 29
35 30
36 31
37 32
38 33
39 34
40 35
41 36
42 37
43 38
44 39
45 40
46 41
47 42
48 43
49 44
50 45
51 46
52 47
53 48
54 49
55 50
56 51
57 52
58 53
59 54
60 55
61 Table 1: ALL-INDIA RAINFALL ( ) 30 SUBDIVISIONS, AREA SQ.KM. Monthly, Seasonal and Annual rainfall (in 10th of mm) ( based on 306 stations and based on IMD Subdivisional rainfall) year JAN FEB MAR APR MAY JUN JUL AUG SEP OCT NOV DEC JF MAM JJAS OND ANN
62
Employees' Provident Fund Organisation, India Ministry of Labour & Employment, Government of India
 Employees' Provident Fund Organisation, India Ministry of Labour & Employment, Government of India Date 20th December, 2018 NET PAYROLL DATA EPFO PROVISIONAL ESTIMATE OF NET PAYROLL IN AGE BUCKETS AS PER
04-Jun-08 FILE NAME : GSDPCRNS STATE SERIES
 04-Jun-08 FILE NAME : GSDPCRNS STATE SERIES STATEMENT : GROSS STATE DOMESTIC PRODUCT AT CURRENT PRICES (1980-81 TO 1993-94) As on 26.11.1999 (Crore Rupees) Sl. State/U.T. 1980-81 1981-82 1982-83 1983-84
Chapter 1 POPULATION
 Chapter 1 POPULATION Women & Men In India- 2016 1 2 Population related Statistics Population and related Statistics This chapter presents the important statistics on population characteristics from a gender
POPULATION. Chapter 1
 Chapter 1 POPULATION Coverage Rural urban Distribution of Sex Ratio and Population Growth Rate in Post-Independence India State-wise percent share of Female population in Total Population Year-wise State-wise
¼ããÀ ¹ã㪠ã Ôãâ ãìêã ã ãäà¹ããñ Ã
 Central Electricity Authority LGBR: 211-12 ¼ããÀ ¹ã㪠ã Ôãâ ãìêã ã ãäà¹ããñ à Load Generation Balance Report 211-12 ¼ããÀ ã ÔãÀ ãšãà Government of India ãäìã²ãì ã ½ãâ ããêã¾ã Ministry of Power ãñš ³ãè¾ã ãäìã²ãì
Title of the Presentation
 Trends in Emissions from Energy Sector Title of the Presentation Date: September 28, 2017 Venue: New Delhi Date Venue Sectoral Break-up & Approach Fuel Combustion National GHG Inventory Fugitive Emissions
RPO-REC Framework: Emerging Challenges and way forward. Background Presentation
 RPO-REC Framework: Emerging Challenges and way forward Background Presentation Ashwin Gambhir, Vishal Toro, Vijaypal Singh Prayas (Energy Group), Pune 10 th June, 2013, IHC, New Delhi Prayas Energy Group,
Chapter 2 HEALTH. Women & Men In India
 Chapter 2 HEALTH Women & Men In India 2016 19 20 Health related statistics Health A healthy population being the basic necessity for development, it is essential to assess the variability in terms of gender
GOVERNMENT OF INDIA MINISTRY OF HOME AFFAIRS LOK SABHA UNSTARRED QUESTION NO. 2009
 GOVERNMENT OF INDIA MINISTRY OF HOME AFFAIRS LOK SABHA UNSTARRED QUESTION NO. 2009 TO BE ANSWERED ON THE 14 TH MARCH, 2017/ PHALGUNA 23, 1938 (SAKA) DOMESTIC VIOLENCE 2009. SHRI NIHAL CHAND: SHRI R. DHRUVA
¼ããÀ ¹ã㪠ã Ôãâ ãìêã ã ãäà¹ããñ Ã
 ¼ããÀ ¹ã㪠ã Ôãâ ãìêã ã ãäà¹ããñ à Load Generation Balance Report 212-13 ¼ããÀ ã ÔãÀ ãšãà Government of India ãäìã²ãì ã ½ãâ ããêã¾ã Ministry of Power ãñš ³ãè¾ã ãäìã²ãì ã ¹ãÆããä ã ãšà ã Central Electricity
northeast group, llc India Smart Grid: Market Forecast ( ) January group.com
 January group.com") northeast group, llc India Smart Grid: Market Forecast (2015 2025) January 2015 www.northeast- group.com India Smart Grid: Market Forecast (2015 2025) In many ways, India represents the best smart grid
northeast group, llc India Smart Grid: Market Forecast (2015 2025) January 2015 www.northeast- group.com India Smart Grid: Market Forecast (2015 2025) In many ways, India represents the best smart grid
TRANSMISSION CAPACITY ADDITION PROGRAMME DURING No. 1 Introduction 1
 TRANSMISSION CAPACITY ADDITION PROGRAMME DURING 2006-07 Sl. No. Contents Page No. 1 Introduction 1 2 Chapter 1 Transmission Capacity Additions During 2005-06 of 10 th plan period 3 Chapter 2 Construction
Population and decadal change by residence -India: 2011 (Persons)
") Population and decadal change by residence -India: 2011 (Persons) State/ UT Code India/ Population 2011 State/Union Territory # Percentage decadal change 2001-2011 Total Rural Urban Total Rural Urban 1
Population and decadal change by residence -India: 2011 (Persons) State/ UT Code India/ Population 2011 State/Union Territory # Percentage decadal change 2001-2011 Total Rural Urban Total Rural Urban 1
INDIAN HORTICULTURE PRODUCTION - AT A GLANCE ( and to )
") 2 INDIAN HORTICULTURE PRODUCTION - AT A GLANCE (1991-92 and 2001-02 to 2012-13) Year Fruits Vegetables Flowers Nuts (Almond & Walnut) A P A P A P (Loose) A P 1991-92 2874 28632 5593 58532 NA NA NA NA 2001-02
2 INDIAN HORTICULTURE PRODUCTION - AT A GLANCE (1991-92 and 2001-02 to 2012-13) Year Fruits Vegetables Flowers Nuts (Almond & Walnut) A P A P A P (Loose) A P 1991-92 2874 28632 5593 58532 NA NA NA NA 2001-02
CONTENTS. Table Subject. I Area under Rubber and Average Yield per hectare
 CONTENTS Table Subject Page I Area under Rubber and Average Yield per hectare 1 Area Newplanted and Replanted with Rubber 5 2 State-wise Area under Rubber at the end of each year 6 3 District/State-wise
भ र त स र क र क न र य व द य त प ध क र ण C E N T R A L E L E C T R I C I T Y A U T H O R I T Y
 भ र त स र क र G O V E R N M E N T O F I N D I A व द य त म त ल य M I N I S T R Y O F P O W E R क न र य व द य त प ध क र ण C E N T R A L E L E C T R I C I T Y A U T H O R I T Y ( व द य त अ ध नन य म, 2 3 क
Description Rural Urban Combined. Weights June 18 Index (Final) July 18 Index (Prov.) (1) (2) (3) (4) (5) (6) (7) (8) (9) (10) (11) (12)
 July 18 Index (Prov.) (1) (2) (3) (4) (5) (6) (7) (8) (9) (10) (11) (12)") Annexure I All India Consumer Price Indices Group Subgroup Description Rural Urban Combined () () (3) (4) (5) (6) (7) (8) (9) (0) () () Cereals.35 37.6 38.4 6.59 35.3 35.6 9.67 36.9 37.5 Meat fish 4.38
Annexure I All India Consumer Price Indices Group Subgroup Description Rural Urban Combined () () (3) (4) (5) (6) (7) (8) (9) (0) () () Cereals.35 37.6 38.4 6.59 35.3 35.6 9.67 36.9 37.5 Meat fish 4.38
14.Storage Infrastructure
 Infrastructure 393 394 14. STORAGE 14.1 There is no specific data source for this item, which compiles data for all types of storages in one place. Data has been individually obtained from Central Warehousing
भ र उत प द स त लन रप टर LOAD GENERATION BALANCE REPORT
 भ र उत प द स त लन रप टर 214-15 LOAD GENERATION BALANCE REPORT 214-15 Distribu tion Transm ission Generation भ रत सरक र Government of India व त म लय Ministry of Power क न य व त धकरण Central Electrici Authori
Appendix E Hydrology, Erosion and Sediment Transport Studies
 Appendix E Hydrology, Erosion and Sediment Transport Studies Hatch 2012/10 Appendix E1 EA Hydrology Memorandum February 2011 (Hatch. 2011a) Hatch 2012/10 Project Memo February 23, 2011 TO: Larry King FROM:
Unnat Jyoti by Affordable LEDs for All Conserve Electricity, Conserve Energy
 Unnat Jyoti by Affordable LEDs for All (UJALA) Ministry of Power www.swaniti.in Unnat Jyoti by Affordable LEDs for All Conserve Electricity, Conserve Energy Key Features of UJALA Unnat Jyoti by Affordable
PRESENTATION ON STRATEGIC APPROACH TOWARDS WIND SOLAR HYBRID SYSTEMS (SWES) FOR REMOTE TELECOM SITES IN INDIA & CASE STUDY OF RAJASTHAN
 FOR REMOTE TELECOM SITES IN INDIA & CASE STUDY OF RAJASTHAN") PRESENTATION ON STRATEGIC APPROACH TOWARDS WIND SOLAR HYBRID SYSTEMS (SWES) FOR REMOTE TELECOM SITES IN INDIA & CASE STUDY OF RAJASTHAN WORKSHOP ON SMALL WIND ENERGY AND HYBRID SYSTEMS & ITS RELEVANCE
PRESENTATION ON STRATEGIC APPROACH TOWARDS WIND SOLAR HYBRID SYSTEMS (SWES) FOR REMOTE TELECOM SITES IN INDIA & CASE STUDY OF RAJASTHAN WORKSHOP ON SMALL WIND ENERGY AND HYBRID SYSTEMS & ITS RELEVANCE
ECONOMIC SURVEY STATISTICAL APPENDIX
 ECONOMIC SURVEY 2011-12 STATISTICAL APPENDIX STATISTICAL APPENDIX : ECONOMIC SURVEY 2011-2012 PAGE 0.1 Select Indicators: 1950-51 to 2010-11... A1-A2 1. National Income and Production 1.1 Gross National
CLIMATOLOGICAL SUMMARY
 DEPARTMENT OF REGISTRATION AND EDUCATION CTATP OF ILLINOIS ILLINOIS STATE WATER SURVEY DIVISION URBANA, ILLINOIS ISWS MP-19 Archive ISWS Illinois State Water Survey )CAL CLIMATOLOGICAL DATA MP-19 LOCAL
Climatography of the United States No
 Climate Division: CA 5 NWS Call Sign: Month (1) Min (2) Month(1) Extremes Lowest (2) Temperature ( F) Lowest Month(1) Degree s (1) Base Temp 65 Heating Cooling 100 Number of s (3) Jan 45.9 26.0 36.0 67
2017 Meteorological Summary for the Galeta Marine Island Laboratory. Prepared by: Steven Paton
 0 2017 Meteorological Summary for the Galeta Marine Island Laboratory Prepared by: Steven Paton 1 Introduction This is the 5 th in a series of yearly reports summarising the past year s Smithsonian Tropical
ANNUAL REPORT
 lr;eso t;rs CONSUMER PRICE INDEX NUMBERS (for AL/RL) on base 1986-87 = 100 ANNUAL REPORT 2008-2009 GOVERNMENT OF INDIA MINISTRY OF LABOUR & EMPLOYMENT LABOUR BUREAU SHIMLA/CHANDIGARH PREFACE Consumer Price
ELECTRICITY GENERATION AND DISTRIBUTION. Electricity Generation & Distribution Q2,
 Contact Statistician: Otsile Chelenyane Industry Statistics Unit Email: ochelenyane@statsbots.org.bw Tel: (+267) 367 1300; Ext. 333 ELECTRICITY GENERATION AND DISTRIBUTION Stats Brief, Quarter 2, 2018
Climatography of the United States No
 Climate Division: WY 9 NWS Call Sign: LND Temperature ( F) Month (1) Min (2) Month(1) Extremes Lowest (2) Lowest Month(1) Degree s (1) Base Temp 65 Heating Cooling 100 Number of s (3) Jan 31.9 8.7 20.3
2016 Meteorological Summary for the Galeta Marine Island Laboratory. Prepared by: Steven Paton
 0 2016 Meteorological Summary for the Galeta Marine Island Laboratory Prepared by: Steven Paton 1 Introduction This is the fourth in a series of yearly reports summarising the past year s Smithsonian Tropical
LOCAL CLIMATOLOGICAL DATA
 ILLINOIS STATE WATER SURVEY DIVISION URBANA, ILLINOIS ISWS MP-21 Archive SWS0964 Illinois State Water Survey LOCAL CLIMATOLOGICAL DATA FDR HILLSBORO, IL. 1901-1962 LOCAL CLIMATOLOGICAL DATA 1901-1962 HILLSBORO
Different Techniques of Loss Minimization in Distribution System
 Different Techniques of Loss Minimization in Distribution System Gurpreet kour 1, R. K. Sharma 2 1 M. Tech Scholar, Electrical Engineering, Lovely Professional University, Punjab, India 2 HOD, Electrical
Climatography of the United States No
 Climate Division: MA 3 NWS Call Sign: BOS Month (1) Min (2) Month(1) Extremes Lowest (2) Temperature ( F) Lowest Month(1) Degree s (1) Base Temp 65 Heating Cooling 100 Number of s (3) 36.5 22.1 29.3 72
Issue 12. micrometer. data as of 31 st December 2014
 Issue 12 micrometer data as of 31 st December 2014 All rights reserved. No part of this publication may be reproduced or transmitted in any form or by any means without written permission from MFIN. However,
2014 Meteorological and Oceanographic Summary for the Bocas del Toro Research Station. Prepared by: Steven Paton
 0 2014 Meteorological and Oceanographic Summary for the Bocas del Toro Research Station Prepared by: Steven Paton 1 Introduction This is the second of a series of yearly reports summarising the past year
Local Climatological (Data Summary Molim, Illinois
 SWS Miscellaneous Publication 98-13 STATE OF ILLINOIS DEPARTMENT OF ENERGY AND NATURAL RESOURCES Local Climatological (Data Summary Molim, Illinois 1872-1992 by Audrey A. Bryan and Wayne Wendland Climatological
2019 Western North Carolina Weather Calendar. Department of Atmospheric Sciences The University of North Carolina at Asheville
 209 Western North Carolina Weather Calendar Department of Atmospheric Sciences The University of North Carolina at Asheville www.atms.unca.edu 209 Western North Carolina Weather Calendar Climatological
2017 Meteorological and Oceanographic Summary for the Bocas del Toro Research Station. Prepared by: Steven Paton
 0 2017 Meteorological and Oceanographic Summary for the Bocas del Toro Research Station Prepared by: Steven Paton 1 Introduction This is the 5 th of a series of yearly reports summarising the past year
Status Review Report on Implementation of Batteries (Management and Handling) Rules, 2001 (as amended thereof)
 Rules, 2001 (as amended thereof)") Status Review Report on Implementation of Batteries (Management and Handling) Rules, 2001 (as amended thereof) 2016 CENTRAL POLLUTION CONTROL BOARD Ministry of Environment, Forest and Climate Change, Govt.
Status Review Report on Implementation of Batteries (Management and Handling) Rules, 2001 (as amended thereof) 2016 CENTRAL POLLUTION CONTROL BOARD Ministry of Environment, Forest and Climate Change, Govt.
2016 Meteorological and Oceanographic Summary for the Bocas del Toro Research Station. Prepared by: Steven Paton
 0 2016 Meteorological and Oceanographic Summary for the Bocas del Toro Research Station Prepared by: Steven Paton 1 Introduction This is the forth of a series of yearly reports summarising the past year
THIS REPORT CONTAINS ASSESSMENTS OF COMMODITY AND TRADE ISSUES MADE BY USDA STAFF AND NOT NECESSARILY STATEMENTS OF OFFICIAL U.S.
 THIS REPORT CONTAINS ASSESSMENTS OF COMMODITY AND TRADE ISSUES MADE BY USDA STAFF AND NOT NECESSARILY STATEMENTS OF OFFICIAL U.S. GOVERNMENT POLICY Required Report - public distribution Oilseeds and Products
Meter Insights for Downtown Store
 Meter Insights for Downtown Store Commodity: Analysis Period: Prepared for: Report Date: Electricity 1 December 2013-31 December 2014 Arlington Mills 12 February 2015 Electricity use over the analysis
Local Climatological Data Summary Aurora, Illinois
 SWS Miscellaneous Publication 98-15 STATE OF ILLINOIS DEPARTMENT OF NATURAL RESOURCES Local Climatological Data Summary Aurora, Illinois 1901-1996 Herbert Hoffman 1, Audrey A. Bryan 2 and Wayne Wendland
University of Michigan Eco-Driving Index (EDI) Latest data: October 2017
 Latest data: October 2017") University of Michigan Eco-Driving Index () http://www.ecodrivingindex.org Latest data: October 2017 Developed and issued monthly by Michael Sivak and Brandon Schoettle Sustainable Worldwide Transportation
University of Michigan Eco-Driving Index () http://www.ecodrivingindex.org Latest data: October 2017 Developed and issued monthly by Michael Sivak and Brandon Schoettle Sustainable Worldwide Transportation
Determination of Monthly Means of Daily Solar Radiation and its Variability: A Summary (continued)
") Introduction Section 5.3 MONTHLY MEANS OF DAILY SOLAR RADIATION AND ITS VARIABILITY R.E. Schulze, M. Maharaj and R.D. Chapman The maps and statistics of solar radiation in this Section supersede the ones
Introduction Section 5.3 MONTHLY MEANS OF DAILY SOLAR RADIATION AND ITS VARIABILITY R.E. Schulze, M. Maharaj and R.D. Chapman The maps and statistics of solar radiation in this Section supersede the ones
Commercial-in-Confidence Ashton Old Baths Financial Model - Detailed Cashflow
 Year 0 1 2 3 4 5 6 7 8 9 10 11 12 13 Oct-16 Nov-16 Dec-16 Jan-17 Feb-17 Mar-17 Apr-17 May-17 Jun-17 Jul-17 Aug-17 Sep-17 Oct-17 2,038 2,922 4,089 4,349 6,256 7,124 8,885 8,885 8,885 8,885 8,885 8,885 9,107
WIM #37 was operational for the entire month of September Volume was computed using all monthly data.
 SEPTEMBER 2016 WIM Site Location WIM #37 is located on I-94 near Otsego in Wright county. The WIM is located only on the westbound (WB) side of I-94, meaning that all data mentioned in this report pertains
Gujarat Power Sector A Statistical Profile
 Power Sector A Statistical Profile 6th Floor, GIFT ONE, Road 5C, Zone 5, GIFT CITY, Gandhinagar, 8 55. Ph.: +91796 Fax : +91796 5/55 Email : gerc@gercin.org Website : www.gercin.org 6th Floor, GIFT ONE,
Industry Performance Review Report of PPAC: May18
 1 P a g e This report analyses the trend of consumption of petroleum products in the country during the month of May, 2018. Data on product-wise monthly consumption of petroleum products for May, 2018
CCoWS. Central Coast Watershed Studies. Summary of Precipitation and Streamflow for Potrero and San Clemente Creeks in Water-Year 2007
 Central Coast Watershed Studies CCoWS Summary of Precipitation and Streamflow for Potrero and San Clemente Creeks in Water-Year 2007 Santa Lucia Preserve Monterey County, California Publication No. WI-2008-01
Design Criteria Data
 PIERRE SD Latitude = 44.38 N WMO No. 726686 Longitude =1.2 W Elevation = 1742 feet Period of Record = 1973 to 1996 Average Pressure = 28.1 inches Hg Design Criteria Data Mean Coincident (Average) Values
Design Criteria Data
 RAPID CITY SD Latitude = 44.5 N WMO No. 72662 Longitude =3. W Elevation = 3169 feet Period of Record = 1973 to 1996 Average Pressure = 26.67 inches Hg Design Criteria Data Mean Coincident (Average) Values
COMPARISON OF FIXED & VARIABLE RATES (25 YEARS) CHARTERED BANK ADMINISTERED INTEREST RATES - PRIME BUSINESS*
 CHARTERED BANK ADMINISTERED INTEREST RATES - PRIME BUSINESS*") COMPARISON OF FIXED & VARIABLE RATES (25 YEARS) 2 Fixed Rates Variable Rates For Internal Use Only. FIXED RATES OF THE PAST 25 YEARS AVERAGE RESIDENTIAL MORTGAGE LENDING RATE - 5 YEAR* (Per cent) Year
COMPARISON OF FIXED & VARIABLE RATES (25 YEARS) 2 Fixed Rates Variable Rates For Internal Use Only. FIXED RATES OF THE PAST 25 YEARS AVERAGE RESIDENTIAL MORTGAGE LENDING RATE - 5 YEAR* (Per cent) Year
COMPARISON OF FIXED & VARIABLE RATES (25 YEARS) CHARTERED BANK ADMINISTERED INTEREST RATES - PRIME BUSINESS*
 CHARTERED BANK ADMINISTERED INTEREST RATES - PRIME BUSINESS*") COMPARISON OF FIXED & VARIABLE RATES (25 YEARS) 2 Fixed Rates Variable Rates FIXED RATES OF THE PAST 25 YEARS AVERAGE RESIDENTIAL MORTGAGE LENDING RATE - 5 YEAR* (Per cent) Year Jan Feb Mar Apr May Jun
COMPARISON OF FIXED & VARIABLE RATES (25 YEARS) 2 Fixed Rates Variable Rates FIXED RATES OF THE PAST 25 YEARS AVERAGE RESIDENTIAL MORTGAGE LENDING RATE - 5 YEAR* (Per cent) Year Jan Feb Mar Apr May Jun
August ATR Monthly Report
 August ATR Monthly Report Minnesota Department of Transportation Office of Transportation Data and Analysis August 2011 Introduction The purpose of this report is to examine monthly traffic trends on
Frequently Asked Questions for Grid Connected Solar Rooftop Systems
 Frequently Asked Questions for Grid Connected Solar Rooftop Systems 1. What is a Solar Rooftop System? In a solar rooftop system, the solar panels are installed in the roof of any residential, commercial,
Power Distribution Tariffs in India 2016 Discom Wise & Consumer Wise Comprehensive Track
 Power Distribution Tariffs in India 2016 Discom Wise & Consumer Wise Comprehensive Track E-REP Fact Factor Series March 2016 INR/Month INR/Month Power Distribution Tariffs in India 2016 2 CERC Final tariff
Design Criteria Data
 BIRMINGHAM AL Latitude = 33.57 N WMO No. 72228 Longitude = 86.75 W Elevation = 63 feet Period of Record = 1973 to 1996 Average Pressure = 29.36 inches Hg Design Criteria Data Mean Coincident (Average)
SOLAR PLANT PERFORMANCE IN INDIA
 Now Available SOLAR PLANT PERFORMANCE IN INDIA 2017-18 Report (PDF) Data-set (Excel) India Infrastructure Research SOLAR PLANT PERFORMANCE IN INDIA 2017-18 Table of Contents 1. Solar Power Sector Overview
3. Atmospheric Supply of Nitrogen to the Baltic Sea in 2009
 3. Atmospheric Supply of Nitrogen to the Baltic Sea in 2009 Nitrogen emission data, as well as the model results presented here have been approved by the 35 th Session of the Steering Body of EMEP in Geneva
May ATR Monthly Report
 May ATR Monthly Report Minnesota Department of Transportation Office of Transportation Data and Analysis May 2011 Introduction The purpose of this report is to examine monthly traffic trends on Minnesota
Kelly Redmond Regional Climatologist, Western Regional Climate Center Atmospheric Sciences Division
 Kelly Redmond Regional Climatologist, Western Regional Climate Center Atmospheric Sciences Division Climate and the Colorado and Columbia River Basins Presented at The Aspen Global Change Institute June
September 2016 Water Production & Consumption Data
 September 2016 Water Production & Consumption Data September 2016 monthly water production (288.48 AF) was lowest in at least 17 years. Monthly water production has increased slightly each month since
Castor Seed &Oil Monthly Research Report
 Castor Seed &Oil Monthly Research Report Contents Outlook and Review Recommendations Seed Supply & Demand Oil Supply & Demand Domestic Market Fundamentals Technical Analysis (Futures Market) Castor Seed
Design Criteria Data
 BURLINGTON VT Latitude = 44.47 N WMO No. 72617 Longitude = 73.15 W Elevation = 341 feet Period of Record = 1973 to 1996 Average Pressure = 29.61 inches Hg Design Criteria Data Mean Coincident (Average)
Design Criteria Data
 HONOLULU/OAHU HI Latitude = 21.35 N WMO No. 91182 Longitude =157.9 W Elevation = 16 feet Period of Record = 1967 to 1996 Average Pressure = 29.96 inches Hg Design Criteria Data Mean Coincident (Average)
Design Criteria Data
 MACON/LEWIS WILSON GA Latitude = 32.7 N WMO No. 72217 Longitude = 83.65 W Elevation = 361 feet Period of Record = 1973 to 1996 Average Pressure = 29.66 inches Hg Design Criteria Data Mean Coincident (Average)
TRANSPACIFIC CUSTOMER ADVISORY Implementation of New BAF Formula Effective January 01, 2019
 December 7, 2018 TRANSPACIFIC CUSTOMER ADVISORY Implementation of New BAF Formula Effective January 01, 2019 Dear Valued Customer, Bunker is one of the important cost components for a container shipping
Design Criteria Data
 COLUMBIA SC Latitude = 33.95 N WMO No. 7231 Longitude = 81.12 W Elevation = 226 feet Period of Record = 1973 to 1996 Average Pressure = 29.8 inches Hg Design Criteria Data Mean Coincident (Average) Values
Design Criteria Data
 PHILADELPHIA PA Latitude = 39.88 N WMO No. 7248 Longitude = 75.25 W Elevation = 3 feet Period of Record = 1973 to 1996 Average Pressure = 29.98 inches Hg Design Criteria Data Mean Coincident (Average)
Design Criteria Data
 INDIANAPOLIS IN Latitude = 39.73 N WMO No. 72438 Longitude = 86.27 W Elevation = 87 feet Period of Record = 1973 to 1996 Average Pressure = 29.15 inches Hg Design Criteria Data Mean Coincident (Average)
STATISTICS BOTSWANA ELECTRICITY GENERATION & DISTRIBUTION 2016/2 STATS BRIEF, FIRST QUARTER Copyrights Statistics Botswana 2016
 2016/2 ELECTRICITY GENERATION & DISTRIBUTION STATS BRIEF, FIRST QUARTER 2016 Copyrights Statistics Botswana 2016 Statistics Botswana. Private Bag 0024 Botswana Tel: (267) 367 1300. Fax: (267) 395 2201.
Design Criteria Data
 ANCHORAGE AK Latitude = 61.17 N WMO No. 7273 Longitude =15. W Elevation = 131 feet Period of Record = 1973 to 1996 Average Pressure = 29.6 inches Hg Design Criteria Data Mean Coincident (Average) Values
Design Criteria Data
 DENVER/STAPLETON CO Latitude = 39.75 N WMO No. 72469 Longitude =14.8 W Elevation = 5332 feet Period of Record = 1973 to 1995 Average Pressure = 24.66 inches Hg Design Criteria Data Mean Coincident (Average)
INDUSTRY SALES REVIEW. October 2017
 INDUSTRY SALES REVIEW October 2017 1 P a g e This report analyses the trend of consumption of petroleum products in the country during the month of October, 2017. Data on product-wise monthly consumption
FOR IMMEDIATE RELEASE
 Article No. 7433 Available on www.roymorgan.com Roy Morgan Unemployment Profile Friday, 12 January 2018 2.6m Australians unemployed or under-employed in December The latest data for the Roy Morgan employment
Design Criteria Data
 JACKSONVILLE FL Latitude = 3.5 N WMO No. 7226 Longitude = 81.7 W Elevation = 3 feet Period of Record = 1973 to 1996 Average Pressure = 3.1 inches Hg Design Criteria Data Mean Coincident (Average) Values
Total Production by Month (Acre Feet)
") Production by Month (acre-feet) 2008 2009 2010 2011 2012 2013 2014 2015 2016 January 25 339.10 228.90 249.50 297.99 243.06 327.14 247.66 212.37 February 234.00 218.80 212.10 241.52 245.82 279.08 234.16
Production by Month (acre-feet) 2008 2009 2010 2011 2012 2013 2014 2015 2016 January 25 339.10 228.90 249.50 297.99 243.06 327.14 247.66 212.37 February 234.00 218.80 212.10 241.52 245.82 279.08 234.16
Sensitivity and stability of super-efficiency in data envelopment analysis models
 Sensitivity and stability of super-efficiency in data envelopment analysis models M.Thilagam 1, V.Prakash 2 1 Assistant Professor, Department of Statistics, Presidency College, Chennai, India 2 Associate
Design Criteria Data
 SPOKANE WA Latitude = 47.63 N WMO No. 72785 Longitude =117.5 W Elevation = 2366 feet Period of Record = 1973 to 1996 Average Pressure = 27.5 inches Hg Design Criteria Data Mean Coincident (Average) Values
Design Criteria Data
 LOUISVILLE/STANDIFORD KY Latitude = 38.18 N WMO No. 72423 Longitude = 85.73 W Elevation = 489 feet Period of Record = 1973 to 1996 Average Pressure = 29.49 inches Hg Design Criteria Data Mean Coincident
FOR IMMEDIATE RELEASE
 Article No. 7845 Available on www.roymorgan.com Roy Morgan Unemployment Profile Friday, 18 January 2019 Unemployment in December is 9.7% and under-employment is 8.8% FOR IMMEDIATE RELEASE Australian unemployment
Design Criteria Data
 DAYTON/JAMES M COX OH Latitude = 39.9 N WMO No. 72429 Longitude = 84.2 W Elevation = 14 feet Period of Record = 1973 to 1996 Average Pressure = 28.95 inches Hg Design Criteria Data Mean Coincident (Average)
Design Criteria Data
 SPRINGFLD MO Latitude = 37.23 N WMO No. 7244 Longitude = 93.38 W Elevation = 127 feet Period of Record = 1973 to 1996 Average Pressure = 28.66 inches Hg Design Criteria Data Mean Coincident (Average) Values
Design Criteria Data
 BOSTON/LOGAN MA Latitude = 42.37 N WMO No. 7259 Longitude = 71.3 W Elevation = 3 feet Period of Record = 1967 to 1996 Average Pressure = 29.95 inches Hg Design Criteria Data Mean Coincident (Average) Values
FOR IMMEDIATE RELEASE
 Article No. 7353 Available on www.roymorgan.com Roy Morgan Unemployment Profile Wednesday, 11 October 2017 2.498 million Australians (18.9%) now unemployed or under-employed In September 1.202 million
Design Criteria Data
 MINNEAPOLIS-ST PAUL MN Latitude = 44.88 N WMO No. 72658 Longitude = 93.22 W Elevation = 837 feet Period of Record = 1973 to 1996 Average Pressure = 29.7 inches Hg Design Criteria Data Mean Coincident (Average)
Design Criteria Data
 MIDLAND TX Latitude = 31.95 N WMO No. 72265 Longitude =2. W Elevation = 2861 feet Period of Record = 1973 to 1996 Average Pressure = 27.3 inches Hg Design Criteria Data Mean Coincident (Average) Values
Design Criteria Data
 NEW YORK/JOHN F KENNEDY NY Latitude = 4.65 N WMO No. 74486 Longitude = 73.78 W Elevation = 23 feet Period of Record = 1973 to 1996 Average Pressure = 29.98 inches Hg Design Criteria Data Mean Coincident
Missouri River Mainstem Reservoirs Runoff Volumes for Annual Operating Plan Studies RCC Technical Report Jy-08
 Missouri River Region Since 1953 US Army Corps of Engineers Reservoir Control Center Missouri River Region Northwestern Division Reservoir Control Center July 2008 Missouri River Basin Fort Peck Montana
Design Criteria Data
 WASHINGTON/DULLES VA Latitude = 38.95 N WMO No. 7243 Longitude = 77.45 W Elevation = 322 feet Period of Record = 1973 to 1996 Average Pressure = 29.68 inches Hg Design Criteria Data Mean Coincident (Average)
Design Criteria Data
 LANDER/HUNT WY Latitude = 42.82 N WMO No. 72576 Longitude =18.7 W Elevation = 5558 feet Period of Record = 1973 to 1996 Average Pressure = 24.44 inches Hg Design Criteria Data Mean Coincident (Average)
FOR IMMEDIATE RELEASE
 Article No. 5842 Available on www.roymorgan.com Roy Morgan Unemployment Profile Thursday, 2 October 2014 Unemployment climbs to 9.9% in September as full-time work lowest since October 2011; 2.2 million
Design Criteria Data
 ALBUQUERQUE NM Latitude = 35.5 N WMO No. 72365 Longitude =16.6 W Elevation = 5315 feet Period of Record = 1967 to 1996 Average Pressure = 24.72 inches Hg Design Criteria Data Mean Coincident (Average)
Design Criteria Data
 DULUTH MN Latitude = 46.83 N WMO No. 72745 Longitude = 92.18 W Elevation = 1417 feet Period of Record = 1973 to 1996 Average Pressure = 28.43 inches Hg Design Criteria Data Mean Coincident (Average) Values
FOR IMMEDIATE RELEASE
 Article No. 7761 Available on www.roymorgan.com Roy Morgan Unemployment Profile Monday, 8 October 2018 Unemployment down to 9.4% in September off two-year high Australian employment has grown solidly over
Design Criteria Data
 MINOT AFB ND Latitude = 48.42 N WMO No. 727675 Longitude =11.3 W Elevation = 1667 feet Period of Record = 1967 to 1996 Average Pressure = 28.16 inches Hg Design Criteria Data Mean Coincident (Average)
Arctic Freshwater Flux and Change
 Arctic Freshwater Flux and Change Daqing Yang, Doug Kane, Sveta Berezovskaya Water and Environment Research Center, Univ. of Alaska Fairbanks Main Topics Large Arctic River Streamflow Regime and Change
Design Criteria Data
 CHARLESTON/KANAWHA WV Latitude = 38.37 N WMO No. 72414 Longitude = 81.6 W Elevation = 981 feet Period of Record = 1973 to 1996 Average Pressure = 29. inches Hg Design Criteria Data Mean Coincident (Average)
Chapter 4 Geo-Economic Features of the Growth Corridor
 Chapter 4 Geo-Economic Features of the Growth Corridor CHAPTER 4 GEO-ECONOMIC FEATURES OF THE GROWTH CORRIDOR This Study focuses on the Growth Corridor Area, which encompasses the municipalities of Phnom