Preface. This publication is divided into the following categories: inflation rate;
|
|
|
- Dustin Miles
- 5 years ago
- Views:
Transcription
1
2 Preface Penang Statistics is published once every three months Initiated in 1999, this series collates data provided by government departments and private organisations at state and national level, for the use of policymakers, researchers, academics and investors. The statistics found herein are Penang-relevant, but key national economic statistics are also included, covering the areas of agriculture, fisheries, livestock, manufacturing, water, electricity, telecommunications, property, tourism, logistics, health and education. This publication is divided into the following categories: 1. The demography of Penang by sex, ethnicity and distribution; 2. Key state economic indicators such as Gross Domestic Product (GDP) and inflation rate; 3. Economic activities, namely primary sector (agriculture, livestock and fisheries) secondary sector (manufacturing) and tertiary sector (utilities, transport, trade, logistics, tourism, property, education, health and education); and 4. Selected national statistics. Penang Institute would like to thank all state and federal government departments as well as private organisations for their continuous support and assistance in contributing to the success of Penang Statistics. It is also hoped that this publication can act as a baseline guide for primary research that will keep policymakers informed of the latest trends affecting Penang.
3 Table of Contents PHYSICAL ATTRIBUTES...3 DEMOGRAPHY...3 Penang: Estimated Population (in 000) and Distribution by Districts, Penang: Estimated Population by Sex (in 000), Penang: Estimated Population by Ethnic Group (in 000), ECONOMIC...5 Penang: Gross Domestic Product (In 2010 Constant Prices), Penang: Consumer Price Index (2010=100), Jan Mar PRIMARY SECTOR...6 AGRICULTURE... 6 Penang: Agriculture Land Use by Crops (hectares), LIVESTOCK... 6 Penang: Livestock Production, Penang: Production and Value of Livestock, 2016 & FISHERIES... 7 Penang: Landing Types, Jan Mar SECONDARY SECTOR...8 MANUFACTURING... 8 Penang: Approved Manufacturing Projects by Industry, Approved Manufacturing Projects by State, TERTIARY SECTOR...9 UTILITIES... 9 WATER... 9 Penang: Water Production and Consumption (Million Litres), Penang: Daily Water Supply and Consumption, 2016 and ELECTRICITY Penang: Power Demand & Supply, TELECOMMUNICATIONS Direct Exchange Line (DEL) Penetration Rate per 100 Household by State, Q Q Mobile Cellular Penetration Rate per 100 Inhabitants by State, Broadband Penetration Rate per 100 Households by State, Q Q TRANSPORT ROAD TRANSPORT New Motor Vehicle Registration, Jan - Dec TRADE TRADE BALANCE Export, Import and Balance of Trade, Oct 2017 Feb 2018 (RM million) LOGISTICS PENANG AIRPORT Passenger Movements (Domestic & International), Jan Mar Aircraft Movements (Arrival & Departure), Jan Mar Cargo Handled (Domestic & International), Jan Mar PENANG PORT Number of Ship Calls, Jan Mar Gross Registered Tonnage (Domestic & Foreign), Jan Mar Type of Cargo Handled, Jan Mar TOURISM Penang: Average Occupancy Rate, Jan Mar PROPERTY
4 Penang: House Price Index, Q Q Penang: Number of Transactions by Price Range for the Principal Property Sub-Sectors Penang: Value of Transactions (RM million) by Price Range for the Principal Property Sub- Sectors EDUCATION Penang: Number of Schools, Students & Teachers at the Pre-School Level, Penang: Number of Schools, Students & Teachers at the Primary Level, as of Jun Penang: Number of Schools, Students & Teachers at the Secondary Level, as of Jun Penang: Number of Students Taking Public Exams and Passing Rates, 2013 & HEALTH Penang: Life Expectancy at Birth, Penang: Health Manpower, Penang: Number of Beds, Bed Occupancy Rate (BOR) & Average Length of Stay (ALOS) for Government Hospitals, Penang: 10 Principal Causes of Deaths* in Government Hospitals, SELECTED NATIONAL STATISTICS...23 Malaysia: Gross Domestic Product by Sector, Q Q Malaysia: Currency Exchange Rates, Jan Mar Malaysia: National Indices and Employment Data, Q Malaysia: Federal Government Accounts, Malaysia: Producer Price Index (2010=100), Jan Mar Malaysia: Consumer Price Index (2010=100), Jan Mar Malaysia: Industrial Production Index (2015=100), Jan Mar
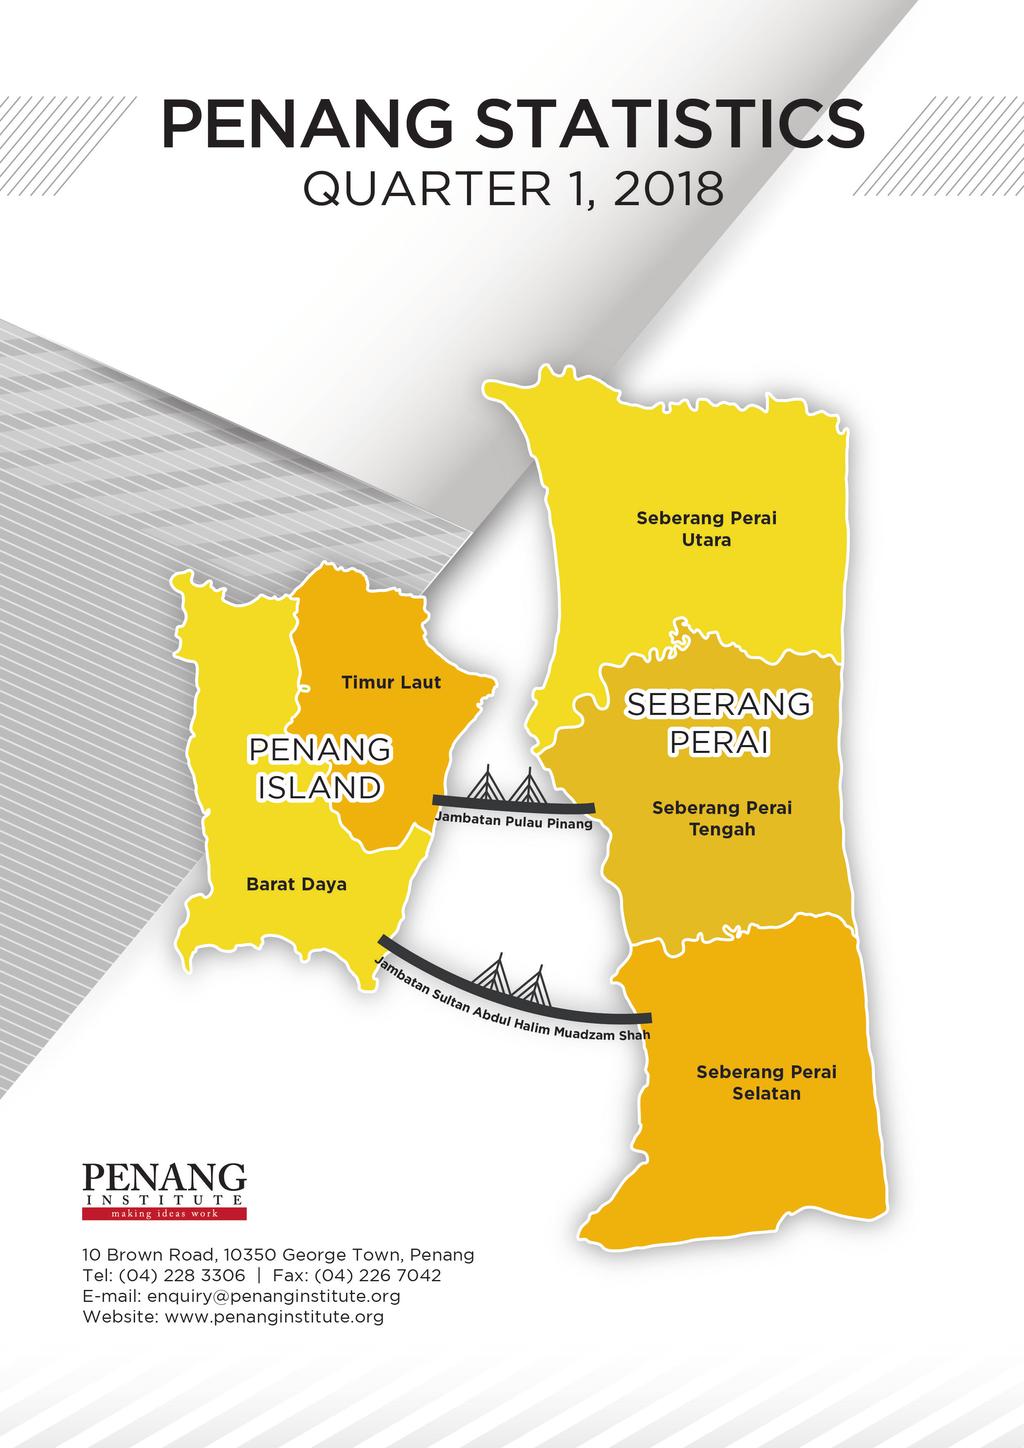
5 PHYSICAL ATTRIBUTES AREA State of Penang 1,032 sq. km Timur Laut 119 sq. km Barat Daya 173 sq. km Seberang Perai Utara (Butterworth) 263 sq. km Seberang Perai Tengah (B.Mertajam) 236 sq. km Seberang Perai Selatan (Nibong Tebal) 241 sq. km LOCATION Latitudes 5 19 Longitudes Note: The data is updated in 2017 Source: Department of Statistics, Malaysia DEMOGRAPHY Penang: Estimated Population (in 000) and Distribution by Districts, District Timur Laut Barat Daya Seberang Perai Utara Seberang Perai Tengah Seberang Perai Selatan Penang 1, , , , , Note: Mid-Year Population Estimates (from ) and Revised Population Projections (for 2016 and 2017) based on data sourced from the 2010 Population and Housing Census, Malaysia. Slight discrepancies may occur due to rounding. Source: Department of Statistics, Malaysia Penang: Estimated Population by Sex (in 000), Gender Male Female Total 1, , , , ,746.3 Note: Figures are based on the adjusted data from the 2010 Population and Housing Census, Malaysia. Slight discrepancies may occur due to rounding. Source: Population Quick Info, Department of Statistics, Malaysia 3
6 Penang: Estimated Population by Ethnic Group (in 000), Ethnic Group Malaysian Citizens 1, , , , ,594.1 Bumiputera Chinese Indian Others Non-Malaysian Citizens Total 1, , , , ,746.3 Note: The estimates are based on the adjusted data from the 2010 Population and Housing Census, Malaysia. Slight discrepancies may occur due to rounding. Source: Population Quick Info, Department of Statistics, Malaysia Penang: Percentage of Estimated Population by Ethnic Group, 2017 Total population: 1.75 million Others 0.3% Non-Malaysian Citizens 8.6% Indian 9.6% Bumiputera 42.0% Chinese 40.1% Source: Department of Statistics, Malaysia 4
7 ECONOMIC Penang: Gross Domestic Product (In 2010 Constant Prices), RM million % change Sector Agriculture 1,463 1,521 1,551 1, Mining & Quarrying Manufacturing 26,669 29,197 31,197 32, Construction 1,889 2,135 2,064 2, Services 30,779 32,787 34,313 36, GDP 61,324 66,203 69,825 73, Note: Slight discrepancies may occur due to rounding. Source: Department of Statistics, Malaysia Penang: Consumer Price Index (2010=100), Jan Mar 2018 Period 2017 All groups Food & non-alcoholic beverages Alcoholic beverages & tobacco Clothing & footwear Housing, water, electricity, gas & other fuels Furnishings, household equipment & routine Health Transport Communication Recreation services and culture Education Restaurant & hotels Miscellaneous goods and services Jan Feb Mar Jan Feb Mar % change (y-o-y) Jan Feb Mar Source: Department of Statistics, Malaysia 5
8 PRIMARY SECTOR AGRICULTURE Penang: Agriculture Land Use by Crops (hectares), Type Year Paddy 12, , , , , , , , ,782.0 Fruits 7, , , , , , , , ,660.2 Rubber 10, , , , ,837.6 NA NA NA NA Oil Palm 13, , , , , , , , ,563.0 Vegetables Coconut 1, , , , , Cocoa Cash Crops Spices Others Total 47, , , , , , , , ,356.6 Note: Slight discrepancies may occur due to rounding. NA: Not available Source: Derived from the data provided by Department of Agriculture, Penang; Penang in Numbers 2014/2015 & 2015/2016, Penang State Economic Planning Division (BPEN); Malaysian Palm Oil Berhad (MPOB); and Rubber Industry Smallholders Development Authority (RISDA) LIVESTOCK Penang: Livestock Production, Year Type Meat ( 000 Metric Tonnes) Cow & Buffalo Goat & Sheep Chicken & Duck Pig Total Source: Department of Veterinary Services, Penang 6
9 Penang: Production and Value of Livestock, 2016 & Production Value Distribution Production Value Distribution Commodity/Unit (Metric (RM (Metric (RM % Tonnes) million) Tonnes) million) % Cow, Buffalo 2, , Goat, Sheep Meat Pig 30, , Chicken, Duck 69, , Eggs Chicken, 309,705, ,635, Duck quantity quantity Fresh Milk 689, , litre litre Total Source: Department of Veterinary Services, Penang FISHERIES Penang: Landing Types, Jan Mar 2018 Metric Tonnes Fish RM (million) Metric Tonnes Prawns RM (million) Trash Fish (Ikan Baja) Metric Tonnes RM (million) Cockles (Natural) Metric Tonnes RM (million) Jan-Mar , , , Jan 1, , Feb 1, , Mar 1, , Jan-Mar , , , % change (y-o-y) Note: The % changes for cockles are not calculated because they are referred to cultured cockles for Jan-Mar Source: Department of Fisheries, Penang 7
10 SECONDARY SECTOR MANUFACTURING Penang: Approved Manufacturing Projects by Industry, Industry No. Employment Domestic Investment (RM million) Foreign Investment (RM million) Total Capital Investment (RM million) Electronics & Electrical Products 34 5, , , Scientific & Measuring Equipment 10 2, , , Chemical & Chemical Products Machinery & Equipment 23 1, Textiles & Textile Products 5 1, Fabricated Metal Products Transport Equipment Plastic Products Paper,Printing & Publishing Food Manufacturing Basic Metal Products Miscellaneous Furniture & Fixtures Wood & Wood Products Total ,553 2, , , Note: Slight discrepancies may occur due to rounding. Data is subject to adjustments and revisions by MIDA. Source: Malaysian Investment Development Authority (MIDA) 8
11 Approved Manufacturing Projects by State, 2017 State No. Domestic Investment (RM million) Foreign Investment (RM million) Total Capital Investment (RM million) Johor , , , Pulau Pinang 120 2, , , Sarawak 20 10, , Selangor 202 3, , , Melaka 37 2, , , Pahang 19 2, , Kedah 41 1, , , Perak 45 1, , Negeri Sembilan , Sabah Perlis Kuala Lumpur Terengganu Kelantan Labuan TOTAL , , , Note: Slight discrepancies may occur due to rounding. Data is subject to adjustments and revisions by MIDA. Source: Malaysian Investment Development Authority (MIDA) TERTIARY SECTOR UTILITIES WATER Penang: Water Production and Consumption (Million Litres), Year Production % Increase Consumption % Increase , % 285, % , % 283, % , % 290, % , % 295, % , % 296, % , % 296, % , % 302, % , % 301, % Source: Penang Water Supply Corporation (PBA) 9
12 Penang: Daily Water Supply and Consumption, 2016 and 2017 No. of Treatment Plants Max. Capacity of Treatment Plants (million litres/day) Average Daily Production (million litres/day) Average Daily Consumption (million litres/day) No. of Services (consumers) Daily Consumption ( 000 litre) Penang Island Seberang Perai Penang State Penang Island Seberang Perai Penang State , , , , , , , , , , , ,547 Per Consumer Per Industrial Consumer Per Domestic Consumer Source: Penang Water Supply Corporation (PBA) ELECTRICITY Penang: Power Demand & Supply, Year Maximum Installed Excess Demand (MW) Capacity (MW) Capacity % ,202 3, % ,284 3, % ,361 3, % ,074 3, % ,283 3, % ,230 3, % ,280 3, % ,360 3, % ,508 3, % ,524 3, % ,622 3, % ,718 4, % Note: Excluding demand of 132kV customers supplied via direct 132kV connection. Source: Tenaga Nasional Berhad, Penang 10
13 TELECOMMUNICATIONS Direct Exchange Line (DEL) Penetration Rate per 100 Household by State, Q Q State Q1 Q2 Q3 Q4 Q1 Q2 Q3 Q4 Johor Kedah & Perlis Kelantan Melaka Negeri Sembilan Pahang Perak Pulau Pinang Selangor Terengganu Sabah Sarawak W.P Kuala Lumpur W.P. Labuan Notes: Direct Exchange Line (DEL) connects a customer s equipment to the Public Switched Telephone Network (PSTN) and has a dedicated port on a telephone exchange. The penetration rate refers to the total DELs to residential as well business. Source: Malaysian Communications and Multimedia Commission (MCMC) Mobile Cellular Penetration Rate per 100 Inhabitants by State, State Johor Kedah Kelantan Melaka Negeri Sembilan Pahang Perak Perlis PULAU PINANG Sabah Sarawak Selangor Terengganu W.P. Kuala Lumpur W.P. Labuan W.P Putrajaya Note: Mobile-cellular penetration rate per 100 inhabitants are from the Hand Phone Users Survey conducted by the MCMC annually. Source: Malaysian Communications and Multimedia Commission (MCMC) 11
14 Broadband Penetration Rate per 100 Households by State, Q Q State Q1 Q2 Q3* Q4* Q1* Q2* Q3* Q4* Johor Kedah Kelantan Pulau Pinang Negeri Sembilan Pahang Melaka Perak Perlis Selangor Terengganu Sabah Sarawak W.P. Putrajaya W.P. Kuala Lumpur W.P. Labuan Note: * The data has been adjusted by MCMC from Broadband penetration rate per 100 households to Broadband penetration rate per 100 inhabitants to reflect international standard. Source: Malaysian Communications and Multimedia Commission (MCMC) 12
15 TRANSPORT ROAD TRANSPORT New Motor Vehicle Registration, Jan - Dec 2017 Month Region Motorcycle Private Car Bus Taxi Car Rental Goods Vehicle Others Total 2017 Jan Penang 2, ,937 Malaysia 45,483 45, ,380 1,206 95,363 Feb Penang 2, ,487 Malaysia 42,869 42, ,138 1,047 88,422 Mar Penang 3, ,101 Malaysia 48,676 54, ,971 1, ,129 Apr Penang 2, ,252 Malaysia 40,421 42, ,515 1,257 86,724 May Penang 2, ,606 Malaysia 42,925 50, ,892 1,413 98,479 Jun Penang 2, ,965 Malaysia 35,506 51, ,845 1,184 91,084 Jul Penang 2, ,789 Malaysia 38,719 47, ,964 1,520 91,246 Aug Penang 2, ,558 Malaysia 44,157 52, ,436 1, ,626 Sep Penang 2, ,819 Malaysia 38,100 39, ,657 1,144 82,128 Oct Penang 2, ,407 Malaysia 43,099 46, ,416 1,308 94,726 Nov Penang 2, ,830 Malaysia 39,474 48, ,865 1,297 93,726 Dec Penang 2, ,831 Malaysia 36,347 53, ,235 1,198 94,292 Source: Road Transport Department, Malaysia 13
16 RM million RM million TRADE TRADE BALANCE Export, Import and Balance of Trade, Oct 2017 Feb 2018 (RM million) 2017 MALAYSIA PENANG Export Import BOT Export Import BOT Oct 82,293 71,852 10,442 21,647 17,286 4,361 Nov 83,516 73,553 9,963 21,792 16,904 4,888 Dec 79,333 72,079 7,254 20,926 16,348 4, Jan 82,820 73,153 9,667 25,047 16,941 8,106 Feb 70,343 61,325 9,018 18,577 13,980 4,596 Jan-Feb , ,591 13,473 32,921 29,389 3,533 Jan-Feb , ,478 18,686 43,624 30,921 12,702 % change (y-o-y) Note: For Penang data, it is captured at the exit and entry points of Penang port and airport. Slight discrepancies may occur due to rounding. Source: Department of Statistics, Malaysia Penang: Export and Import, Jan-Feb 2017 vs. Jan-Feb ,000 45,000 40,000 35,000 30,000 25,000 20,000 15,000 10,000 5,000 0 Jan-Feb 2017 Jan-Feb 2018 Export Import BOT (RHS) 14,000 12,000 10,000 8,000 6,000 4,000 2,000 0 Source: Department of Statistics, Malaysia 14
17 LOGISTICS PENANG AIRPORT Passenger Movements (Domestic & International), Jan Mar 2018 Month No. of Passengers Domestic International Total Jan-Mar ,022, ,270 1,728,940 Jan 342, , ,512 Feb 323, , ,853 Mar 360, , ,616 Jan-Mar ,026, ,207 1,847,981 % change (y-o-y) Note: Passenger movements refer to both arrival and departure. Source: Malaysia Airports Holdings Berhad Aircraft Movements (Arrival & Departure), Jan Mar 2018 No. of Movement Month Arrival Departure Total Jan-Mar ,250 8,248 16,498 Jan 3,032 3,035 6,067 Feb 2,803 2,802 5,605 Mar 3,027 3,028 6,055 Jan-Mar ,862 8,865 17,727 % change (y-o-y) Note: Aircraft movements refer to both domestic and international. Source: Malaysia Airports Holdings Berhad Cargo Handled (Domestic & International), Jan Mar 2018 Month Cargo Handled (in kg) Domestic International Total Jan-Mar ,090,068 29,492,161 32,582,229 Jan 1,022,932 10,921,327 11,944,259 Feb 861,338 8,989,391 9,850,729 Mar 1,016,978 11,251,391 12,268,369 Jan-Mar ,901,248 31,162,109 34,063,357 % change (y-o-y) Note: Cargo handled refers to both arrival and departure. Source: Malaysia Airports Holdings Berhad 15
18 PENANG PORT Number of Ship Calls, Jan Mar 2018 Month Domestic Foreign Total Jan-Mar ,024 1,729 Jan Feb Mar Jan-Mar ,603 % change (y-o-y) Source: Penang Port Sdn Bhd Gross Registered Tonnage (Domestic & Foreign), Jan Mar 2018 Month Domestic Foreign Total Jan-Mar ,271,140 15,103,552 22,374,692 Jan 2,220,101 5,432,313 7,652,414 Feb 2,371,116 4,199,093 6,570,209 Mar 2,739,517 3,765,473 6,504,990 Jan-Mar ,330,734 13,396,879 20,727,613 % change (y-o-y) Source: Penang Port Sdn Bhd Type of Cargo Handled, Jan Mar 2018 Month General Cargo (freight weight tonnes) Container Dry Bulk Liquid Bulk Containerised (TEUs) Jan-Mar ,736 1,016,951 1,019,735 5,178, ,381 Jan 87, , ,746 1,949, ,766 Feb 166, , ,919 1,749, ,165 Mar 112, , ,878 2,040, ,339 Jan-Mar ,347 1,124,740 1,040,543 5,739, ,270 % change (y-o-y) Source: Penang Port Sdn Bhd 16
19 TOURISM Penang: Average Occupancy Rate, Jan Mar 2018 Average Occupancy Rate (%) Average Occupancy Rate for Beach Hotels (%) Average Occupancy for City Hotels (%) Jan Feb Mar Jan Feb Mar Source: Malaysian Association of Hotels (Penang Chapter) PROPERTY Penang: House Price Index, Q Q Year Indices Terraced High-Rise Detached Semi-Detached All Houses Weight (2010=100) Q Q Q Q Q Q Q Q Q Q Q Q Q Q Q Q Q Q Q Q4 p P: Preliminary Source: National Property Information Centre (NAPIC) 17
20 Penang: Number of Transactions by Price Range for the Principal Property Sub- Sectors Price Range (RM) 50,000 & below 50, , , , , , , , , , , , , , ,001 1,000,000 1,000,001 & Above Total Year Residential Commercial Industrial Agricultural Development Land Others Q Q Q Q Q Q Q Q Q Q Q Q Q Q Q Q Q Q Q Q Q Q Q Q Q Q Q Q Q Q Q , ,379 Q , ,881 Q , ,290 Source: National Property Information Centre (NAPIC) Total 18
21 Penang: Value of Transactions (RM million) by Price Range for the Principal Property Sub-Sectors Price Range (RM) 50,000 & below 50, , , , , , , , , , , , , , ,001 1,000,000 1,000,001 & Above Total Year Residential Commercial Industrial Agricultural Development Land Others Q Q Q Q Q Q Q Q Q Q Q Q Q Q Q Q Q Q Q Q Q Q Q Q Q Q Q Q , Q Q , , Q , , Q , , Q , , , Source: National Property Information Centre (NAPIC) Total 19
22 EDUCATION Penang: Number of Schools, Students & Teachers at the Pre-School Level, 2017 Type of School No. of Schools No. of Students No. of Teachers Public # 160* 7, Private ,989 2,281 Total ,604 2,605 # as of Jun 2017, * Pre-schools that are located in either primary or secondary schools. Source: Buku Perangkaan Pendidikan Malaysia, Ministry of Education, Malaysia Penang: Number of Schools, Students & Teachers at the Primary Level, as of Jun 2017 Type of School No. of Schools No. of Students No. of Teachers SK/SRK ,532* 6,824 SJK (C) 90 46,187 3,153 SJK (T) 28 5, SK (Khas) SR Agama Total ,455 10,604 * Includes Year 4-6 in Special Model Schools Source: Buku Perangkaan Pendidikan Malaysia, Ministry of Education, Malaysia Penang: Number of Schools, Students & Teachers at the Secondary Level, as of Jun 2017 Type of School No. of Schools No. of Students* No. of Teachers SM Berasrama Penuh 2 1, SM Khas SM Teknik & Kolej Vokasional 6 4,381 b 491 b SMK a ,440 8,248 SMK Agama 15 5, Total ,105 9,547 Note: * Refers to the total of secondary and post-secondary (Form 6), a Includes Special Model Schools, b Includes Form 6 College Source: Buku Perangkaan Pendidikan Malaysia, Ministry of Education, Malaysia Penang: Number of Students Taking Public Exams and Passing Rates, 2013 & 2014 No. of Students No. of Passes Passing Rate (%) UPSR 23,335 23,284 15,996 16, SPM 21,820 21,816 18,061 17, STPM 3,049 2,444 2,966 2, STAM 1, , Note: Permission to access updated data has been denied by Penang State Education Department Source: Penang State Education Department 20
23 HEALTH Penang: Life Expectancy at Birth, p 2017 e Male Female P Preliminary; e Estimate Source: Penang State Health Department (for data from 2009 to 2013); and Pulau a Glance, Department of Statistics, Malaysia (for data from 2014 onwards) Penang: Health Manpower, Post Total Number of State Health Department Manpower Professional No. of Post Post Post No. of Post Filled Filled 14,136 12,810 13,445 12,520 Medical Officer ,262 1,342 Dental Officer Pharmacist Paramedic Assistant Environmental Health Officer Nurse 3,762 3,387 3,605 3,489 Medical Laboratory Technologist Assistant Medical Officer Assistant Pharmacist Dental Nurse Dental Technologist Community Nurse 1,078 1,019 1,072 1,001 Assistant Nurse Source: Penang State Health Department Penang: Number of Beds, Bed Occupancy Rate (BOR) & Average Length of Stay (ALOS) for Government Hospitals, Hospital No. of Bed B.O.R (%) A.L.O.S (day) Hospital Pulau Pinang 1,121 1,136* Hospital Seberang Jaya Hospital Bukit Mertajam Hospital Kepala Batas Hospital Sungai Bakap Hospital Balik Pulau Total 1,969 2, B.O.R. Bed Occupancy Rate A.L.O.S. Average Length of Stay * Operation Bed Source: Penang State Health Department 21
24 Penang: 10 Principal Causes of Deaths* in Government Hospitals, 2016 No. Main Causes of Deaths 2016 No. of Deaths % 1 Diseases of the respiratory system Diseases of the circulatory system Certain infectious and parasitic diseases Neoplasms Diseases of the genitourinary system External causes of morbidity and mortality Diseases of the digestive system Symptoms, signs and abnormal clinical and laboratory findings, not elsewhere classified Diseases of the skin and subcutaneous tissue Certain conditions originating in the perinatal period Total Deaths (10 Main Causes) 4, Other causes Total Hospital Deaths 4, * Based on the underlying cause of death Source: Pangkalan Data Pesakit Dalam Hospital KKM, 2016 (updated in June 2017), Pusat Informatik Kesihatan, Bahagian Perancangan Kementerian Kesihatan Malaysia 22
25 SELECTED NATIONAL STATISTICS Malaysia: Gross Domestic Product by Sector, Q Q RM million Component 2017 (Q1) 2017 (Q2) 2017 (Q3) 2017 (Q4) 2018 (Q1) National Accounts (GDP) at current price 324, , , , ,151 Agriculture, Forestry and Fishing 28,359 28,078 32,013 30,404 26,877 Mining and Quarrying 32,559 30,023 28,472 31,962 34,657 Manufacturing 71,218 75,257 76,498 78,477 74,379 Electricity, Gas and Water 8,260 8,677 9,039 9,145 8,801 Construction 16,376 15,771 16,808 16,370 17,365 Wholesale and Retail Trade, Hotel and Restaurants 59,940 61,711 66,470 71,371 64,994 Transport, Storage and Communication 29,061 29,959 30,523 30,752 31,479 Finance, Insurance, real estate and business services 34,460 35,021 35,977 37,572 37,493 Other Services 13,868 14,241 14,542 14,543 14,839 Government Services 25,814 26,369 27,918 30,221 27,040 Less : Imputed bank service charges Plus : import duties 4,661 4,679 4,748 5,192 5,227 National Accounts (GDP) at 2010 price 280, , , , ,288 Agriculture, Forestry and Fishing 21,796 22,511 26,064 25,597 22,406 Mining and Quarrying 25,012 24,365 23,715 25,343 25,048 Manufacturing 63,922 67,505 68,146 70,230 67,342 Electricity, Gas and Water 7,139 7,350 7,483 7,464 7,445 Construction 13,431 12,917 13,872 13,352 14,093 Wholesale and Retail Trade, Hotel and Restaurants 49,110 50,925 54,223 57,000 52,511 Transport, storage and Communication 27,297 28,183 28,785 28,842 29,309 Finance, Insurance, real estate and business services 31,877 32,201 33,135 34,351 34,264 Other Services 12,566 12,763 13,073 13,176 13,232 Government Services 24,013 24,529 25,969 28,111 25,154 Less : Imputed bank service charges Plus : import duties 4,084 4,050 4,235 4,610 4,484 Note: Data is subject to adjustments with the revisions carried out by Bank Negara Malaysia. Source: Central Bank of Malaysia (BNM) 23
26 Malaysia: Currency Exchange Rates, Jan Mar 2018 Period (RM as at) USD GBP EUR JPY100 AUD SGD Jan Feb Mar Note: All exchange rates are the average of buying and selling interbank rates at noon. Source: Central Bank of Malaysia (BNM) Malaysia: National Indices and Employment Data, Q Unit Description Latest Period Latest Data Previous Period Industrial Production Index 2015=100 Mar Employment (million persons) % of labour force Q1/ Mar Q1/ Mar (million Q1/ Unemployment persons) Mar % of labour Q1/ force Mar Average salaries and wages per RM per employee in manufacturing sector month Mar-18 3, ,525.4 Consumer Price Index 2010=100 Mar Producer Price Index 2010=100 Mar Note: Slight discrepancies may occur due to rounding. Source: Central Bank of Malaysia (BNM) Malaysia: Federal Government Accounts, Component RM million p Public Sector Operations General Government Revenue 161, , , , , ,250 Operating Expenditure 197, , , , , ,763 Non-financial public enterprises Operating 106, , , ,954 77,392 81,636 Surplus Public Sector Current Account 71,088 91,315 92,808 82,685 48,305 68,124 Net Development Expenditure 101, , , , , ,122 Public Sector Overall Balance -30,666-47,053-46,584-81,798-90,292-89,998 Domestic Financing 59,153 70,475 57,136 52,439 61,658 47,645 Bank 3,650 2,958 34,835 59,053 16,152 34,798 Non-Bank 55,503 67,517 22,301-6,614 45,506 12,847 Foreign Borrowing 6,165-9, ,133 15,731 11,065 P Preliminary Source: Central Bank of Malaysia (BNM) 24
27 Section Malaysia: Producer Price Index (2010=100), Jan Mar % change (y-o-y) Jan Feb Mar Jan Feb Mar Jan Feb Mar Local Production Food Beverages and tobacco Crude materials, inedible Mineral fuels, lubricants, etc Animal and vegetable oils and fats Chemicals Manufactured goods Machinery and transport equipment Miscellaneous manufactured articles Source: Department of Statistics, Malaysia Period Malaysia: Consumer Price Index (2010=100), Jan Mar 2018 All groups Food & non-alcoholic beverages Alcoholic beverages & tobacco Clothing & footwear Housing, water, electricity, gas & other fuels Furnishings, household equipment & routine Health Transport Communication Recreation services and culture Education Restaurant & hotels Miscellaneous goods and services Weight Jan Feb Mar Jan Feb Mar % change (y-o-y) Jan Feb Mar Source: Department of Statistics, Malaysia 25
28 Malaysia: Industrial Production Index (2015=100), Jan Mar 2018 Period All Divisions Mining Manufacturing Electricity Weight Jan Feb Mar Jan Feb Mar % change (y-o-y) Jan Feb Mar Source: Department of Statistics, Malaysia 26
29 Acknowledgements Penang Institute would like to sincerely thank the following state and federal government departments as well as private associations for their continuous support and assistance in supplying important statistics for public use. Central Bank of Malaysia (BNM) Department of Agriculture, Penang Department of Fisheries, Penang Department of Statistics Malaysia (DOSM) Department of Veterinary Services, Penang Malaysia Airports Holdings Berhad Malaysian Association of Hotels (Penang Chapter) Malaysian Communications and Multimedia Commission (MCMC) Malaysian Investment Development Authority (MIDA) Malaysian Palm Oil Berhad (MPOB) Ministry of Education, Malaysia National Property Information Centre (NAPIC) Penang Port Sdn Bhd Penang State Economic Planning Division (BPEN) Penang State Education Department Penang State Health Department Penang Water Supply Corporation (PBA) Road Transport Department, Malaysia Rubber Industry Smallholders Development Authority (RISDA) Tenaga Nasional Berhad, Penang 27
PENANG STATISTICS QUARTER 4, 2015
 PENANG STATISTICS QUARTER 4, 2015 Submitted to the Penang State Government by Penang Institute 10 Brown Road, 10350 Penang TEL: (04) 228 3306 FAX: (04) 226 7042 E-mail: enquiry@penanginstitute.org Website:
PENANG STATISTICS QUARTER 2, 2015
 PENANG STATISTICS QUARTER 2, 2015 Submitted to the Penang State Government by Penang Institute 10 Brown Road, 10350 Penang TEL: (04) 228 3306 FAX: (04) 226 7042 E-mail: enquiry@penanginstitute.org Website:
Penang Statistics April 2002
 Penang Statistics April 2002 Submitted to the Penang State Government by Socio-Economic & Environmental Research Institute 10 Brown Road, 10350 Penang Tel: (04) 228 3306 Fax: 226 7042 E-mail: seripg@tm.net.my
Penang Statistics June 2003
 Penang Statistics June 2003 Submitted to the Penang State Government by Socio-Economic & Environmental Research Institute 10 Brown Road, 10350 Penang Tel: (04) 228 3306 Fax: 226 7042 E-mail: seripg@tm.net.my
ECONOMIC SURVEY STATISTICAL APPENDIX
 ECONOMIC SURVEY 2017-18 STATISTICAL APPENDIX STATISTICAL APPENDIX : ECONOMIC SURVEY 2017-18 PAGE 1 National Income and Production 1.1 Gross National Income and Net National Income... A1-A2 1.2 Annual
Consumer Price Index. November Consumer Price Index (CPI) November Contact Statistician: Phaladi Labobedi
 November Contact Statistician: Phaladi Labobedi") Consumer Price Index (CPI) November Consumer Price Index November Contact Statistician: Phaladi Labobedi Email: +267 3671300 November CPI 1 Published by STATISTICS BOTSWANA Private Bag 0024, Gaborone Tel:
Consumer Price Index (CPI) November Consumer Price Index November Contact Statistician: Phaladi Labobedi Email: +267 3671300 November CPI 1 Published by STATISTICS BOTSWANA Private Bag 0024, Gaborone Tel:
Statistical tables S 0. Money and banking. Capital market. National financial account. Public finance
 Statistical tables Money and banking Page S South African Reserve Bank: Liabilities... 2 South African Reserve Bank: Assets... 3 Corporation for Public Deposits: Liabilities... 4 Corporation for Public
, 2012 ARUBA. Contents. Available. 1 Real sector A 1.2B 1.6A 1.6B 1.7A 1.7B. 1.9 Utilities Oil refining
 CENTRALE C BANK B VAN ARUBA STATISTICAL TABLES Third QUARTER 2011 Last updated January 13, 2012 Contents 1 Real sector 1.1 Gross Domestic Product 1.2A Business Perception Results 1.2B Business Perception
Money and banking. Flow of funds for the first quarter
 Statistical tables Money and banking Page S South African Reserve Bank: Liabilities... 2 South African Reserve Bank: Assets... 3 Corporation for Public Deposits: Liabilities... 4 Corporation for Public
Gross Domestic Product 2014 Q4
 REPUBLIC OF RWANDA NATIONAL INSTITUTE OF STATISTICS OF RWANDA P.O.Box 6139 KIGALI - RWANDA Gross Domestic Product 2014 Q4 March 2015 I. Gross Domestic Product and its structure In the fourth quarter of
Statistical tables S 0. Money and banking. Capital market. National financial account. Public finance
 Statistical tables Money and banking Page S : Liabilities... 2 : Assets... 3 Corporation for Public Deposits: Liabilities... 4 Corporation for Public Deposits: Assets... 5 Banks: Liabilities... 6 7 Banks:
Table 8. Gross Domestic Product by Industrial Origin at Current Market Prices, (Rp. Billion)
") Table 8. Gross Domestic Product by Industrial Origin at Current Market Prices, 1997-2003 1. Agriculture, Forestry & Fishery 101,009 172,828 215,687 217,898 246,298 281,325 76,693 74,437 77,305 a. Farm
Table 8. Gross Domestic Product by Industrial Origin at Current Market Prices, 1997-2003 1. Agriculture, Forestry & Fishery 101,009 172,828 215,687 217,898 246,298 281,325 76,693 74,437 77,305 a. Farm
BRUNEI DARUSSALAM. Copies of this report are available to the public from
 IMF Country Report No. 16/310 September 2016 BRUNEI DARUSSALAM STATISTICAL APPENDIX This Statistical Appendix on Brunei Darussalam was prepared by a staff team of the International Monetary Fund. It is
CONSUMER PRICE INDEX (BASE PERIOD NOVEMBER 2009 = 100)
") CONSUMER PRICE INDEX (BASE PERIOD NOVEMBER 2009 = 100) No. 537 DECEMBER 2014 BRIEF METHODOLOGY: The CPI measures the over time in prices of goods and services consumed by people for day-to-day living.
CONSUMER PRICE INDEX (BASE PERIOD NOVEMBER 2009 = 100) No. 537 DECEMBER 2014 BRIEF METHODOLOGY: The CPI measures the over time in prices of goods and services consumed by people for day-to-day living.
All correspondence should be addressed to Statistician General CONSUMER PRICE STATISTICS MARCH 2012 CONTENTS
 Statistics Botswana Private Bag 0024, Gaborone, Botswana Tel: (267) 3671300, Fax (267) 3952201, Email:csobots@gov.bw, Website: www.cso.gov.bw All correspondence should be addressed to Statistician General
CONSUMER PRICE INDEX (BASE PERIOD NOVEMBER 2009 = 100)
") CONSUMER PRICE INDEX (BASE PERIOD NOVEMBER 2009 = 100) No. 544 y 2015 StatisticalNews BRIEF METHODOLOGY: The CPI measures the over time in prices of goods and services consumed by people for day-to-day
CONSUMER PRICE INDEX (BASE PERIOD NOVEMBER 2009 = 100) No. 544 y 2015 StatisticalNews BRIEF METHODOLOGY: The CPI measures the over time in prices of goods and services consumed by people for day-to-day
Mining and quarrying 13,503 19,062 26,170 35,190 38,511 53,515 74,386 85,792 99, ,422
 Table A1.1: Gross Domestic Product (GDP), at Factor Cost by kind of Economic Activity at Current Prices,Tanzania Mainland, 1992-2001 Millions of TZS Activity 1992 1993 1994 1995 1996 1997 1998 1999 2000
PREFACE. ... John Steytler STATISTICIAN - GENERAL NAMIBIA CONSUMER PRICE INDEX BULLETIN NOVEMBER
 PREFACE The Namibia Consumer Price Index (CPI) includes all Namibian private households living in urban and rural areas and is compiled by comparing the prices of the goods and services with the prices
Statistics Botswana CONSUMER PRICE INDEX - DECEMBER 2012
 Statistics Botswana Private Bag 0024, Gaborone, Botswana Tel: (267) 3671300, Fax (267) 3952201, Email: csobots@gov.bw, Website: www.cso.gov.bw All correspondence should be addressed to Statistician General
GDP. Total Domestic demand External balance 1)
") 3.1 GDP and expenditure components (quarterly data seasonally adjusted; annual data unadjusted) GDP Total Domestic demand External balance 1) Total Private Government Gross fixed capital formation Changes
3.1 GDP and expenditure components (quarterly data seasonally adjusted; annual data unadjusted) GDP Total Domestic demand External balance 1) Total Private Government Gross fixed capital formation Changes
Table 1 ANTIGUA AND BARBUDA: MAIN ECONOMIC INDICATORS
 Antigua Tables 2006 1 Main Indicators 03/11/2006 08:05 AM Table 1 ANTIGUA AND BARBUDA: MAIN ECONOMIC INDICATORS 1996 1997 1998 1999 2000 2001 2002 2003 2004 2005 a/ Annual growth rates b/ Gross domestic
Statistics Botswana Consumer Price Index - JULY National Rates of Inflation, January 2011 July 2013
 COMMENTARY Section 1: Headline Inflation Section 2: Core Inflation CHARTS 1. National Rates of Inflation, January 2011 July 2013 2. Monthly Changes in the Cost-of-Living Index, January 2011 July 2013 3.
STATISTICAL TABLES REAL SECTOR SECOND QUARTER 2018 Last updated August 17, 2018
 CENTRALE BANK VAN ARUBA STATISTICAL TABLES REAL SECTOR SECOND QUARTER 2018 Last updated August 17, 2018 Contents 1 Real sector 1.1 Gross Domestic Product 1.2A Business Perception Results 1.2B Business
SDT: KINGDOM OF TONGA NATIONAL ACCOUNTS STATISTICS
 SDT: 35-13 Statistics Department P.O. Box 149, Nuku alofa Government of Tonga Telephone: (676) 23-300 / 23-913 Email: dept@stats.gov.to Website: www.spc.int/prism/tonga/ Price: T$25.00 1 1 2 3 4 5 6 7
BRUNEI DARUSSALAM STATISTICAL APPENDIX. International Monetary Fund Washington, D.C. IMF Country Report No. 15/146. June 2015
 June 2015 IMF Country Report No. 15/146 BRUNEI DARUSSALAM STATISTICAL APPENDIX This Statistical Appendix on Brunei Darussalam was prepared by a staff team of the International Monetary Fund. It is based
Federated States of Micronesia
 IMF Country Report No. 13/17 Federated States of Micronesia 2012 ARTICLE IV CONSULTATION 2012 Statistical Appendix January 29, 2001 January 29, 2001 This Statistical Appendix paper for the Federated States
Annual Report on National Accounts for 2015 (Benchmark Year Revision of 2011) Summary (Flow Accounts)
 Summary (Flow Accounts)") Annual Report on National Accounts for 2015 (Benchmark Year Revision of 2011) Summary (Flow Accounts) I. Overview of Benchmark Year Revision of 2011 P 2 II. Expenditure Series P 3 III. Income Series P
Annual Report on National Accounts for 2015 (Benchmark Year Revision of 2011) Summary (Flow Accounts) I. Overview of Benchmark Year Revision of 2011 P 2 II. Expenditure Series P 3 III. Income Series P
STATISTICAL TABLES RELATING TO INCOME, EMPLOYMENT, AND PRODUCTION
 A P P E N D I X B STATISTICAL TABLES RELATING TO INCOME, EMPLOYMENT, AND PRODUCTION C O N T E N T S NATIONAL INCOME OR EXPENDITURE Page B 1. Gross domestic product, 1960 2009... 328 B 2. Real gross domestic
CHAPTER 2: DIALYSIS IN MALAYSIA. Lim Yam Ngo Lim Teck Onn Lee Day Guat
 CHAPTER 2: DIALYSIS IN MALAYSIA Lim Yam Ngo Lim Teck Onn Lee Day Guat Table 2.1.1: Stock and flow - Dialysis 2-29 2 21 22 23 24 25 26 27 28 29 New Dialysis 1855 2112 2362 269 2892 3132 3656 415 4468 4146
Gold Saskatchewan Provincial Economic Accounts. January 2018 Edition. Saskatchewan Bureau of Statistics Ministry of Finance
 Gold Saskatchewan Provincial Economic Accounts January 2018 Edition Saskatchewan Bureau of Statistics Ministry of Finance Contents Introduction and Overview... 1 Introduction... 1 Revisions in the January
Manitoba Economic Highlights
 Economic Overview Real Gross Domestic Product The Manitoba Bureau of Statistics estimates that Manitoba s real GDP grew 1.9% in 2016, above the national average of 1.4%. Manitoba s real GDP is expected
Consumer Price Index
 Series No.: SDT : 23-382 KINGDOM OF Consumer Price Index Statistical Bulletin SEPTEMBER 2018 Website: E-mail : Statistics Department P.O. Box 149 Nuku alofa Kingdom of Tonga www.spc.int/prism/tonga/ dept@stats.gov.to
Appendix B STATISTICAL TABLES RELATING TO INCOME, EMPLOYMENT, AND PRODUCTION
 Appendix B STATISTICAL TABLES RELATING TO INCOME, EMPLOYMENT, AND PRODUCTION C O N T E N T S Page NATIONAL INCOME OR EXPENDITURE: B. Gross domestic product, 959 005... 80 B. Real gross domestic product,
Statistical tables S 0. Money and banking. Capital market. National financial account. Public finance
 Statistical tables Money and banking Page S South African Reserve Bank: Liabilities... 2 South African Reserve Bank: Assets... 3 Corporation for Public Deposits: Liabilities... 4 Corporation for Public
National accounts and balance of payments
 1. Danish economy 1998 to 2008 Figure 1 Real growth in GDP 4 3 2 1 0-1 -2 Per cent 98 00 02 04 06 08 For further information visit www.statbank.dk/nat02. Economic downturn in 2008 The economic growth was
Statistical Annex. European Economic Forecast Autumn 2018
 European Economic Forecast Contents Output : GDP and its components 1. Gross domestic product 172 2. Profiles (q-o-q) of quarterly GDP 172 3. Profiles (y-o-y) of quarterly GDP 173 4. GDP per capita 173
Item
 Key Indicators for Asia and the Pacific 2010 POPULATION a Total population million; as of 1 July 18.17 18.55 18.93 19.33 19.73 20.14 20.56 20.99 21.42 21.87 22.32 22.79 23.30 23.82 24.36 24.91 25.47 26.04
Table 1. INCIDENCE RATES 1 BY INDUSTRY AND CASE TYPES
 from work, job transfer, ALL INDUSTRIES, INCLUDING STATE AND LOCAL GOVERNMENT 6 1,598.2 5.5 3.1 1.9 1.1 2.5 PRIVATE INDUSTRY 6 Goods Producing 6 1,382.6 5.1 2.9 1.7 1.2 2.2 267.4 6.5 3.7 2.1 1.6 2.8 Natural
Item
 332 Key Indicators of Developing Asian and Pacific Countries 333 001 POPULATION million; as of 1 July 47.72 48.71 49.68 50.64 51.58 52.51 53.43 54.33 55.21 55.84 56.57 57.29 58.01 58.71 59.40 60.00 60.60
Part C. Statistics Bank of Botswana
 Part C Statistics 2017 Bank of Botswana Contents Part C Part C: Statistics 1. NATIONAL OUTPUT TABLE 1.1 Gross Domestic Product by Type of Expenditure (Current Prices) S6 TABLE 1.2 Gross Domestic Product
STATUS OF BIODIESEL IMPLEMENTATION IN MALAYSIA AND BIODIESEL SPECIFICATIONS
 Guidelines toward High Biodiesel Blend Diesel (eg B20) Specification in the APEC Region, Honolulu, Hawaii, USA. 19 March 2018 STATUS OF BIODIESEL IMPLEMENTATION IN MALAYSIA AND BIODIESEL SPECIFICATIONS
Northern Region s Economic Conditions in July 2018
 Northern Region s Economic Conditions in July 218 1 Farm Income Index 25= 1 525 425 325 225 125 Nominal farm income 1 (%QoQ sa, %MoM sa) Agricultural production (QoQ sa, %MoM sa) Agricultural price (QoQ
Economic & Steel Market Development in Japan
 1 Economic & Steel Market Development in Japan 68 th OECD Steel Committee Paris May 6-7, 2010 The Japan Iron & Steel Federation 2 Macro-economic overview Steel Supply and Demand v v v Steel Production
Consumer Price Index
 1 Consumer Price Index SEPTEMBER Contact Statistician: Phaladi Labobedi. Private Bag 0024 Gaborone Botswana Tel: (+267) 367 1300. Toll Free: 0800 600 200 Fax: (+267) 395 2201. Email: info@statsbots.org.bw
INDEKS HARGA RUMAH MALAYSIA MALAYSIAN HOUSE PRICE INDEX
 INDEKS HARGA RUMAH MALAYSIA MALAYSIAN HOUSE PRICE INDEX Jan 217 - Mac 217 Q1 P 217 Jabatan Penilaian dan Perkhidmatan Harta Kementerian Kewangan Malaysia Aras 7, Perbendaharaan 2, No.7, Persiaran Perdana,
Statistical Annex. European Economic Forecast Spring 2018
 European Economic Forecast Contents Output : GDP and its components 1. Gross domestic product 160 2. Profiles (q-o-q) of quarterly GDP 160 3. Profiles (y-o-y) of quarterly GDP 161 4. GDP per capita 161
KCB GROUP PLC INVESTOR PRESENTATION. Q FINANCIAL RESULTS
 KCB GROUP PLC INVESTOR PRESENTATION. Q3 2018 FINANCIAL RESULTS MACRO-ECONOMIC HIGHLIGHTS Macro-Economic Highlights: Kenya KENYA 4.9% 5.3% GDP Growth Rate (%) 5.6% 5.8% 4.9% 6.3% 6.2% KENYA 2013 2014 2015
EMBARGOED UNTIL RELEASE AT 8:30 A.M. EDT, WEDNESDAY, JULY 30, 2014
 NEWS RELEASE EMBARGOED UNTIL RELEASE AT 8:30 A.M. EDT, WEDNESDAY, JULY 30, 2014 Lisa Mataloni: (202) 606-5304 (GDP) gdpniwd@bea.gov Jeannine Aversa: (202) 606-2649 (News Media) BEA 14-34 Nicole Mayerhauser:
EMBARGOED UNTIL RELEASE AT 8:30 A.M. EST, WEDNESDAY, JANUARY 31, 2007 GROSS DOMESTIC PRODUCT: FOURTH QUARTER 2006 (ADVANCE)
") NEWS RELEASE EMBARGOED UNTIL RELEASE AT 8:30 A.M. EST, WEDNESDAY, JANUARY 31, 2007 Virginia H. Mannering: (202) 606-5304 BEA 07-02 Recorded message: (202) 606-5306 GROSS DOMESTIC PRODUCT: FOURTH QUARTER
NEWS RELEASE EMBARGOED UNTIL RELEASE AT 8:30 A.M. EST, WEDNESDAY, JANUARY 31, 2007 Virginia H. Mannering: (202) 606-5304 BEA 07-02 Recorded message: (202) 606-5306 GROSS DOMESTIC PRODUCT: FOURTH QUARTER
EMBARGOED UNTIL RELEASE AT 8:30 A.M. EST, FRIDAY, FEBRUARY 27, 2015
 NEWS RELEASE EMBARGOED UNTIL RELEASE AT 8:30 A.M. EST, FRIDAY, FEBRUARY 27, 2015 Lisa Mataloni: (202) 606-5304 (GDP) gdpniwd@bea.gov BEA 15-07 Jeannine Aversa: (202) 606-2649 (News Media) GROSS DOMESTIC
ECONOMIC SURVEY STATISTICAL APPENDIX
 ECONOMIC SURVEY 2011-12 STATISTICAL APPENDIX STATISTICAL APPENDIX : ECONOMIC SURVEY 2011-2012 PAGE 0.1 Select Indicators: 1950-51 to 2010-11... A1-A2 1. National Income and Production 1.1 Gross National
STATUS OF BIODIESEL IMPLEMENTATION IN MALAYSIA AND BIODIESEL SPECIFICATIONS
 APEC Project No: EWG 20 2016A Guidelines toward High Biodiesel Blend Diesel (eg B20) Specification in the APEC Region, Bangkok, 13-14 Dec 2017 STATUS OF BIODIESEL IMPLEMENTATION IN MALAYSIA AND BIODIESEL
Money and banking. Flow of funds for the third quarter
 Statistical tables Money and banking Page S South African Reserve Bank: Liabilities... 2 South African Reserve Bank: Assets... 3 Corporation for Public Deposits: Liabilities... 4 Corporation for Public
Dr Ahmad Fauzi Puasa Deputy Director, Malaysia Institute Economic Research Kuala Lumpur Maritime Park & Spa Resort, Krabi, Thailand 29 August, 2013
 ASIA PALM OIL CONFERENCE (APOC) 2013: INNOVATING THAILAND S PALM OIL INDUSTRY World Economic Uncertainty Affect the World Palm Oil Industry Dr Ahmad Fauzi Puasa Deputy Director, Malaysia Institute Economic
Consumer Price Index
 1 Consumer Price Index JULY Contact Statistician: Phaladi Labobedi. Private Bag 0024 Gaborone Botswana Tel: (+267) 367 1300. Toll Free: 0800 600 200 Fax: (+267) 395 2201. Email: info@statsbots.org.bw Website:
X PLICIT. Key Economic Indicators December Member of HVB Group. Banking for success.
 Member of HVB Group Business Information www.ba-ca.com X PLICIT Key Economic Indicators December 2002 Banking for success. ECONOMIC FORECASTS FOR AUSTRIA* Percentage change over previous year 2000 200
Port Botany Trade Statistics Bulletin. 1 July May 2017
 Port Botany Trade Statistics Bulletin 1 July 2016 31 May 2017 YTD May 2017 Port Botany Container Trade Jul 2016 Aug 2016 Sep 2016 Oct 2016 Nov 2016 Dec 2016 Jan 2017 Feb 2017 Mar 2017 Apr 2017 May 2017
Consumer Price Index. October Contact Statistician: Phaladi Labobedi
 Consumer Price Index October Contact Statistician: Phaladi Labobedi. Private Bag 0024 Gaborone Botswana Tel: (+267) 367 1300. Toll Free: 0800 600 200 Fax: (+267) 395 2201. Email: info@statsbots.org.bw
Export Oriented Enterprises (EOE) 3 rd Quarter Introduction This issue of Economic and Social Indicators (ESI) presents the results of the
 3 rd Quarter Introduction This issue of Economic and Social Indicators (ESI) presents the results of the") Export Oriented Enterprises (EOE) 3 rd Quarter 2017 1. Introduction This issue of Economic and Social Indicators (ESI) presents the results of the Quarterly Survey of Employment among Export Oriented Enterprises
Export Oriented Enterprises (EOE) 3 rd Quarter 2017 1. Introduction This issue of Economic and Social Indicators (ESI) presents the results of the Quarterly Survey of Employment among Export Oriented Enterprises
Monthly Report on the Corporate Goods Price Index ( Preliminary Figures for August 2014 )
") Research and Statistics Department Bank of Japan Report on the Corporate Goods Price The Producer Price fell 0.2 percent from the previous. The Export Price (contract currency ) rose 0.1 percent from the
Research and Statistics Department Bank of Japan Report on the Corporate Goods Price The Producer Price fell 0.2 percent from the previous. The Export Price (contract currency ) rose 0.1 percent from the
Monthly Report on the Corporate Goods Price Index ( Preliminary Figures for July 2015 )
") Research and Statistics Department Bank of Japan Report on the Corporate Goods Price The Producer Price fell 0.2 percent from the previous. The index excluding extra charges for summer electricity fell
Research and Statistics Department Bank of Japan Report on the Corporate Goods Price The Producer Price fell 0.2 percent from the previous. The index excluding extra charges for summer electricity fell
Consumer Price Index November 2017
 Consumer Price Index November 2017 (BASE PERIOD DECEMBER 2009 = 100) Report Date: December 2017 Data Source: National Bureau of Statistics NATIONAL BUREAU OF STATISTICS Content Brief Methodology... 1 All
Export Oriented Enterprises (EOE) 2nd Quarter 2018
 2nd Quarter 2018") Export Oriented Enterprises (EOE) 2nd Quarter 2018 1. Introduction This issue of Economic and Social Indicators (ESI) presents the results of the Quarterly Survey of Employment among Export Oriented Enterprises
Export Oriented Enterprises (EOE) 2nd Quarter 2018 1. Introduction This issue of Economic and Social Indicators (ESI) presents the results of the Quarterly Survey of Employment among Export Oriented Enterprises
Export Oriented Enterprises (EOE) 1st Quarter Introduction This issue of Economic and Social Indicators (ESI) presents the results of the
 1st Quarter Introduction This issue of Economic and Social Indicators (ESI) presents the results of the") Export Oriented Enterprises (EOE) 1st Quarter 2018 1. Introduction This issue of Economic and Social Indicators (ESI) presents the results of the Quarterly Survey of Employment among Export Oriented Enterprises
Export Oriented Enterprises (EOE) 1st Quarter 2018 1. Introduction This issue of Economic and Social Indicators (ESI) presents the results of the Quarterly Survey of Employment among Export Oriented Enterprises
Consumer Price Index
 1 Consumer Price Index AUGUST Contact Statistician: Phaladi Labobedi. Private Bag 0024 Gaborone Botswana Tel: (+267) 367 1300. Toll Free: 0800 600 200 Fax: (+267) 395 2201. Email: info@statsbots.org.bw
Monthly Report on the Corporate Goods Price Index ( Preliminary Figures for September 2017 )
") Research and Statistics Department Bank of Japan Report on the Corporate Goods Price Index The Producer Price Index rose 0.2 percent from the previous. The Export Price Index (contract currency ) rose
Research and Statistics Department Bank of Japan Report on the Corporate Goods Price Index The Producer Price Index rose 0.2 percent from the previous. The Export Price Index (contract currency ) rose
Monthly Report on the Corporate Goods Price Index ( Preliminary Figures for October 2017 )
") Research and Statistics Department Bank of Japan Report on the Corporate Goods Price Index FOR RELEASE 8:50 A.M. Monday, November 13, 2017 The Producer Price Index rose 0.3 percent from the previous. The
Research and Statistics Department Bank of Japan Report on the Corporate Goods Price Index FOR RELEASE 8:50 A.M. Monday, November 13, 2017 The Producer Price Index rose 0.3 percent from the previous. The
Monthly Report on the Corporate Goods Price Index ( Preliminary Figures for June 2014 )
") Research and Statistics Department Bank of Japan Report on the Corporate Goods Price The Producer Price rose 0.2 percent from the previous. The Export Price (contract currency ) fell 0.1 percent from the
Research and Statistics Department Bank of Japan Report on the Corporate Goods Price The Producer Price rose 0.2 percent from the previous. The Export Price (contract currency ) fell 0.1 percent from the
Cambodia. East Asia: Testing Times Ahead
 Key Indicators Cambodia 68 East Asia: Testing Times Ahead 2002 2003 2004 2005 2006 2007 /e 2008 /p 2009 /p Year Year Year Year Year Year Year Year Real GDP (% change, previous year) 6.5 8.5 10.0 13.5 10.8
Item
 Key Indicators for Asia and the Pacific 2009 POPULATION Total population a thousand; as of 1 July 295 305 316 328 340 353 366 380 394 409 420 432 444 457 470 483 496 510 524 Population density persons
Private industries. Construction Total
 005 TABLE B. Gross domestic product (GDP) by industry, value added, in current dollars as a percentage of GDP, 987 003 Gross domestic product private Agriculture, forestry, fishing, hunting Mining Construction
Monthly Report on the Corporate Goods Price Index ( Preliminary Figures for May 2018 )
") Research and Statistics Department Bank of Japan Report on the Corporate Goods Price Index The Producer Price Index rose 0.6 percent from the previous. The Export Price Index (contract currency ) rose
Research and Statistics Department Bank of Japan Report on the Corporate Goods Price Index The Producer Price Index rose 0.6 percent from the previous. The Export Price Index (contract currency ) rose
Solomon Islands Government. Statistical Bulletin: 11/2011. HONIARA CONSUMER PRICE INDEX (June 2011)
") Solomon Islands Government Statistical Bulletin: 11/2011 HONIARA CONSUMER PRICE INDEX (June 2011) Solomon Islands National Statistics Office Ministry of Finance & Treasury PO Box G6 Honiara Enquiries:
Solomon Islands Government Statistical Bulletin: 11/2011 HONIARA CONSUMER PRICE INDEX (June 2011) Solomon Islands National Statistics Office Ministry of Finance & Treasury PO Box G6 Honiara Enquiries:
Monthly Report on the Corporate Goods Price Index ( Preliminary Figures for April 2014 )
") Research and Statistics Department Bank of Japan Report on the Corporate Goods Price The Domestic Corporate Goods Price rose 2.8 percent from the previous. The Export Price (contract currency ) fell 0.1
Research and Statistics Department Bank of Japan Report on the Corporate Goods Price The Domestic Corporate Goods Price rose 2.8 percent from the previous. The Export Price (contract currency ) fell 0.1
Consumer Price Index. December 2018
 Consumer Price Index December Contact Statistician: Phaladi Labobedi. Private Bag 0024 Gaborone Botswana Tel: (+267) 367 1300. Toll Free: 0800 600 200 Fax: (+267) 395 2201. Email: info@statsbots.org.bw
By size : Large enterprises and SMEs took a downturn for two months in a row
 TDB Trends Research (Research & Summary for May 2018) Domestic economy worsened for two months in a row due to rising crude oil prices ~ Retail industry significantly worsened because of weak consumer
SECTION 3: NATIONAL ACCOUNTS
 SECTION 3: NATIONAL ACCOUNTS TABLE 28: PROVISIONAL ESTIMATE OF GDP AT CURRENT PRICES BY INDUSTRY(T$'000) Industry 1993 94 1994 95 1995 96 1996 97 1997 98 1998 99 1999 00 2000 01 2001-02 2002-03 2003-04p
ECONOMIC BULLETIN - No. 42, MARCH Statistical tables
 ECONOMIC BULLETIN - No. 42, MARCH 2006 APPENDIX Appendix Statistical tables The world economy Table a1 Gross domestic product a2 Industrial production a3 Consumer prices a4 External current account a5
Port Botany. Trade Statistics Bulletin 1 July June 2018
 Port Botany Trade Statistics Bulletin 1 July 2017 30 June 2018 FY 2017/18 Port Botany Container Trade Jul 2017 Aug 2017 Sep 2017 Oct 2017 Nov 2017 Dec 2017 Jan 2018 Feb 2018 Mar 2018 Apr 2018 May 2018
Total Surface Area DEVELOPING MEMBER ECONOMY. ( 000 km 2 ) (million) (%)
 (million) (%)") Land Population Millennium Development Goals National Accounts Prices Money Balance of Payments Reserves External Debt Central Government Finance BASIC STATISTICS 2015 Economic Research and Regional Cooperation
Land Population Millennium Development Goals National Accounts Prices Money Balance of Payments Reserves External Debt Central Government Finance BASIC STATISTICS 2015 Economic Research and Regional Cooperation
Total Surface Area DEVELOPING MEMBER COUNTRY (DMC) ( 000 sq. km) (Mn) (%)
 ( 000 sq. km) (Mn) (%)") Economics and Research Department Development Indicators and Policy Research Division Basic Statistics 2011 Millennium Development Goals Land Population National Accounts Prices Money Balance of Payments
Economics and Research Department Development Indicators and Policy Research Division Basic Statistics 2011 Millennium Development Goals Land Population National Accounts Prices Money Balance of Payments
GROSS DOMESTIC PRODUCT
 STATISTICS BOTSWANA GROSS DOMESTIC PRODUCT GROSS DOMESTIC PRODUCT Second Quarter 2018 Copyrights 2018. Private Bag 0024 Botswana Tel: (267) 367 1300. Toll Free: 0800 600 200. Fax: (267) 395 2201. Email:
Consumer price inflation, UK: June 2018
 Statistical bulletin Consumer price inflation, UK: June 2018 Price indices, percentage changes and weights for the different measures of consumer price inflation. Contact: Philip Gooding cpi@ons.gov.uk
No.1-2. Key Economic Indicators. Bank Austria Economics and Market Analysis
 No.-2 2008 Key Economic Indicators Bank Austria Economics and Market Analysis Key Economic Indicators Issue -2/2008 Economic Forecasts for Austria Percentage change over previous year 2006 2007 2008 2
Contents of Paper. 06-Jan-17 SIGNIFICANCE OF COMMODITIES SECTOR TO MALAYSIAN ECONOMY, WITH EMPHASIS ON OIL PALM
 SIGNIFICANCE OF COMMODITIES SECTOR TO MALAYSIAN ECONOMY, WITH EMPHASIS ON OIL PALM Ahmad Fauzi, Puasa Deputy Director Malaysian Institute of Economic Research (MIER) 17 January 2017 Contents of Paper World
GEZ PETROL STATION: SPREADSHEET MODELLING FOR CAPITAL BUDGETING *
 GEZ PETROL STATION: SPREADSHEET MODELLING FOR CAPITAL BUDGETING * Abstract Purpose This case requires students to prepare a good financial model to find the net present value of the business and make a
Gross Domestic Product: Second Quarter 2016 (Second Estimate) Corporate Profits: Second Quarter 2016 (Preliminary Estimate)
 Corporate Profits: Second Quarter 2016 (Preliminary Estimate)") EMBARGOED UNTIL RELEASE AT 8:30 A.M. EDT, FRIDAY, AUGUST 26, 2016 BEA 16-44 Technical: Lisa Mataloni (GDP) (301) 278-9080 gdpniwd@bea.gov Kate Pinard (Corporate Profits) (301) 278-9417 cpniwd@bea.gov Media:
EMBARGOED UNTIL RELEASE AT 8:30 A.M. EDT, FRIDAY, AUGUST 26, 2016 BEA 16-44 Technical: Lisa Mataloni (GDP) (301) 278-9080 gdpniwd@bea.gov Kate Pinard (Corporate Profits) (301) 278-9417 cpniwd@bea.gov Media:
Consumer price inflation, UK: July 2018
 Statistical bulletin Consumer price inflation, UK: July 2018 Price indices, percentage changes and weights for the different measures of consumer price inflation. Contact: James Tucker cpi@ons.gov.uk Consumer
Table A1 - Queensland Mean Population (Male & Female)
") Table A1 - Queensland Mean Population (Male & Female) 1860-1930 Year Males Females Persons Year Males Females Persons 1860 15355 10453 25788 1912 342,663 288,914 631,577 1865 49416 31504 80920 1913 353,625
Table A1 - Queensland Mean Population (Male & Female) 1860-1930 Year Males Females Persons Year Males Females Persons 1860 15355 10453 25788 1912 342,663 288,914 631,577 1865 49416 31504 80920 1913 353,625
Total Surface Area DEVELOPING MEMBER ECONOMY. ( 000 km 2 ) (million) (%)
 (million) (%)") BASIC 2016 STATISTICS Economic Research and Regional Cooperation Department Development Economics and Indicators Division Land Population National Accounts Prices Money Balance of Payments Reserves External
BASIC 2016 STATISTICS Economic Research and Regional Cooperation Department Development Economics and Indicators Division Land Population National Accounts Prices Money Balance of Payments Reserves External
EMBARGOED UNTIL RELEASE AT 8:30 A.M. EST, WEDNESDAY, JANUARY 30, 2013 GROSS DOMESTIC PRODUCT: FOURTH QUARTER AND ANNUAL 2012 (ADVANCE ESTIMATE)
") NEWS RELEASE EMBARGOED UNTIL RELEASE AT 8:30 A.M. EST, WEDNESDAY, JANUARY 30, 2013 Lisa Mataloni: (202) 606-5304 (GDP) gdpniwd@bea.gov Recorded message: (202) 606-5306 BEA 13-02 GROSS DOMESTIC PRODUCT:
NEWS RELEASE EMBARGOED UNTIL RELEASE AT 8:30 A.M. EST, WEDNESDAY, JANUARY 30, 2013 Lisa Mataloni: (202) 606-5304 (GDP) gdpniwd@bea.gov Recorded message: (202) 606-5306 BEA 13-02 GROSS DOMESTIC PRODUCT:
The Manitoba Workplace Injury Statistics Report
 The Manitoba Workplace Injury Statistics Report 2000 2014 Table of Contents Acknowledgements... 2 Methodology Note on 2009 Extension of WCB Coverage and Change in Average Weekly Earnings... 2 Major Highlights
Monthly Report on the Corporate Goods Price Index ( Preliminary Figures for November 2017 )
") Research and Statistics Department Bank of Japan Report on the Corporate Goods Price Index The Producer Price Index rose 0.4 percent from the previous. The Export Price Index (contract currency ) rose
Research and Statistics Department Bank of Japan Report on the Corporate Goods Price Index The Producer Price Index rose 0.4 percent from the previous. The Export Price Index (contract currency ) rose
International Monetary Fund Washington, D.C.
 2008 International Monetary Fund April 2008 IMF Country Report No. 08/132 Republic of Moldova: Statistical Appendix This Statistical Appendix for the Republic of Moldova was prepared by a staff team of
Port Botany. Trade Statistics Bulletin 1 July April 2018
 Port Botany Trade Statistics Bulletin 1 July 2017 30 April 2018 YTD April 2018 Port Botany Container Trade Jul 2017 Aug 2017 Sep 2017 Oct 2017 Nov 2017 Dec 2017 Jan 2018 Feb 2018 Mar 2018 Apr 2018 Export
Investment Incentive For Rubber Industry
 MREPC REGIONAL SEMINAR Investment Incentive For Rubber Industry Present by Mr. Mohd Rasli Muda Director, Food Technology & Sustainable Resources Malaysian Investment Development Authority (MIDA) Contents
Monthly Report on the Corporate Goods Price Index ( Preliminary Figures for November 2018 )
") Research and Statistics Department Bank of Japan Report on the Corporate Goods Price Index The Producer Price Index fell 0.3 percent from the previous. The Export Price Index (contract currency ) fell
Research and Statistics Department Bank of Japan Report on the Corporate Goods Price Index The Producer Price Index fell 0.3 percent from the previous. The Export Price Index (contract currency ) fell
BUKU TAHUNAN PERANGKAAN MALAYSIA STATISTICS YEARBOOK 2014 HARGA HARGA HARGA-HARGA PRICES
 HARGA HARGA HARGA-HARGA PRICES 81 BUKU TAHUNAN PERANGKAAN MALAYSIA STATISTICS YEARBOOK 2014 9.1: Indeks Harga Pengguna bagi Kumpulan Utama Consumer Price Index for Main Groups Negeri State Tahun Year Jumlah
CETA prime sponsor management decisions and program goal achievement. rural oriented research and development projects: a review and synthesis
 Lawrence University Weeding List #475 Contact: Kimberly Knuppel at: kimberly.knuppel@lawrence.edu L 37.14: 45 L 37.14: 44 L 37.14: 43 L 37.14: 42 unlocking the second gate the implementation of CETA in