Fine Granulated Sugar. MSM is determined to become a global top 10 player in the sugar industry by 2020.
|
|
|
- Erika Summers
- 5 years ago
- Views:
Transcription
1
2

3 Cube Sugar Coarse Granulated Sugar Fine Granulated Sugar MSM is determined to become a global top 10 player in the sugar industry by 2020.
4

5 MSM Malaysia Holdings Berhad (MSM), incorporated on 10 March 2011, is Malaysia s leading sugar producer. It was listed on the Main Market of Bursa Malaysia Securities Berhad on 28 June 2011.

6
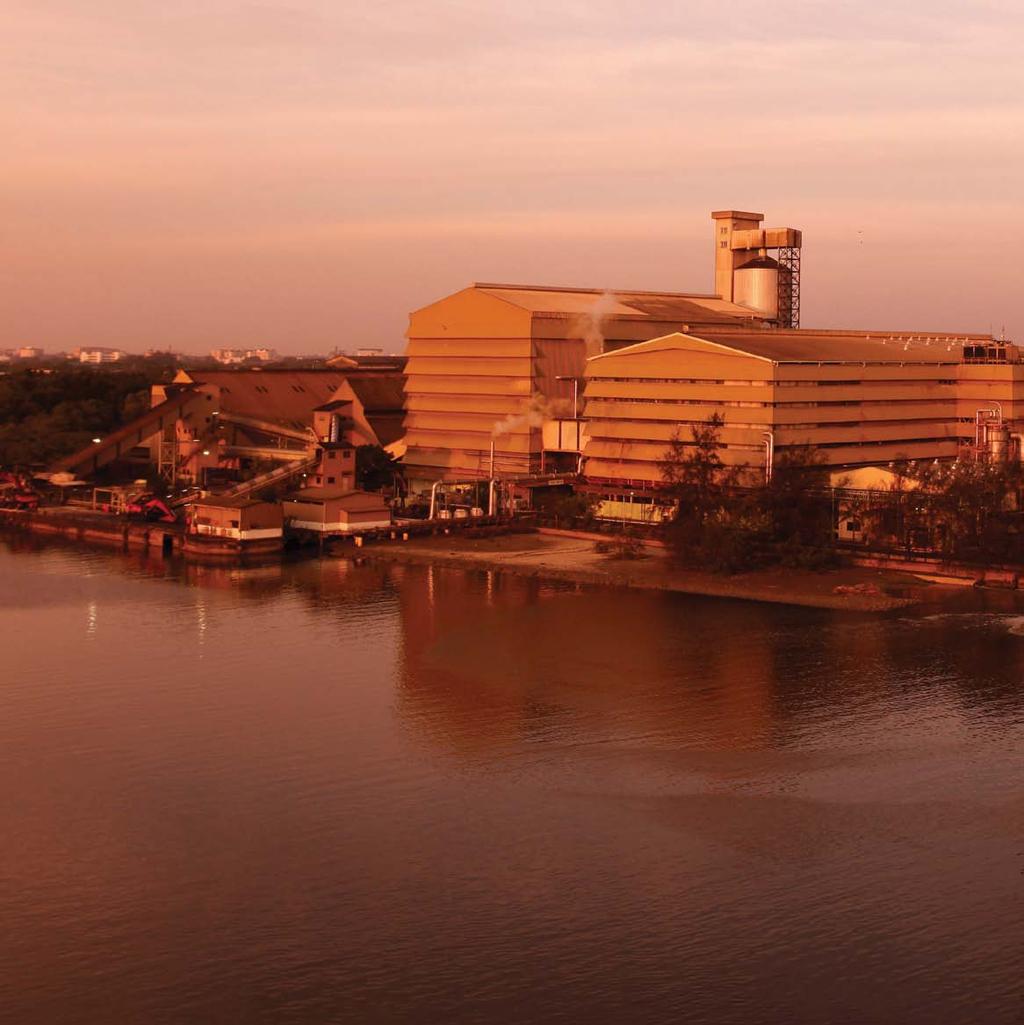
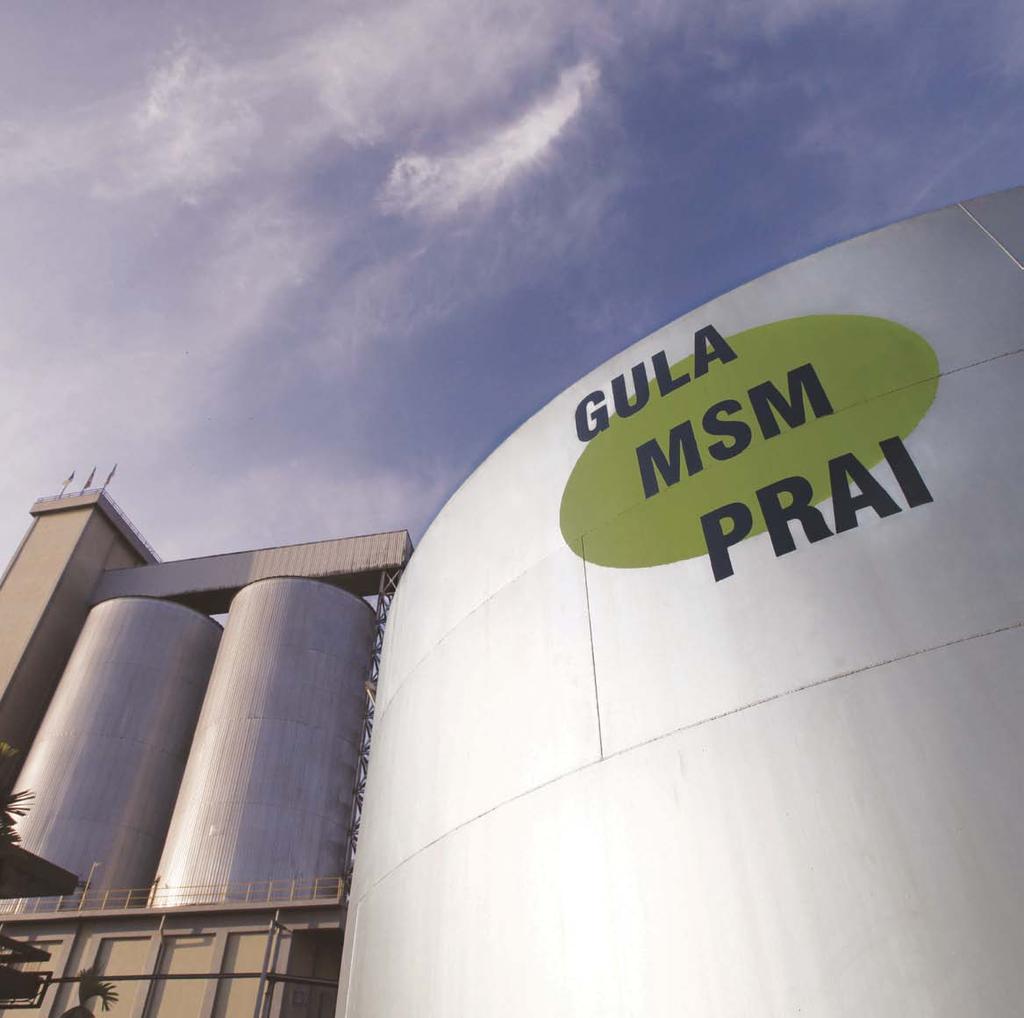
7 MSM Malaysia Holdings Berhad (MSM), incorporated on 10 March 2011, is Malaysia s leading sugar producer. It was listed on the Main Market of Bursa Malaysia Securities Berhad on 28 June 2011 and is one of the top 60 companies on Bursa Malaysia with a market capitalisation of RM3.4 billion (as at 2014). MSM operates the sugar business of Felda Global Ventures Holdings Berhad. It produces, markets and sells refined sugar products. The company conducts its business principally through subsidiaries, MSM Prai Berhad (formerly known as Malayan Sugar Manufacturing Company Berhad) and MSM Perlis Sdn Bhd (formerly known as Kilang Gula Felda Perlis Sdn Bhd) which were established in 1959 and 1971, respectively. MSM Prai Berhad was a joint venture between Kuok Brothers Sdn Bhd, Mitsui & Co. and Nissin Sugar Manufacturing Company, established to reduce Malaysia s dependence on imported refined sugar. MSM also operates its own logistics company, MSM Logistics Sdn Bhd (formerly known as Astakonas Sdn Bhd). Through its subsidiaries, MSM has a combined annual production of 1.1 million tonnes of refined sugar products. In 2013, MSM produced 938,203 tonnes of sugar products, of which about 20% were for the export market. MSM currently holds 64% of the domestic market share. The company offers a variety of products ranging from white refined sugar of various grain sizes to soft brown sugar. These are marketed and sold in a variety of packaging options under two brands Gula Prai and Gula Perlis. The company also sells molasses, a by-product of the refining process to distilleries and producers of ethanol, animal feed and yeast; among other products. MSM sells to a wide range of customers in Malaysia and in other countries directly and indirectly through traders, wholesalers and distributors. Its customers include major companies in the beverage and confectionery industries, hotels, restaurants, food outlets and household consumers. Leading since1959


8
9 Establishment of MSM Prai facility in Prai, Penang 64 MSM Prai facility commences operations in Prai, Penang 71 Establishment of MSM Perlis facility in Chuping, Perlis 73 MSM Perlis facility commences milling and refinery operations in Chuping, Perlis 76 MSM Prai facility embarks on automation of production processes 80 MSM Perlis facility commences imported raw sugar refining operations 90 MSM Perlis facility increases refining capacity to 41,000 mt per year MSM s warehouse at Johor Bahru commences operations with rail connection from MSM Prai facility 07 MSM Prai facility increases refining capacity to 800,000 mt per year 10 Refining capacities increases to 960,000 mt per year at MSM Prai facility and to 150,000 mt per year at MSM Perlis. Acquisition by the Felda Group of PPB Group s interests in MSM Prai and MSM Perlis 11 Incorporation of MSM Malaysia Holdings Berhad and consequently the successful listing of MSM on the Main Market of Bursa Malaysia 92 MSM s warehouse at Sungai Buloh commences operations with rail connection from MSM Prai facility MSM s Sugar Trail


10
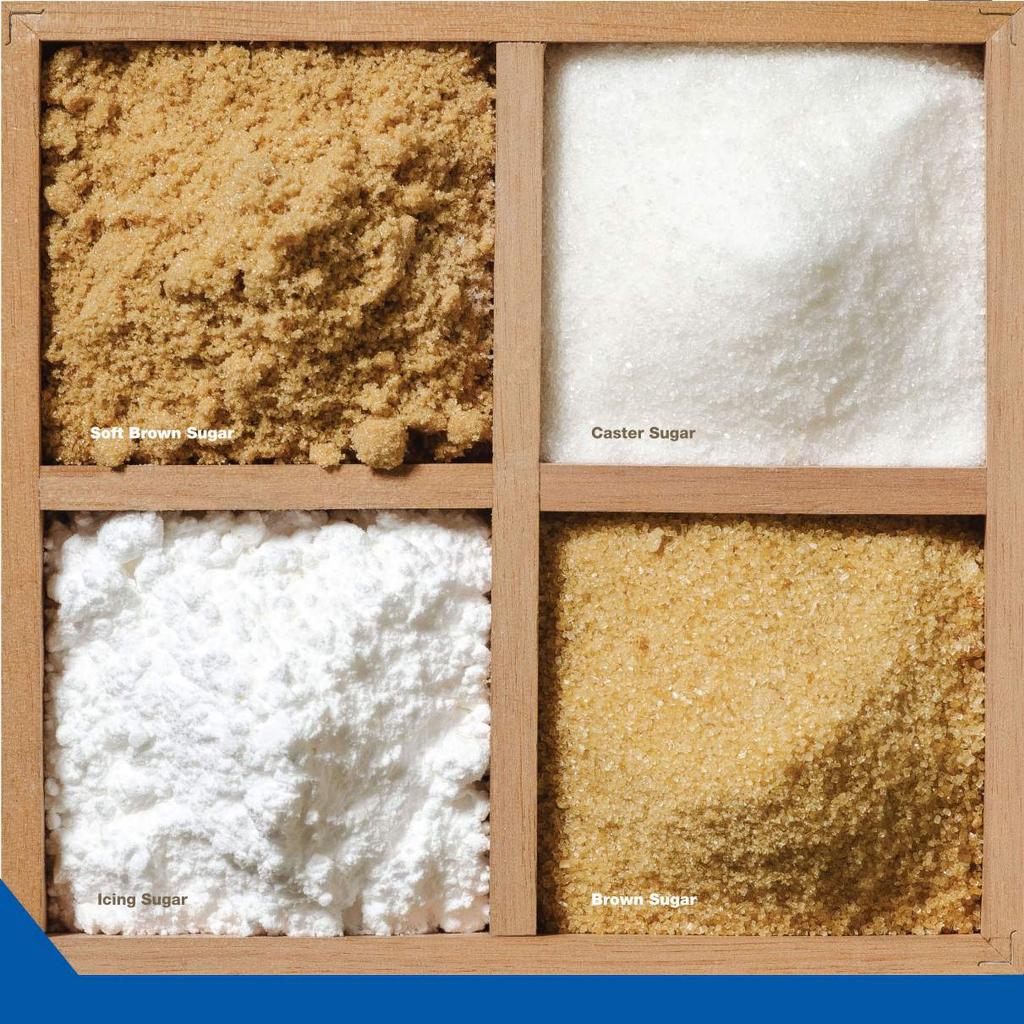
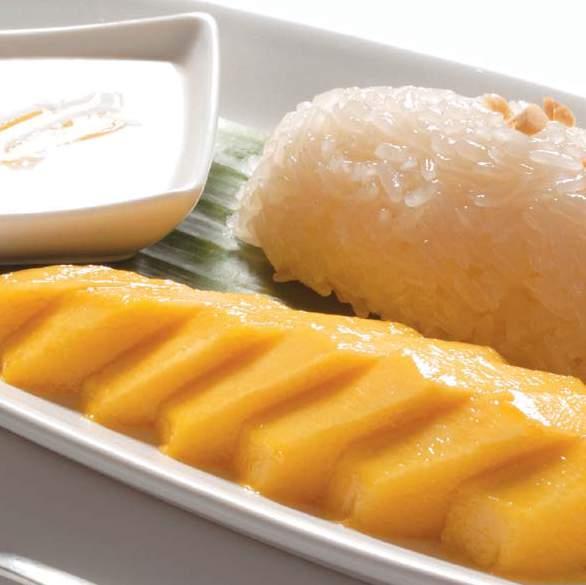
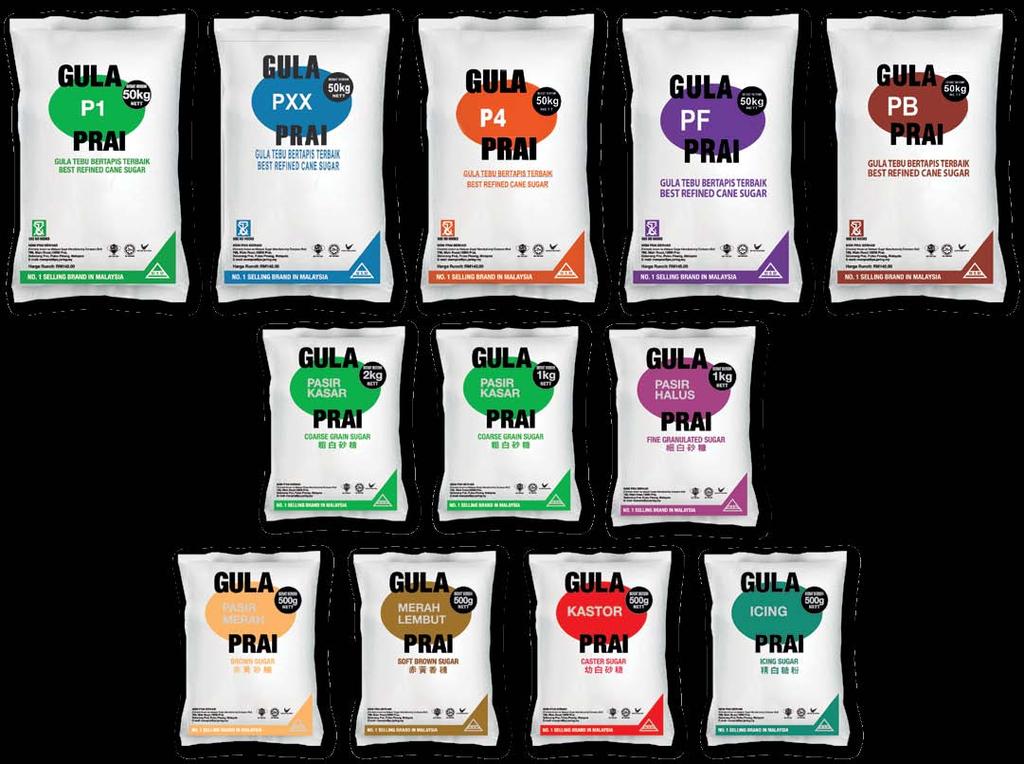
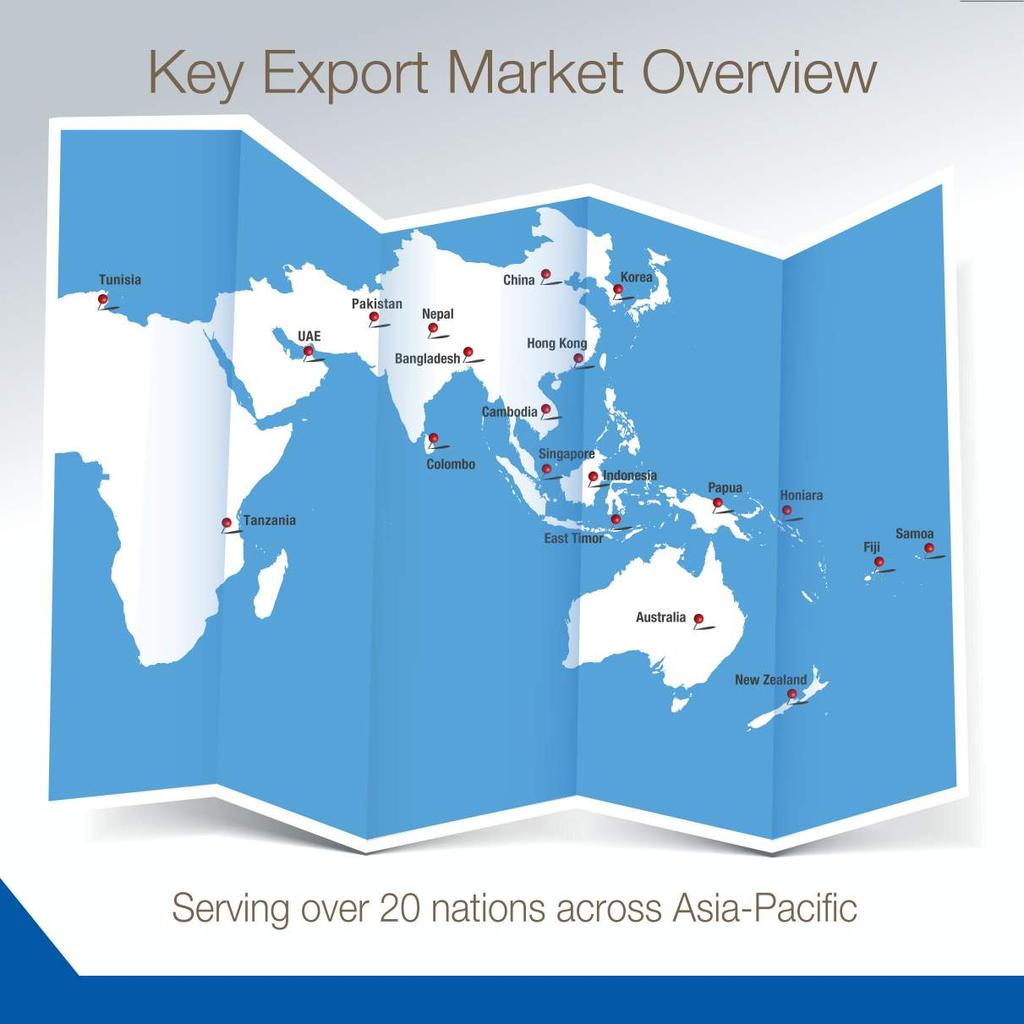
11 Refined sugar of various grades are packed in an assortment of packing sizes and types, tailored to the consumers requirements and convenience. The different grades of white refined sugar produced are classified under the general categories of Coarse Granulated, Fine Granulated and Caster. These categories encompass the common grades that meet the needs of industrial markets such as PXX (Fine Granulated), and retail markets such as P1 (Coarse Granulated). In addition, Brown Sugar grades such as Soft Brown are also produced. The products are offered in a variety of packaging sizes including sugar cubes, 5gm sachets and 1kg, 2kg, 25kg and 50kg bags. Retail packages are marketed under the trade names Gula Prai and Gula Perlis. Sugar for Industrial Consumers Sugar is one of the most commonly used ingredients in commercial food and drink manufacture. Manufacturers who use sugar include those making ice cream, milk, beverages and confectionery. Others are brewers and those in the canning industry. Refined sugar for industrial users are supplied in packing sizes ranging from 25kg to 1,200kg bags and bulk road tanker, depending on the customer s needs. Sugar for Retail and Other Commercial Consumers For these customers, sugar is available in 1kg packaging, cube packaging and sachet packaging (cup-packs). They are easily found in supermarkets and in retail shops. In addition, we cater to establishments such as restaurants and hotels including providing customised sachet packing according to customers own choice of design. Our products are also exported to Singapore, Hong Kong, Korea, New Zealand and Australia. In 2013, MSM sold 929,051 mt of refined sugar products. The Sugar Business
12 Business Overview IMPORTS OF RAW SUGAR SUGAR REFINING INDUSTRY EXPORT MARKET RETAILERS & DISTRIBUTORS DOMESTIC MARKET INDUSTRIAL CONSUMERS HOUSEHOLD PROCESSED FOOD MANUFACTURERS (i.e. Soft Drink, Baked Goods, Sugar, Confectioneries etc)

13 We aspire to be the market leader in the sugar industry and to position Malaysia as the definitive sugar hub for Asia Pacific. We plan to take full control of the sugar supply chain; from upstream to downstream. We possess 64% domestic market share. We have RM3.4 billion market capitalisation as at We intend to produce 4 million tonnes of sugar per annum come Backed by quality achievements, reputed clientele and continuous investments in people, technology and capabilities; MSM is committed to advancing its domestic lead and making new inroads internationally. Sweet Success
14
15 MSM gains you a competitive business edge by: Leveraging on Strong Fundamentals MSM continues to focus on capacity and warehouse expansion, in readiness to meet increased demand and increase in forecast of daily raw sugar melt production. Setting New Standards As the leading sugar brand in Malaysia, MSM is committed to uphold its repute for quality products that meet the highest standards of productivity, safety and hygiene. Strongly Entering Into New Markets MSM targets to increase exports to new markets in the Asia Pacific region by harnessing greater operational efficiencies through Enterprise Resource Planning. Establishing a Stronger Lead in the Industry State of the art automation, continuous honing of skills and capabilities, and regular upgrade of production process have ensured that MSM progresses as the nation s leading sugar entity. A Sweeter Edge


 Best Video")


 Special Award")

16 Awards & Achievements The Billion Ringgit Club 2013 Awarded by: The Edge The Blue Ribbon Certificate Awarded by: Malaysian Health Promotion Board (MySihat) Best Video OSH Promotional Video Awarded by: Department of Occupational Safety & Health Penang Best Director Award Awarded by: Department of Occupational Safety & Health Penang Best Video 1st Place Awarded by: Department of Occupational Safety & Health Penang Top Ten Exporters and Importers By Container Volume Awarded by: Penang Port Sdn Bhd (PPSB) Special Award Awarded by: MTT Group


 Certification by: The Ministry of Health, Malaysia HALAL")

17 OHSAS : 2007 Certification by: SIRIM QAS for complying with Occupational Health and Safety Management System MS1722 : 2011 Certification by: The International Certification Network for complying with Occupational Health and Safety Management System ISO 9001 : 2008 Certification by: SIRIM QAS and International Certification Network for complying with Quality Management Systems in: Purchasing of raw sugar Marketing service for export and domestic sales Receiving and warehousing of refined sugar Delivery of refined sugar to customers Manufacture of refined sugar and related products Food Safety System Certification : 2010 Certification by: SGS Malaysia for complying with Food Safety Management Systems Hazard Analysis and Critical Control Point (HACCP) Certification by: The Ministry of Health, Malaysia HALAL Certification by Department of Islamic Development (JAKIM) Certification as confirmation of our compliance with stringent food processes Kosher Certification by a London Beth Bin Certified Company
18 NORTH AMERICA USA 7,610 10,780 Canada 120 1,320 CENTRAL AMERICA Mexico 6,560 5,055 Guatemala 3, Cuba 1, Nicaragua El Salvador Dominican Republic Honduras Costa Rica Panama Jamaica SOUTH AMERICA Brazil CS 33,655 10,100 Brazil NNE 3,950 2,850 Colombia 2,525 2,010 Argentina 2,050 1,860 Peru 1,290 1,360 Ecuador Venezuela 525 1,420 Bolivia Chile Guyana WEST EUROPE EU 28 16,470 19,100 Turkey 2,350 2,475 Switzerland Norway 135 Iceland 17 EAST EUROPE Russia 4,675 6,110 Ukraine 1,740 1,955 Belarus Serbia & Montenegro Moldova Oth CIS Kazakhstan Azerbaijan Kyrgyzstan Macedonia Production Consumption
19 AFRICA South Africa 2,410 2,010 Sudan 1,000 1,660 Swaziland Kenya Zimbabwe Ethiopia Mozambique Zambia Other Africa 452 1,890 Mauritius MIDDLE EAST Egypt 2,150 3,420 Iran 1,185 2,800 Syria Saudi Arabia 1,250 Iraq 880 Yemen 695 Gulf (incl Dubai) 600 Israel 570 Jordan 295 Lebanon 195 ASIA India 26,880 25,915 China 12,905 16,500 Thailand 11,665 3,320 Pakistan 5,915 4,900 Indonesia 2,690 6,450 Philippines 2,685 2,420 Malaysia 1,720 1,720 Vietnam 1,700 1,700 Japan 700 2,270 Other Asia 523 1,159 OCEANIA Australia 4, Fiji New Zealand 232 World Sugar Production and Consumption 2014/15
20
21
22
Table 5 Production, trade and supply of hard coal Thousand metric tons and kilograms per capita
 Table Notes Production includes production from other sources as defined in the previous table. Data for China include brown coal. Please refer to the Definitions Section on pages ix to xv for the appropriate
Summary of debt securities outstanding
 Summary of debt securities outstanding All countries........................ 22,695 15,852 6,665 3,427 1,762 Developed countries........................ 16,504 13,087 5,869 2,716 701 Austria 510 173 44
Imports of seed for sowing by country Calendar year 2011 Source: ISF compilation based on official statistics and international seed trade reports
 USA 157,432 15,562 464 173,458 523 318 67 908 Germany 195,159 5,913 520 201,592 595 97 22 714 France 125,701 4,389 277 130,367 522 150 11 683 Netherlands 140,899 12,253 796 153,948 250 330 48 628 Italy
Table 5 Production, trade and supply of hard coal Thousand metric tons and kilograms per capita
 Table Notes Production includes production from other sources as defined in the previous table. Data for China include brown coal. Please refer to the Definitions Section on pages ix to xv for the appropriate
( ) Page: 1/90
 Page: 1/90") 5 February 2016 (16-0803) Page: 1/90 Committee on Agriculture MEMBERS' PARTICIPATION IN THE NORMAL GROWTH OF WORLD TRADE IN AGRICULTURAL PRODUCTS - ARTICLE 18.5 OF THE AGREEMENT ON AGRICULTURE NOTE BY
5 February 2016 (16-0803) Page: 1/90 Committee on Agriculture MEMBERS' PARTICIPATION IN THE NORMAL GROWTH OF WORLD TRADE IN AGRICULTURAL PRODUCTS - ARTICLE 18.5 OF THE AGREEMENT ON AGRICULTURE NOTE BY
Table 13 Production, trade and supply of conventional crude oil Thousand metric tons; kilograms per capita; reserves production ratio (R/P) in years
 in years") , trade and supply of conventional crude oil Thousand metric tons; kilograms per capita; reserves production ratio (R/P) in years Table Notes The Reserves / ratio refers to crude oil and natural gas liquids.
, trade and supply of conventional crude oil Thousand metric tons; kilograms per capita; reserves production ratio (R/P) in years Table Notes The Reserves / ratio refers to crude oil and natural gas liquids.
Table 13 Production, trade and supply of conventional crude oil Thousand metric tons; kilograms per capita; reserves production ratio (R/P) in years
 in years") Million metric tons Million metric tons Table 13, trade and supply of conventional crude oil Thousand metric tons; kilograms per capita; reserves production ratio (R/P) in years Table Notes The Reserves
Million metric tons Million metric tons Table 13, trade and supply of conventional crude oil Thousand metric tons; kilograms per capita; reserves production ratio (R/P) in years Table Notes The Reserves
9.01 ICT use for business-to-business transactions
 9.01 ICT use for business-to-business transactions To what extent do businesses in your country use ICTs for communicating and carrying out transactions with other businesses? [1 = not at all; 7 = extensively]
Table 13 Production, trade and supply of conventional crude oil Thousand metric tons; kilograms per capita; reserves production ratio (R/P) in years
 in years") Table 13, trade and supply of conventional crude oil Thousand metric tons; kilograms per capita; reserves production ratio (R/P) in years Table Notes The Reserves / ratio refers to crude oil and natural
Table 13, trade and supply of conventional crude oil Thousand metric tons; kilograms per capita; reserves production ratio (R/P) in years Table Notes The Reserves / ratio refers to crude oil and natural
67 th edition. Renewable energy. Appendices. 44 Other renewables consumption 45 Biofuels production
 Renewable energy 44 Other renewables consumption 45 Biofuels production Appendices A1 Solar Generation A2 Wind Generation A3 Geothermal, biomass and other Generation A4 Geothermal Cumulative installed
Grain: World Markets and Trade
 United States Department of Agriculture Foreign Agricultural Service Circular Series FG 6-2 June 22 Grain: World Markets and Trade Corn Competition Continues to Contract 2/1 21/2 22/3 U.S. S. America China
Table 23 Production of minor oil products from refineries - by type Thousand metric tons
 Table 23 Production of minor oil from refineries - by type Table Notes Data refer to production from refineries of refinery, ethane, naphtha, lubricants, bitumen, paraffin, petroleum, white spirit, and
19,000 38,500. Mean Crop. 5, ,827 Max , ,869 Last Year 6, ,
 YTD Inventory / Shipment Report In Shell Basis Crop: 2017 Monthly Market Prices FCA Hamburg Iranian Dried In Shell 28/30 Fandoghi Pistachios 10th Marketing Month YTD Carry in from previous year 3,000 Total
35,000 52,000 87,000 1,600 8, ,400 76,600. Mean Crop. Monthly YTD Min ,671 8,211 Max. 2017
 YTD Inventory / Shipment Report In Shell Basis Crop: 2018 Monthly Market Prices FCA Hamburg Iranian Dried In Shell 28/30 Fandoghi Pistachios Total Consumption Ending Inventory 2nd Marketing Month YTD Carry
LPI ranking and scores, 2014
 ing and scores, 2014 Germany 1 4.12 100.0 Netherlands 2 4.05 97.6 Belgium 3 4.04 97.5 United Kingdom 4 4.01 96.6 Singapore 5 4.00 96.2 Sweden 6 3.96 94.9 Norway 7 3.96 94.8 Luxembourg 8 3.95 94.4 United
Global Competitiveness Index Rankings
 APPENDIX B Global Competitiveness Index 2017 2018 Rankings The following pages report the GCI 2017 2018 rankings for the three subindexes (Table 1) and their corresponding pillars (Tables 2 4). Detailed
BP Statistical Review of World Energy June 2017
 BP Statistical Review of World Energy June 217 Primary energy 8 Consumption 8 Consumption by fuel 9 66 th edition Primary energy Consumption* Growth rate per annum Million tonnes oil equivalent 26 27 28
Primary energy. 8 Consumption 9 Consumption by fuel. 67 th edition
 Primary energy 8 Consumption 9 Consumption by fuel 67 th edition Primary energy Consumption* Growth rate per annum Million tonnes oil equivalent 27 28 29 2 211 212 213 214 215 216 217 217 26-16 Share 217
Production of minor oil products from refineries - by type Thousand metric tons
 Production of minor oil from refineries - by type Table 23 Table Notes Data refer to production from refineries of refinery, ethane, naphtha, lubricants, bitumen, paraffin, petroleum, white spirit, and
2.01 Availability of latest technologies
 2.01 Availability of latest technologies To what extent are the latest technologies available in your country? [1 = not available; 7 = widely available] 2010 2011 weighted average RANK COUNTRY/ECONOMY
5.01 Secondary education enrollment rate
 5.01 Secondary education enrollment rate Gross secondary education enrollment rate 2011 or most recent year available RANK COUNTRY/ECONOMY Value 1 Australia 8...131.3 2 Spain...128.5 3 Seychelles...123.9
2014/ /2015 Ghana / /2015 Syrian Arab Republic / /2015
 Exhibit C: international cotton trade data Source: International Cotton Advisory Committee, ICAC World Cotton Database, available at www.icac.org, last checked 1 April 2016. International Cotton Advisory
Grain: World Markets and Trade
 United States Department of Agriculture Foreign Agricultural Service Circular Series FG 1-6 January 26 Grain: World Markets and Trade Larger Harvests Boost Australian Grain Exports MMT 4 Total Grain Production
Table 16 Refinery distillation capacity, throughput and output Thousand metric tons
 Million metric tons Table 16 Refinery distillation capacity, throughput and output Table Notes Output is equal to the sum of production from refineries for aviation gasoline, bitumen, gas/diesel oil, ethane,
KINGDOM OF CAMBODIA NATION RELIGION KING 3
 KINGDOM OF CAMBODIA NATION RELIGION KING 3 TOURISM STATISTICS REPORT March 2015 MINISTRY OF TOURISM Statistics and Tourism Information Department No. A3, Street 169, Sangkat Veal Vong, Khan 7 Makara, Phnom
KINGDOM OF CAMBODIA NATION RELIGION KING 3
 KINGDOM OF CAMBODIA NATION RELIGION KING 3 TOURISM STATISTICS REPORT December 2015 MINISTRY OF TOURISM Statistics and Tourism Information Department No. A3, Street 169, Sangkat Veal Vong, Khan 7 Makara,
KINGDOM OF CAMBODIA NATION RELIGION KING 3
 KINGDOM OF CAMBODIA NATION RELIGION KING 3 TOURISM STATISTICS REPORT March 2018 MINISTRY OF TOURISM Statistics and Tourism Information Department No. A3, Street 169, Sangkat Veal Vong, Khan 7 Makara, Phnom
KINGDOM OF CAMBODIA NATION RELIGION KING 3
 KINGDOM OF CAMBODIA NATION RELIGION KING 3 TOURISM STATISTICS REPORT February 2017 MINISTRY OF TOURISM Statistics and Tourism Information Department No. A3, Street 169, Sangkat Veal Vong, Khan 7 Makara,
KINGDOM OF CAMBODIA NATION RELIGION KING 3
 KINGDOM OF CAMBODIA NATION RELIGION KING 3 TOURISM STATISTICS REPORT May 2017 MINISTRY OF TOURISM Statistics and Tourism Information Department No. A3, Street 169, Sangkat Veal Vong, Khan 7 Makara, Phnom
KINGDOM OF CAMBODIA NATION RELIGION KING 3
 KINGDOM OF CAMBODIA NATION RELIGION KING 3 TOURISM STATISTICS REPORT October 2017 MINISTRY OF TOURISM Statistics and Tourism Information Department No. A3, Street 169, Sangkat Veal Vong, Khan 7 Makara,
Section III Macroeconomic environment
 Data Tables Section III Macroeconomic environment 2.2: Data Tables Section III: Macroeconomic environment 422 3.01 Government budget balance General government budget balance as a percentage of GDP 2010
KINGDOM OF CAMBODIA NATION RELIGION KING 3
 KINGDOM OF CAMBODIA NATION RELIGION KING 3 TOURISM STATISTICS REPORT September 2017 MINISTRY OF TOURISM Statistics and Tourism Information Department No. A3, Street 169, Sangkat Veal Vong, Khan 7 Makara,
EU-25 Soybean Crush Forecast to Decline in 2005/06
 United States Department of Agriculture Foreign Agricultural Service Circular Series FOP 3-06 March 2006 EU-25 Soybean Crush Forecast to Decline in 2005/06 EU-25 Soybean Crush 20 19 18 17 Million tons
Table 16 Refinery distillation capacity, throughput and output Thousand metric tons
 Table 16 Refinery distillation capacity, throughput and output Table Notes Output is equal to the sum of production from refineries for aviation gasoline, bitumen, gas/diesel oil, ethane, feedstocks, gasoline-type
International Sugar Organization WORLD SUGAR BALANCES 2002/ /16
 International Sugar Organization WORLD SUGAR BALANCES 2002/2003-2015/16 FEBRUARY 2016 WORLD SUGAR BALANCES (October/September) in thousand tonnes, tel quel Production 166,833 171,180 171,386 172,029 164,629
Fiche 1 Quelques données de la Banque Mondiale
 Fiche 1 Quelques données de la Banque Mondiale 274 WORLD DEVELOPMENT REPORT 2000 2001 Table 1. Size of the economy Surface Population area density Gross national product (GNP) GNP per capita GNP measured
CSM-K. high capacity clean steam generator
 CSM-K high capacity clean steam generator High capacity clean steam generator Spirax Sarco, the world s leading steam system specialist, has combined modern technology with package design expertise to
I. World trade in Overview
 I. World trade in - Overview Table I.1 Growth in the volume of world merchandise exports and production, 2-5 (Annual percentage change) 2-5 23 24 World merchandise exports 4.5 5. 9.5 6. Agricultural products
Citrus Fruit - Fresh and Processed Statistical Bulletin 2016
 CITRUS FRUIT FRESH AND PROCESSED STATISTICAL BULLETIN 2016 Citrus Fruit - Fresh and Processed Statistical Bulletin 2016 Market and Policy Analysis of Raw Materials, Horticulture and Tropical (RAMHOT)
Grain: World Markets and Trade
 Department of Agriculture Foreign Agricultural Service Circular Series FG 11-6 November 6 Grain: World Markets and Trade Tightening World Grain Supplies Push Prices to Decade-High Levels Global Grain Stocks
KINGDOM OF CAMBODIA NATION RELIGION KING 3
 KINGDOM OF CAMBODIA NATION RELIGION KING 3 TOURISM STATISTICS REPORT October 2018 MINISTRY OF TOURISM Statistics and Tourism Information Department No. A3, Street 169, Sangkat Veal Vong, Khan 7 Makara,
KINGDOM OF CAMBODIA NATION RELIGION KING 3
 KINGDOM OF CAMBODIA NATION RELIGION KING 3 TOURISM STATISTICS REPORT September 2018 MINISTRY OF TOURISM Statistics and Tourism Information Department No. A3, Street 169, Sangkat Veal Vong, Khan 7 Makara,
Grain: World Markets and Trade
 United States Department of Agriculture Foreign Agricultural Service Circular Series FG 8-3 August 23 Grain: World Markets and Trade The Heat is On: Drought Shifts EU Feeding and Exports MMT 2 15 1 5-5
Grain: World Markets and Trade
 United States Department of Agriculture Foreign Agricultural Service Circular Series FG 4-3 April 23 Grain: World Markets and Trade New Suppliers Displace EU in Shrinking World Flour Trade 12 1 MMT 8 6
GLOBAL ECONOMIC PROSPECTS January Statistical Annex
 1 TABLE A.1 GDP Growth (Constant 2010 U.S. Dollars) Annual estimates and forecasts a Quarterly growth b 2013 2014 00-10 c 2011 2012 2013 2014e 2015f 2016f 2017f Q1 Q2 Q3 Q4 Q1 Q2 Q3 World 2.8 3.1 2.4 2.5
Appendix 2 Global Economic Indicators
 Appendix 2 Global Economic Indicators 151 G L O B A L E C O N O M I C P R O S P E C T S Table A2.1 Growth of real GDP, 1966 28 (GDP in 1987 prices and exchange rates average annual percentage growth) 1998
Grain: World Markets and Trade
 United States Department of Agriculture Foreign Agricultural Service Circular Series FG 9-4 September 24 Grain: World Markets and Trade China To Be Net Grain Importer, As Supplies Continue To Fall Million
Table 19 Production, trade and supply of other kerosene Thousand metric tons and kilograms per capita
 Table Notes Production includes output from refineries and plants. For China, data include kerosene-type jet fuel. Please refer to the Definitions Section on pages ix to xv for the appropriate product
Grain: World Markets and Trade
 Department of Agriculture Foreign Agricultural Service Circular Series FG 2-1 February 21 Grain: World Markets and Trade Barley: A Decade of Change & Export Redistribution 1999/ 29/1 1. MMT Exports 1 MMT
Selected Energy Indicators for 2004
 E E G Y D C A T O S Selected Energy ndicators for 2004 egion/ Popu- GDP GDP Energy et TPES Elec. CO 2 Country lation (PPP) Prod. mports Cons. (a) Emissions (b) (million) (billion (billion (Mtoe) (Mtoe)
Cotton This Month. Major Changes in Supply and Demand Estimates and Projections
 1629 K Street NW, Suite 702 Washington, DC 20006, USA Cotton This Month February 1, 2018 Major Changes in Supply and Demand Estimates and Projections India Mexico Pakistan United States 2017/18 production
EU Dairy Exports to Third countries
 Milk Market Observatory TRA.EU.Extr Latest update : 12.6.218 Source : Eurostat (COMEXT) EU Dairy Exports to Third countries (January-April) 16 14 12 1 8 6 4 2 BUTTER exports 1 Tonnes 162 135 137 12 94
Cotton This Month. Major Changes in Supply and Demand Estimates and Projections
 1629 K Street NW, Suite 702 Washington, DC 20006, USA Cotton This Month March 1, 2018 Major Changes in Supply and Demand Estimates and Projections Brazil China Turkey United States 2017/18: production
U.S. Soybean Export Forecast Declines This Month by 1.4 MMT South American Export Forecast Increases
 United States Department of Agriculture Foreign Agricultural Service Circular Series FOP 12-05 December 2005 U.S. Soybean Export Forecast Declines This Month by 1.4 MMT South American Export Forecast Increases
Grain: World Markets and Trade
 Department of Agriculture Foreign Agricultural Service Circular Series FG 12-1 Dec 21 Grain: World Markets and Trade Abundant Global Rice Supplies Contrast With a Tight Wheat Supply Situation Milled Rice
Charging and testing unit FPU for Bladder, Piston and Diaphragm Accumulators
 Charging and testing unit FPU for Bladder, Piston and Diaphragm Accumulators 1. DESCRIPTION 1.1. FUNCTION The HYDAC charging and testing unit FPU is used to charge accumulators with nitrogen or to check
World Air Conditioner Demand by Region
 World Air Conditioner Demand by Region April 2015 The Japan Refrigeration and Air Conditioning Industry Association 1 World Air Conditioner Demand by Region April 2015 The Japan Refrigeration and Air Conditioning
Grain: World Markets and Trade
 Department of Agriculture Foreign Agricultural Service Circular Series FG 9-5 September Grain: World Markets and Trade Rice: Shake-up in Medium Grain Market Share MMT 2 1.8 1.6 1.4 1.2 1.8.6.4.2 TMT 3
C H AP TE R 1 G LO BAL EC O NO MIC P ROS P EC TS J U NE 2017
 4 C H AP TE R 1 G LO BAL EC O NO MIC P ROS P EC TS J U NE 2017 TABLE 1.1 Real GDP 1 (percent change from previous year) 2014 2015 2016 2017 2018 2019 2016 2017 2018 2019 Percentage point differences Estimates
Universal Charging and Testing Unit FPU-1 for Bladder, Piston and Diaphragm Accumulators
 Universal Charging and Testing Unit FPU-1 for Bladder, Piston and Diaphragm Accumulators 1. DESCRIPTION 1.1. FUNCTION The HYDAC charging and testing unit FPU-1 is used to charge accumulators with nitrogen
Grain: World Markets and Trade
 Department of Agriculture Foreign Agricultural Service Circular Series FG 1-7 October 27 Grain: World Markets and Trade Australian Wheat Exports Plummet MMT 18 16 14 12 1 8 6 4 2 Wheat Barley 24/2 2/26
Coal. 36 Reserves and prices 38 Production and consumption. 67 th edition
 Coal 36 Reserves and prices 38 Production and consumption 67 th edition Total proved reserves at end 217 Million tonnes Anthracite and bituminous Subbituminous and lignite US 228 3116 25916 24.2% 357 Canada
Table 19 Production, trade and supply of other kerosene Thousand metric tons and kilograms per capita
 Table 19 Production, trade and supply of other kerosene Table Notes Production includes output from refineries and plants. For China, data up to 2013 include kerosenetype jet fuel. Please refer to the
Grain: World Markets and Trade
 Department of Agriculture Foreign Agricultural Service Circular Series FG 11-1 Nov 21 Grain: World Markets and Trade Global Wheat and Coarse Grain Ending Stocks Drop MMT 8 6 4 2-2 -4-6 -8 Year-to-Year
FEDERAL RESERVE statistical release
 FEDERAL RESERVE statistical release FOR IMMEDIATE RELEASE MARCH 16, 1992 E.U C1Z1, GEOGRAPHICAL r DISTRIBUTION n OF e ASSETS AND^LIABILITIES (IN MILLIONS OF DOLLARS) ASSETS COUNTRY OF CUSTOMER 12/31/90
Grain: World Markets and Trade
 Department of Agriculture Foreign Agricultural Service Circular Series FG 1-1 January 21 Grain: World Markets and Trade U.S. Wheat Exports Fall Despite Middle East Import Boom MMT 3 2 Import forecast,
The Great Transition: Shifting from Fossil Fuels to Solar and Wind Energy Supporting Data - Hydropower
 The Great Transition: Shifting from Fossil Fuels to Solar and Wind Energy Supporting Data - Hydropower World Installed Hydroelectric Generating Capacity, 1980-2013 GRAPH: World Installed Hydroelectric
Euromoney Country Risk Q RESULTS
 1 Euromoney Country Risk Q3 218 RESULTS 2 TABLE OF CONTENTS 1. Introduction (Scoring) 2. Q/Q update 3. Y/Y update 4. Contacts 3 SCORING Euromoney Country Risk is a platform designed to capture and aggregate
Natural gas. 26 Reserves 28 Production and consumption 33 Prices 34 Trade movements. 67 th edition
 Natural gas 26 Reserves 28 Production and consumption 33 Prices 34 Trade movements 67 th edition Natural gas Total proved reserves At end 1997 At end 2007 At end 2016 At end Trillion Trillion Trillion
Grain: World Markets and Trade
 United States Department of Agriculture Foreign Agricultural Service Circular Series FG 2-4 February 24 Grain: World Markets and Trade Rice: Thailand Gets Larger Slice of Smaller Pie 27.3 MMT 24.7 MMT
Microsoft Social Engagement Translation Guide Last Updated: October 2017
 Microsoft Social Engagement Translation Guide Last Updated: October 2017 Microsoft Social Engagement is translated and supported by Microsoft and made generally available in the countries/regions and languages
GCC EU BILATERAL TRADE AND TRADE WITH THE WORLD
 GCC EU BILATERAL TRADE AND TRADE WITH THE WORLD TRADE G.2 TOTAL MERCHANDISE TRADE, 2008-2012 1. Evolution of the EU's Trade Balance with Gcc 2. Evolution of the GCC's Trade Balance GEOGRAPHIC BREAKDOWN
AZERBAIJAN GDP BY SECTOR ,2% 40,1% TRADE IN GOODS. Billions of euros. Imports Exports Balance 35,0 15,0 10,0 7,3 5,0 0,0 -5,0
 AZERBAIJAN MAIN ECONOMIC INDICATORS Surface Area: 86,6 1000 sq km ** * : IMF (World Economic Outlook) *** : IMF (DoTS & WEO) Population: 9,0 Millions of inhabitants - 2009 (estimates after 2008) * ** :
Universal Charging and Testing Unit FPU-1 for Bladder, Piston and Diaphragm Accumulators
 Universal Charging and Testing Unit FPU-1 for Bladder, Piston and Diaphragm Accumulators 1. Description 1.1. Function The HYDAC charging and testing unit FPU-1 is used to charge accumulators with nitrogen
control & instrumentation solutions The AEL6 series smart electric actuator
 control & instrumentation solutions The AEL6 series smart electric actuator E X P E R T I S E S O L U T I O N S S U S T A I N A B I L I T Y 1 A E L 6 AEL6 series Our newly launched smart electric actuator
Major Changes in Supply and Demand Estimates and Projections
 INTERNATIONAL COTTON ADVISORY COMMITTEE 1629 K Street NW, Suite 702, Washington, DC 20006 USA Telephone (202) 463-6660 Fax (202) 463-6950 email secretariat@icac.org COTTON THIS MONTH February 1, 2016 Major
Summary of Contributions to UN Peacekeeping by Country and Post.
 Summary of Contributions to UN Peacekeeping by Country and Post. Police,UN Military, s and Troops 31/07/2018 1 Country Name POST MALE FEMALE TOTAL Algeria 2 3 4 5 6 7 Argentina Armenia Australia Austria
Grain: World Markets and Trade
 Department of Agriculture Foreign Agricultural Service Circular Series FG 4-7 April 7 Grain: World Markets and Trade MMT 6 World Rye Trade Dwindles EU Rye Intervention Ending Stocks MMT 2. World Trade
Grain: World Markets and Trade
 Department of Agriculture Foreign Agricultural Service Circular Series FG 7-1 July 21 Grain: World Markets and Trade Exporter Wheat Ending Stocks Shrink MMT 8 6 4 2 /1 1/2 2/3 3/4 4/ /6 6/7 7/8 8/9 9/1
Major Changes in Supply and Demand Estimates and Projections
 INTERNATIONAL COTTON ADVISORY COMMITTEE 1629 K Street NW, Suite 702, Washington, DC 20006 USA Telephone (202) 463-6660 Fax (202) 463-6950 email secretariat@icac.org COTTON THIS MONTH April 1, 2016 Major
Production (bbl/day)
") 1 of 5 14/09/2011 22:15 From Wikipedia, the free encyclopedia This is a list of countries by oil production mostly based on CIA World Factbook data. [1] Note that oil production refers to the sum of barrels
1 of 5 14/09/2011 22:15 From Wikipedia, the free encyclopedia This is a list of countries by oil production mostly based on CIA World Factbook data. [1] Note that oil production refers to the sum of barrels
Total fleet. Oil tankers
 184 as at 1 January 2011 (in thousands of dwt) DEVELOPING ECONOMIES OF AFRICA Algeria 809 30 204 66 0 509 Angola 58 10 0 14 0 34 Benin 0 0 0 0 0 0 Cameroon 10 0 0 4 0 6 Cape Verde 22 5 0 12 0 6 Comoros
Grain: World Markets and Trade
 United States Department of Agriculture Foreign Agricultural Service Circular Series FG04-02 April 2002 Grain: World Markets and Trade Indian Wheat & Rice Exports & Stocks Soar Million Metric Tons Exports
Global and Regional Tables
 Global and Regional Tables Freedom of the Press 2006 1 Finland 9 F Iceland 9 F 3 Denmark 10 F Norway 10 F Sweden 10 F 6 Belgium 11 F Luxembourg 11 F Netherlands 11 F Switzerland 11 F 10 Liechtenstein 13
3rd Meter Gauge Group CEO s Conference. Brisbane. 10 May, rd Meter Gauge CEO's Conference in Brisbane - 10th May,
 3rd Meter Gauge Group CEO s Conference Brisbane 10 May, 2004 1 UIC Members UIC Member 163Members 2 UIC Meter Gauge Group UIC Meter Gauge Group was established as a special group for meter gauge railways
up to and including 31 December 2002
 The ISO Survey of ISO 9000 and ISO 14001 Certificates Twelfth cycle : up to and including 31 December T a b l e o f c o n t e n t s The ISO Survey : twelfth cycle () highlights......................................................................
Grain: World Markets and Trade
 Department of Agriculture Foreign Agricultural Service Circular Series FG 7-9 July 29 Grain: World Markets and Trade Argentina s Role Shrinks in the World Wheat Export Market MMT 14 12 Exports Market Share
YOUR PARTNER IN MIXING
 YOUR PARTNER IN MIXING 53 101 60 110 33 29 120 68 99 43 104 11 23 53 14 37 97 23 33 67 21 97 30 17 15 23 67 67 29 14 11 25 24 202 37 26 45 33 43 21 17 12 77 32 23 67 74 47 159 49 37 90 10 46 43 52 17 647
Grain: World Markets and Trade
 United States Department of Agriculture Foreign Agricultural Service Grain: World Markets and Trade Circular Series FG 04-01 April 2001 Argentina Increases Wheat Production, Exports Move into New Markets
Green: 348. Yellow/Orange: Yellow/Orange: Green: 348. Yellow/Orange: Green: 348. Yellow/Orange:137 Bronze: 145
 Afghanistan 348 Albania 186 Algeria 348 Andorra 286 348 137 Bronze: 145 Angola 137 Antigua and Barbuda 314 137 Argentina 279 137 Armenia 286 165 186 Australia 2768 Austria Azerbaijan Warm red 485 282 348
Retail prices (street price), US$/gram
, US$/gram") 3.4 Prices 3.4.1 Opiates: Wholesale, street prices and purity levels Retail prices (street price), US$/gram EUROPE 1990 1991 1992 1993 1994 1995 1996 1997 1998 1999 2000 2001 2002 2003 2004 2005 2006 Austria
3.4 Prices 3.4.1 Opiates: Wholesale, street prices and purity levels Retail prices (street price), US$/gram EUROPE 1990 1991 1992 1993 1994 1995 1996 1997 1998 1999 2000 2001 2002 2003 2004 2005 2006 Austria
Grain: World Markets and Trade
 United States Department of Agriculture Foreign Agricultural Service Circular Series FG12-01 December 2001 Grain: World Markets and Trade EU Changes Impact Global Wheat Markets Million Metric Tons Wheat
Figure Geographic distribution Change in country participation in international nongovernmental organizations (NGOs): 1992 and 2002
: 1992 and 2002") Figure 2.2.3. Geographic distribution Change in country participation in international nongovernmental s (NGOs): 1992 and 2002 This table gives the and (international NGOs of types A to F) for a given
Figure 2.2.3. Geographic distribution Change in country participation in international nongovernmental s (NGOs): 1992 and 2002 This table gives the and (international NGOs of types A to F) for a given
Mondelez International, Inc
 Particulars About Your Organisation 1.1 Name of your organization Mondelez International, Inc 1.2 What is/are the primary activity(ies) or product(s) of your organization? Oil Palm Growers Palm Oil Processors
China s Global Peanut Export Share Declines
 United States Department of Agriculture Foreign Agricultural Service Circular Series FOP 07-13 China s Global Peanut Export Share Declines U.S. 10% Others 19% Argentina 17% U.S. 11% Others 16% Argentina
Grain: World Markets and Trade
 United States Department of Agriculture Foreign Agricultural Service Circular Series FG 3-5 March Grain: World Markets and Trade 8 6 4 2 Argentine Corn Exports to Reach Record World Corn Market Share 1999/
World real merchandise trade grows faster than output
 I. I. world trade developments 8 Merchandise trade and GDP World real merchandise trade grows faster than output In 2006, the volume of world merchandise trade grew by 8 per cent while world gross domestic
Global Dialysis - Cost per Dialysis Session
 Cost per session for dialysis where a cost has been entered for a dialysis centre. All costs have been converted to US Dollars as at 19 May 2006. Note that the costs do not state what is covered by a dialysis
Country Risk Scores Table Results
 s Table - 2014 Results Afghanistan 73 73 53 71 70 49 48 50 59 54 63 75 54 89 4.7 Albania 60 67 59 73 50 32 39 26 35 47 32 43 46 32 8.8 Algeria 79 82 88 67 63 30 39 24 79 81 74 49 51 38 10.0 Andorra 47
Allen-Bradley 1397 Pulse Encoder Interface Card
 Installation Instructions IN Allen-Bradley 1397 Pulse Encoder Interface Card Cat. No. 1397-PE Table of Contents What This Option Provides........................ 1 Where This Option Is Used........................