CAE METHODS ON VIBRATION-BASED HEALTH MONITORING OF POWER TRANSMISSION SYSTEMS
|
|
|
- Curtis Harrington
- 6 years ago
- Views:
Transcription
1 CAE METHODS ON VIBRATION-BASED HEALTH MONITORING OF POWER TRANSMISSION SYSTEMS A Thesis Presented to The Faculty of California Polytechnic State University, San Luis Obispo In Partial Fulfillment Of the Requirements for the Degree Master of Science in Mechanical Engineering By: Brian Fang December 2013
2 ii 2013 Brian Fang ALL RIGHTS RESERVED
3 iii COMMITTEE MEMBERSHIP TITLE: CAE Methods on Vibration-based Health Monitoring of Power Transmission Systems AUTHOR: Brian Fang DATE SUMMITED: December 2013 COMMITTEE CHAIR: Xi Wu, Ph.D. Associate Professor Department of Mechanical Engineering Cal Poly, San Luis Obispo COMMITTEE MEMBER: Jim Meagher, Ph.D. Professor Department of Mechanical Engineering Cal Poly, San Luis Obispo COMMITTEE MEMBER: Hemanth Porumamilla, Ph.D. Assistant Professor Department of Mechanical Engineering Cal Poly, San Luis Obispo
4 iv ABSTRACT CAE Methods on Vibration-based Health Monitoring of Power Transmission Systems Brian Fang This thesis focuses on different methods to analyze power transmission systems with computer software to aid in detection of faulty or damaged systems. It is split into three sections. The first section involves utilizing finite element software to analyze gear stiffness and stresses. A quasi-static and dynamic analysis are done on two sets of fixed axis spur gears and a planetary gear system using ABAQUS to analyze the stress, strain and gear mesh stiffness variation. In the second section, the vibrational patterns produced by a simple bevel gear system are investigated by an experiment and by dynamic modeling in ADAMS. Using a Fast Fourier Transform (FFT) on the dynamic contact forces, a comprehensive frequency-domain analysis will reveal unique vibration spectra at distinct frequencies around the gear mesh frequencies, their super- and subharmonics, and their side-band modulations. ADAMS simulation results are then compared with the experimental results. Constraints, bearing resistant torques, and other key parameters are applied as closely as possible to real operating conditions. The third section looks closely at the dynamic contact forces of a practical two-stage planetary gear. Using the same FFT approach in the second section, a frequency-domain analysis will reveal distinct frequencies around both the first-stage and the second-stage gear mesh frequencies, and their harmonics. In addition, joint time-frequency analysis (JTFA) will be applied to damaged and undamaged planetary gear systems with transient start-up conditions to observe how the frequency contents of the contact force evolve over time. Keywords: vibration health monitoring, multi-body kinematic model, backlash, chipped tooth, bevel gear, planetary gear, joint time-frequency analysis
5 v TABLE OF CONTENTS Page LIST OF TABLES... vii LIST OF FIGURES...viii CHAPTER 1. INTRODUCTION LITERATURE REVIEW GEAR BACKGROUND Contact Ratio Backlash Hertz Contact Stress Equation American Gear Manufacturers Association (AGMA) Stress Equation SolidWorks Modeling FINITE ELEMENT ANALYSIS (FEA) Gear Mesh Stiffness FEA Models Loading and Step Parameters Meshing Results STRESS RESULTS STIFFNESS RESULTS Conclusions Future Work... 43
6 vi 5. BEVEL GEAR MODEL AND EXPERIMENT Experimental Setup ADAMS Modeling GEAR PAIR ONLY FLEXIBLE BODIES AND BEARINGS Results Conclusion Future Work PLANETARY GEAR Model Model Validation Frequency Domain Results and Discussion Joint Time Frequency Analysis (JTFA) Conclusion CONCLUSIONS...97 REFERENCES...99 APPENDICES A. Contact Ratio Matlab Code B. Involute Profile for Spur Gears MatLab Code C. QuasiStatic Finite Element Analysis Tutorial D. Implicit Finite Element Analysis Tutorial E. MSC ADAMS ViewFlex and Bearing Tutorial F. Gearmesh Frequency For Planetary Gears MatLab Code
7 vii LIST OF TABLES 1. Table of Overload Factor, K o Constants for C ma Model parameters for the fixed axis gears Model parameters for the planetary gear system Specifications of the accelerometer used on the gear box assembly Bevel Gear design and simulation parameters Information for the shafts and bearings The Fundamental Gear Mesh Frequency (GMF) comparison at 5 different speeds SER calculated from experimental measurements SER Calculated from ADAMS Simulation results of just two bevel gear SER calculated from ADAMS Simulation results of bevel gear with flexible shafts and bearings Planetary gear design and simulation parameters Simple gear pair design and simulation parameters Speed of each component and the related values...81
8 viii LIST OF FIGURES 1. Tooth Contact diagram Plot of a gear tooth involute profile generated by the Matlab code in appendix B Convergence study of the fixed axis gear set with quadratic quadrilateral plane stress element Convergence study of the fixed axis gear set with quadratic triangular plane stress elements Fixed Axis Gear Set Meshing Teeth with Biased Color Scale (Scale factor = 1.0) Zoomed In View of Fixed Axis Gear Set Tooth Contact (Scale factor = 1.0) Planetary Gear Set Meshing Teeth with Biased Color Scale (Scale factor = 1.0) Root Stresses for tooth 2-12 on pinion of fixed axis gear set Root Stresses for tooth on pinion of fixed axis gear set Plot of gear mesh stiffness for an external to external gear mesh Plot of gear mesh stiffness for an internal to external gear mesh Photo of Experimental Setup Overall schematic of the gearbox Gearbox, shaft, and motor used in the experimental setup The MITRPAK HAR-102-C1 gearbox used to perform the experiment The shafts, gears, and bearings housed in the gearbox Dimensions of the gear box assembly Accelerometer locations SolidWorks models of bevel gears. (a). Perfect gear system, (b). Damaged gear system ADAMS flexible body and bearing model Gearing system response from accelerometer 2 at different speeds Gearing system response from accelerometer 4 at different speeds...58
9 ix 23. ADAMS simulation result comparison at input speed of 15 Hz for Gears only ADAMS simulation result comparison at input speed of 30 Hz for Gears only ADAMS simulation result comparison at input speed of 15 Hz for flexible shaft model ADAMS simulation result comparison at input speed of 30 Hz for flexible shaft model Plot of Contact force on first bearing on 12mm rigid shaft for the exponential input speed Plot of Contact force on first bearing on 12mm flexible shaft for the constant input speed Plot of Contact force on first bearing on 12mm flexible shaft for the exponential input speed Von Mises Stresses in flexible shaft for a constant power input A two-stage planetary gear CAD model CAD model of a damaged planetary gear Simulation results for free vibration comparison with reference [16] Fig.8 (a,c) Simulation results for constant torque comparison with reference [16] Fig. 9 (a,b) FFT of contact force on the first stage for a single stage planetary gear model in ADAMS FFT plots from the contact forces between the sun and first- stage planet gear for a perfect rigid model at two different speeds with backlash only FFT plots from the contact forces between the sun and first stage planet gear for a rigid model with a large defect tooth on sun gear and backlash FFT plots from the contact forces between the sun and first stage-planet gear for a rigid model with backlash and every third tooth damaged on the sun FFT plots from the contact forces between the first-stage planet and ring gear for a rigid model with backlash and every third tooth damaged on the sun...84
10 x 40. FFT plots from the contact forces between the sun and first-stage planet gear for a rigid model with backlash and every third tooth damaged on both the sun and first-stage planets FFT plots from the contact forces between the sun and first- stage planet gear for a perfect flexible model at two different speeds with backlash only FFT plots from the contact forces between the second stage planet and ring gear for a perfect flexible model at two different speeds with backlash only FFT plots from the contact forces between the sun and first-stage planet gear for a flexible model with backlash and every third tooth damaged on both the sun and first-stage planets FFT plots from the contact forces between the second stage planet and ring gear for a flexible model with backlash and every third tooth damaged on the second-stage planets JTFA plots for perfect rigid planetary gear model with exponential step torque applied on sun JTFA plots for a rigid planetary gear model with every third tooth damaged on sun and with exponential step torque applied on the sun JTFA plots for perfect planetary gear model with a flexible shaft and exponential step torque applied on sun JTFA plots for a planetary gear model with every third tooth damaged on sun, flexible shaft and with exponential step torque applied on the sun..94
11 1 1. INTRODUCTION Gears are commonly used in power transmission system. These gears take heavy loads which can lead to gear failure. The importance of reliable power transmission systems increases as technology improves. Failure of these systems can lead to catastrophic problems. For example, planetary gear transmissions are used in helicopters. One incident, the Europter AS332-L2 Super Puma using a planetary transmission failed and killed the entire crew. Predicting how gears will fail and how damaged gears affect a system is very important. Analysis of gear systems is a non-trivial matter. Due to the nonlinearity induced by the combination of backlash and different teeth damage at different locations. Unfortunately, since the dynamic behavior of the system is highly dependent on the changing point-to-point contact forces between gear pairs, theoretical models are almost impossible to accurately simulate the complicated nonlinear dynamics of the damaged gears. Currently there is no standard device for real-time display of a transmission system. This makes it hard to find out when a system is about to malfunction or fail. Spectral analysis can be performed with audio recordings on the transmissions systems to try to find out the frequencies of the transmission. If this can be used as a monitoring system, the next thing to do would be to find out the
12 2 frequencies that start to happen when there are damages to the system or when the system is about to fail. This would allow for repair of the transmission system when it is necessary rather than replacing the transmission after a certain time period even if it is still fine. In this thesis, there are three parts. Each section analyzes a gear system using computer software and is analyzed in different ways. In the first section, Abaqus is used to analyze the stress, strain and gear mesh stiffness variation for two sets of fixed axis spur gears and a planetary gear system. A quasi-static and dynamic analysis was done each gear set. A quasistatic analysis was done on a set of fixed axis spur gears and a planetary gear system using ABAQUS to analyze the stress and stiffness in gears when they mesh for an undamaged and damaged gear set. An implicit dynamic analysis was done on two sets of fixed axis spur gears and the same planetary gear system to analyze the root stresses on the tooth as they engage with one another. The stress results were compared with the American Gear Manufacturing Association (AGMA) stress equations to verify the validity of the models. In the second section, ADAMS will be used to do dynamic modeling of a bevel gear pair. In the model, the flexibility of the shaft and bearings are taken into account to closely model that of the experiment. Dynamic signal analyzer
13 3 computer software and hardware from LDS Dactron are used to collect data. Accelerometers are installed in several different locations of a practical gearbox to capture the vibration signatures. ADAMS simulation results are compared with the experimental results for the damaged gearing system. The Sideband Energy Ratio (SER) is also applied to the results from the simulation and the experiment to observe it sensitivity as health-monitoring index of a damaged gearing system. In the third section, a practical two-stage planetary gear with different kinds of teeth damages will be analyzed in ADAMS using a frequency-domain analysis. The system is operated at different speeds to try to find patterns that correlate with the state of the system. These vibration signatures are analyzed to determine their causes such as influence from the two gear mesh frequencies and hunting tooth frequencies. Joint time-frequency analysis (JTFA) will be applied to the twostage damaged planetary gear analysis to demonstrate how the frequency contents of the contact force evolve over time as the system accelerates.
14 4 2. LITERATURE REVIEW Gears are common in power transmission systems. The ability to detect gear system faults without disassembling it is highly desirable. There have been various methods developed using averaged vibration signal, spectrum, amplitude and phase modulation [1]. They may either use an acoustic signal or collect vibration data from a component of the system. Vibration data is usually preferred as it is somewhat easier to predict the dynamic behavior of a system directly; it offers a more localized description compared to acoustic signals. One disadvantage is that sensor response depends on their orientation, somewhat limiting where they may be placed in the system. If a system was improperly manufactured or if faults grow through normal use, we can expect deviations in the vibrations as the damaged gears interact. Planetary gear systems provide significant advantages over traditional parallel axis and/or right angle gear systems. Since the dynamical loads transmitted are shared between several planets, torque capability is significantly increased. The distinctive combination of both compactness and magnificent power transmission efficiencies makes the planetary gear systems as excellent candidate for helicopters, wind turbines and spacecraft.
15 5 Reference [8] by Özgüven and Houser in 1988 and [9] by Parey and Tandon in 2003 are two important review papers which discussed the numerical modeling and dynamical analysis of spur-gear systems. The majority of the models in referenced [8] are described by a limited number of degrees of freedom without teeth defects. Teeth meshing stiffness was characterized as either an average or piecewise linear variation instead of the highly nonlinear Hertzian contact. Parey and Tandon [9] did review some papers which included spur-gear defects. Furthermore, Parey etc. [10] in 2006 developed a six DOF nonlinear model for a pair of spur gears on two shafts and calculated the Hertzian stiffness for the tooth surface contact. In order to seek practical applications in industry, the authors implemented the empirical mode decomposition (EMD) method to realistically simulate the different defect widths. However, all of the above valuable research is based on fix-axis gears. Professor Parker ([11-15]) and his team have done a lot of valuable research about dynamic behaviors of planetary gears by deriving and building sophisticated mathematical models. Lin and Parker [11] analytically investigate the parametric instability of planetary gears induced by gear mesh stiffness variation. The authors use rectangular waveforms with different contact ratios and mesh phasing to simulate the gear mesh stiffness existing between sun-planet and planet-ring
16 6 gear mating pairs. Instability boundaries are directly associated with meshing parameters in the vibration modes. The authors also demonstrate some numerical simulation results about the teeth separation caused by parametric instability and strong impact in the system response. Lin and Parker [12] derive a theoretical model and carefully identify the important characteristics of the natural frequencies and vibration modes for planetary gears. The model uses three planar degrees of freedom for each component of the planetary gears and takes gyroscopic effects and time-varying gear mesh stiffnesses into consideration. The majority of current papers about planetary gears does not include the interactive effects of backlash and gear teeth damage. The main obstacles are: the dynamic behaviors of the defective teeth are difficult to describe using theoretical models, nonlinear dynamic behaviors of the planetary gears induced by the interaction of backlash and gear teeth damages are not theoretically known, and it is very difficult to take the locations and sizes of teeth cracks into consideration in math models. Teeth cracks/flaws due to fatigue and manufacture errors are potential sources of catastrophic failure in military, aerospace, and power-generation industries. Though considerable efforts have been expended to develop reliable strategies for non-destructive detecting cracks in gear systems, these methods have generally fallen short of the required performance. Although a simplified model for even a
17 7 pair of gears involves sophisticated mathematics, it cannot accurately simulate the gear train s practical dynamic behavior even for an ideal system by simply assuming time-varying gear mesh stiffness as square waveforms. As such, a robust technological approach that can measure the current state-of-health of a gearbox would find widespread use across many industries and diverse applications. Starting from 2008, the authors and their team have applied CAD and ADAMS software to realistically simulate the dynamics behavior of gears. The impact forces between the mating pairs are very sensitive to the geometric profile of gear tooth and the gear backlash which must be carefully designed. Kong and Meagher etc. [2] model the nonlinear contact mechanics of a large gearbox without backlash. Since the authors accurately design the gear profiles using CAD software and carefully choose simulation parameters in ADAMS, some interesting results of the dynamic forces are observed. Sommer and Meagher etc. [3] illustrate the transient and steady state dynamic loading on teeth within a two stage gear transmission arising from backlash and geometric manufacturing errors by utilizing a non-linear multi-body dynamics software model. Vibration and impact force distinctions between backlash and combinations of transmission errors are demonstrated under different initial velocities and load conditions. The backlash and manufacturing errors in the first stage of the gear train are distinct from those of the second stage. By analyzing the signal at a location between the two stages, the mutually affected impact
18 8 forces are observed from different gear pairs, a phenomenon not observed from single pair of gears. This paper also shows some interesting results about sideband modulations as well as harmonics of the gear mesh frequency. Numerous techniques have been developed to interpret the vibration data. Some have used a time-frequency approach to analyze data [4]. With this algorithm, a minute deviation can be detected at a given time, giving the sensitivity to detect a single broken tooth. Another approach is through wavelet transformation of the vibration data. The algorithm can use a varied windowing function to provide high resolution information in a computationally efficient way [1]. These and other methods can provide very detailed information, but require sophisticated special signal analysis. The Sideband Energy Ratio (SER), a relatively new method, is currently applied to health monitoring of the wind-turbine gearboxes ([5], [6]). This requires only simple analysis, relying mostly on FFT. In essence, a strong frequency response at the sidebands of the gear meshing frequency is indicative of a damaged gear system. An analogy to AM radio signals is a useful way to describe these sidebands. The vibration that occurs at the gear mesh frequency can be thought of as a carrier wave, ω c, which has varied amplitude as seen in equation 2.1.
19 9 [ ] (2.1) In a healthy gear system, the amplitude A(t) should be constant, but in a damaged gear system, it can expected that a periodic fluctuation in the amplitude caused when damaged teeth mesh is added to a constant base value. This is modeled in equation 2.2. This modulation wave, ω m, is what carries the information (audio in the radio analogy) on the carrier wave. [ ] (2.2) When equations one and two are combined, the result can be shown to be equivalent to three sinusoids of different frequencies as seen in equation 2.3. Note that one remains at the original frequency (the carrier wave freque ncy in our analogy) and that the other two have frequencies equal to the sum and difference of the modulation and carrier wave frequency. These two signals at different frequencies are the side bands. [ ][ ] ( ) ( ) (2.3)
20 10 It should be noted that equation 3 models a simple case where the modulation is a constant sinusoid (a constant tone if it were an AM radio signal). The interactions caused by damaged gear teeth are often much more complex, leading to the appearance of many more sideband peaks than our example here uses. We therefore hypothesize that more severely damaged gear systems will produce many peaks; furthermore, the amplitudes of the peaks should be greater in more severely damaged gear systems. In the case of a healthy system, there should be few peaks if any. In a healthy gear system, it is natural to expect to see strong responses at the gear mesh frequencies. These are given as the speed of the individual gear times its number of teeth. These vibrations are analogous to the carrier wave. Since this frequency depends directly on the speed of the gears, it will be proportional to the rotary speed of the motor that drives the gear system. For this reason, we will attempt to test our predictions at a number of different speeds. Using the gear ratio, the mesh frequency is obtained in terms of the motor drive speed as seen in equation 2.4. The mesh frequency, f mesh, can vary slightly as teeth are damaged compared to a new gear [3]. (2.4)
21 11 R is the gear ratio ω A is the pinion speed ω B is the gear speed Ω is the input speed N A is number of teeth on pinion N B is number of teeth on gear With the aforementioned concepts, the Sideband Energy ratio was developed as an algorithm to try to quantify the extent of gear damage based on vibrational data. Its calculation and interpretation are somewhat arbitrary. Accelerometers are placed in key locations in a gearbox. High resolution frequency response data is collected. The amplitudes of the first six sidebands on each side of the gear mesh frequency are summed and then divided by the amplitude of the center gear mesh frequency as seen in equation 2.5. A ratio of less than one is believed to generally represent a healthy gear system while higher ratios indicate greater damage. A joint time-frequency response analysis of the fixed-axis gears during start-up illustrates the manner in which contact forces increase during acceleration. Wu,
22 12 Meagher and Sommer [19] investigated a practical differential planetary gear train, which combines two inputs and one output using multi-body dynamics software. The backlash between the sun gear and planet gears are carefully designed and calculated to avoid teeth interference and undercut. Tooth profile errors are introduced for comparison to ideal gears. The nonlinear contact mechanics model of the meshing teeth is built by careful calculation and selection of the contact simulation parameters such as the stiffness, force expo nent, and damping and friction coefficients. Planetary gears with only backlash errors are compared to those containing both backlash and tooth defects under different kinematic and loading conditions. Time domain results will show that the dynamic responses due to the combination of backlash and tooth defects depend on the interaction of many components of the differential planetary system.
23 13 3. GEAR BACKGROUND 3.1 Contact Ratio The contact ratio tells the average number of teeth in mesh when two gears are engaged. A contact ratio of 2 means when the gears are engaged, there is always two teeth from both gears are in contact. With contact ratio of 1.8, it tells a user that 80% of the time the gear pair has two teeth from both gears in contact and 20% of the time only a single tooth from both gears are engaged. Figure 1: Tooth Contact diagram The contact ratio of a gear pair is the ratio between the length of action and the base. When two gears engage, tooth contact starts and stops at point of intersection between the two addendum circles of the pinion and gear with the line of action. In figure 1, it shows the addendum circles of 2 gears and the line of action. Tooth contact starts at point A and ends at point B. The length from point
24 14 A to point B is the length of action, L AB. The base pitch, p B, is the distance between the involute curves of two adjacent teeth. Since the length of the line of action and the base pitch are not easy to measure, equation needs to be broken down into measurable components. The base pitch is simply π multiplied by the module, one over the diametral pitch, and by the cosine of the pressure angle. These two values can be obtained from the specifications of the gear. The length of action can determined by calculating the arc lengths created between the addendum circles, base pitch, center distance and line of action. These relationships are shown in equations and With these two relationships, equation is the final contact ratio equation for a gear mating of two external spur gears where the subscript 1 is the pinion and subscript 2 is the gear. For a gear mating of an internal spur gear and external spur gear, the length of action equation changes to equation and the final contact ratio equation becomes equation where subscript 1 is the external gear and subscript 2 is the internal gear. (3.2.1) (3.2.2) (3.2.3)
25 15 (3.2.4) (3.2.5) (3.2.6) m c is the contact ratio L AB is the length of action p B is the base pitch m is the module or 1/ diametral pitch ϕ is the pressure angle R is the radius of the pitch circle R A is the radius of the addendum circle R b is the radius of the base circle Higher contact ratios are desired for smooth operation as more teeth are engaged at a given time. This reduces stresses in the gear teeth as well as lower sudden impact from teeth engagement. Higher contact ratios also reduce noise as impact
26 16 between gear teeth is not as high as it is in lower contact ratio gear pairs. Typically, contact ratios are above 1.4. Due to inaccuracies like manufacturing errors and mounting errors, gears should not be designed with a contact ratio less than Backlash Backlash is the amount movement a gear pair has when not in operation. There are a few ways backlash can happen. One is when the center distance between the gear pair is further than what it should be. This is known as normal or linear backlash Another way to have backlash is when the gear tooth width is less than what it should be based on an ideal gear. This is known as torsional or angular backlash. Backlash is necessary for a gear pair to operate smoothly as it prevents jamming. Too much backlash can cause a system to produce more noise and lower the life of the gear as impact loads are larger due to the larger gaps between teeth. Too little backlash can cause the system to heat up faster due to friction between teeth. It can also cause jamming as there may not be enough space between gear teeth to ensure smooth rotation.
27 17 For the planetary gears, a torsional backlash was implemented. This was done due to the fact that the ring gear is a set size. With a fixed ring gear size, it does not allow for the system to work with a linear backlash. For all fixed axis gears, a linear backlash was implemented. 3.3 Hertz Contact Stress Equation Hertz theory assumes that the gear can be modeled as two contacting cylinders and that the contact distribution is elliptic. The area of contact is assumed to be a rectangle and can be calculated by multiplying 2b by l. l is the face width of the gears in contact and b is the half width. Equation solves for the half width contact by using the material properties: poison s ratio and Young s modulus, ν and E respectively, to assume it is a flexible body, the pitch diameters of the cylinders, d 1 and d 2, and a force, F [24]. The half width equation can be simplified by using equation 3.3.2, which is the elastic coefficient, which turns into equation The maximum contact pressure, equation 3.3.4, is then used to find the pressure between the two cylinders. Now to change this equation to tooth stress, the force needs to be normal to the gear tooth. Equation shows the relationship between the normal force, F, and the tangential force or transmitted load, F t. The tangential force can be solved for by torque in equation
28 18 Equation is specifically for spur gears. Using equation 3.3.3, p max becomes equation 3.3.7, which is the tooth contact stress. ( ) ( ) (3.3.1) ( ) ( ) (3.3.2) (3.3.3) (3.3.4) (3.3.5) (3.3.6) (3.3.7)
29 American Gear Manufacturers Association (AGMA) Stress Equation The American Gear Manufacturers Association (AGMA) is a trade group for companies in the business of manufacturing gears. They write the standards for gears in the United States. The AGMA stress equation is based off of Hertzian contact theory and included many factors to evaluate stresses for infinite life or 10 7 cycles [24]. All of the factors in the AGMA stress equation are obtained through testing. The full AGMA stress equation is shown in equation 3.4.1[24]. (3.4.1) W t is the tangential transmitted load K o is the overload factor K v is the dynamic factor K s is the size factor F is the face width K m is the load-distribution factor C p is an elastic coefficient, C f is the surface condition factor d P is the pitch diameter of the pinion, I is the geometry factor
30 20 The overload factor, K o, is added on if there are any external forces that act on gear besides the transmitted load. Gears in combustion engines or non-stationary systems would need to use a higher K o. From reference [24], Table 1 shows how K o is determined. Table 1: Table of Overload Factor, K o (Shigley s Mechanical Design [24]) Power source Driven Machine Uniform Moderate shock Heavy shock Uniform Light shock Medium shock The dynamic factor, K v, accounts for dynamic effects. The quality of the gear, Q v, has a significant effect on the value of K v. Q v accounts for transmission error at a steady state speed, which includes inaccuracies in tooth profile, misalignment, and unbalances. Typically commercial gears quality range from 3-7, while precision quality gears range from The closer K v is to 1, the higher the quality and more accurate the gear is. V is the pitch line velocity, or the velocity at that pitch circle. This can be obtained from the angular velocity multiplied by the radius of the pitch circle. ( { ( ) ) (3.4.2)
31 21 The size factor, K s, accounts for non-uniformity in materials due to size. Since standards have not been established, this is commonly left as 1. Typically for gears to have a good load distribution, it would be ideal to have it in the center between the two bearings. Unfortunately, this is not always the case. The load distribution factor, K m, accounts for non-uniform load distribution. Equation solves for K m and includes 5 other factors. If a gear has crowned teeth, C mc is.8, otherwise it is 1. C pf, shown in equation 3.4.4, is a factor based off the ratio between the face width, F, and 10 times the diameter of the gear, d. If this ratio is less than.05,.05 is used for If the ratio between the distance from the gear to the center of the bearings and the center distance between the two bearings is greater than.175, C pm is 1.1, or else it is 1. C ma is a factor based on the type of gearing and can be solved using equation and the constants in table 2. When gearing is adjusted or compatibility is improved by lapping, C e is.8 and 1 for all other cases. (3.4.3)
32 22 (3.4.4) { (3.4.5) Table 2: Constants for C ma (Shigley s Mechanical Design [24]) Condition A B C Open gearing E-05 Commercial, enclosed units E-05 Precision, enclosed units E-05 Extra precision enclosed gear units E-05 The elastic coefficient, C p is the same as in the Hertz contact stress in the previous section. Equation can be used or this value can be found in a materials table. The units of this coefficient are (lbf/in 2 ) or (N/mm 2 ). The surface condition factor, C f, depends on the surface finish and residual effects. Standards have not been established. This factor is left as 1 unless there is pitting damage on the teeth, in which case the factor will greater than 1.
33 23 The pitting-resistance geometry factor, I, is used to allow the stress equations to account for the effect cause by the geometry of the gear teeth. m n is the load sharing ratio and for spur gear, this ratio is 1. m g is the gear ratio of the system. { (3.4.6) 3.5 SolidWorks Modeling All gears modeled in this thesis were done in SolidWorks and then transferred to Abaqus or MSC ADAMS. SolidWorks was used greatly due to its ability to model the involute profile of gear teeth very accurately as well as create complex gear damage such as pitting and root damage. Also by modeling everything in SolidWorks, the models used for Abaqus could also be used for MSC ADAMS.
34 24 Figure 2: Plot of a gear tooth involute profile generated by the Matlab code in appendix B To start, an involute profile of the gear tooth was created using the Matlab code in Appendix B. The code creates a text file that contains the coordinates of each point on the involute profile of the gear tooth. In SolidWorks, units must be carefully checked. If the units from the program differ from the units in SolidWorks, this can cause problems when imported into the other programs. Next, all the significant figures are set to the highest. This allows for the involute profile to be as accurate as possible. Then, using the import curve through XYZ
35 25 values option, SolidWorks will generate a curve from the text file generated by the involute code. When the curve is imported, the sketch is on the front plane. The curve is converted as an entity in the new sketch. This allows the curve to be rotated into the correct location. The amount of rotation is also provided by the involute code for gears with no tooth thickness changes. For the amount of rotation needed for gears with backlash due to tooth thickness, the angle of rotation was reduced from the amount specified in the involute code. After rotating the curve, it mirrored over a centerline to get the full tooth outline. Next, all the radius provided by the involute profile code are drawn. This draws the addendum, dedendum, pitch and base circle. From there a tangent line is added from the base circle to the dedendum circle as the code does not provide those points. The sketch can then be extruded to create a gear with a single tooth. Then using a circular pattern, all gear teeth are drawn. Finally fillets are added at the roots and tip of each tooth.
36 26 4. FINITE ELEMENT ANALYSIS (FEA) 4.1 Gear Mesh Stiffness Gear trains transmit power through rotation and the meshing of the gear teeth. The torsional mesh stiffness, K m, is the used to determine the ability of a gear to resist deformation when caused by torsion. When a pair of gears meshes, one of the important factors is the torsional mesh stiffness variation as the gear teeth rotate through the mesh cycle. This variation is caused by the amount of teeth in contact. The more teeth in contact, the higher the torsional mesh stiffness is. This is due to the fact that multiple teeth in contact act like springs in parallel. Torsional stiffness is torque over an angular displacement. This is also how the torsional mesh stiffness will be solved. In the quasi-static FEA models, a torque will be selected to run the model. This torque will cause the pinion to rotate and come into contact with a fixed gear. From the Abaqus results, the angular displacement caused by this input torque is obtained. Using equation 4.1.1, the torsional stiffness of the gear at a specific position can be found. (4.1.1) Based on research done by Howard and Wang [25], linear gear mesh stiffness, K L, explains the coupling between torsional and transverse motions in a system. Linear mesh stiffness can be obtained from torsional mesh stiffness with the relationship shown in equation Torque is force times a length or in the case
37 27 of gears force times the pitch radius of the gear. θ is the arc length divided by the pitch radius of the gear. Using a small angle assumption, the arc length is the same as linear displacement. Stiffness being a force over a displacement, the linear mesh stiffness is now the linear force cause by the input torque and a linear displacement from the amount of rotation cause by that torque ) 4.2 FEA Models All FEA models are 2D shell models and spur gears. From the SolidWorks model, the outline of the gear is saved as a.stp. Before clicking ok to save the file, in the options, the box for wireframe and export sketch entities needs to be checked. The.stp files are imported as sketches which are then used to create parts. The bores on the gears are very large as the stresses in the center of the gear were not the concern of the analysis. This also reduces the amount of elements for the part. Backlash distances for the fixed axis gears were calculated to simulate real backlash in a system. This value was used to correctly translate the pinion in the y-direction. When first importing the gears into the assembly, the gears tend to not be in the right position and the teeth intersect each other. To fix that, the pinion is rotated around its center until the teeth are no longer intersecting each other. The same was done with the planetary system except the distance between
38 28 the gears was determined by adding the radius of the sun and planet. Two of the planets were also rotated 120 and -120 about the center of the planetary gear system so that the planets were equal spacing from each other. To apply boundary conditions and loads on the gears, a reference point was placed at the center of each gear and the boundary conditions and loads were applied to the reference points. The reference points were then constrained to the gear with a coupling constraint. A surface to surface contact was made to simulate the gears meshing. A friction coefficient of.3 was used to simulate friction between the two gears during contact. Table 3: Model parameters for the fixed axis gears Parameters Values Young's Modulus E 30 x 10 6 psi Poisson's Ratio ν.29 Density ρ lbf s 2 /in 4 Backlash B 0.002in Diametral Pitch m 10 tooth/in Pressure Angle Φ 20 deg Face Width F 1 inch 2 nd Set Pinion Z p 23 Teeth 2 nd Set Gear Z g 31 Teeth Friction Coefficient µ.3
39 29 Table 4: Model parameters for the planetary gear system Parameters Value Module m 3 mm/tooth Pressure Angle Φ 20 deg Face Width F 10 mm Sun Z s 18 Teeth 1st Stage Planet Z p1 33 Teeth 2nd Stage Planet Z p2 30 Teeth 1st Stage Ring Z R1 84 Teeth 2nd Stage Ring Z R2 81 Teeth Backlash B 0.03 mm Young's Modulus E 2.07 x Pa Poisson's Ratio ν 0.3 Density ρ 7850 kg/m3 Friction Coefficient µ Loading and Step Parameters When making the steps, the defaults for both quasi-static and dynamic implicit were not enough to get the model working. For the quasi-static model, there was also a need to lower the minimum step size. The default of 1E-5 was not enough and so 1E-20 was arbitrarily selected as it small enough to allow the simulation to run. After getting the model to run, a minimum step size of 1E-10 was sufficient. For the dynamic model, the maximum number of increments needed to be over
40 A maximum of 1000 increments was selected arbitrarily increments was never needed, but was left that high in case a model needed to have very small time steps. The rest of the parameters that applied for the quasi-static model were also applied to the dynamic model. This allowed the model to successfully run. In order to simulate a simple static loading condition, the gear was fixed (Encastre) and a constant torque was applied to the pinion. This torque caused the meshing teeth to deflect until it reached equilibrium. There the stress values and amount of rotation could be extracted from this quasi-static model. To model a dynamic system with a constant power, a loading torque as well as a constant angular velocity of.2 radians per second was placed on the pinion. A resistive torque was placed on the gear. The reason for a small angular velocity was to compare the stresses from FEA to the AGMA stresses. At.2 radians per second, that equates to a pitch line velocity of 4.6 mm per second, which makes K v still very close to 1. After the transient startup response, the stresses on the meshing teeth began to converge on a constant stress value comparable to the AGMA stress calculations. Knowing that the model results for the simple fixed
41 31 axis gears were comparable with theoretical results, this method would be plausible for the planetary gear models. 4.4 Meshing When choosing an element type, there are only two choices plane stress and plane strain. For plane stress elements, the stress in the z direction are zero and for plane strain, the strain in the z direction are zero. Typically plane strain elements are used for models that have a large thickness while plane stress is used for models that are thin. This is because for thinner models, the assumption that there are no stresses in the z direction can be a good approximation as the stresses are relatively low. For thicker models, assuming no stress in the z direction becomes a problem, as stresses in the direction start appear. All gear models done had a thickness of 1 inch or 10mm. But what constitutes as a thick material? In a report about a theoretical gear meshing model derived by Dr. Meagher [20] and a thesis by Chun Hung Lee [25], plane stress elements were shown to be a valid choice for models of a thickness of 1 inch. For the models, the valid choice was plane stress. The next choice now falls down to whether to use quadratic quadrilateral plane stress elements or quadratic triangular plane stress elements. Quadratic triangular plane stress elements models have 6 points of integration while quadratic quadrilateral plane stress elements have 8 points of integration. In theory,
42 32 quadrilaterals have an advantage due to the larger number of integration points. The more integration points, the better the approximation of the stress of the element is. This is because the stress of the element is calculated by an average of all the integration points. The more integration points, the more that average represents what the real stresses of the element are. This in turn helps to reduce the number of elements needed for convergence, which in turn would lead to lower computational times. For the convergence study, the number of elements in the model was obtained from the.dat file and then plotted in the figures below. In mesh quality, triangular elements were better than their quadrilateral counter parts. In figures 3 and 4, the convergence study for quadrilaterals and triangular elements shows that they converge around the same value, but quadrilateral uses much less degrees of freedom. When applying the mesh checks, quadrilaterals had a higher percentage of bad elements. For the quadrilateral elements, there was a high amount of elements with interior face angles less than 60 or greater than 120. Also, triangular elements could have much finer meshes than quadrilaterals. When attempting to mesh at a size of.005mm, quadrilaterals were unable to mesh. As for computational time, both elements performed about the same. Computational times were also obtained through the.dat file. Overall, quadratic triangular plane stress elements appear to be the better of the two element types and so all models used these elements.
43 Von Mises Stresses Near Surface (MPa) Von Mises Stresses Near Surface (MPa) Quadrilateral Element Convergance Study Degree of Freedom Figure 3: Convergence study of the fixed axis gear set with quadratic quadrilateral plane stress element. Triangular Element Convergance Study Degree of Freedom Figure 4: Convergence study of the fixed axis gear set with quadratic triangular plane stress elements
44 34 When meshing the gears, the quasi-static model and the implicit model were meshed differently. For the quasi-static model, only 1-3 teeth on each gear had a fine mesh. This is because the stresses at the point of contact and at the root were the main interest. Using edge seeds, the edge seeds were slowly refined to a seed size of.025 mm along the gear involute profile to get convergence. A coarse global mesh of 10mm was used to reduce the amount of elements and speed up processing time. A coarse mesh of 10m was not selected arbitrarily. This was the coarsest the mesh could be and allow for angular displacement to converge. This made each gear have about elements. Initially for the implicit model, the same type of meshing as the quasi-static models was done. This was used to prove that the contact stresses from the implicit model would replicate the same results as the quasi-static models. After, a fine global mesh of.2mm was used. A coarse edge seed was place at the bore to reduce the number of elements in unimportant areas. The mesh at the teeth involute profiles was not as fine as the quasi-static models due to the interest of the implicit models was to see stress patterns, and not necessarily the exact stresses.
 Figure 5 shows an overall distribution of stress through the contacting teeth of fixed axis gear set. Both contact and bending stresses show up in each tooth.")
45 Results STRESS RESULTS Figure 5: Fixed Axis Gear Set Meshing Teeth with Biased Color Scale (Scale factor = 1.0) Figure 5 shows an overall distribution of stress through the contacting teeth of fixed axis gear set. Both contact and bending stresses show up in each tooth. However, since the contact stress tends to be 2 orders of magnitude higher than bending, a biased color scale was used in this image. Bending stresses are greatest at the bottom of the teeth due to the stress concentrations induced by the fillets. Figure 6 displays the stresses right at the point of contact. In this image, the color scale is adjusted with red being the high end of the expected stress. The
 The results for our planetary gears resemble that of the spur gears.")
46 36 contact stress between the gears is 350 MPa. This value is very close to the stress calculated via AGMA contact stress equation. Figure 6: Zoomed In View of Fixed Axis Gear Set Tooth Contact (Scale factor = 1.0) The results for our planetary gears resemble that of the spur gears. Figure 7 shows the Von Mises bending stress in the contacting teeth. The scale has been modified to show the relatively low magnitude stresses more clearly. The model shows an average stress near the points of contact as 315 MPa.

47 37 Figure 7: Planetary Gear Set Meshing Teeth with Biased Color Scale (Scale factor = 1.0) With the implicit dynamic model, it is possible to see how stresses change as the gear rotates. Unlike the quasi-static model, there is no need to run 360 runs to get stresses and plotting becomes much simpler. Figures 8 and 9 show the stresses on the root of each gear tooth as the gear rotates. In figure 8, the root stresses for tooth 2-12 are shown and in figure 9, stresses for tooth are shown. The x axis is put in terms of mesh cycle. It is expected that in each tooth will reach its peak stress once in a full rotation. The mesh cycle makes it easier to see this change of peaks for each tooth. When running the implicit model, the gear started at the beginning of a mesh cycle with 1 tooth in contact. This would make all
48 Von Mises Stress (MPa) 38 mesh cycles start with the contact tooth at its peak stress. The two figures show that each tooth reaches its peak at around its corresponding mesh cycle Tooth 2 Tooth 3 Tooth 4 Tooth 5 Tooth 6 Teeth Stress Tooth 7 Tooth 8 Tooth 9 Tooth10 Tooth 11 Tooth Mesh Cycle Figure 8: Root Stresses for tooth 2-12 on pinion of fixed axis gear set.
49 Von Mises Stress (MPa) Teeth Stress Tooth 14 Tooth 16 Tooth 17 Tooth 15 Tooth 18 Tooth 19 Tooth 20 Tooth 21 Tooth Tooth Mesh Cycle Figure 9: Root Stresses for tooth on pinion of fixed axis gear set STIFFNESS RESULTS Figure 10 shows the gear mesh stiffness for the fixed axis gears. This set of fixed axis gears was modeled to match the one in Chun Hong s thesis as closely as possible [25]. This was used to verify that the method used to calculate linear gear mesh stiffness was accurate. The results matched very closely and were within 5% of those in Chun Hong s thesis. When compared to the theoretical model Dr. Meagher [20], when 2 two teeth were in contact, the values were within 3%, but when 1 tooth was in contact, the results were ranged from 10-15% off. The reason for this discrepancy could be because the theory is a closed-form solution that employs only a short rectangular beam. The theory does not take into account the
50 40 involute profile of the gear tooth, Hertz contact stresses, and gear body compliance. The square wave was generated based on the contact ratio to further verify the model. As shown, the square wave matches with the FEA results verifying the model is operating at the correct contact ratio. Figure 11 shows the gear mesh stiffness for an internal external gear pair. The same method used for the fixed axis gears was applied to this gear pair. The pattern for the gear mesh stiffness is the same and matches well with the square wave. The pattern for a root damaged gear tooth is also the same as with two external gears. The stiffness is slightly lower than that of a healthy gear tooth. The linear stiffness calculated from Abaqus are then applied to Adams in the later sections
51 Linear Stiffness (N/mm) Linear Stiffness (lb/in) x 106 Gear Mesh Stiffness Perfect Cracked Pitting Square Wave Mesh Cycle Figure 10: Plot of gear mesh stiffness for an external to external gear mesh 4.8 x 10⁵ Gear Mesh Stiffness perfect cracked square wave Mesh Cycle Figure 11: Plot of gear mesh stiffness for an internal to external gear mesh
52 Conclusions The contact stress values obtained from the model closely resembled those from preliminary hand calculations. Convergence studies, mesh refinement in areas of interest, and model verification all contribute to the authenticity of these models. Discrepancies between the theoretical values for stress and those predicted by the model can come from the assumptions that were made and the nature of the non linearity computational in the FE models. It was assumed a gear could be modeled with a rigid Reference point coupled to the shaft bore surface. This is a perfectly rigid constraint and may restrict actual stress propagation in the gear teeth. Shafts can deflect and cause whirl in rotating machinery. Setting up the model with a constant speed and resistive torque is still only estimation. In reality, gear speeds can fluctuate. In SolidWorks, by using Matlab to plot many points, it made the involute profile as accurate as possible. When meshing this profile in Abaqus, the involute profile is discretized into straight elements. The severity of discretization is based on the seed size of the edge nodes in contact with other surfaces. Because this surface is not continuous, at times a pair of teeth contacted at two adjacent nodes instead of just one. But as the seed size decreases, this effect becomes more and more insignificant.
53 Future Work In the future, 3D FEA models would be ideal. 2D models work well in the general analysis of stresses in the gears and are not as computational expensive as 3D models. But 2D models are only able to perform analysis on spur gears and are unable to predict stresses along the face of the tooth. With a 2D model, pitting damage is not well represented as the damage pattern is constant through the whole tooth and stresses across the face are the same, which is not realistic. Using a 3D approach, the model now has depth. This allow for a more accurate prediction of stresses when a gear has pitting damage as the damage can be accurately modeled after a real damaged system. Analyzing helical and bevel gears would also be possible with 3D FEA models. Helical and bevel gears tooth geometry changes and so using a 2D model is not possible.
.")
54 44 5. BEVEL GEAR MODEL AND EXPERIMENT 5.1 Experimental Setup Figure 12: Photo of Experimental Setup SER as stated before is a simple health monitoring system developed by General Electric Energy (GE Energy). It is expected that for a healthy system, the calculated SER will be around 1 and for a damaged system this value will be much greater than 1. In order to test this hypothesis, vibration data was collected at a number of locations on a damaged gearbox at a number of different shaft speeds. The gearbox is a MITRPAK model HAR-102-C1 that has a 2:1 gear ratio. Figures show the configuration of the system. There are 13 teeth on
 Figure 13: Overall schematic of the gearbox")
55 45 the pinion and 26 teeth on the other gear. In equation 5.1.1, it is shown that the gear mesh frequency should be 13 times the speed of the motor, Ω. (5.1.1) Figure 13: Overall schematic of the gearbox

56 46 Figure 14: Gearbox, shaft, and motor used in the experimental setup. Figure 15: The MITRPAK HAR-102-C1 gearbox used to perform the experiment.

57 47 Figure 16: The shafts, gears, and bearings housed in the gearbox. Figure 17: Dimensions of the gear box assembly
58 48 The shaft is driven by a servo motor. The motor is driven by a +-24V power supply and can achieve speeds of up to 3800 RPM (approximately 63.3 RPS). The motor assembly contains an optical encoder that is used to determine the true shaft speed. It generates a signal with a trapezoidal waveform that cycles one thousand times per revolution; the speed of the motor in RPS is therefore 1/1000 the frequency of the output signal. An oscilloscope was used to read this signal and therefore determine the shaft speed. Speeds below about 8 RPS were found to give fluctuating speed readings, so trials were conducted at greater speeds. Four sensors were placed in the system to measure vibrations as seen in figure 18 and the sensor specification is listed in table 5. The outputs signals were fed to a Dactron data acquisition system and a spectrometer. The spectrometer only read accelerometer 2 as its location was right above the gears. Frequency analysis of the signals was performed at a variety of different motor speeds. A linear average of one thousand frames was taken in each trial to reduce noise. Measurements were taken when the shaft speed was 10, 15, 20, 25, and 30 revolutions per second. It is believed that the sensors must be placed in certain locations for a consistent and reliable diagnosis.
59 49 Figure 18: Accelerometer locations Table 5: Specifications of the accelerometer used on the gear box assembly Accelerometer Model SN Sensitivity Mass Resonant Frequency #1 PCB-308B mv/g 76.1 grams 29 khz #2 PCB-308B mv/g 76.2 grams 29 khz #3 PCB-353B mv/g 24.1 grams 30 khz #4 PCB-353B mv/g 24.1 grams 30 khz
60 ADAMS Modeling GEAR PAIR ONLY Matching the experiment, a model of the bevel gear system with a pinion gear of 13 teeth and a larger gear of 26 teeth was used in the ADAMS simulation. There was no extra information about the experimental gearbox except the number of teeth. For the model, a module of 3mm and a 20 degree pressure angle, which are fairly common, were chosen for the simulation. The impact algorithm was chosen as the contact force model because of its robustness in numerical integration. Based on sound engineering judgment, the stiffness parameter is carefully selected for this bevel-gearing system to account for the elasticity of the teeth. The penetration, d c, is defined as the depth at which the damping force reaches its maximum value, details are provided in [6]. The gear properties and key simulation parameters are shown in table 6. Table 6: Bevel Gear design and simulation parameters Parameters Value Parameters Value Stiffness K 1.8 x 10 5 N-mm Backlash B 0.05 mm Force Exponent e 2.2 Module m 3 mm/tooth Damping c.5 N-s/mm Pressure Angle Φ 20 deg Penetration d c 1 x 10⁻³ mm Face Width F 10mm Young's Modulus E 2.07 x Pa Pinion Z p 13 Teeth Poisson's Ratio ν 0.29 Gear Z g 26 Teeth Density ρ 7801 kg/m3


61 51 (a) (b) Figure 19: SolidWorks models of bevel gears. (a). Perfect gear system, (b). Damaged gear system In ADAMS simulation, two revolute joints are applied to the pinion and gear, respectively. One solid-to-solid contact is applied between the gears. A small resistance torque of 10 N-mm is applied on the gear to realistically simulate the bearing resistance. There was no braking torque added to the system as in the experiment there were no brakes applied to the output shaft of the gear box. In the analysis, two different models of the gear systems are used: a perfect gearing set and a damaged gearing set. Due to the common factor between the pinion and the gear being 13, the damaged tooth on the pinion will eventually wear out two teeth on the gear. The goal of having these two models is to check if the simulation data would be close to the experimental data and follow the SER in determining damaged gearing systems. Each model is run at 5 different speeds: 10 Hz, 15 Hz, 20 Hz, 25 Hz, and 30 Hz.

62 FLEXIBLE BODIES AND BEARINGS Figure 20: ADAMS flexible body and bearing model In the previous analysis, it was a very preliminary start. Without a shaft or bearings like a real system, the results generated would not match a real system. In this section of the analysis for the bevel gear, a shaft and bearings were introduced. Table 7 shows the information of the shafts and bearings that were added to the model. The first part of this analysis, the model used a rigid shaft and bearings were added. In the second part, the shaft was made into a flexible body. This allowed the shaft to act in a realistic manner during the simulation. With a flexible body, loads on bodies are more accurate, deformation and stresses in a body can be analyzed, and capturing inertial and compliance properties are now possible. For both analyses, the same parameters as the pervious section were
63 53 applied. The results from this analysis were then compared to those in the previous section and experimental results. Table 7: Information for the shafts and bearings Parameter Value Shaft 1 diameter 12mm Shaft 1 length 175mm Shaft 1 diameter 20mm Shaft 1 length 150mm Bearing 1 SKF Bearing 2 SKF Bearing 3 SKF ADAMS provides two ways to make a flexible body. The first method is using ADAMS/flex. ADAMS/flex uses assumed modes method to model flexible bodies, which is called modal flexibility [7]. This requires an FEA program to perform a modal analysis and then be able to create a modal neutral file,.mnf. ADAMS/flex uses that modal neutral file to apply modal flexibility to the part in ADAMS/view by assigning mode shapes to the body. The principle of linear superposition is then used to combine the mode shapes at each times step to reproduce the total deformation in the body [7]. This method was not used as there was no successful attempt to create a.mnf file from Abaqus.
64 54 The second method is using ViewFlex in ADAMS. ViewFlex works in the same way as ADAMS/flex. The only difference is that it does not require an external FEA program because it performs its own modal analysis on the body to apply modal flexibility to that body. This makes this method a quick and simple way to make parts into flexible bodies. The user is able to designate the mesh size. For the element type, the user can choose between a solid or shell element. If the element type is solid, the only option is tetrahedral elements, while shell elements have the option of triangle or quadrilaterals. The elements can also be linear or quadratic. After setting up the mesh, attachment points need to be determined. ViewFlex uses attachment points to define where a constraint or load acting on the flexible body is. ViewFlex searches through the body for constraints and loads attached to the body and display their locations. At each attachment point has a set of slave nodes that are associated with it to help define how an external load will be distributed. Slave nodes can be selected through selecting a solid feature, selecting specific nodes, defining a radius around an attachment point, defining a cylindrical region, and selecting a set number of nodes around the attachment point. With the attachment points and mesh pattern set; ViewFlex performs a modal analysis and applies modal flexibility to the body. ViewFlex does have a limit on its performance. Bodies that require over a hundred thousand nodes are beyond the limits of ViewFlex.
65 55 ADAMS/Machinery has a large database that allows for quick modeling of gears, bearings, belts, chains and cables. Machinery was designed to all for users to quickly model complicated systems quickly and avoid having to redo an entire model for a small change in the system. In Machinery, only bearings were used as Machinery cannot generate damaged gears and there were no belts, chains or cables in the model. Machinery provides 3 types of analysis on their bearings. The first type is joint, which are ideal kinematic joints and users can specify friction and motion for the bearing. The second type is compliant. These treat the bearings as linear bushings and the user can specify the stiffness, damping and motion for the bearing. The last type is detailed, which was used in the models with bearings. This includes ball bearings, cylindrical roller bearings, needle roller bearings, spherical roller bearings, and tapered roller bearings. KISSsoft, company that designed the software for bearing, includes a large database of bearings from several different manufacturers such as: FAG, SKF, Koyo Seiko, and several others. These bearings use a six component force to represent the rolling element in bearings [7]. From that force, KISSsoft calculates the stiffness of the bearing through and incorporates damping provided by ADAMS. KISSsoft calculates this stiffness component at every time step, which takes into consideration the location of the bearing and axial loads. KISSsoft allows for a service life prediction based on industry standards. The appearance of all bearing models in ADAMS are look the same. Though the appearance of a 12mm bearing is the same as 20mm
66 56 bearing this is just for presentation only, within the code, the exact specification of the selected bearing is used. The size can be changed by changing the size scale. 5.3 Results Some experimental results from the damaged gearbox are shown in Figure 21 and 22. They depict the system s vibration response from accelerometer 2 and 4, respectively, at different speeds. It is interesting to notice that there is a strong spectral line at approximately four times the speed of the motor, Ω. This frequency is identified as the Outer Race Ball Pass (ORBP) frequency. The bearings of this practical gearbox have 10 balls (N), a ball diameter (d) of.1875in, a pitch diameter (D) of in, and a contact angle (α) of 0. The detailed calculation is shown in equation Similar results can be observed from accelerometer 1 and 3 as well. Since the bearings are inseparable components of the gearing dynamic system, the damaged gear teeth trigger not only the higher spectral lines at the gear mesh frequency and its super-harmonics, but also the spectral line at the outer race ball pass frequency of the bearings. This frequency is not observed in our ADAMS simulation due to the model being just two fixed axis bevel gears and no bearings included.
67 Acceleration (m/s^2) 57 ( ) ( ) (5.5.1) Strong spectral lines are observed at the fundamental Gear Mesh Frequency (13 Ω) and its super- harmonics at different speeds. The predicted and observed gear mesh frequencies from ADAMS and experiments, respectively, are shown in table 8. ADAMS simulation results match very well with the experimental results hz Accelerometer Frequency (hz) (a) The ORBP frequency is observed at 61.2Hz = Hz
68 Acceleration (m/s^2) Acceleration (m/s^2) hz Accelerometer Frequency (hz) (b) The ORBP frequency is observed at 122.4Hz = Hz Figure 21: Gearing system response from accelerometer 2 at different speeds hz Accelerometer Frequency (hz) (a) The ORBP frequency is observed at 61.2Hz = Hz
69 Acceleration (m/s^2) hz Accelerometer Frequency (hz) (b) The ORBP frequency is observed at 122.4Hz = Hz Figure 22: Gearing system response from accelerometer 4 at different speeds Table 8: The Fundamental Gear Mesh Frequency (GMF) comparison at 5 different speeds Speed (Hz) Predicted GMF (Hz) Observed GMF Observed GMF Observed GMF Observed GMF % Difference For Position % Difference For Position % Difference For Position % Difference For Position SERs calculated from the experimental measurements of each accelerometer at 5 different speeds are shown in table 9. The data from accelerometer1 and 2 is very consistent with means slightly above 3 and low sample standard deviations of only about 0.4. The ratio was found to be with 99% confidence when data from these two runs is combined. This ratio is well above the value of one,
70 60 the upper limit of perfect gearing system as described in section 2, indicating there are damaged teeth within the gearbox. Therefore, SER serves as a good indicator of the damaged gearing system. SERs from accelerometer 3 and 4 are greater than one as well, but there is considerable variability with higher deviations, possibly due to the fact that they are installed along the shaft of the gear. Accelerometer 2 located right above the gearbox, gives the most consistent results. Table 9: SER calculated from experimental measurements Locations Speed 10 Hz 15 Hz 20 Hz 25 Hz 30 Hz Accelerometer Accelerometer Accelerometer Accelerometer
71 Force (N) Forec (N) 61 15Hz Perfect Gearing System Frequency (Hz) (a). FFT contact force response for a perfect system 9 15hz Damaged Gearing System Frequency (Hz) (b). FFT contact force response for a damaged system Figure 23: ADAMS simulation result comparison at input speed of 15 Hz for Gears only
72 Force (N) Force (N) Hz Perfect Gearing System Frequency (Hz) (a). FFT contact force response for a perfect system 30Hz Damaged Gearing System Frequency (Hz) (b). FFT contact force response for a damaged system Figure 24: ADAMS simulation result comparison at input speed of 30 Hz for Gears only Figure 23 and 24 illustrate the results of a perfect and damaged gearing system at different input speeds for the ADAMS simulation of two bevel gears. The
73 63 Sideband Energy Ratios (SERs) are calculated and shown in table 10. For perfect gearing system, the mean was 0.970, which is less than one as is what the theory would suggest. For the damaged system, the mean was 2.55 which is well over 1 and also matches the expected predictions and theory. Table 10. SER Calculated from ADAMS Simulation results of just two bevel gear SER Indicator Speed 10 Hz 15 Hz 20 Hz 25 Hz 30 Hz SER for a perfect gearing system SER for a damaged gearing system (a). FFT contact force response for a perfect system
74 Force (Newtons) Force (Newtons) Hz Damaged Gears Frequency (Hz) (b). FFT contact force response for a damaged system Figure 25: ADAMS simulation result comparison at input speed of 15 Hz for flexible shaft model 2 30Hz Perfect Gears Frequency (Hz) (a). FFT contact force response for a perfect system
75 Force (Newtons) Hz Damaged Gears Frequency (Hz) (b). FFT contact force response for a damaged system Figure 26: ADAMS simulation result comparison at input speed of 30 Hz for flexible shaft model Figure 25 and 26 illustrate results of a perfect and damaged gearing system at different input speeds for the ADAMS simulation of the bevel gear system with flexible shafts and bearings. The SERs are calculated and shown in table 11. Like the previous models, for undamaged gears, the SER was less than 1, while the damaged models were greater than 1. For perfect gearing system, the mean was and for a damaged system.
76 66 Table 11: SER calculated from ADAMS Simulation results of bevel gear with flexible shafts and bearings Speed SER Indicator 10 Hz 15 Hz 20 Hz 25 Hz 30 Hz SER for a perfect gearing system SER for a damaged gearing system With the bearings, the contact forces on the bearing can be observed. In figure 27, it shows the bearing contact forces for a rigid shaft and figures 28 and 29 show the bearing contact forces with a flexible shaft. In figure 27 the contact forces are very small and practically negligible. This makes sense as with a rigid body, it cannot flex or bend. For the flexible shaft, there is an oscillation in the force of the bearings. In figure 28, there is a constant oscillation, which is reasonable as a constant speed was applied to the system. In figure 29, the oscillation is not constant and as time goes, the period gets smaller until.4 seconds where the oscillation becomes constant. This match perfectly with the applied speed constraint was an exponential step speed of the form, which reaches 99% at.4 seconds. The figures all show contact force on the first bearing on the 1mm shaft, the pattern for all other bearings was the same.
77 Force (Newtons) Force (Newtons) 67 2 x 10⁻⁸ Rigid Shaft with Changing Velocity Time (s) Figure 27: Plot of Contact force on first bearing on 12mm rigid shaft for the exponential input speed 0.16 Flexible Shaft with Changing Velocity Time (s) Figure 28: Plot of Contact force on first bearing on 12mm flexible shaft for the constant input speed
78 Force (Newtons) Flexible Shaft with Changing Velocity Time (s) Figure 29: Plot of Contact force on first bearing on 12mm flexible shaft for the exponential input speed Flexible bodies allow for the analysis of stresses in the body. Figure shows the Von Mises stresses at a single time step.

79 69 Figure 30: Von Mises Stresses in flexible shaft for a constant power input 5.4 Conclusion Simple pairs of perfect and damaged bevel-gear sets are accurately designed and built using CAD software. Constraints, bearing resistant torques, and some key parameters in ADAMS are applied as closely as possible to real operating condition. The involute profile is precisely calculated and modeled in order to get realistic dynamical contact force when gears are engaged. The simulation results match our predictions very well. For the perfect gearing system, the SER is around 1 or less. For the damaged gearing system, the SER was well above 1. The simulations also show the gear mesh frequencies around the predicted values. Unfortunately, even when bearings were implemented into the model, the ball pass frequencies were not seen. But now with flexible bodies, it is now possible to
80 70 see the stresses in the shaft at each time step. This provides a door to another type of analysis. It now allows for this same model to be used to determine durability and the lifetime of parts. The SER is found to be above one for a practical known-damaged gearbox. The average ratio is about 3.8. It is shown that the SER is between and with 99% confidence. Any ratio over one is the indicative of damage. The variability of readings at each position measured is different. Accelerometer 1 and 2, aligned with the driveshaft, produce SERs with standard deviations of and 0.459, while the other two accelerometers have much greater standard deviations of 6.22 and This supports the notion that the locations of the accelerometers are important in health monitoring of the gearing system. Dominant spectral lines are reliably detected at the fundamental gear mesh frequency and its super-harmonics.
81 Future Work Due to time constraints and costs, a healthy gear system experiment was not done to be used as a control. To fully verify that this method is a reliable way to assess gear health, calculating SER for a healthy gear system is needed. In addition, working with acoustic sensors instead of accelerometers would offer more flexibility on where the sensors could be placed in the system. In addition to the physical experiments, the simulation model could be made more sophisticated. Adding housing for the gears and using the Adams Vibration package to place sensors that match the experiment, would give a more accurate representation of the experiment. This way, the correlation between theory, simulation and experimental results would be more valid. Although the general trend was correct, the values varied somewhat significantly. Other things like friction between contacts would also add to the validity of these simulations as this entire model was done frictionless. Flexible bodies can be further studied as the full capabilities were not explored in this thesis.
82 72 6. PLANETARY GEAR 6.1 Model A typical two-stage planetary gear is chosen for study. The CAD models are shown in figure 31 (a), and figure 31 (b), respectively. The profile of the "chipped" gear teeth is in shown in figure 32. The design geometric parameters of the planetary gear train are shown in Table 12. Combined with gear profile damages, the backlash may cause the loss of contact between gear teeth. This may induce large impact forces associated with consecutive single-sided and/or double-sided impacts. The gears are modeled as a rigid body with flexible contact surfaces using a penalty based non-linear contact formulation. The nonlinear contact force,, is a vector quantity composed of an elastic and damping portion [10], where d is the penetration depth. The damping force, cv, is proportional to impact velocity, v. The stiffness coefficient, K, is taken to be the average value of stiffness over one tooth mesh cycle. The force exponent, e, was determined from trial simulations. The damping coefficient generally takes a numeric value between 0.1% - 1% of K. The determination of force exponents however is not obvious and must be based on engineering experience.
 Exploded View Figure")

 Close up on")

83 73 (a) Isometric View (b) Exploded View Figure 31: A two-stage planetary gear CAD model (a) Damaged Planetary Gear (b) Close up on Damaged Tooth Figure 32: CAD model of a damaged planetary gear
84 74 Table 12: Planetary gear design and simulation parameters Parameters Value Parameters Value Module m 3 mm/tooth Stiffness K 1.6 x 10 5 N/mm Pressure Angle Φ 20 deg Force Exponent e 2.2 Face Width F 10 mm Damping c 5 x 10⁻¹ N- s/mm Sun Zs 18 Teeth Penetration d c 1 x 10⁻³ mm 1st Stage Planet 2nd Stage Planet Z p1 33 Teeth 1st test speed Ω 1 48Hz Z p2 30 Teeth 2nd test speed Ω 2 62Hz 1st Stage Ring Z R1 84 Teeth Input Torque T i 1000N-mm 2nd Stage Ring Z R2 81 Teeth Backlash B 0.03 mm Young's Modulus E 2.07 x Pa Carrier Resistance Planet Resistance Second stage Ring Resistance T c T p T R2 2000N-mm 10N-mm 600N-mm Poisson's Ratio ν 0.29 Density ρ 7801 kg/m3 The ADAMS impact algorithm was chosen as the contact force model because of its robustness in numerical integration. Based on past modeling experience, the stiffness parameter is carefully chosen to realistically account for the flexibility of the teeth and reasonable for those type of the planetary gears. Because the damping force in meshing gears occupies small percentage of elastic force, its effect on the simulation results is very small. Therefore, the damping coefficient
85 75 is chosen as a small number to simplify the numerical solver routine. The penetration is defined as the depth at which the damping force reaches its maximum value, details provided in [10]. Transmission dynamics are not sensitive to this parameter. 6.2 Model Validation Due to lack of experimental data, there is no way to compare our numerical results with practical experimental results. However, the multi-body kinematic model was validated using the published results of [16]. The gears are modeled as rigid with elastic contact teeth surfaces defined with a penalty based non-linear contact formulation. The parameters for the pair of meshing gears and ADAMS contact are shown in Table 13.
86 76 Table 13: Simple gear pair design and simulation parameters Parameters Value Parameters Value Stiffness K 1.6 x 10 5 N-mm Backlash B 0.05 mm Force Exponent e 2.2 Module m 2 mm/tooth Damping c.5 N-s/mm Pressure Angle Φ 20 deg Penetration d c 1 x 10⁻³ mm Face Width F 10 mm Young's Modulus E 2.07 x Pa Pinion Z p 20 Teeth Poisson's Ratio ν 0.29 Gear Z g 80 Teeth Density ρ 7801 kg/m3 Free Vibration 50 rad/s initial velocity on Pinion Constant Torque 100N-mm torque applied to the Pinion -100N-mm torque applied to the Gear The relative displacement between the two mating teeth profiles along the line of action is represented as,, where R p and R g are the radii of the base circles of pinion and gear, respectively. When S is larger than the gear backlash B, there is contact between pinion and gear. For a fixed axis external spur pair, The model presented here replicated all the figures in publication [16]. The results produced by ADAMS shown in figures 33 and 34, which are in very close
87 Angular velocity (rad/ms) 77 agreement to the published results. However, the values from ADAMS could not replicate the plots provided in reference [16] because it did not provide complete information for repeating the job. For instance, the torque value, some material properties and geometric parameters are not provided. As a result, the parameters were chosen to match with the publication as well as model a real system. Fortunately, the model accurately captures the transient dynamic forces and behavior of the gearing system in very short time interval. The model is very sensitive to any dynamics changes. With confidence, the model is accurate and robust enough to be applied to more complicated planetary gears. 8 6 Angular velocity for Yangs Free vibration model gear angular velocity, 2 pinion angular velocity, time (ms) Figure 33: Simulation results for free vibration comparison with reference [16] Fig.8 (a,c)
88 Angular velocity (rad/ms) Angular velocity for Yangs constant torque model gear angular velocity, 2 pinion angular velocity, time (ms) Figure 34: Simulation results for constant torque comparison with reference [16] Fig. 9 (a,b) Yang s report [16] gives a starting point for validating fixed axis gears. To fully verify the planetary model, Inalpolat and Kahraman s [23] theoretical and experimental research on sidebands for planetary gear sets is used. All frequencies are measured in carrier order to make it easier to see the important frequencies. Carrier orders are multiples of the carrier speed. A carrier order of 1 is the same as the carrier speed, ω c, and a carrier order of 10 is the same as 10*ω c. The gear mesh frequency, which should be the most prevalent frequency, can be seen at the carrier order corresponding to the number of teeth on the ring as the gear mesh frequency of a single stage planetary gear is Z r ω c. From their research, the models
89 79 that this thesis focuses on are their models of planetary gears that have evenly spaced planets and all planets are in phase. For a model of a single stage planetary gear system with 3 planets, there should be 3 very prevalent peaks. The largest of the 3 should appear at the carrier order corresponding with the number of teeth on the ring, Z r. The other two peaks should have the same magnitude and correspond to Z r ± 3. In figure 35, this pattern can be seen. At the 84 th carrier order, there is a very prevalent peak. This matches the theory as there are 84 teeth on the modeled ring gear. The magnitude of the force did not fully match as the sidebands are not exactly half of the gear mesh frequency. The main focus of this section is on a two stage planetary gear, and so results from may differ as there is no theoretical model to show how the second stage would affect or be affected by the first stage. From the results of the first stage model, the model should provide very useful information for future research.
90 Force (Newtons) Hz Single Stage Planetary Gear Carrier Order, H Figure 35: FFT of contact force on the first stage for a single stage planetary gear model in ADAMS 6.3 Frequency Domain Results and Discussion All of the design and ADAMS parameters shown in section two will be applied to do dynamical analysis of this specific two-stage planetary gear. In order to show our results are universal, we will demonstrate the vibration signature patterns from two different input speeds on sun gear. Table 14 lists all the calculated speeds of each component and Gear Mesh Frequencies (GMF) at first stage and second stage, respectively. The Hunting Tooth Frequency (HTF) is calculated as well. Backlash always exist between each component. Several interesting
91 Force (Newtons) Force (Newtons) 81 vibration patterns in frequency domain due to different type of teeth damages will be illustrated here. Table 14: Speed of each component and the related values Sun speed 48Hz 62Hz Carrier speed, ω c 8.47Hz 10.94Hz Planet speed, ω p 13.09Hz 16.91Hz 2nd Ring Speed, ω R2 0.48Hz 0.63Hz GMF Hz Hz GMF Hz Hz HTF 3.59Hz 4.64Hz Hz GMF 1 3GMF 1 2GMF 1 GMF 1-2(GMF 1 -GMF 2 )/2 2(GMF 1 -GMF 2 )/2 GMF 1 +2(GMF 1 -GMF 2 )/ Frequency (Hz) 62Hz 1.5 GMF 1 2GMF GMF 1-2(GMF 1 -GMF 2 )/2 2(GMF 1 -GMF 2 )/2 GMF 1 +2(GMF 1 -GMF 2 )/ Frequency (Hz) Figure 36: FFT plots from the contact forces between the sun and first- stage planet gear for a perfect rigid model at two different speeds with backlash only
92 Force (Newtons) Force (Newtons) Hz 1 15HTF GMF 1 GMF 1 GMF GMF 1-15HTF GMF 1 +15HTF Frequency (Hz) 62Hz 1.5 GMF 1 GMF HTF GMF 1-15HTF GMF 1 +15HTF Frequency (Hz) Figure 37: FFT plots from the contact forces between the sun and first stage planet gear for a rigid model with a large defect tooth on sun gear and backlash Figure 36 shows the FFT results from the dynamic contact forces between the sun and first-stage planet gear for 48Hz and 62Hz from the sun input. The same scales are used in x and y direction, respectively. The first-stage GMF 1 and its super harmonics are significant. Near those dominant spectral lines, small sidebands are set apart by (GMF 1 GMF 2 ) Hz. These results demonstrate that the nonlinearity is induced by the backlash.
93 Force (Newtons) Force (Newtons) 83 Figure 37 describes FFT response from the contact forces between the sun and first stage planet gear for a model with a large defect tooth on the sun and backlash. The first-stage GMF 1 and its super harmonics are still present. 15 times the Hunting Tooth Frequency of the sun and first-stage planet modulate those dominate peaks in similar patterns at different velocities. From our understanding, these interesting nonlinear results are caused by the interaction of one defective tooth on the sun and backlash (GMF 1 -GMF 2 )/2 GMF 1 -(GMF 1 -GMF 2 )/2 GMF 1-2(GMF 1 -GMF 2 )/2 GMF 1 2(GMF 1 -GMF 2 )/2 48Hz GMF 1 +(GMF 1 -GMF 2 )/2 GMF 1 +2(GMF 1 -GMF 2 )/2 5/3GMF 1 4/3GMF 1 2GMF1 3GMF 1 10/3GMF /3GMF 1 2/3GMF 1 7/3GMF 1 8/3GMF Frequency (Hz) 62Hz (GMF 1 -GMF 2 )/2 GMF 1 -(GMF 1 -GMF 2 )/2 GMF 1-2(GMF 1 -GMF 2 )/2 2(GMF 1 -GMF 2 )/2 GMF 1 GMF 1 +(GMF 1 -GMF 2 )/2 GMF 1 +2(GMF 1 -GMF 2 )/2 2GMF 1 7/3GMF 1 8/3GMF /3GMF 1 4/3GMF 1 5/3GMF 1 2/3GMF Frequency (Hz) Figure 38: FFT plots from the contact forces between the sun and first stage-planet gear for a rigid model with backlash and every third tooth damaged on the sun
94 Force (Newtons) Force (Newtons) Force (Newtons) Force (Newtons) 84 3 (GMF 1 -GMF 2 )/2 GMF 1 48Hz 2GMF 1 2GMF 1 -(GMF 1 -GMF 2 )/2 2GMF 1 +(GMF 1 -GMF 2 )/2 2 GMF 1 -(GMF 1 -GMF 2 )/2 GMF 1 +(GMF 1 -GMF 2 )/2 1 GMF 1-2(GMF 1 -GMF 2 )/2 2(GMF 1 -GMF 2 )/2 2GMF 1-2(GMF 1 -GMF 2 )/2 GMF 1 +2(GMF 1 -GMF 2 )/2 2GMF 1 +2(GMF 1 -GMF 2 )/2 3GMF Frequency (Hz) 62Hz 3 GMF 1 2 GMF 1 -(GMF 1 -GMF 2 ) (GMF 1 -GMF 2 ) GMF 1 +(GMF 1 -GMF 2 ) 2GMF 1 2GMF 1 +(GMF 1 -GMF 2 ) 2GMF 1 +(GMF 1 -GMF 2 ) Frequency (Hz) Figure 39: FFT plots from the contact forces between the first-stage planet and ring gear for a rigid model with backlash and every third tooth damaged on the sun (GMF 1 -GMF 2 )/2 GMF 1 -(GMF 1 -GMF 2 )/2 GMF 1-2(GMF 1 -GMF 2 )/2 GMF 2(GMF 1 -GMF 2 )/2 1 2/3GMF 1 1/3GMF 1 48Hz GMF 1 +(GMF 1 -GMF 2 )/2 GMF 1 +2(GMF 1 -GMF 2 )/2 2GMF 1 3GMF 1 8/3GMF 5/3GMF 1 10/3GMF 1 4/3GMF1 1 7/3GMF Frequency (Hz) 62Hz (GMF 1 -GMF 2 )/2 GMF 1 -(GMF 1 -GMF 2 )/2 GMF 1-2(GMF 1 -GMF 2 )/2 2(GMF 1 -GMF 2 )/2 1/3GMF 1 GMF 1 GMF 1 +(GMF 1 -GMF 2 )/2 2GMF 1 GMF 1 +2(GMF 1 -GMF 2 )/2 4/3GMF1 5/3GMF 1 7/3GMF 1 8/3GMF /3GMF Frequency (Hz) Figure 40: FFT plots from the contact forces between the sun and first-stage planet gear for a rigid model with backlash and every third tooth damaged on both the sun and first-stage planets
95 85 Figure 28 describes the FFT response from the contact forces between the sun and first stage planet gear for a model with every third tooth damaged on sun and backlash. It is interesting to notice that in addition to the first-stage GMF 1 and its super-harmonics, the system s response is also dominated by its sub-harmonics and super-synchronous behaviors at GMF 1 /3, 2GMF 1 /3, GMF 1, 4GMF 1 /3, 5GMF 1 /3. Furthermore, those dominant spectral lines are modulated by (GMF 1 - GMF 2 )/2. In another words, the Second-stage Gear Mesh Frequency GMF 2 not only show up in the first-stage vibration response, but also contribute to the patterns of the sidebands near the dominant peaks. The dynamic responses in the first- and second- stages are mutually affected by each other. As the input speed increases, the spectral lines at harmonics of GMF 1 become more obvious. Figure 39 depicts the FFT response from the contact forces between the first-stage planet and ring gear for a model with every third tooth damaged on sun and backlash. Compared with figure 38, there are no sub-harmonics of GMF 1 in the contact force between planet and ring gear. The force magnitudes are larger. One of the models presented has damage on both the sun and first-stage planets, and third tooth was damaged. Since the common factor of the number of teeth between the sun and planet is three, if one tooth on the sun is damaged, every third tooth on both sun and planets will eventually be damaged. Figure 40
96 86 demonstrates the FFT response from the contact forces between the sun and firststage planet for a model with every third tooth damaged on both sun and firststage planets, and with backlash. Compared with figure 38, the vibration patterns are very similar. However, the spectral lines at sub- and super-harmonics are larger and more obvious. The second-stage GMF 2 play more important role in contributing to the patterns of the sidebands near the dominant peaks. Figures 41-44, show ADAMS results with a flexible shaft and bearings added into the model. Overall, the pattern is similar to that of the rigid bodies, but now the second stage contact forces produce reasonable results. Before all FFT plots on the second stage looked like figure 36 no matter how much damaged was placed on the second stage. With flexible shaft and bearings, the plots shown in figures and show what is expected, the dominant peaks at the second stage gear mesh frequency. In the second stage plots, many sidebands show up that are half of the input speed on the shaft. This may be due to the shaft being a flexible body and triggering impacts between the gears. When damage was placed on the second stage, it can be seen in figure that the sidebands are slightly greater than that of the perfect model.
97 Force (Newtons) Force (Newtons) Force (Newtons) Force (Newtons) Hz 3 GMF 1 -(GMF 1 -GMF 2 ) GMF 1 2GMF 1 -(GMF 1 -GMF 2 ) 2GMF 1 2GMF 1 +(GMF 1 -GMF 2 ) 2 GMF 1 -GMF 2 3GMF 1 1 GMF 1 +(GMF 1 -GMF 2 ) Frequency (Hz) 8 6 GMF 1 -(GMF 1 -GMF 2 ) GMF 1 62Hz 2GMF 1 -(GMF 1 -GMF 2 ) 2GMF 1 +(GMF 1 -GMF 2 ) 2GMF GMF 1 -GMF 2 GMF 1 +(GMF 1 -GMF 2 ) Frequency (Hz) Figure 41: FFT plots from the contact forces between the sun and first- stage planet gear for a perfect flexible model at two different speeds with backlash only Hz 2 GMF 2 2GMF GMF Frequency (Hz) 5 62Hz 4 GMF 2 2GMF GMF Frequency (Hz) Figure 42: FFT plots from the contact forces between the second stage planet and ring gear for a perfect flexible model at two different speeds with backlash only
98 Force (Newtons) Force (Newtons) Force (Newtons) Force (Newtons) Hz GMF 1 /3 2GMF 1 /3 GMF 1 4GMF 1 /3 5GMF 1 /3 2GMF 1 7GMF 1 /3 8GMF 1 /3 3GMF 1 10GMF 1 / Frequency (Hz) GMF 1 /3 2GMF 1 /3 GMF 1 62Hz 4GMF 1 /3 5GMF 1 /3 2GMF 1 7GMF1 /3 8GMF 1 / Frequency (Hz) Figure 43: FFT plots from the contact forces between the sun and first-stage planet gear for a flexible model with backlash and every third tooth damaged on both the sun and first-stage planets Hz GMF 2 2GMF 2 3GMF Frequency (Hz) 5 62Hz 4 GMF 2 2GMF 2 3GMF Frequency (Hz) Figure 44: FFT plots from the contact forces between the second stage planet and ring gear for a flexible model with backlash and every third tooth damaged on the second-stage planets
99 Joint Time Frequency Analysis (JTFA) In the above section, it explains the vibration responses of the two-stage planetary gear for different damage cases at constant input speeds. A common practice to monitor the condition of rotating machinery is to examine vibration signals during start up and/or shut down. In order to demonstrate how the frequency content of force changes with time a joint time-frequency analysis (JTFA) is performed based on transient start-up conditions. The combined time-frequency representation will fully reveal the characteristics of the transient dynamics signals, which either time- domain or frequency-domain analysis alone cannot disclose. Additional information can often be obtained by resonances and the presence of non-synchronous vibrations. An exponential step torque of the form T is applied to the sun gear to realistically represent a characteristic electric motor. The magnitude of steady-state torque T is 750 N-mm. The duration of the time is 0.30 sec. To simulate practical operating conditions, resistive torques are applied to the carrier and planets with magnitudes around one percent of the element's torque at steady-state. The resistance torque with magnitude of 600 N-mm is applied at the second-stage ring. Aliasing issues are prevented by using a large number of integration steps and long simulation duration of 4


100 90 seconds. Spectrum leakage is reduced by overlapping a sliding time sample of 100 ms by 95% and applying a Hanning window to each sample. (a). 3D JTFA Plot (b). 2D Time-frequency Plot Figure 45: JTFA plots for perfect rigid planetary gear model with exponential step torque applied on sun The same exponential torque and resistant torques described above are applied to a perfect planetary gear and a planetary gear with every third tooth damaged on the sun, respectively. The dynamic responses in figures 45 and 46 are measured from the contact forces between the sun and the first-stage planets. For the perfect planetary gear in figure 45, the peak forces increase in a simple continuous manner with torque. The spectrum of the peak forces also shifts in a continuous manner as speed increases. Each vertical slice of the frequency axis at a particular
101 91 time corresponds to a machine FFT at a particular machine speed. The red region corresponds to the maximums of these FFTs. JTFA results from a planetary gear with every third tooth damaged are shown in figure 46 and illustrate significantly different vibration signals from figure 45. Due to the nonlinearity caused by the interaction of the damaged teeth and different backlash, large impacts between the gear teeth trigger larger dynamics contact forces at some modulated frequencies. It is notable that more red regions corresponding to higher maximum forces of these FFTs appear, as time passes. The change in the force spectrum is not the simple downward continuous trend that appears in figure 45 (b).


102 92 (a). 3D JTFA Plot (b). 2D Time-frequency Plot Figure 46: JTFA plots for a rigid planetary gear model with every third tooth damaged on sun and with exponential step torque applied on the sun The dynamic responses in figures 47 and 48 are measured from the contact forces between the sun and the first-stage planets. When adding in flexibility to the shaft, the results produce a similar pattern. In figure 47, the peak forces increase in a simple continuous manner with torque and the spectrum of the peak forces shifts in a continuous manner as speed increases like the rigid model. But with the flexible shaft, there is some modulation and which makes the shifts in the peaks not as smooth as the rigid models. It can also be seen that the peaks are lower than
. 3D JTFA Plot (b).")
103 93 the rigid model and around 2000Hz, the peaks have dropped significantly. This implies that the flexible shaft in the model is actually dissipating energy, which is true for a real system. (a). 3D JTFA Plot (b). 2D Time-frequency Plot Figure 47: JTFA plots for perfect planetary gear model with a flexible shaft and exponential step torque applied on sun


104 94 (a). 3D JTFA Plot (b). 2D Time-frequency Plot Figure 48: JTFA plots for a planetary gear model with every third tooth damaged on sun, flexible shaft and with exponential step torque applied on the sun In figure 48, the plots are similar to figure 46. Again, flexibility of the shaft shows in the JTFA as the magnitude of the peaks is lower than the rigid model. The continuous trend of the peaks is slightly visible at the lower frequencies, but quickly disappears as the frequency increases. The change in the force spectrum is like figure 46, where there are many small peaks cause by the nonlinearity caused by the interaction of the damaged teeth.
105 Conclusion Unlike fixed-axis gears, vibration signatures of planetary gears are very difficult to capture because they are closely related to the structure and damaged - tooth locations. As a result, theoretical models are almost impossible to accurately simulate the complicated nonlinear dynamics of the damaged planetary gears. In order to get meaningful results, a practical two-stage planetary gear is precisely designed and analyzed by multi-body dynamics software in this paper. The results were first verified by reproducing published results done previously by Kuang and Yang [16]. Several important parameters such as the stiffness, force exponent, penetration depth, and damping coefficients are carefully chosen based on engineering modeling experience. Constraints, bearing resistant torques, and some key parameters are applied as closely as possible to real operating conditions. Comprehensive frequency-domain analysis of dynamic contact forces reveal unique vibration spectra at distinct frequencies around both the first-stage and the second-stage gear mesh frequencies, and their super- and sub- harmonics called modulated sidebands. Those frequency spectral lines establish a substantial portion of the vibration and are closely related to the complicated nonlinear
106 96 dynamics induced by the interaction between backlash and damaged teeth at different locations on different components of the planetary gears. In addition, JTFA is applied to both perfect and damaged planetary gear sets during the transient start-up conditions. The JTFA plots are shown to be especially useful during transient conditions whereby the force spectrum trends distinctly indicate damaged teeth.
107 97 7. CONCLUSIONS Non-linear contact analysis performed on two different gear sets provided results that closely resembled those from the AGMA stress equations. Using Chun Hong s gear model and Dr. Meagher s theoretical model provided a standard for how to obtain gear mesh stiffness, which was then translated to the planetary gear set s ring and planet s internal external gear mesh. There may be some discrepancies between theory and FEA simulations as theory modeled gear teeth as a rectangle and in FEA gears were modeled with a rigid Reference point coupled to the shaft bore surface. SER showed to be a very plausible method for measuring gear damaged as undamaged systems were around 1 or less and damaged systems were all well over. The experimental results show that the locations of the accelerometers are important in health monitoring of the gearing system as the accelerometer right above the gears had a very consistent SER measurement. Using FFT on the contact forces, dominant spectral lines are prominent at the fundamental gear mesh frequency and its super-harmonics. For all ADAMS models, the only type of damage on the gears was pitting. When simulations on root damaged gears were performed, the results were the same as a
108 98 perfect gear system. This is due to the fact that the gears are rigid bodies in ADAMS. This makes root cracks in gears meaningless as the gear teeth cannot deform. Root damages were not thoroughly investigated. Vibration signatures of planetary gears are very different from those of fixed axis gears due to the fact that they are closely related to the structure and damagedtooth locations. For damaged systems FFT analysis produced frequency spectral lines that reveal unique vibration spectra at distinct frequencies around both the first-stage and the second-stage gear mesh frequencies, and their super- and subharmonics. With a JTFA, transient start-up conditions present force spectrum trends distinctly indicate damaged teeth.
109 99 REFERENCES 1. Baydar, N.; Ball, A. Detection of Gear Failures via Vibration and Acoustic Signals Using Wavelet Transform Mechanical Systems and Signal Processing Kong, D., Meagher, J., Xu, C., Wu, X., Wu, Y., Nonlinear Contact Analysis of Gear Teeth for Malfunction Diagnostics, IMAC XXVI a Conference on Structural Dynamics, Society for Experimental Mechanics, Orlando, Florida USA, February 4 7, Sommer, A., Meagher, J., Wu, X., Gear Defect Modeling of a Multiple -Stage Gear Train, Modeling and Simulation in Engineering, Volume 2011 (2011), Article ID Wang; McFadden. Early detection of gear failure by vibration analysis i. calculation of the time-frequency distribution Mechanical Systems and Signal Processing Hanna, J.; Hatch, C.; Kalb, M.; Weiss, A.; Luo, H. Detection of W ind Turbine Gear Tooth Defects Using Sideband Energy Ratio. China Wind Power 2011;October, 19-21, 2011, Beijing, China Hatch, C.; Hess, D.; Weiss, A.; Woodson, S.; Kalb, M. Sideband Energy Ratio Method for Gear Mesh Fault Detection patent US ; MSC Inc., MSC ADAMS reference manual 8. Özgüven H.N. and Houser D.R., Mathematical Models used in Gear Dynamics A Review, Journal of Sound and Vibration, 121(3), 1988, pp Parey, A. and Tandon, N., Spur Gear Dynamic Models Including Defects: A Review, The Shock and Vibration Digest, Vol. 35, No. 6, Nov. 2003; pp Parey, M. El Badaoui, F. Guillet, N. Tandon, Dynamic modeling of spur gear pair and application of empirical mode decomposition-based statistical analysis for early detection of localized tooth defect, Journal of Sound and Vibration Vol. 294, 2006, pp J. Lin and R. G. Parker, Parametric Instability of Planetary Gears under Mesh Stiffness Variation, Journal of Sound and Vibration, 2002, vol. 249, pp J. Lin and R. G. Parker, Analytical Characterization of the Unique Properties of Planetary Gear Free Vibration, ASME Journal of Vibration and Acoustics, vol. 121, July 1999, pp Yi Guo and R. G. Parker, Dynamic Modeling and Analysis of a Spur Planetary Gear Involving Tooth Wedging and Bearing Clearance Nonlinearity, European Journal of Mechanics A/Solids, 2010, vol. 29, pp R. G. Parker and X. Wu, Vibration Modes of Planetary Gears with Unequally Spaced Planets and an Elastic Ring Gear, Journal of Sound and Vibration, 2010, vol. 329, pp
110 Yichao Guo and R. G. Parker, Purely Rotational Model and Vibration Modes of Compound Planetary Gears, Mechanism and Machine Theory, 2010, vol. 45, pp Raymond J. Drago, Fundamentals of Gear Design, Huamin Li, Guixian Li, Gear Mechanism Design and Application, 2007 (in Chinese) 18. Zengang Rao, Planetary Gear Transmission Design, 2003 (in Chinese) 19. Wu, X., Meagher, J., Sommer, A., A Differential Planetary Gear Model with Backlash and Teeth Damage, IMAC XXIX a Conference and Exposition on Structural Dynamics, Society for Experimental Mechanics, Jacksonville, Florida USA, Jan. 31 Feb. 3, Kuang, J. H., and Yang, Y.T., "An Estimate of Mesh Stiffness and Load Sharing Ratio of A Spur Gear Pair," in Proceedings of the ASME 12th International Power Transmission and Gearing Conference, Scottsdale, Arizona, DE-43, 1-10, Maitra G., Handbook of Gear Design, McGraw-Hill, Meagher, J., Wu, X., Kong, D., Lee, C.H., A Comparison of Gear Mesh Stiffness Modeling Strategies, IMAC XXVIII a Conference on Structural Dynamics, Society for Experimental Mechanics, Jacksonville, Florida USA, February 1 4, Inalpolat M., Kahraman A., A Theoretical and Experimental Investigation of Modulation Sidebands of Planetary Gear Sets Journal of Sound and Vibration (2009), January 2009, vol. 323: pp Shigley J., Budynas R, Nisbett J., Shigley's Mechanical Engineering Design, McGraw-Hill, Lee C. H., (2009). Non-linear Contact Analysis of Meshing Gear. Master s Thesis. California Polytechnic State University, San Luis Obispo. USA.
111 101 APPENDICES A. Contact Ratio Matlab Code %Contact Ratio Calculator %Brian Fang %8/26/13 % Mesh Type % 1. Spur Gear Pair (Metric) % 2. External and Internal Spur Gear Pair (Metric) meshtype = 1; m = 3; % module (mm), or (1/Pd) z_1 = 50; % number of gear teeth on pinion or external spur z_2 = 50; % number of gear teeth on gear or internal spur adeg = 20; % pressure angle on pitch circle (deg) hstar=1; % addendum coeff, a constant number for standard gears. cstar=0.5; % clearance coeff, a constant number for standard gears. a=adeg*pi/180; % pressure angle on pitch circle (rad) d_1=m*z_1 ; % diameter of pitch circle of pinion r_a1=((z_1+2*hstar)*m)/2; %radius of addendum circle of pinion r_b1=(d_1*cos(a))/2; % radius of base circle of pinion d_2=m*z_2; % diameter of pitch circle of gear r_a2=((z_2+2*hstar)*m)/2; % radius of addendum circle of gear r_b2=(d_2*cos(a))/2; % radius of base circle of gear r_d2=((z_2-2*hstar-2*cstar)*m)/2; % radius of dedendum circle
112 102 if(meshtype ==1) CenDist = d_1/2+d_2/2; % center distance mc = (sqrt(r_a1^2-r_b1^2)+sqrt(r_a2^2-r_b2^2)- CenDist*sin(a))/(pi*m*cos(a)) %contact ratio elseif(meshtype ==2) CenDist =(d_2/2)-(d_1/2); % center distance mc = (sqrt(r_a1^2-r_b1^2)-sqrt(r_d2^2- r_b2^2)+cendist*sin(a))/(pi*m*cos(a)) %contact ratio end
113 103 B. Involute Profile for Spur Gears MatLab Code % INVOLUTE PROFILE % written by Xi Wu; modified by Andrew Sommer % DESCRIPTION: Gear parameters are specified, involute profile coordinates % are sent to a tab delineated text file. clear all; close all; clc; % Input parameters for Standard Involute Gear % diametral pitch Pd = 1/m for English units. %%%%%%%%%%%%%%%%%%%%%%%%%%%%%%%%%%%%% m = 3; % module (mm), or (1/Pd) z = 50; % number of gear teeth adeg = 20; anglerad = pi/5; % pressure angle on pitch circle (deg) % This angle (rad) will determine % the length of the involute profile detaa = 0.01; % Angular incremental step determines the number % of points on involute profile. %%%%%%%%%%%%%%%%%%%%%%%%%%%%%%%%%%%%% % Calculate parameters from above inputs %%%%%%%%%%%%%%%%%%%%%% hstar=1; % addendum coeff, a constant number for standard gears. cstar=0.25; % clearance coeff, a constant number for standard gears. a=adeg*pi/180; % pressure angle on pitch circle (rad) d=m*z; da=(z+2*hstar)*m; dd=(z-2*hstar-2*cstar)*m; db=d*cos(a); s=pi*m/2; % diameter of pitch circle (mm) % diameter of addendum circle (mm) % diameter of dedendum circle (mm) % diameter of base circle (mm) % tooth thickness on pitch circle (mm) % Calculate the gear involute profile alpha=0:detaa:anglerad; % pressure angles at different locations on profile (rad) u=tan(alpha); x=db*sin(u)/2 - db*u.*cos(u)/2; % invulte profile equations y=db*cos(u)/2 + db*u.*sin(u)/2; % Write coordinates to a text file gearco=[x' y' zeros(length(x),1)]; % save coordinates of the points on involute profile % in matrix format (xi,yi,zi). zi = 0 save INPUTg.txt gearco -ASCII % save gearco as text file % Calculate half angle of external tooth thickness on base circle (default rot. dir. CCW) sb_o = cos(a)*(s+m*z*(tan(a)-a)); % external tooth thickness on base circle
114 104 AngB_O = (sb_o/db)*180/pi; thickness on base circle (deg) CCW % half angle of external tooth % Calculate half angle of internal tooth thickness on base circle (default rot. dir. CW) sb_i = cos(a)*(s-m*z*(tan(a)-a)); % internal tooth thickness on base circle AngB_I = (sb_i/db)*180/pi; % half angle of tooth thickness on base circle (deg) CW % Print important parameters for CAD software Rd = dd/2; % Radius of dedendum circle (mm) fprintf('\nrd = %f\n', Rd); Ra = da/2; % Radius of addendum circle (mm) fprintf('ra = %f\n', Ra); Rb = db/2; % Radius of base circle (mm) fprintf('rb = %f\n', Rb); Rp = d/2; % Radius of pitch circle (mm) fprintf('rp = %f\n', Rp); fprintf('\n fprintf(' rot_ext = %f CCW\n', AngB_O); rot_int = %f CW\n\n', AngB_I); %%%%%%%%%%%%%%%%%%%%%%%%%%%%%%%%%%%%%%%%%%%%%%%%%%%%%%%%%% % plot involute profile and gear circles figure(1); plot(x,y,'r*',x,y,'b-') % involute profile hold on rr = 0:0.001:2*pi; xxa = (da/2)*cos(rr); yya = (da/2)*sin(rr); plot(xxa,yya,'k-.') xxp = (d/2)*cos(rr); yyp = (d/2)*sin(rr); plot(xxp,yyp,'m-.') xxr = (dd/2)*cos(rr); yyr = (dd/2)*sin(rr); plot(xxr,yyr,'b-.') xxb = (db/2)*cos(rr); yyb = (db/2)*sin(rr); plot(xxb,yyb,'g-.') hold off axis equal % addendum circle % pitch circle % dedendum circle % base circle
115 105 C. QuasiStatic Finite Element Analysis Tutorial Original by Chun Hong Lee Modified by Brian Fang Step 1: In Solidworks. Create a new part. File New Part Step 2: Create Gear. Step 3: Copy the outline of the gear and paste it in a new Solidworks part. So that the part is just a sketch. Step 4: Save sketch in STEP file format. File Save As type: STEP (*.stp) Options button, choose these settings Step 5: File Import Sketch. Select the pinion sketch, click OK. Error message will appear. Choose dismiss. This error is irrelevant, the sketch has imported correctly.
116 106 Step 6: Using same process import the gear sketch into the model. Step 7: Create a Part 2D Planar, Deformable, Shell. Name: Pinion. Approximate size: 200. Step 8: Click add sketch icon. Click OK.
117 107 Step 9: Double click Materials in the model tree. Name: Steel. General Density, enter 7.85E-03. Mechanical Elasticity Elastic: Young Modulus: 207e3, Poisson s Ratio: 0.3. OK. Step 10: Double click Sections in the model tree. Name: Steel Section, Solid, Homogeneous Continue Plane stress/strain thickness: 10 OK. Step 11: Assign Steel Section to both Pinion and Gear using the Assign Section icon,. Step 12: Double click Assembly in the model tree. Double click Instances. Select all the parts using Shift or Ctrl key, toggle on the Auto-offset box OK. Step 13: Main Manual Bar Instance Translate. Select pinion Done. Select Gear center point as start point. Type in (0, -a) as end point OK. a is the center distance of the pinion and gear.
118 108 Step 14 (optional): Main Manual Bar Instance Rotate. Select Gear Done. Select Gear center point Angle of rotation: 180 enter. Step 15 (optional): Main Manual Bar Instance Rotate. Select Pinion Done. Select Pinion center point Angle of rotation: 180 enter. Step 16: Module Interactions and click Reference Point (RP) Select the center of the pinion. Step 17: Module Interactions and click Reference Point (RP) Select the center of the gear. Step 18: Create a Static, General step, Name: Step-1. Incrimination tap Maximum number of increments: 1000 Initial: 1 Minimum: 1E-0015 Maximum: 1. Go to Basic tab and turn on Nlgeom on
119 Step 19: Double click Interactions in the model tree. Name: Teeth Contact Surface-to-surface contact (Standard) Continue. Select Pinion-Surface as master surface by angle and selecting the tooth profile Continue. Do the same for the Gear. Select Gear-Surface as slave surface Continue. Change Discretization Method to Node to surface. Select specify tolerance for adjustment zone and set the tolerance to.0011in or.04mm. 109

120 Step 20: Click Create at the lower right hand corner Name: Contact Property Contact Continue. Select Mechanical Tangential Behavior Friction formulation: Penalty Friction Coeff: 0.3. Select Mechanical Normal Behavior Pressure-Overclosure: Hard Contact OK OK in the Edit Interaction Toolbox. 110
121 Step 21: Double click Constraints in the model tree. Name: Coupling-1 select Coupling Continue. Select RP-1 as control point Select surface and select the pinion bore Continue. Coupling type: Kinematic Toggle on U1, U2, UR3 OK. 111
122 112 Step 22: Double click Constraints in the model tree. Name: Coupling-2 select Coupling Continue. Select RP-2 as control point select gear bore as surface Continue. Coupling type: Kinematic Toggle on U1, U2, UR3 OK. Step 23: Double click Loads in the model tree. Name: Moment Mechanical Moment Continue. Step 24: Select RP-1 as the point of applied load CM3: OK. Step 25: Create a boundary condition in Initial step. Mechanical Displacement/Rotation Continue. Select RP-1 Done Toggle on U1 and U2 OK.

123 Step 26: Create a boundary condition in Initial step. Mechanical Displacement/Rotation Continue. Select RP-2 Done Toggle on U1, U2, and UR3 OK. 113
124 114 Step 27: Main Manual Bar Mesh Controls. Select Tri Select Free Toggle on Advancing front and check the box below. Go Gear first. Then Pinion Step 28: Main Manual Bar Element Type. Select Standard Select Quadratic Select Plane Stress or Plane Strain. The element type will be CPS6M.
125 115 Step 29: Main Manual Bar Mesh Part Yes. Step 30: Make sure you have mesh both the Pinion and the Gear. Step 31: Create a job and submit for analysis.
126 116 D. Implicit Finite Element Analysis Tutorial Original by Chun Hong Lee Modified by Brian Fang Step 1: In Solidworks. Create a new part. File New Part Step 2: Create Gear. Step 3: Copy the outline of the gear and paste it in a new Solidworks part. So that the part is just a sketch. Step 4: Save sketch in STEP file format. File Save As type: STEP (*.stp) Options button, choose these settings Step 5: File Import Sketch. Select the pinion sketch, click OK. Error message will appear. Choose dismiss. This error is irrelevant, the sketch has imported correctly.


127 117 Step 6: Using same process import the gear sketch into the model. Step 7: Create a Part 2D Planar, Deformable, Shell. Name: Pinion. Approximate size: 200. Step 8: Click add sketch icon. Click OK.
128 118 Step 9: Double click Materials in the model tree. Name: Steel. General Density, enter 7.85E-09. Mechanical Elasticity Elastic: Young Modulus: , Poisson s Ratio: 0.3. OK. Step 10: Double click Sections in the model tree. Name: Steel Section, Solid, Homogeneous Continue Plane stress/strain thickness: 10 OK. Step 11: Assign Steel Section to both Pinion and Gear using the Assign Section icon,. Step 12: Double click Assembly in the model tree. Double click Instances. Select all the parts using Shift or Ctrl key, toggle on the Auto-offset box OK. Step 13: Main Manual Bar Instance Translate. Select pinion Done. Select Gear center point as start point. Type in (0, -a) as end point OK. a is the center distance of the pinion and gear.
129 119 Step 14: Main Manual Bar Instance Rotate. Select Gear Done. Select Gear center point Angle of rotation: 180 enter. Step 15: Main Manual Bar Instance Rotate. Select Pinion Done. Select Pinion center point Angle of rotation: 180 enter. Step 16: Module Interactions and click Reference Point (RP) Select the center of the pinion. Step 17: Module Interactions and click Reference Point (RP) Select the center of the gear. Step 18: Create a Static, General step, Name: Step-1. Incrimination tap Maximum number of increments: 1000 Initial: 1 Minimum: 1E-0015 Maximum: 1. Go to Basic tab and turn on Nlgeom on

130 120 Step 19: Double click Interactions in the model tree. Name: Teeth Contact Surface-to-surface contact (Standard) Continue. Select Pinion-Surface as master surface by angle and selecting the tooth profile Continue. Do the same for the Gear. Select Gear-Surface as slave surface Continue. Change Discretization Method to Node to surface. Select specify tolerance for adjustment zone and set the tolerance to.0011in or.04mm. Step 20: Click Create at the lower right hand corner Name: Contact Property Contact Continue. Select Mechanical Tangential Behavior Friction formulation: Penalty Friction Coeff: 0.3. Select Mechanical Normal Behavior Pressure-Overclosure: Hard Contact OK OK in the Edit Interaction Toolbox.


131 Step 21: Double click Constraints in the model tree. Name: Coupling-1 select Coupling Continue. Select RP-1 as control point Select surface and select the pinion bore Continue. Coupling type: Kinematic Toggle on U1, U2, UR3 OK. 121

132 122 Step 22: Double click Constraints in the model tree. Name: Coupling-2 select Coupling Continue. Select RP-2 as control point select gear bore as surface Continue. Coupling type: Kinematic Toggle on U1, U2, UR3 OK. Step 23: Double click Loads in the model tree. Name: Moment Mechanical Moment Continue. Step 24: Select RP-1 as the point of applied load CM3: OK. Step 25: Add a Resistance torque by creating a load for RP-2, select RP-2 as the point of applied load CM3: OK. Step 26: Create a boundary condition in Initial step. Mechanical Displacement/Rotation Continue. Select RP-1 Done Toggle on U1 and U2 OK.
133 Step 27: Create a boundary condition in Initial step. Mechanical Displacement/Rotation Continue. Select RP-2 Done Toggle on U1 and U2 OK. This will allow for both gears to rotate 123


134 124 Step 28: Create a boundary condition in STEP1. Mechanical Velocity/Angular Velocity Continue. Select RP-1 Done Toggle on VR3 and set an angular velocity OK. Step 29: Main Manual Bar Mesh Controls. Select Tri Select Free Toggle on Advancing front and check the box below.
135 125 Go Gear first. Then Pinion Step 30: Main Manual Bar Element Type. Select Standard Select Quadratic Select Plane Stress or Plane Strain. The element type will be CPS6M. Step 31: Main Manual Bar Mesh Part Yes. Step 32: Make sure you have mesh both the Pinion and the Gear. Step 33: Create a job and submit for analysis.

136 126 E. MSC ADAMS ViewFlex and Bearing Tutorial Save assembly as type parasolid (*.x_t).


137 127 Open Adams View and create a new model. This step must be done before importing model. At the command prompt, enter the command: defaults geometry display_tolerance_scale = 0.01 For English units the desired tolerance is

138 Import the parasolid assembly. 128


139 129 Assign material properties by modifying body. Double clicking the part will bring you to this menu

140 130 Create dummy parts. Select the sphere for simplicity and select a radius of 1. This will make a small sphere. Place these dummy parts at the center of mass of the bushing or bearing.


141 131 Create a dummy material. To get to create a material, under the tools menu, select dialog box and display. In the selection menu, select material_createmod. We use a small density as it will make the spheres practically negligible in the simulation. Then set the material of the dummy spheres to the dummy material.
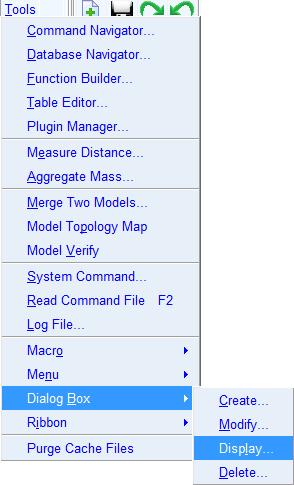
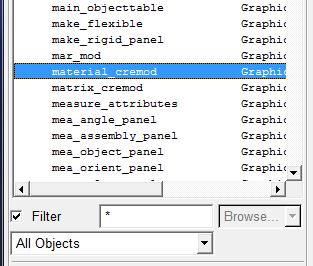
142 132


143 133 Make connections. Use lock joint to lock the dummy spheres and gears to the shaft. This will allow Adams to find attachment points when running ViewFlex. Now to change a rigid body to a flexible body with ViewFlex, select the part and click the rigid to flexible icon and select create new.
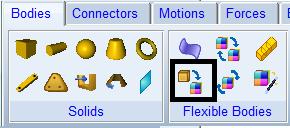
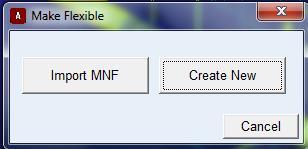
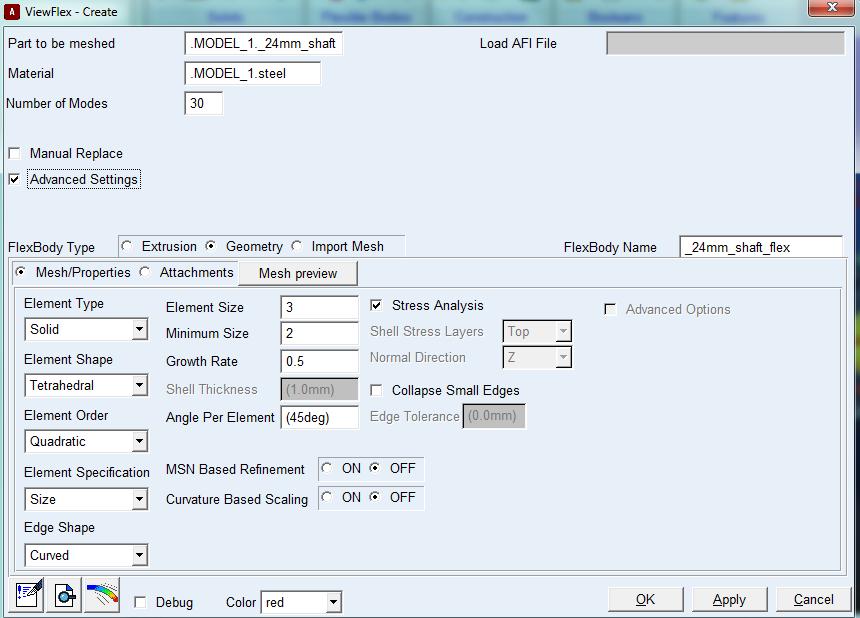
144 134
.")
145 135 Do not select manual replace. Selecting this feature means you have to manual switch every connection from the rigid body to the flexible body or else the simulation will be wrong. Not selecting, Adams will automatically do it for you. Next click the attachments right next to the Mesh preview button. Click the find attachments to have Adams locate the attachment points (1). Then go through each of the attachment points and attach slave nodes (2). There are a few selection types and these different selection types are ways to distribute that force within the contact section. For simplicity we will select closest nodes, choose 10 nodes then click transfer IDs. Create contacts:


146 136 Solid to solid contact Flexible body to Solid contact Add Revolute Joints to the flexible shafts and impose a general motion. For the function 62.83*time is equivalent to 3600d*time. If a number is typed in it is seen as a radians, if a d is added at the end, Adams sees it as degrees.

147 Run the simulation for 1 sec and 2000 steps. 137

148 138 In the Post processor, to load the animation, go to the drop down list on the upper left hand corner and change from plotting to animation. It will also be meaningful to do split screen so it is possible to plot the force plots. In the animation plot, it is possible to see the stresses by using the ADAMs Durability plugin. With that plugin on, go to the contour plots tab and contour plot type, there is a list of properties that can be viewed.

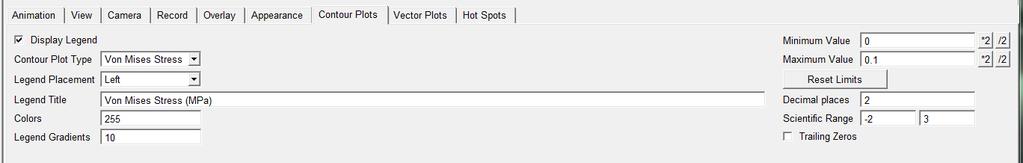
149 139

150 140 Using Bearings in MSC.Adams For this model, we need to first deactivate the bushings we created in the SolidWorks model.


151 141 The bushing will be replaced by bearings from Machinery. Click the bearing in the Machinery Tab. Selected Detailed for the Method and select a type of bearing. Different bearings have different ranges for bore size. For this tutorial, go with the first type, Deep Grove Ball Bearing Single Row. The max bore size for this bearing is 20mm.
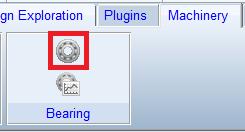
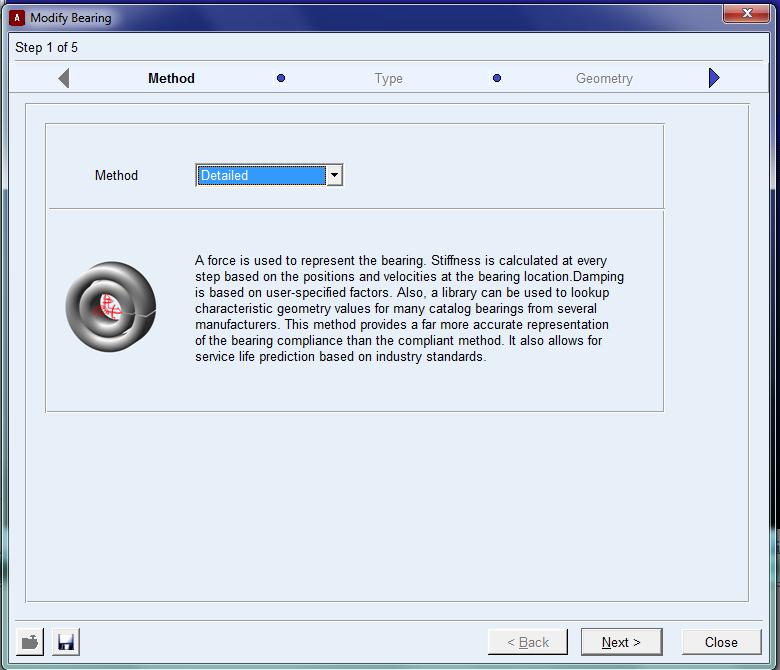
152 142

153 143 For bearing location, select the center of mass marker of one of the bushings. Make sure that the axis of rotation is also correct. In diameter simply type in the bore diameter and a list of bearings with that bore diameter will appear. From there a specific bearing can be chosen. For the first 12mm bushing, Select the bushing cm. Make the axis of rotation Global X, and input 12 for the bore size.

154 144 Continue to the next setup. Since in ADAMS MACHINERY the parts can only connect to rigid bodies. For the Shaft, select the dummy part on the 12mm shaft. In the model there is no housing so for Housing select ground. Finish and the bearing will show up in the model. Bearings of different bore sizes will look exactly the same in the model. The size of the bearing can be changed by changing the Bearing Geometry Scaling, which is right of the Bearing Location.
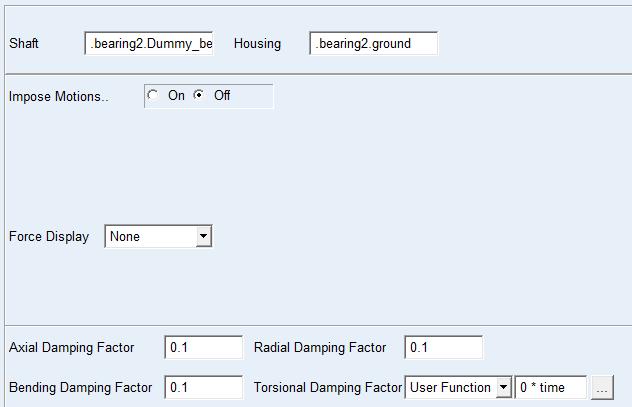
155 145
ANALYSIS OF SURFACE CONTACT STRESS FOR A SPUR GEAR OF MATERIAL STEEL 15NI2CR1MO28
 ANALYSIS OF SURFACE CONTACT STRESS FOR A SPUR GEAR OF MATERIAL STEEL 15NI2CR1MO28 D. S. Balaji, S. Prabhakaran and J. Harish Kumar Department of Mechanical Engineering, Chennai, India E-Mail: balajimailer@gmail.com
Chapter 7: Thermal Study of Transmission Gearbox
 Chapter 7: Thermal Study of Transmission Gearbox 7.1 Introduction The main objective of this chapter is to investigate the performance of automobile transmission gearbox under the influence of load, rotational
CHAPTER 5 PREVENTION OF TOOTH DAMAGE IN HELICAL GEAR BY PROFILE MODIFICATION
 90 CHAPTER 5 PREVENTION OF TOOTH DAMAGE IN HELICAL GEAR BY PROFILE MODIFICATION 5.1 INTRODUCTION In any gear drive the absolute and the relative transmission error variations normally increases with an
MODELING SUSPENSION DAMPER MODULES USING LS-DYNA
 MODELING SUSPENSION DAMPER MODULES USING LS-DYNA Jason J. Tao Delphi Automotive Systems Energy & Chassis Systems Division 435 Cincinnati Street Dayton, OH 4548 Telephone: (937) 455-6298 E-mail: Jason.J.Tao@Delphiauto.com
ANALYSIS OF GEAR QUALITY CRITERIA AND PERFORMANCE OF CURVED FACE WIDTH SPUR GEARS
 8 FASCICLE VIII, 8 (XIV), ISSN 11-459 Paper presented at Bucharest, Romania ANALYSIS OF GEAR QUALITY CRITERIA AND PERFORMANCE OF CURVED FACE WIDTH SPUR GEARS Laurentia ANDREI 1), Gabriel ANDREI 1) T, Douglas
Gear Tooth Geometry - This is determined primarily by pitch, depth and pressure angle
 Gear Tooth Geometry - This is determined primarily by pitch, depth and pressure angle Addendum: The radial distance between the top land and the pitch circle. Addendum Circle: The circle defining the outer
Design of Helical Gear and Analysis on Gear Tooth
 Design of Helical Gear and Analysis on Gear Tooth Indrale Ratnadeep Ramesh Rao M.Tech Student ABSTRACT Gears are mainly used to transmit the power in mechanical power transmission systems. These gears
Introduction. Kinematics and Dynamics of Machines. Involute profile. 7. Gears
 Introduction The kinematic function of gears is to transfer rotational motion from one shaft to another Kinematics and Dynamics of Machines 7. Gears Since these shafts may be parallel, perpendicular, or
Static And Modal Analysis of Tractor Power Take Off (PTO) Gearbox Housing
 Gearbox Housing") Static And Modal Analysis of Tractor Power Take Off (PTO) Gearbox Housing Gopali S Lamani 1, Prof: S.R.Basavaraddi 2, Assistant Professor, Department of Mechanical Engineering, JSPM NTC RSSOER,India1 Professor,
Static And Modal Analysis of Tractor Power Take Off (PTO) Gearbox Housing Gopali S Lamani 1, Prof: S.R.Basavaraddi 2, Assistant Professor, Department of Mechanical Engineering, JSPM NTC RSSOER,India1 Professor,
Experimental Analyses of Vibration and Noise of Faulted Planetary Gearbox
 Experimental Analyses of Vibration and Noise of Faulted Planetary Gearbox Zhuang Li McNeese State University, USA e-mail: zli@mcneese.edu ABSTRACT Epicyclic gear trains are widely used in various industrial
AN OPTIMAL PROFILE AND LEAD MODIFICATION IN CYLINDRICAL GEAR TOOTH BY REDUCING THE LOAD DISTRIBUTION FACTOR
 AN OPTIMAL PROFILE AND LEAD MODIFICATION IN CYLINDRICAL GEAR TOOTH BY REDUCING THE LOAD DISTRIBUTION FACTOR Balasubramanian Narayanan Department of Production Engineering, Sathyabama University, Chennai,
1874. Effect predictions of star pinion geometry phase adjustments on dynamic load sharing behaviors of differential face gear trains
 1874. Effect predictions of star pinion geometry phase adjustments on dynamic load sharing behaviors of differential face gear trains Zhengminqing Li 1, Wei Ye 2, Linlin Zhang 3, Rupeng Zhu 4 Nanjing University
Vibration Measurement and Noise Control in Planetary Gear Train
 Vibration Measurement and Noise Control in Planetary Gear Train A.R.Mokate 1, R.R.Navthar 2 P.G. Student, Department of Mechanical Engineering, PDVVP COE, A. Nagar, Maharashtra, India 1 Assistance Professor,
Analysis of Torsional Vibration in Elliptical Gears
 The The rd rd International Conference on on Design Engineering and Science, ICDES Pilsen, Czech Pilsen, Republic, Czech August Republic, September -, Analysis of Torsional Vibration in Elliptical Gears
o f Tip Relief on Transmission
 E v a l u a t i o n o f M e t h o d s f o r C a l c u l a t i n g E f f e c t s o f Tip Relief on Transmission E r r o r, N o i s e a n d S t r e s s i n L o a d e d S p u r G e a r s Dr. David Palmer
GEARING. Theory of. Stephen. Kinetics, Geometry, and Synthesis. P. Radzevich. /Ov CRC Press yc*** J Taylor& Francis Croup Boca Raton
 Theory of GEARING Kinetics, Geometry, and Synthesis Stephen P. Radzevich /Ov CRC Press yc*** J Taylor& Francis Croup Boca Raton London New York CRC Press is an imprint of the Taylor & Francis Group, an
Thermal Analysis of Helical and Spiral Gear Train
 International Journal for Ignited Minds (IJIMIINDS) Thermal Analysis of Helical and Spiral Gear Train Dr. D V Ghewade a, S S Nagarale b & A N Pandav c a Principal, Department of Mechanical, GENESIS, Top-Kolhapur,
CASE STUDY OF ASSEMBLY ERRORS INFLUENCE ON STRESS DISTRIBUTION IN SPUR GEAR TRAIN
 Proceedings of the 7th International Conference on Mechanics and Materials in Design Albufeira/Portugal 11-15 June 2017. Editors J.F. Silva Gomes and S.A. Meguid. Publ. INEGI/FEUP (2017) PAPER REF: 6564
Detection of Fault in Gear Box System using Vibration Analysis Method
 Research Article International Journal of Current Engineering and Technology E-ISSN 2277 4106, P-ISSN 2347-5161 2014 INPRESSCO, All Rights Reserved Available at http://inpressco.com/category/ijcet Detection
CH#13 Gears-General. Drive and Driven Gears 3/13/2018
 CH#13 Gears-General A toothed wheel that engages another toothed mechanism in order to change the speed or direction of transmitted motion The gear set transmits rotary motion and force. Gears are used
Analysis on natural characteristics of four-stage main transmission system in three-engine helicopter
 Article ID: 18558; Draft date: 2017-06-12 23:31 Analysis on natural characteristics of four-stage main transmission system in three-engine helicopter Yuan Chen 1, Ru-peng Zhu 2, Ye-ping Xiong 3, Guang-hu
RELIABILITY IMPROVEMENT OF ACCESSORY GEARBOX BEVEL DRIVES Kozharinov Egor* *CIAM
 RELIABILITY IMPROVEMENT OF ACCESSORY GEARBOX BEVEL DRIVES Kozharinov Egor* *CIAM egor@ciam.ru Keywords: Bevel gears, accessory drives, resonance oscillations, Coulomb friction damping Abstract Bevel gear
Study on Mechanism of Impact Noise on Steering Gear While Turning Steering Wheel in Opposite Directions
 Study on Mechanism of Impact Noise on Steering Gear While Turning Steering Wheel in Opposite Directions Jeong-Tae Kim 1 ; Jong Wha Lee 2 ; Sun Mok Lee 3 ; Taewhwi Lee 4 ; Woong-Gi Kim 5 1 Hyundai Mobis,
MODELS FOR THE DYNAMIC ANALYSIS OF THE SUSPENSION SYSTEM OF THE VEHICLES REAR AXLE
 MODELS FOR THE DYNAMIC ANALYSIS OF THE SUSPENSION SYSTEM OF THE VEHICLES REAR AXLE Alexandru Cătălin Transilvania University of Braşov, Product Design and Robotics Department, calex@unitbv.ro Keywords:
HARMONIC RESPONSE ANALYSIS OF GEARBOX
 HARMONIC RESPONSE ANALYSIS OF GEARBOX Rishav Ranjan, Sindhu Srinath and Shanmukha Nagaraj Departmental of Mechanical Engineering, RVCE, Bangalore, India E-Mail: rishav.singh94@gmail.com ABSTRACT Gearbox
Vibration Analysis of Gear Transmission System in Electric Vehicle
 Advanced Materials Research Online: 0-0- ISSN: 66-8985, Vols. 99-00, pp 89-83 doi:0.408/www.scientific.net/amr.99-00.89 0 Trans Tech Publications, Switzerland Vibration Analysis of Gear Transmission System
INCREASE IN FATIGUE LIFE OF SPUR GEAR BY INTRODUCING CIRCULAR STRESS RELIEVING FEATURE
 INTERNATIONAL JOURNAL OF MECHANICAL ENGINEERING AND International Journal of Mechanical Engineering and Technology (IJMET), ISSN 0976 6340(Print), ISSN 0976 6359(Online), Volume TECHNOLOGY 6, Issue 5,
Effect of Geometry Factor I & J Factor Multipliers in the performance of Helical Gears
 Effect of Geometry Factor I & J Factor Multipliers in the performance of Helical Gears 1 Amit D. Modi, 2 Manan B. Raval, 1 Lecturer, 2 Lecturer, 1 Department of Mechanical Engineering, 2 Department of
CHAPTER 6 MECHANICAL SHOCK TESTS ON DIP-PCB ASSEMBLY
 135 CHAPTER 6 MECHANICAL SHOCK TESTS ON DIP-PCB ASSEMBLY 6.1 INTRODUCTION Shock is often defined as a rapid transfer of energy to a mechanical system, which results in a significant increase in the stress,
Estimation of Unmeasured DOF s on a Scaled Model of a Blade Structure
 Estimation of Unmeasured DOF s on a Scaled Model of a Blade Structure Anders Skafte 1, Rune Brincker 2 ABSTRACT This paper presents a new expansion technique which enables to predict mode shape coordinates
Part VII: Gear Systems: Analysis
 Part VII: Gear Systems: Analysis This section will review standard gear systems and will provide the basic tools to perform analysis on these systems. The areas covered in this section are: 1) Gears 101:
Simulating Rotary Draw Bending and Tube Hydroforming
 Abstract: Simulating Rotary Draw Bending and Tube Hydroforming Dilip K Mahanty, Narendran M. Balan Engineering Services Group, Tata Consultancy Services Tube hydroforming is currently an active area of
Customer Application Examples
 Customer Application Examples The New, Powerful Gearwheel Module 1 SIMPACK Usermeeting 2006 Baden-Baden 21. 22. March 2006 The New, Powerful Gearwheel Module L. Mauer INTEC GmbH Wessling Customer Application
 DEPARTMENT OF MECHANICAL ENGINEERING Subject code: ME6601 Subject Name: DESIGN OF TRANSMISSION SYSTEMS UNIT-I DESIGN OF TRANSMISSION SYSTEMS FOR FLEXIBLE ELEMENTS 1. What is the effect of centre distance
2. a) What is pantograph? What are its uses? b) Prove that the peaucellier mechanism generates a straight-line motion. (5M+10M)
 What is pantograph? What are its uses? b) Prove that the peaucellier mechanism generates a straight-line motion. (5M+10M)") Code No: R22032 R10 SET - 1 1. a) Define the following terms? i) Link ii) Kinematic pair iii) Degrees of freedom b) What are the inversions of double slider crank chain? Describe any two with neat sketches.
Code No: R22032 R10 SET - 1 1. a) Define the following terms? i) Link ii) Kinematic pair iii) Degrees of freedom b) What are the inversions of double slider crank chain? Describe any two with neat sketches.
Prediction of Dynamic Factors for Helical Gears in a High-Speed Multibody Gearbox System
 Prediction of Dynamic Factors for Helical Gears in a High-Speed Multibody Gearbox System Niranjan Raghuraman, Dr. Sharad Jain and Chad Glinsky [The statements and opinions contained herein are those of
Paper Number: DETC
 Proceedings of the th ASME International Power Transmission and Gearing Conference DETC20 August 28-3, 20, Washington, DC, USA Paper Number: DETC20-48494 THE DYNAMIC SIMULATION AND ANALYSIS OF A CYCLOIDAL
BENDING STRESS ANALYSIS OF SPUR GEAR BY USING MODIFIED LEWIS FORMULA
 BENDING STRESS ANALYSIS OF SPUR GEAR BY USING MODIFIED LEWIS FORMULA 1 Namrata S.Gadakh, 2 Prof. R.S. Shelke 1 P.G. Scholar Mechanical SVIT Nashik Pune University 2 Assistant Professor (Mechanical Dept.)
Reduction of Self Induced Vibration in Rotary Stirling Cycle Coolers
 Reduction of Self Induced Vibration in Rotary Stirling Cycle Coolers U. Bin-Nun FLIR Systems Inc. Boston, MA 01862 ABSTRACT Cryocooler self induced vibration is a major consideration in the design of IR
VEHICLE ANTI-ROLL BAR ANALYZED USING FEA TOOL ANSYS
 VEHICLE ANTI-ROLL BAR ANALYZED USING FEA TOOL ANSYS P. M. Bora 1, Dr. P. K. Sharma 2 1 M. Tech. Student,NIIST, Bhopal(India) 2 Professor & HOD,NIIST, Bhopal(India) ABSTRACT The aim of this paper is to
(POWER TRANSMISSION Methods)
") UNIT-5 (POWER TRANSMISSION Methods) It is a method by which you can transfer cyclic motion from one place to another or one pulley to another pulley. The ways by which we can transfer cyclic motion are:-
UNIT-5 (POWER TRANSMISSION Methods) It is a method by which you can transfer cyclic motion from one place to another or one pulley to another pulley. The ways by which we can transfer cyclic motion are:-
Influence of Cylinder Bore Volume on Pressure Pulsations in a Hermetic Reciprocating Compressor
 Purdue University Purdue e-pubs International Compressor Engineering Conference School of Mechanical Engineering 2014 Influence of Cylinder Bore Volume on Pressure Pulsations in a Hermetic Reciprocating
QATAR UNIVERSITY COLLEGE OF ENGINEERING MODEL-BASED DIAGNOSTICS OF SIMULTANEOUS TOOTH CRACKS IN SPUR GEARS AHMED SAEED ABDELFATTAH MOHAMED IBRAHIM
 QATAR UNIVERSITY COLLEGE OF ENGINEERING MODEL-BASED DIAGNOSTICS OF SIMULTANEOUS TOOTH CRACKS IN SPUR GEARS BY AHMED SAEED ABDELFATTAH MOHAMED IBRAHIM A Thesis Submitted to the Faculty of the College of
Finite element analysis of Spiral bevel gears pair used in an Automobile Differential gear box
 International Journal of Advances in Scientific Research and Engineering (ijasre) E-ISSN : 2454-8006 Vol.3, Special Issue 1 Aug - 2017 Finite element analysis of Spiral bevel gears pair used in an Automobile
Lecture (7) on. Gear Measurement. By Dr. Emad M. Saad. Industrial Engineering Dept. Faculty of Engineering. Fayoum University.
 on. Gear Measurement. By Dr. Emad M. Saad. Industrial Engineering Dept. Faculty of Engineering. Fayoum University.") 1 Lecture (7) on Gear Measurement Fayoum University By Dr. Emad M. Saad Industrial Engineering Dept. Faculty of Engineering Fayoum University Faculty of Engineering Industrial Engineering Dept. 2015-2016
1 Lecture (7) on Gear Measurement Fayoum University By Dr. Emad M. Saad Industrial Engineering Dept. Faculty of Engineering Fayoum University Faculty of Engineering Industrial Engineering Dept. 2015-2016
DAMAGE IDENTIFICATION AND VIBRATION ANALYSIS TECHNIQUE FOR GEAR BOX
 DAMAGE IDENTIFICATION AND VIBRATION ANALYSIS TECHNIQUE FOR GEAR BOX Baquer Mohiuddin 1, Dr.S.B Kivade 2, ¹Asst.Professor.Department of Mechanical Engg,BKIT, Bhalki,Dist:Bidar. Mob:8050188533 ²Principal
Analysis and control of vehicle steering wheel angular vibrations
 Analysis and control of vehicle steering wheel angular vibrations T. LANDREAU - V. GILLET Auto Chassis International Chassis Engineering Department Summary : The steering wheel vibration is analyzed through
Finite element analysis of profile modified spur gear
 Finite element analysis of profile modified spur gear Sagar Gaur Mechanical Engineering Department, Institute of Technology, YashluvVirwani Mechanical Engineering Department, Institute of Technology, Rudresh
Forced vibration frequency response for a permanent magnetic planetary gear
 Forced vibration frequency response for a permanent magnetic planetary gear Xuejun Zhu 1, Xiuhong Hao 2, Minggui Qu 3 1 Hebei Provincial Key Laboratory of Parallel Robot and Mechatronic System, Yanshan
Simple Gears and Transmission
 Simple Gears and Transmission Simple Gears and Transmission page: of 4 How can transmissions be designed so that they provide the force, speed and direction required and how efficient will the design be?
Optimization of Design Based on Tip Radius and Tooth Width to Minimize the Stresses on the Spur Gear with FE Analysis.
 Optimization of Design Based on Tip Radius and Tooth Width to Minimize the Stresses on the Spur Gear with FE Analysis. K.Ruthupavan M. Tech Sigma Consultancy Service 7-1-282/C/A/1, 104, First Floor Rajaiah
KISSsoft 03/2013 Tutorial 15
 KISSsoft 03/2013 Tutorial 15 Bevel gears KISSsoft AG Rosengartenstrasse 4 8608 Bubikon Switzerland Tel: +41 55 254 20 50 Fax: +41 55 254 20 51 info@kisssoft.ag www.kisssoft.ag Contents 1 Starting KISSsoft...
FINITE ELEMENT SIMULATION OF SHOT PEENING AND STRESS PEEN FORMING
 FINITE ELEMENT SIMULATION OF SHOT PEENING AND STRESS PEEN FORMING H.Y. Miao 1, C. Perron 1, M. Lévesque 2 1. Aerospace Manufacturing Technology Center, National Research Council Canada,5154 av. Decelles,
STRUCTURAL ANALYSIS OF SPUR GEAR USING FEM
 International Journal of Mechanical Engineering and Technology (IJMET) Volume 7, Issue 6, November December 2016, pp.01 08, Article ID: IJMET_07_06_001 Available online at http://www.iaeme.com/ijmet/issues.asp?jtype=ijmet&vtype=7&itype=6
Influential Criteria on the Optimization of a Gearbox, with Application to an Automatic Transmission
 Influential Criteria on the Optimization of a Gearbox, with Application to an Automatic Transmission Peter Tenberge, Daniel Kupka and Thomas Panéro Introduction In the design of an automatic transmission
Research on Optimization for the Piston Pin and the Piston Pin Boss
 186 The Open Mechanical Engineering Journal, 2011, 5, 186-193 Research on Optimization for the Piston Pin and the Piston Pin Boss Yanxia Wang * and Hui Gao Open Access School of Traffic and Vehicle Engineering,
Determination and improvement of bevel gear efficiency by means of loaded TCA
 Determination and improvement of bevel gear efficiency by means of loaded TCA Dr. J. Thomas, Dr. C. Wirth, ZG GmbH, Germany Abstract Bevel and hypoid gears are widely used in automotive and industrial
Transmission Error in Screw Compressor Rotors
 Purdue University Purdue e-pubs International Compressor Engineering Conference School of Mechanical Engineering 2008 Transmission Error in Screw Compressor Rotors Jack Sauls Trane Follow this and additional
Stress Analysis of a Ring gear of Planetary Gearbox
 ISSN 2395-1621 Stress Analysis of a Ring gear of Planetary Gearbox #1 Sumit Phadtare, #2 Suresh Jadhav 1 sumph10@gmail.com #12 Mechanical Engineering, Veermata Jijabai Technological Institute Mumbai, Maharashtra,
KISSsoft 03/2017 Tutorial 15
 KISSsoft 03/2017 Tutorial 15 Bevel gears KISSsoft AG Rosengartenstrasse 4 8608 Bubikon Switzerland Tel: +41 55 254 20 50 Fax: +41 55 254 20 51 info@kisssoft.ag www.kisssoft.ag Contents 1 Starting KISSsoft...
Heat treatment Elimination in Forged steel Crankshaft of Two-stage. compressor.
 Research Journal of Engineering Sciences ISSN 2278 9472 Heat treatment Elimination in Forged steel Crankshaft of Two-stage Compressor Abstract Lakshmanan N. 1, Ramachandran G.M. 1 and Saravanan K. 2 1
KINEMATICAL SUSPENSION OPTIMIZATION USING DESIGN OF EXPERIMENT METHOD
 Jurnal Mekanikal June 2014, No 37, 16-25 KINEMATICAL SUSPENSION OPTIMIZATION USING DESIGN OF EXPERIMENT METHOD Mohd Awaluddin A Rahman and Afandi Dzakaria Faculty of Mechanical Engineering, Universiti
Load Analysis and Multi Body Dynamics Analysis of Connecting Rod in Single Cylinder 4 Stroke Engine
 IJSRD - International Journal for Scientific Research & Development Vol. 3, Issue 08, 2015 ISSN (online): 2321-0613 Load Analysis and Multi Body Dynamics Analysis of Connecting Rod in Single Cylinder 4
IJSRD - International Journal for Scientific Research & Development Vol. 3, Issue 11, 2016 ISSN (online):
:") IJSRD - International Journal for Scientific Research & Development Vol. 3, Issue 11, 2016 ISSN (online): 2321-0613 Design and Analysis of Thin-Rimmed Gears using Finite Element Modelling Sachin Dholya
IJSRD - International Journal for Scientific Research & Development Vol. 3, Issue 11, 2016 ISSN (online): 2321-0613 Design and Analysis of Thin-Rimmed Gears using Finite Element Modelling Sachin Dholya
Simple Gears and Transmission
 Simple Gears and Transmission Contents How can transmissions be designed so that they provide the force, speed and direction required and how efficient will the design be? Initial Problem Statement 2 Narrative
1329. The dynamic behavior and modal analysis of electric scooter
 1329. The dynamic behavior and modal analysis of electric scooter Yunn-Lin Hwang 1, Jung-Kuang Cheng 2 1 Department of Mechanical Design Engineering, National Formosa University, Yunlin, 63201, Taiwan,
ME6401 KINEMATICS OF MACHINERY UNIT- I (Basics of Mechanism)
") ME6401 KINEMATICS OF MACHINERY UNIT- I (Basics of Mechanism) 1) Define resistant body. 2) Define Link or Element 3) Differentiate Machine and Structure 4) Define Kinematic Pair. 5) Define Kinematic Chain.
ME6401 KINEMATICS OF MACHINERY UNIT- I (Basics of Mechanism) 1) Define resistant body. 2) Define Link or Element 3) Differentiate Machine and Structure 4) Define Kinematic Pair. 5) Define Kinematic Chain.
Analysis of Switch Gear and Validation
 S. Krishna Chaitanya & M. Vimal Teja Dept. of Mechanical Engineering, Nimra College of Engineering & Technology, Ibrahimpatnam, Vijayawada E-mail: krishchaitu@gmail.com Abstract - In this paper, the main
Analysis of Eclipse Drive Train for Wind Turbine Transmission System
 ISSN 2395-1621 Analysis of Eclipse Drive Train for Wind Turbine Transmission System #1 P.A. Katre, #2 S.G. Ganiger 1 pankaj12345katre@gmail.com 2 somu.ganiger@gmail.com #1 Department of Mechanical Engineering,
1/2/2015 2:04 PM. Chapter 13. Gears General. Dr. Mohammad Suliman Abuhaiba, PE
 Chapter 13 Gears General 1 2 Chapter Outline 1. Types of Gears 2. Nomenclature 3. Conjugate Action 4. Involute Properties 5. Fundamentals 6. Contact Ratio 7. Interference 8. The Forming of Gear Teeth 9.
STRESS AND VIBRATION ANALYSIS OF A GAS TURBINE BLADE WITH A COTTAGE-ROOF FRICTION DAMPER USING FINITE ELEMENT METHOD
 STRESS AND VIBRATION ANALYSIS OF A GAS TURBINE BLADE WITH A COTTAGE-ROOF FRICTION DAMPER USING FINITE ELEMENT METHOD S. Narasimha 1* G. Venkata Rao 2 and S. Ramakrishna 1 1 Dept. of Mechanical Engineering,
12/6/2013 9:09 PM. Chapter 13. Gears General. Dr. Mohammad Suliman Abuhaiba, PE
 Chapter 13 Gears General 1 2 Chapter Outline 1. Types of Gears 2. Nomenclature 3. Conjugate Action 4. Involute Properties 5. Fundamentals 6. Contact Ratio 7. Interference 8. The Forming of Gear Teeth 9.
PREDICTION OF PISTON SLAP OF IC ENGINE USING FEA BY VARYING GAS PRESSURE
 PREDICTION OF PISTON SLAP OF IC ENGINE USING FEA BY VARYING GAS PRESSURE V. S. Konnur Department of Mechanical Engineering, BLDEA s Engineering College, Bijapur, Karnataka, (India) ABSTRACT The automotive
Chapter 8 Kinematics of Gears
 Chapter 8 Kinematics of Gears Gears! Gears are most often used in transmissions to convert an electric motor s high speed and low torque to a shaft s requirements for low speed high torque: Speed is easy
Contact Analysis of a Helical Gear with Involute Profile
 Contact Analysis of a Helical Gear with Involute Profile J. Satish M. Tech (CAD/CAM) Nova College of Engineering and Technology, Jangareddigudem. ABSTRACT Gears are toothed wheels designed to transmit
Chapter 7. Shafts and Shaft Components
 Chapter 7 Shafts and Shaft Components 2 Chapter Outline Introduction Shaft Materials Shaft Layout Shaft Design for Stress Deflection Considerations Critical Speeds for Shafts Miscellaneous Shaft Components
Analysis of Spur Gear Box Using Software tool Ansys
 Analysis of Spur Gear Box Using Software tool Ansys K.G.Patel D.N.Patel College of Engineering, Shahada (Maharashtra) S.U.Patil D.N.Patel College of Engineering, Shahada (Maharashtra) H.G.Patil D.N.Patel
Finite Element Modeling and Analysis of Vehicle Space Frame with Experimental Validation
 Finite Element Modeling and Analysis of Vehicle Space Frame with Experimental Validation Assoc. Prof Dr. Mohammed A.Elhaddad Mechanical Engineering Department Higher Technological Institute, Town of 6
Abaqus Technology Brief. Automobile Roof Crush Analysis with Abaqus
 Abaqus Technology Brief Automobile Roof Crush Analysis with Abaqus TB-06-RCA-1 Revised: April 2007. Summary The National Highway Traffic Safety Administration (NHTSA) mandates the use of certain test procedures
EDDY CURRENT DAMPER SIMULATION AND MODELING. Scott Starin, Jeff Neumeister
 EDDY CURRENT DAMPER SIMULATION AND MODELING Scott Starin, Jeff Neumeister CDA InterCorp 450 Goolsby Boulevard, Deerfield, Florida 33442-3019, USA Telephone: (+001) 954.698.6000 / Fax: (+001) 954.698.6011
Model Library Power Transmission
 Model Library Power Transmission The Power Transmission libraries in SimulationX support the efficient modeling and analysis of mechanical powertrains as well as the simulation-based design of controlled
GEAR CONTENTS POWER TRANSMISSION GEAR TYPES OF GEARS NOMENCLATURE APPLICATIONS OF GEARS VELOCITY RATIO GEAR TRAINS EXAMPLE PROBLEMS AND QUESTIONS
 GEAR CONTENTS POWER TRANSMISSION GEAR TYPES OF GEARS NOMENCLATURE APPLICATIONS OF GEARS VELOCITY RATIO GEAR TRAINS EXAMPLE PROBLEMS AND QUESTIONS GEAR.. Power transmission is the movement of energy from
Catalog Q Conversion For those wishing to ease themselves into working with metric gears
 1.3.4 Conversion For those wishing to ease themselves into working with metric gears by looking at them in terms of familiar inch gearing relationships and mathematics, Table 1-5 is offered as a means
Figure 1.1 "Bevel and hypoid gears" "Modules" Figure / August 2011 Release 03/2011
 KISSsoft Tutorial 015: Bevel Gears KISSsoft AG - +41 55 254 20 50 Uetzikon 4 - +41 55 254 20 51 8634 Hombrechtikon - info@kisssoft. AG Switzerland - www. KISSsoft. AG KISSsoft Tutorial: Bevel Gears 1 Starting
ME scope Application Note 29 FEA Model Updating of an Aluminum Plate
 ME scope Application Note 29 FEA Model Updating of an Aluminum Plate NOTE: You must have a package with the VES-4500 Multi-Reference Modal Analysis and VES-8000 FEA Model Updating options enabled to reproduce
UNIT -I. Ans: They are specified by the no. of strands & the no. of wires in each strand.
 VETRI VINAYAHA COLLEGE OF ENGINEERING AND TECHNOLOGY, THOTTIAM, NAMAKKAL-621215. DEPARTMENT OF MECHANICAL ENGINEERING SIXTH SEMESTER / III YEAR ME6601 DESIGN OF TRANSMISSION SYSTEM (Regulation-2013) UNIT
Address for Correspondence
 Research Article DESIGN AND STRUCTURAL ANALYSIS OF DIFFERENTIAL GEAR BOX AT DIFFERENT LOADS C.Veeranjaneyulu 1, U. Hari Babu 2 Address for Correspondence 1 PG Student, 2 Professor Department of Mechanical
Development of Rattle Noise Analysis Technology for Column Type Electric Power Steering Systems
 TECHNICAL REPORT Development of Rattle Noise Analysis Technology for Column Type Electric Power Steering Systems S. NISHIMURA S. ABE The backlash adjustment mechanism for reduction gears adopted in electric
Numerical check of a 2DOF transmission for wind turbines
 Numerical check of a 2DOF transmission for wind turbines Beibit Shingissov 1, Gani Balbayev 2, Shynar Kurmanalieva 3, Algazy Zhauyt 4, Zhanar Koishybayeva 5 1, 2 Almaty University of Power Engineering
BY: Paul Behnke ITT Industries, Industrial Process. Juan Gamarra Mechanical Solutions, Inc.
 DRIVE SHAFT FAILURE ANALYSIS ON A MULTISTAGE VERTICAL TURBINE PUMP IN RIVER WATER SUPPLY SERVICE IN A NICKEL AND COBALT MINE IN I MADAGASCAR -BASED ON ODS AND FEA Juan Gamarra Mechanical Solutions, Inc.
Structural Analysis of Differential Gearbox
 Structural Analysis of Differential Gearbox Daniel Das.A Seenivasan.S Assistant Professor Karthick.S Assistant Professor Abstract- The main aim of this paper is to focus on the mechanical design and analysis
Analytical impact of the sliding friction on mesh stiffness of spur gear drives based on Ishikawa model
 Analytical impact of the sliding friction on mesh stiffness of spur gear drives based on Ishikawa model Zhengminqing Li 1, Hongshang Chen 2, Jiansong Chen 3, Rupeng Zhu 4 1, 2, 4 Nanjing University of
Thermal Analysis of Shell and Tube Heat Exchanger Using Different Fin Cross Section
 Thermal Analysis of Shell and Tube Heat Exchanger Using Different Fin Cross Section J. Heeraman M.Tech -Thermal Engineering Department of Mechanical Engineering Ellenki College of Engineering & Technology
Chapter 3. Transmission Components
 Chapter 3. Transmission Components The difference between machine design and structure design An important design problem in a mechanical system is how to transmit and convert power to achieve required
ROTATING MACHINERY DYNAMICS
 Pepperdam Industrial Park Phone 800-343-0803 7261 Investment Drive Fax 843-552-4790 N. Charleston, SC 29418 www.wheeler-ind.com ROTATING MACHINERY DYNAMICS SOFTWARE MODULE LIST Fluid Film Bearings Featuring
A Method to Define Profile Modification of Spur Gear and Minimize the Transmission Error
 A Method to Define Profile Modification of Spur Gear and Minimize the Transmission Error Authors: Marco Beghini Fabio Presicce Ciro Santus Collaboration between: Mech. Dept. University of Pisa - Italy
ME6601 DESIGN OF TRANSMISSION SYSTEMS
 SYED AMMAL ENGINEERING COLLEGE (Approved by the AICTE, New Delhi, Govt. of Tamilnadu and Affiliated to Anna University, Chennai) Established in 1998 - An ISO 9001:2008 Certified Institution Dr. E.M.Abdullah
A FINITE ELEMENT APPROACH TO SPUR GEAR RESPONSE AND WEAR UNDER NON-IDEAL LOADING
 A FINITE ELEMENT APPROACH TO SPUR GEAR RESPONSE AND WEAR UNDER NON-IDEAL LOADING By KYLE C. STOKER A THESIS PRESENTED TO THE GRADUATE SCHOOL OF THE UNIVERSITY OF FLORIDA IN PARTIAL FULFILLMENT OF THE REQUIREMENTS
Estimation of Wear Depth on Normal Contact Ratio Spur Gear
 Middle-East Journal of Scientific Research 24 (S1): 38-42, 2016 ISSN 1990-9233 IDOSI Publications, 2016 DOI: 10.5829/idosi.mejsr.2016.24.S1.9 Estimation of Wear Depth on Normal Contact Ratio Spur Gear
Vehicle Dynamic Simulation Using A Non-Linear Finite Element Simulation Program (LS-DYNA)
") Vehicle Dynamic Simulation Using A Non-Linear Finite Element Simulation Program (LS-DYNA) G. S. Choi and H. K. Min Kia Motors Technical Center 3-61 INTRODUCTION The reason manufacturers invest their time
Vehicle Dynamic Simulation Using A Non-Linear Finite Element Simulation Program (LS-DYNA) G. S. Choi and H. K. Min Kia Motors Technical Center 3-61 INTRODUCTION The reason manufacturers invest their time